


Harvey Balls PowerPoint Template Diagram Slide

Harvey Balls PowerPoint Template Diagram
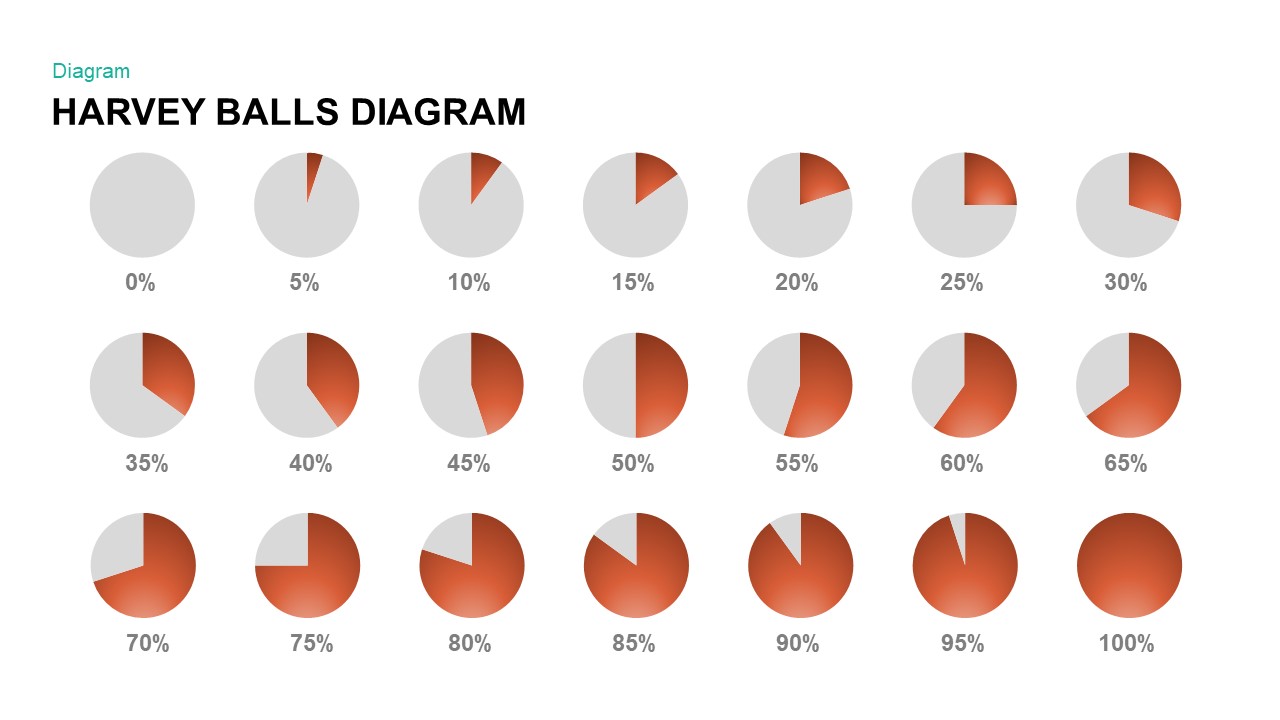
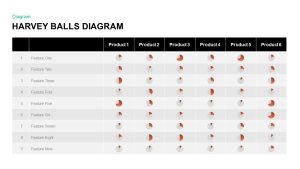
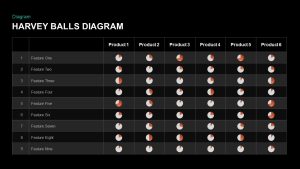
Harvey balls powerpoint template diagram is created for management professionals; they can use this template to display a complex management process and data. Explaining complex project management process in easily understandable manner can be hard and difficult. However, with the help of appropriate visuals, your message will be confidently conveyed and meet your desired target. Also, a sort of thing that charms to all! Just to do this, integrate our pre-designed PowerPoint Harvey Balls PowerPoint Template Diagram into your visuals. Professionally fabricated and completely editable set of slides will help you make your message effective. Harvey balls are circled ideograms used for visual communication. Project managers are business managers can download this diagram to present the existing status of the business and project. This Harvey balls powerpoint template is suitable for the presentation of qualitative information.
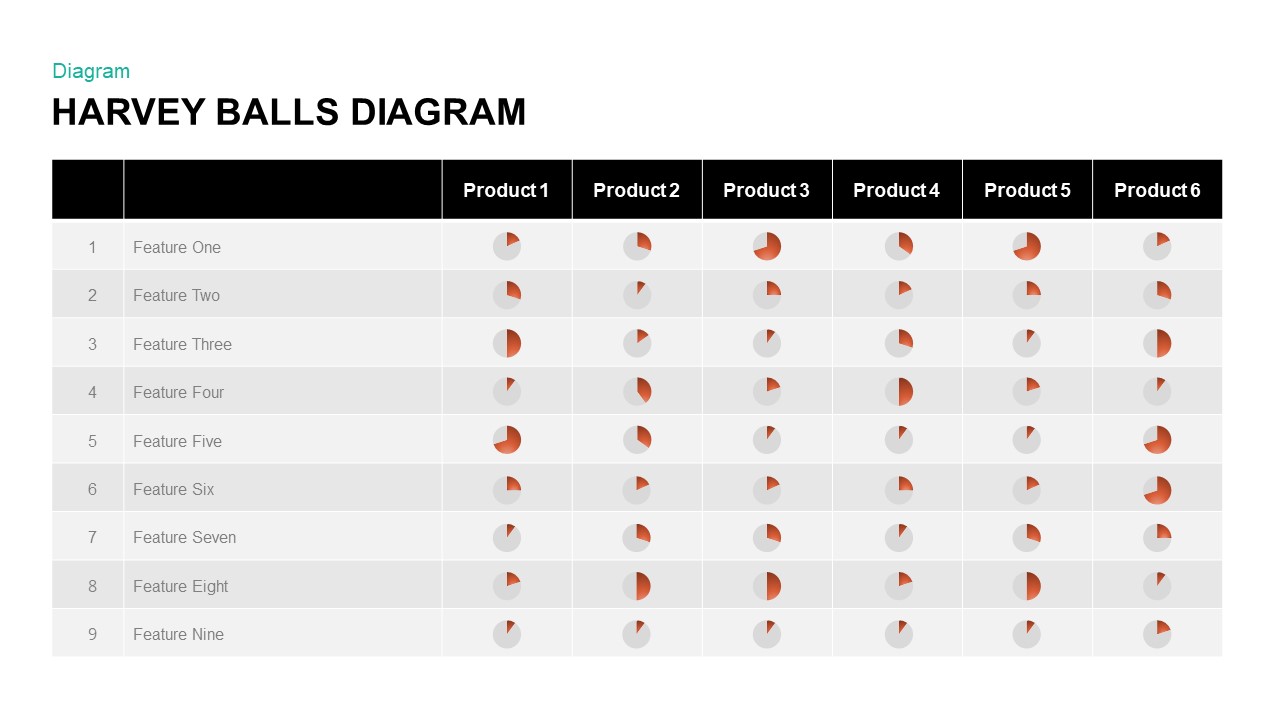
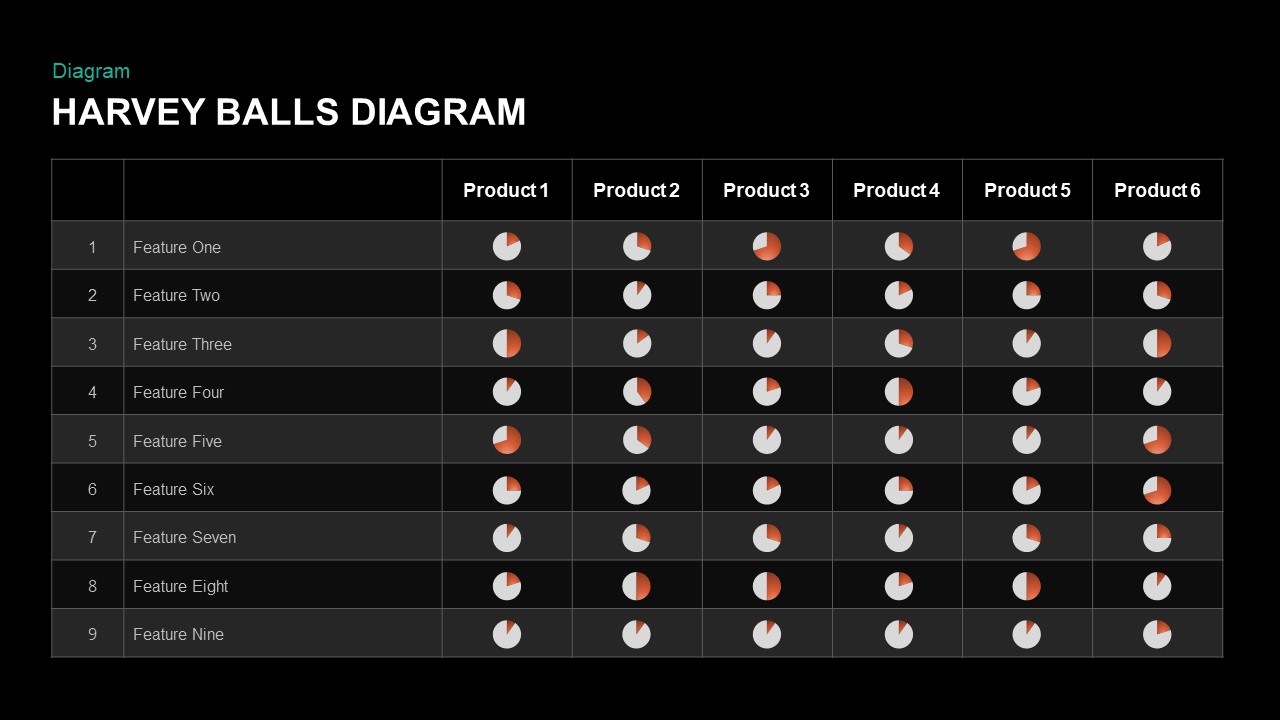
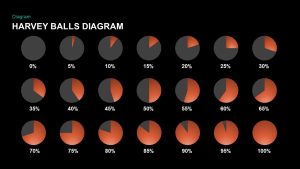
Harvey balls powerpoint template can be used for comparing data in order to evaluate the achievement of different performance indicators or to explain features. Harvey balls design is frequently used in assessment tables to indicate the amount to which particular item meets a particular standard. This illustration can combine with any of our editable Gantt chart PowerPoint template or project management dashboard PowerPoint template and Google Slides template. Additionally, Harvey balls are generally used in lean manufacturing and continuous improvement models. It is also useful for astronomical projections like the phenomenon of the lunar eclipse.
Harvey balls ppt template will help you to save hours of work. This slide is used to produce business reports and consumer buying journey. The Harvey balls PowerPoint template covers two slides. Crafting Harvey balls in Microsoft excel, word or PowerPoint may be a difficult job if not done before. Therefore, our designers have done for you this task in the second pre-designed slide, this ready-made template can use without making notable changes. The slidebazaar Harvey balls PowerPoint template offers you to save time and money by downloading the quality slides with few clicks. If you want to change the color of the shapes you can use PowerPoint color options. The template is perfect for all busy professionals; they are fighting with the time.
Login to download this file

Item ID
SB00965