2 Options Comparison Table PowerPoint Template


2 Options Comparison Table PowerPoint Template: A Versatile Tool for Effective Presentations
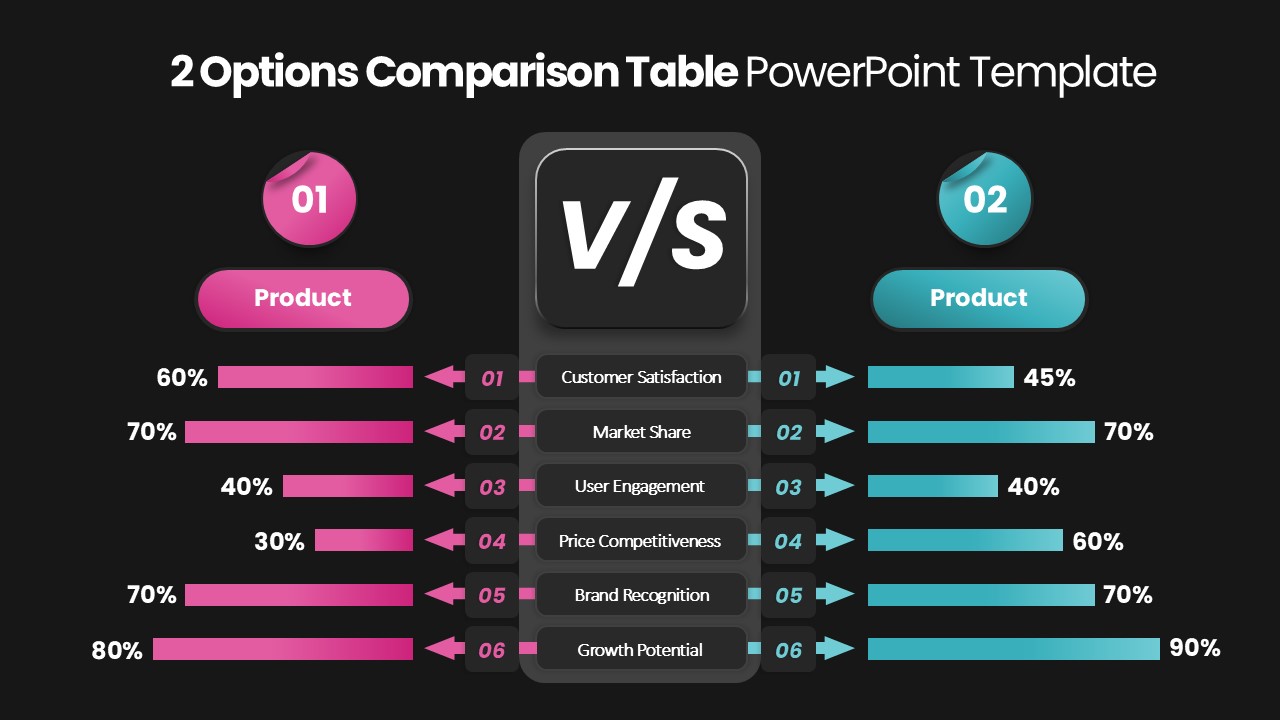
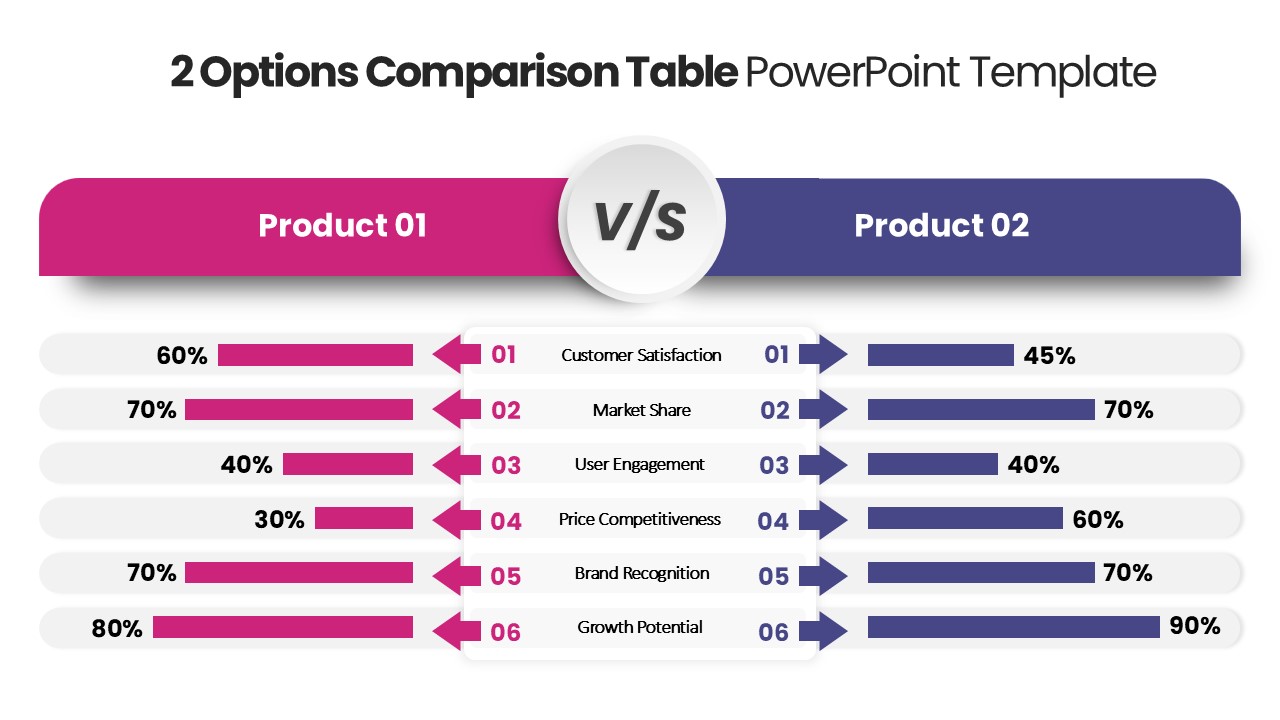
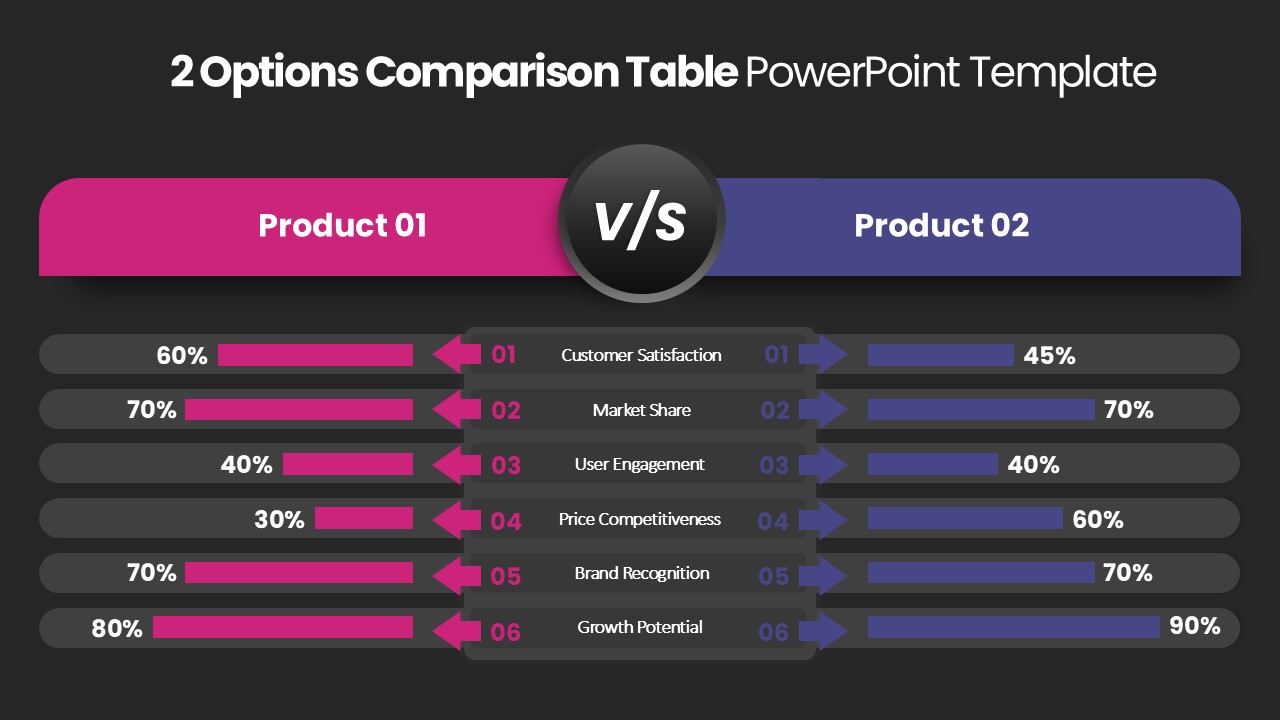
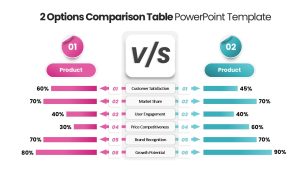
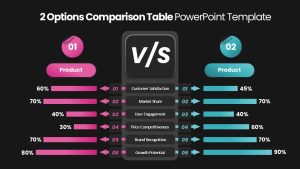
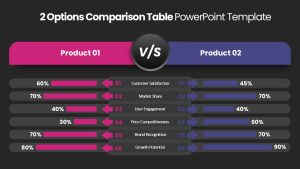
The 2 Options Comparison Table PowerPoint Template is an essential tool for professionals, educators, and business leaders who need to showcase comparisons effectively. This two options comparison slide for PowerPoint is designed to present data in a visually appealing way using differently sized bars to highlight distinctions between two choices. Whether comparing Product 1 vs. Product 2, advantages vs. disadvantages, or dos and don’ts, this template enhances clarity and audience engagement.
How do I create a comparison chart in PowerPoint?
To create a comparison chart in PowerPoint, go to the “Insert” tab and select “Chart.” Choose a suitable chart type, like a bar chart or table. Enter data in the Excel sheet that appears. Customize the chart by adjusting colors, labels, and sizes. Alternatively, use SmartArt (Insert > SmartArt > Relationship > Balance) for a quick visual comparison. Modify fonts and icons for better clarity and professional appeal.
Features of the 2 Options Comparison Slide for PowerPoint
Visually Distinct Bars: The parallel bar chart slide uses different sizes to provide a clear, intuitive understanding of differences.
Customizable Layout: Users can edit the colors, text, and bar sizes to match their presentation style.
Multipurpose Use: Ideal for showcasing product comparisons, pros & cons, likes & dislikes, or any decision-making process.
Professional & Clean Design: Ensures that complex data is presented in a simple, engaging format.
Who Benefits from This Template?
- Business Professionals: Useful for marketing and sales teams to compare product features and benefits.
- Educators & Trainers: Helps in explaining concepts such as different learning methodologies, strategies, or historical events.
- Researchers & Analysts: Supports data-driven comparisons in fields like finance, healthcare, and technology.
- Students & Academics: Assists in project presentations, thesis defenses, and debates.
How to Edit the Template?
Editing the Two Options Comparison Table PPT Template is simple and user-friendly:
- Modify Text & Labels – Replace default text with your content.
- Adjust Colors & Fonts – Customize the color scheme to fit your brand or theme.
- Resize Bars – Increase or decrease bar sizes to reflect accurate comparisons.
- Add Icons & Images – Enhance visuals with relevant icons for better understanding.
This comparison slide is a powerful visual aid that simplifies decision-making and enhances clarity in any presentation. Use it to deliver impactful insights with precision and style!
Login to download this file
Add to favorites
Add to collection

Item ID
SB04784
Related Templates

Product Feature Comparison Table PowerPoint Template
PowerPoint Templates
Premium
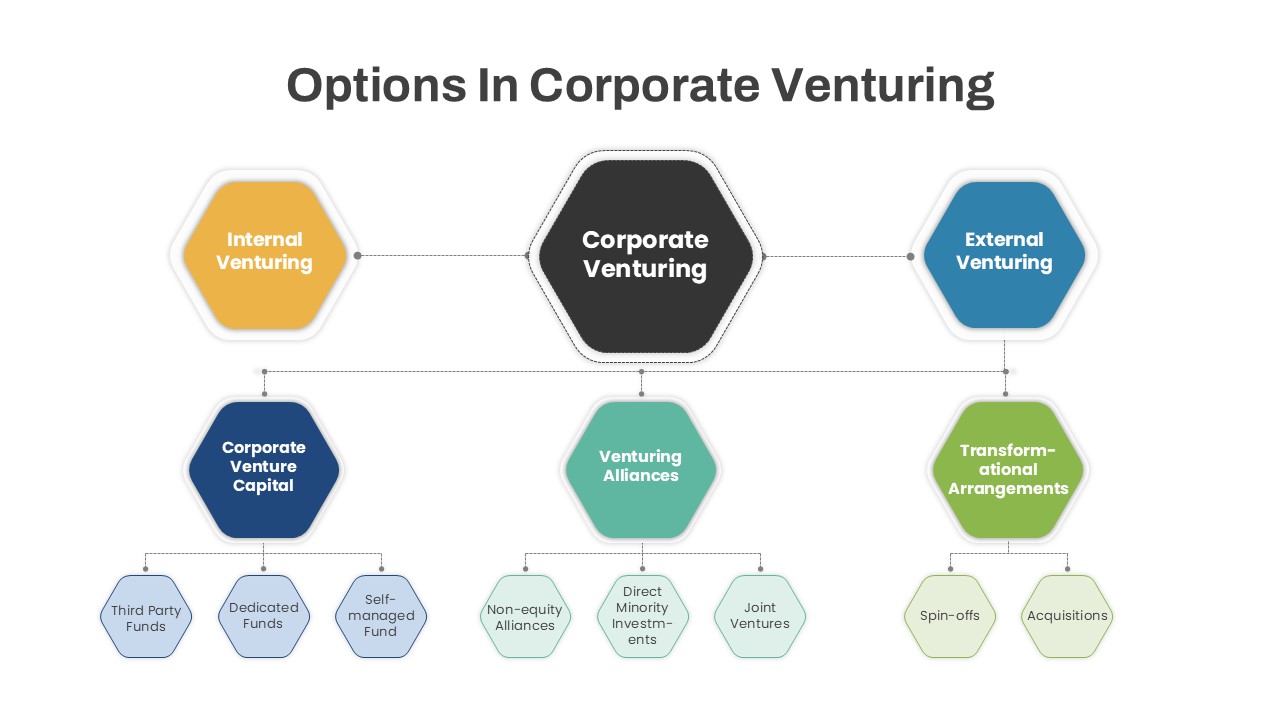
Options in Corporate Venturing PowerPoint Template
PowerPoint Templates
Premium
Simple Comparison Table PowerPoint Template & Keynote
Tables
Premium
Column Comparison Table PowerPoint Template & Keynote Slide
Keynote Templates
Premium

Comparison Pricing Table Template for PowerPoint and Keynote
Infographic
Premium
Comparison Table for PowerPoint and Keynote Presentation
Tables
Premium
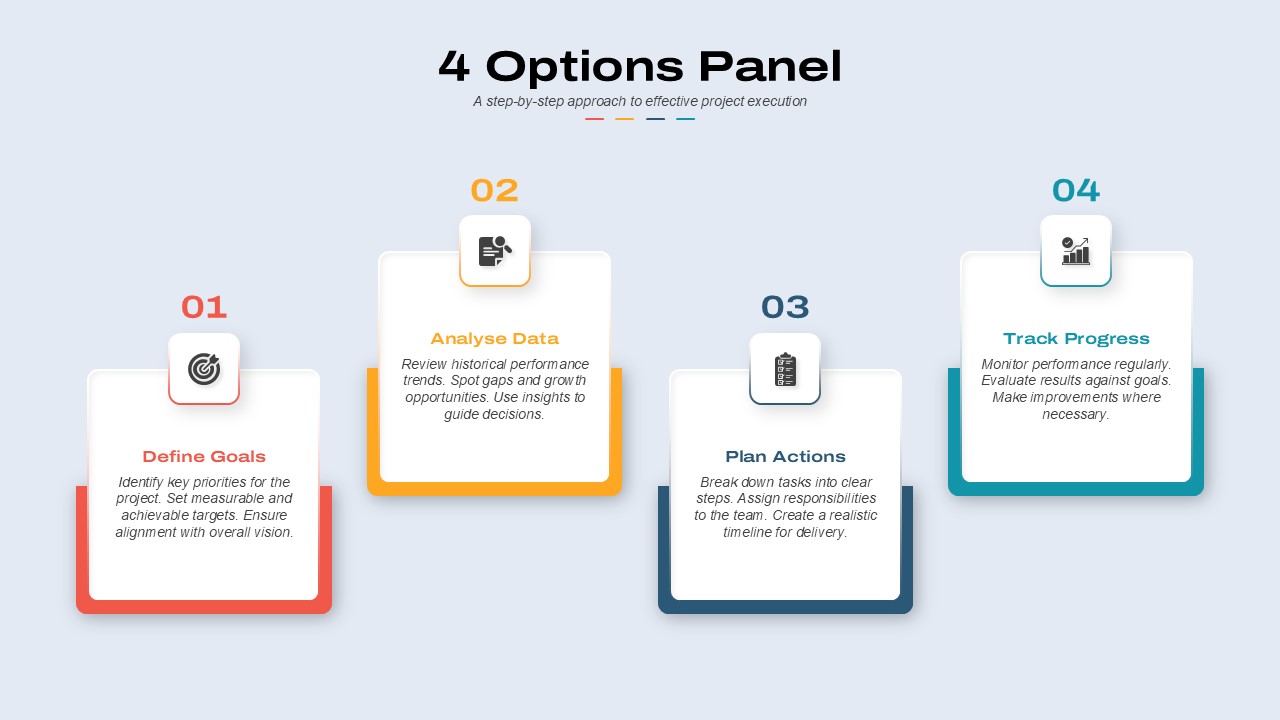
4 Options Panel PowerPoint Template
PowerPoint Templates
Premium
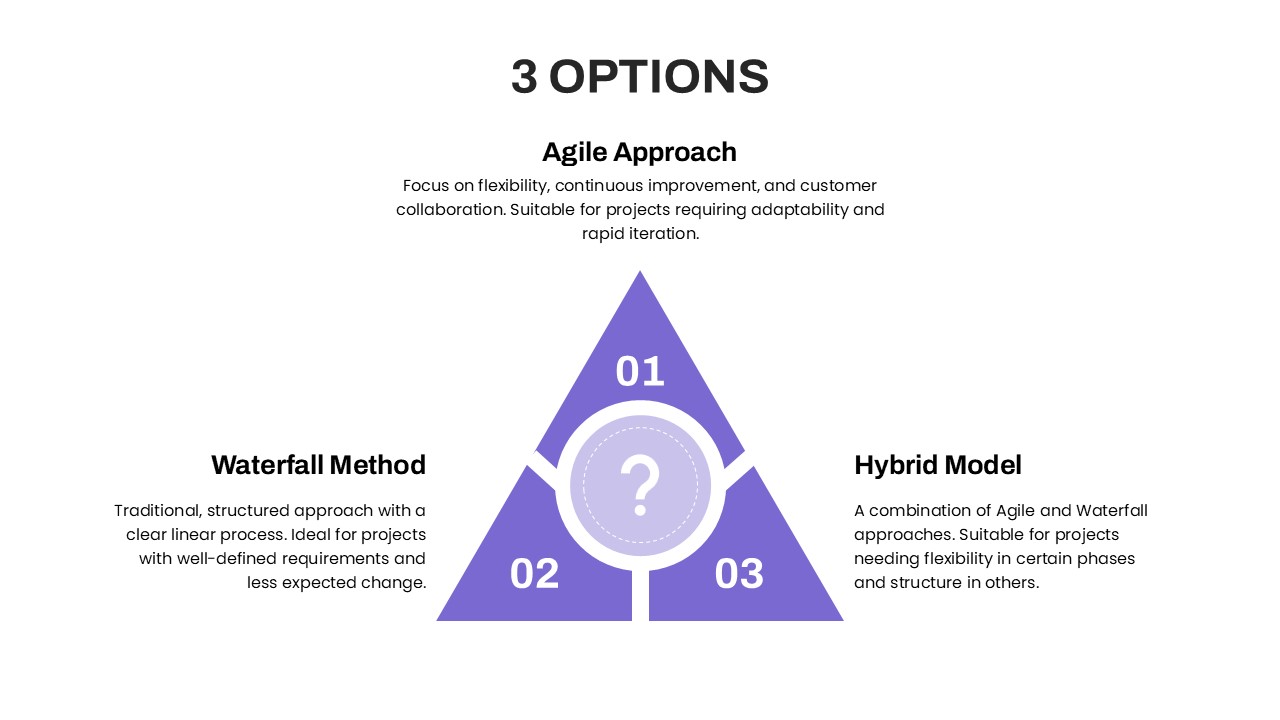
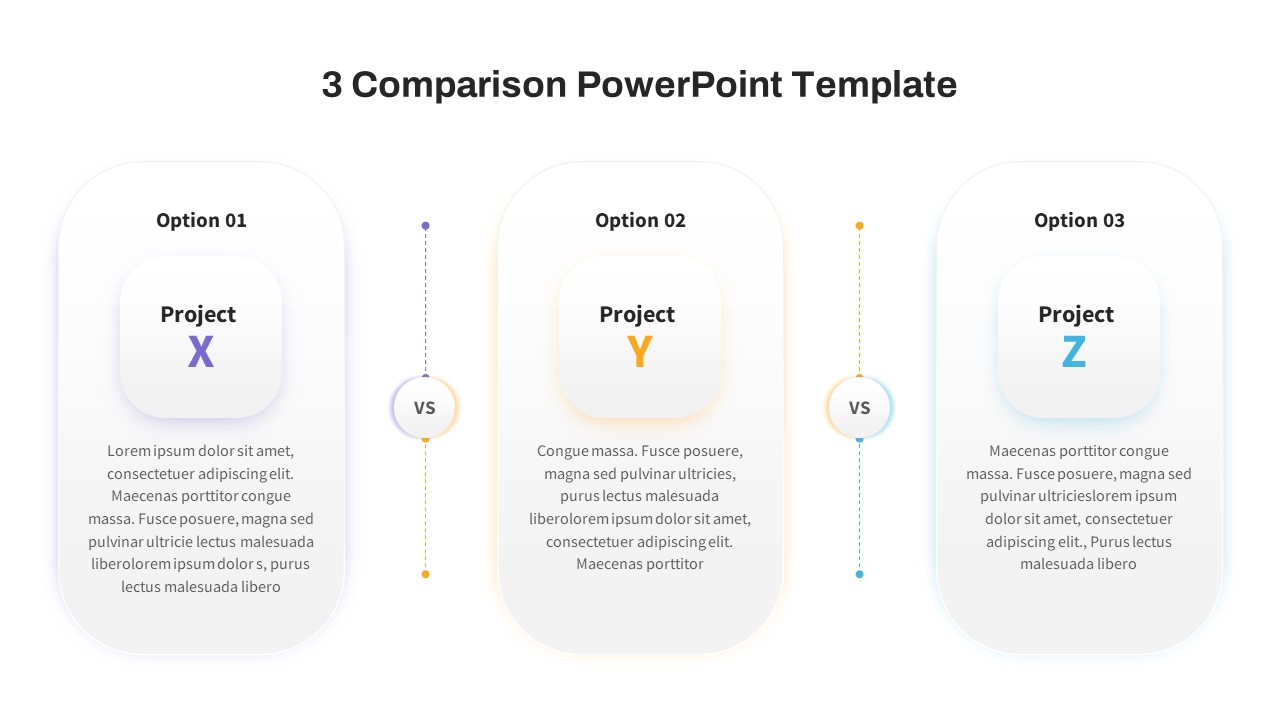
3 Options PowerPoint Template
PowerPoint Templates
Premium
4 Options PowerPoint Template
Business PowerPoint Templates
Premium
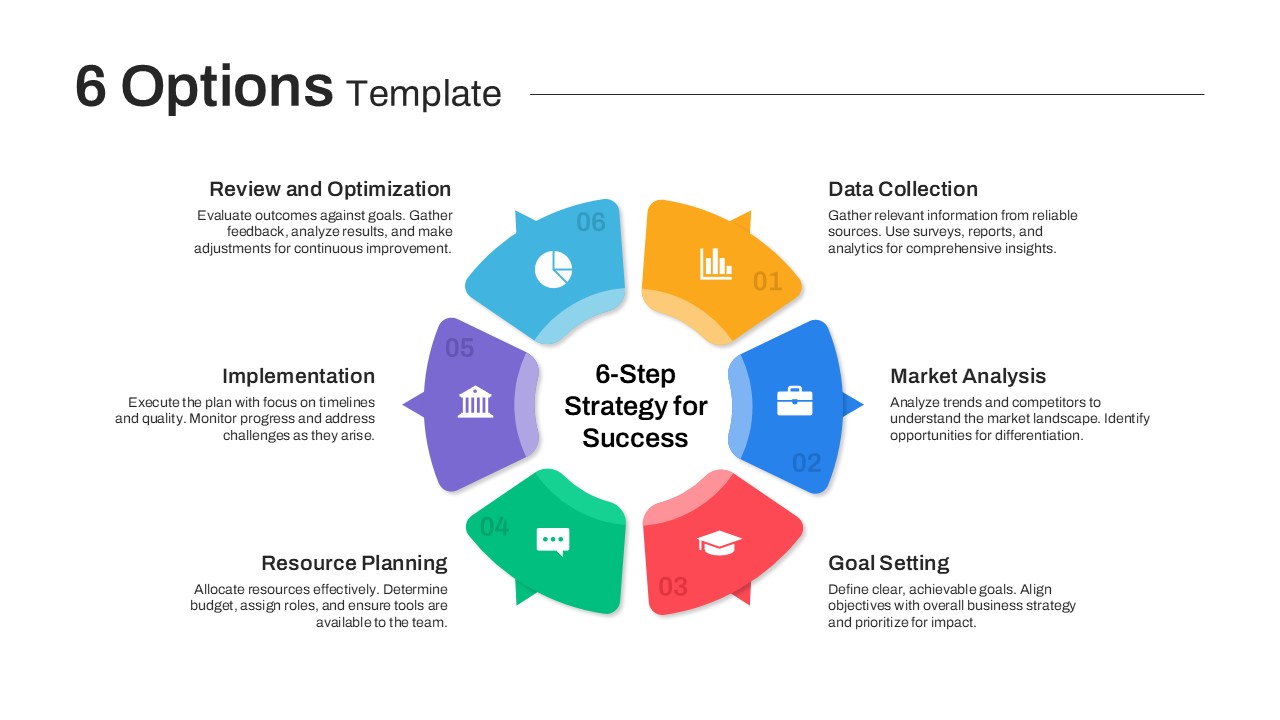
6 Options PowerPoint Template
PowerPoint Templates
Premium
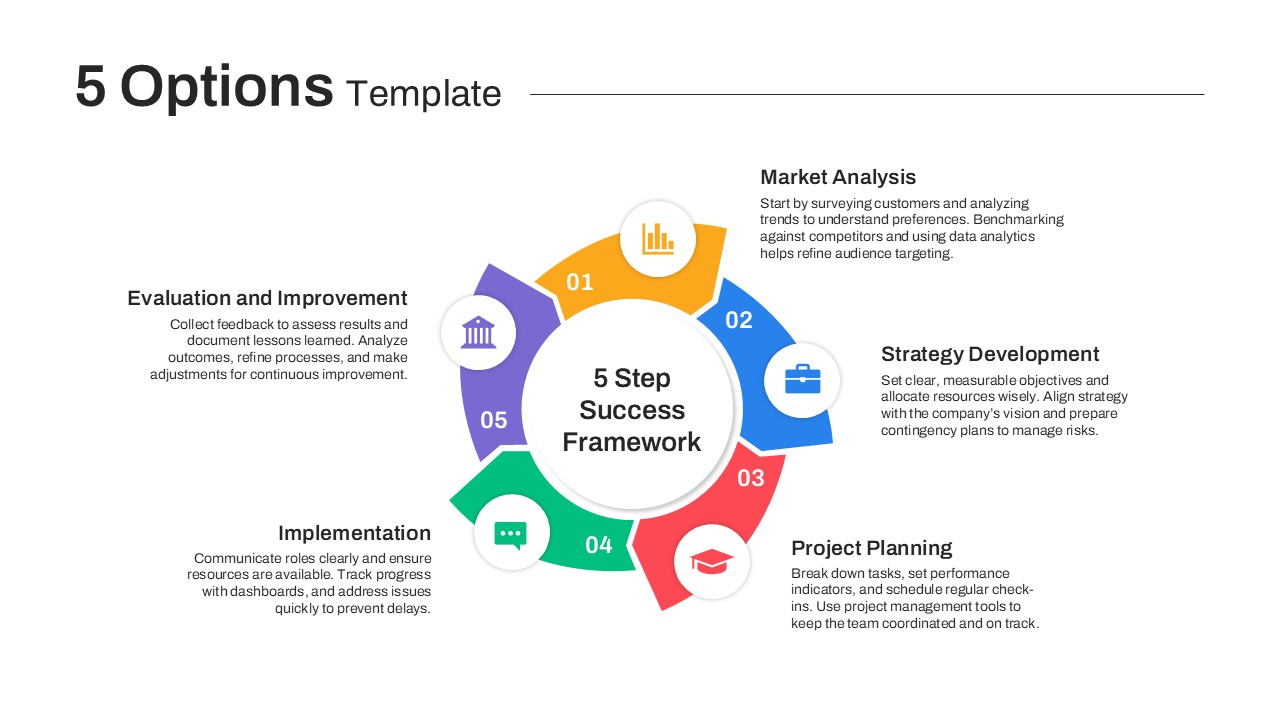
5 Options PowerPoint Template
PowerPoint Templates
Premium
Market Share Comparison PowerPoint Template
PowerPoint Charts
Premium
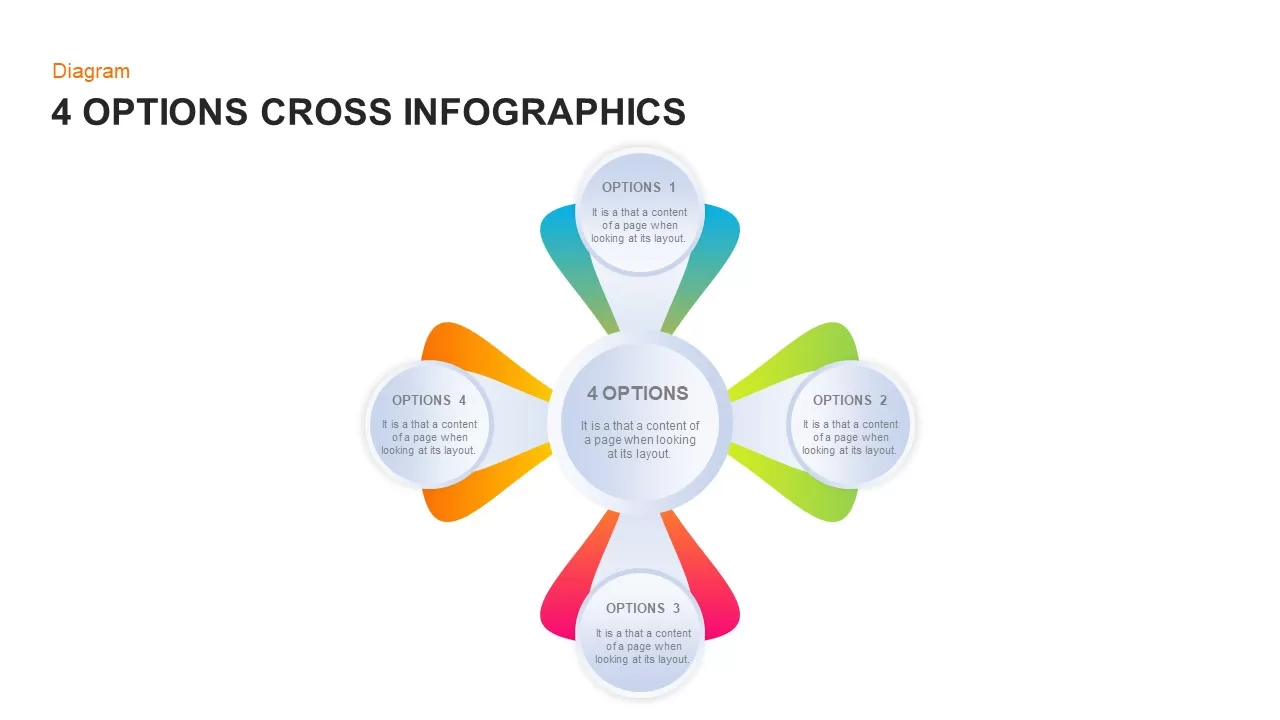
4 Options Cross Infographic PowerPoint Diagram
Business Models
Premium
Competitor Comparison Chart PowerPoint Templates
Business PowerPoint Templates
Premium
Table of Organization PowerPoint Template
PowerPoint Templates
Premium
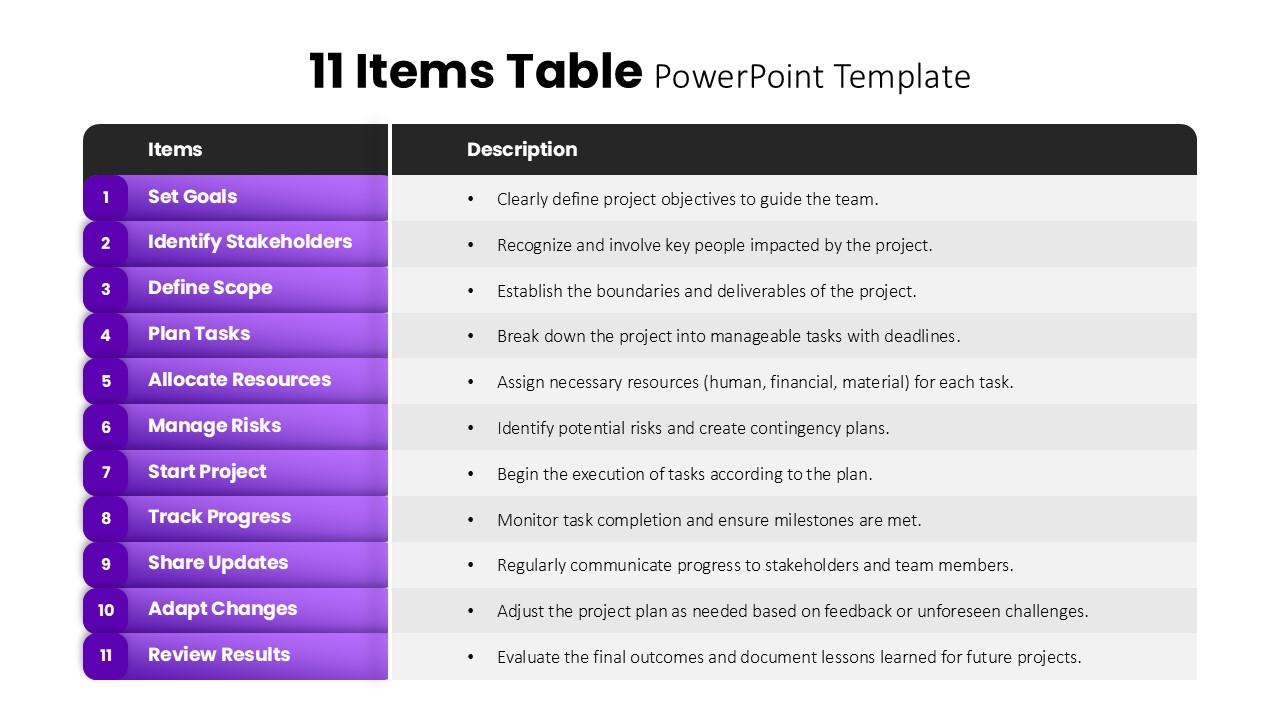
11 Items Table PowerPoint Template
PowerPoint Templates
Premium
Profile Comparison PowerPoint Template
professional
Premium
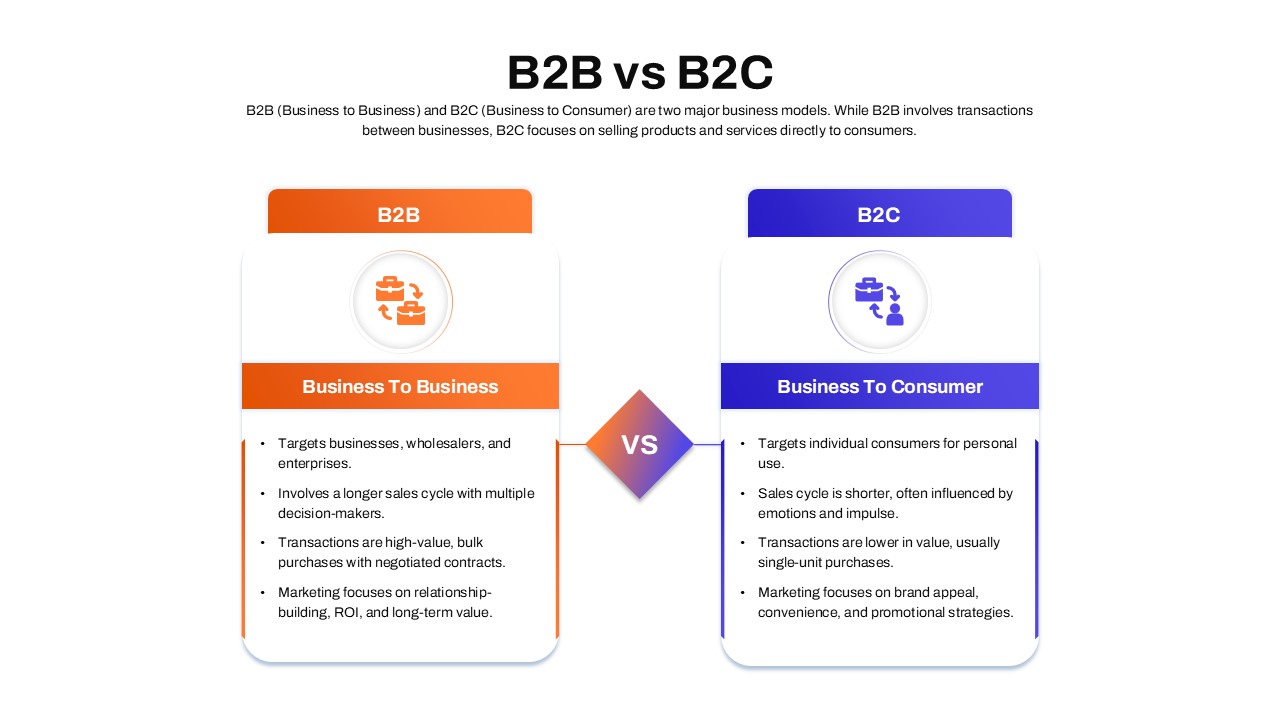
B2B vs B2C Business Model Comparison PowerPoint Template
Business Models
Premium

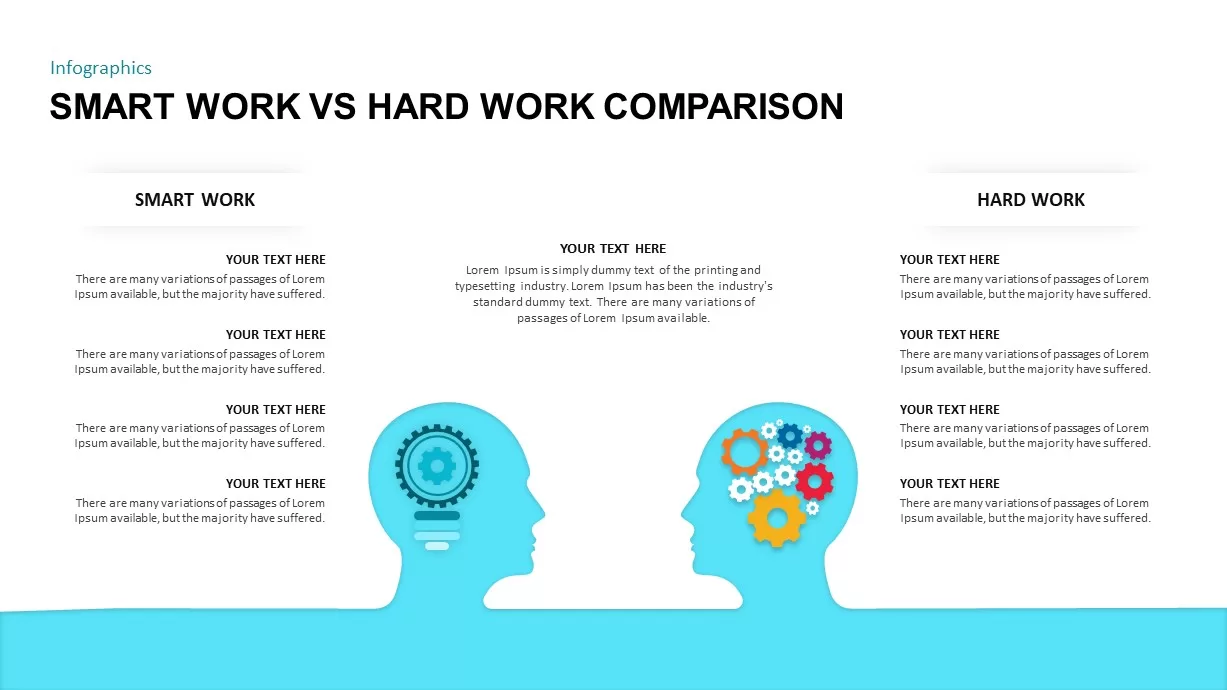
Smart Work VS Hard Work Comparison Template
Business Models
Premium
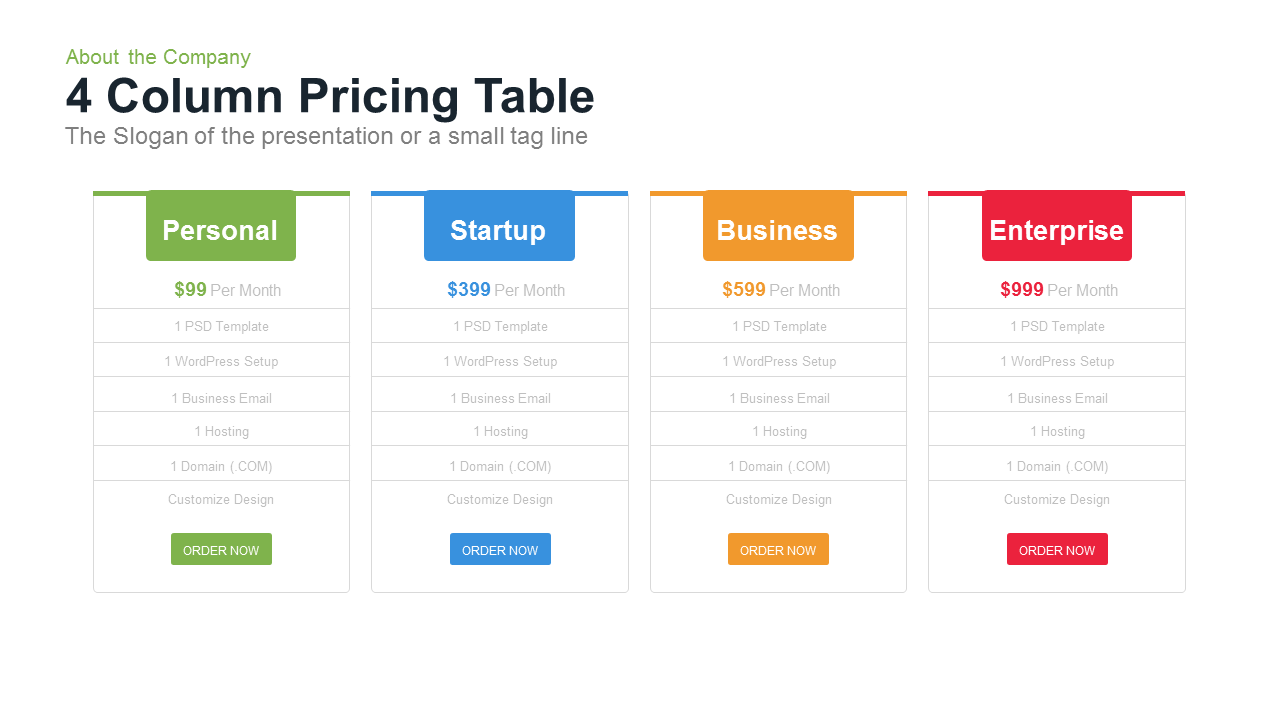
4 Column Pricing Table Template for PowerPoint and Keynote
Tables
Premium
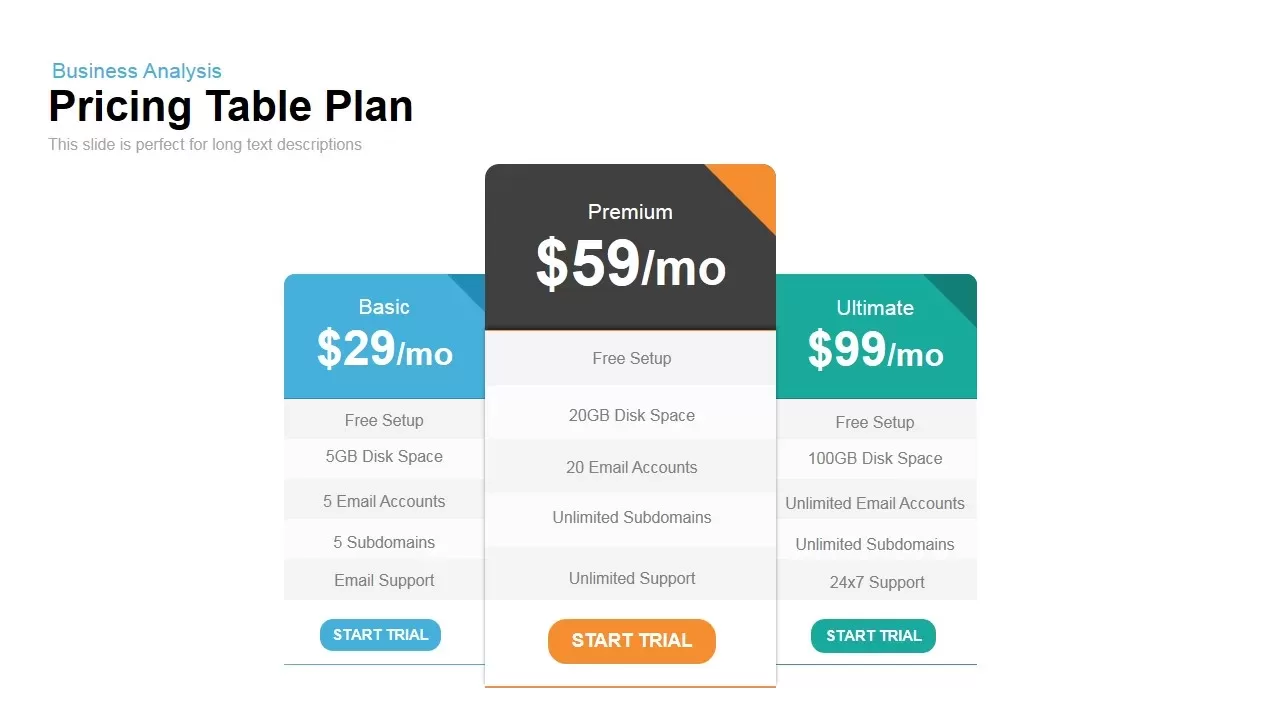
Plan and Pricing Table Template for PowerPoint and Keynote
Tables
Premium
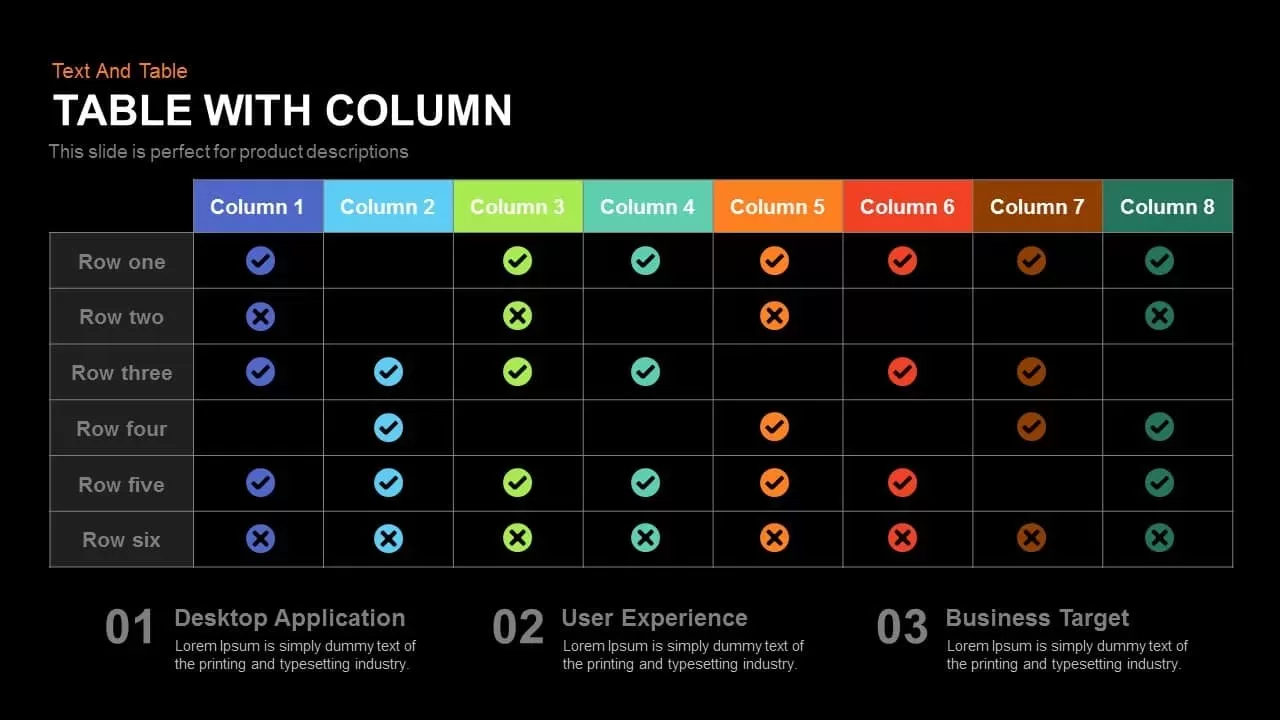
Table with Column PowerPoint Template and Keynote Slide
Keynote Templates
Premium
Free Table Of Contents PowerPoint Template
Infographic
Free
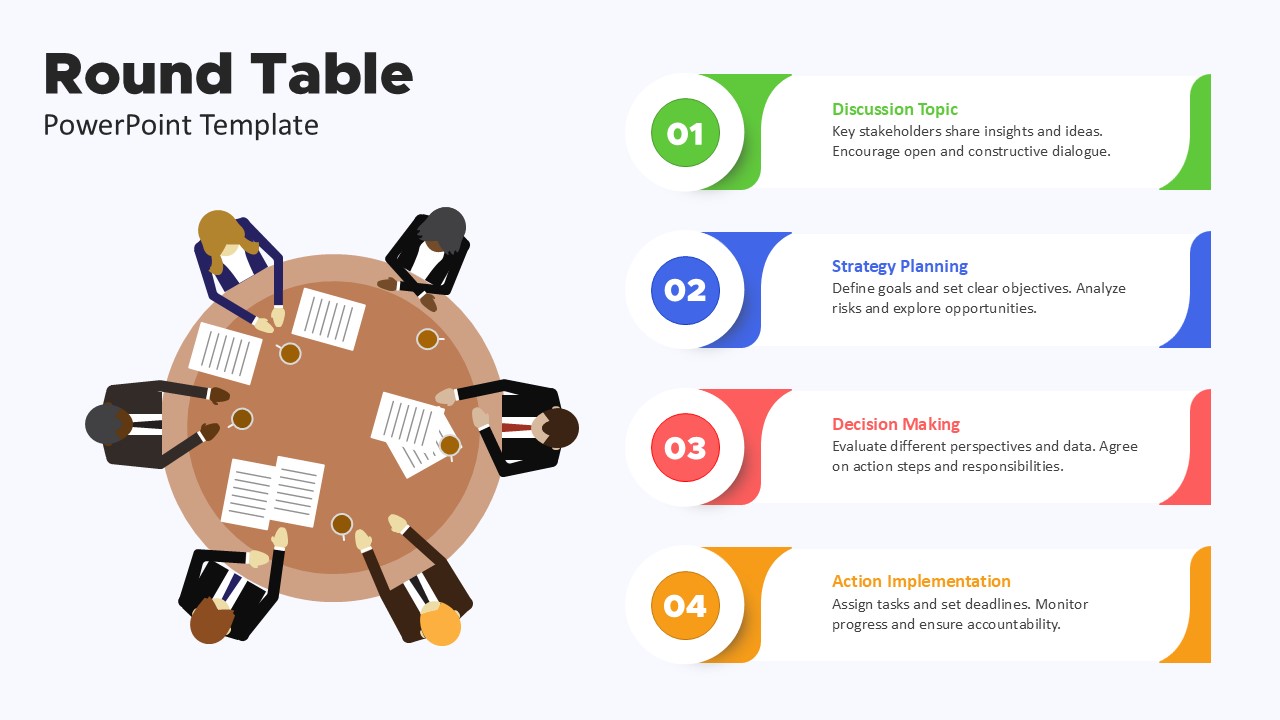
Round Table PowerPoint Template
Business PowerPoint Templates
Premium
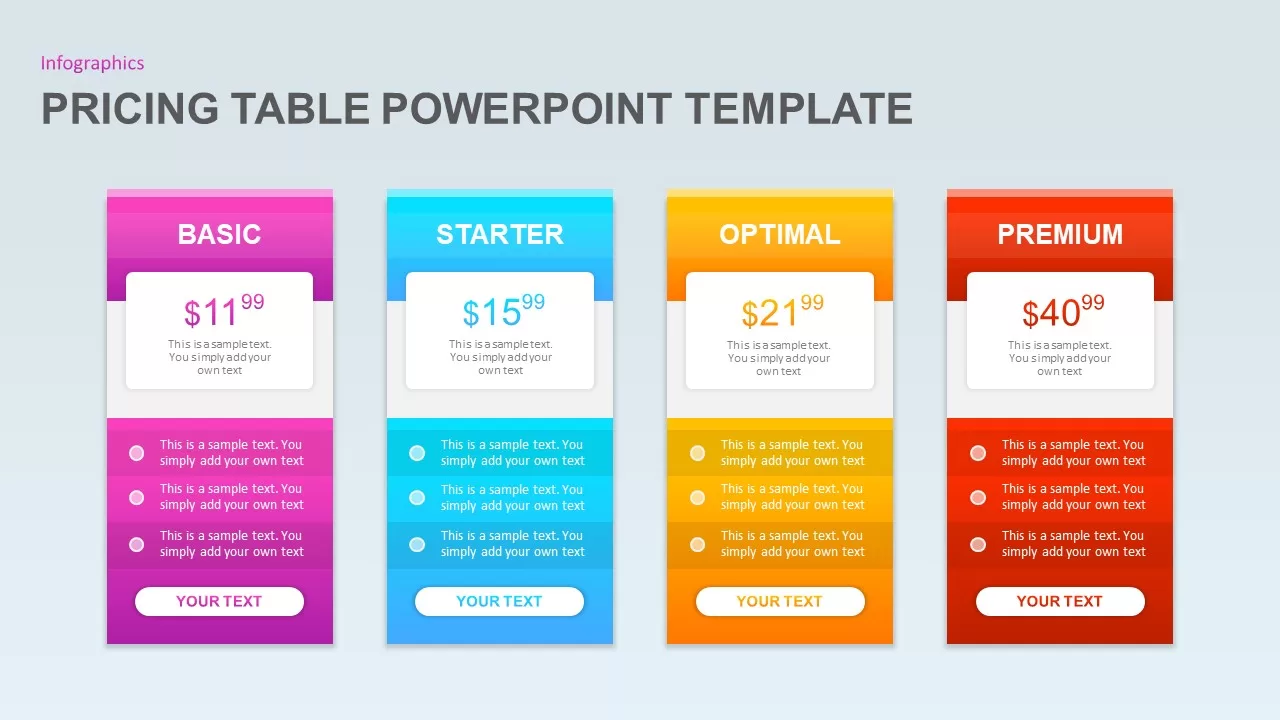
Pricing Table Presentation Template
Infographic
Premium
Comparison Bar Charts PowerPoint Template and Keynote Slide
Column and Bar chart
Premium

Comparison Donut Chart PowerPoint Template and Keynote
Keynote Templates
Premium
Mobile Service Comparison Template for PowerPoint and Keynote
Infographic
Premium

Comparison Metaphor PowerPoint and Keynote template
Keynote Templates
Premium
Product Comparison Bar Chart Template for PowerPoint and Keynote
PowerPoint Charts
Premium
Comparison Chart PowerPoint Template and Keynote Slide
Tables
Premium
Radar Chart Product Comparison PowerPoint Template
Business Models
Premium
Product Comparison PowerPoint Template & Keynote Diagram
Business Models
Premium
Comparison Slide Template for PowerPoint & Keynote
Column and Bar chart
Premium
Comparison for Success PowerPoint Template
Business Models
Premium
Generations Comparison PowerPoint Template
Business Models
Premium
Product Comparison A vs B PowerPoint Template
Business Models
Premium
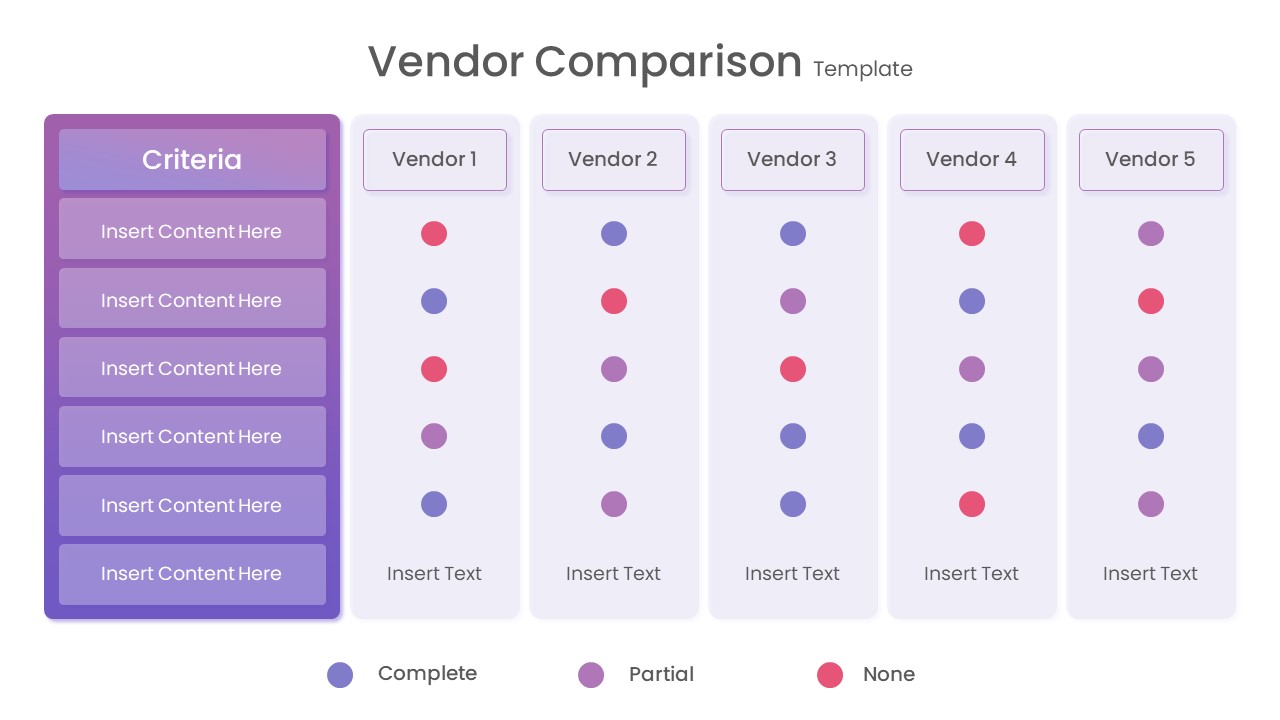
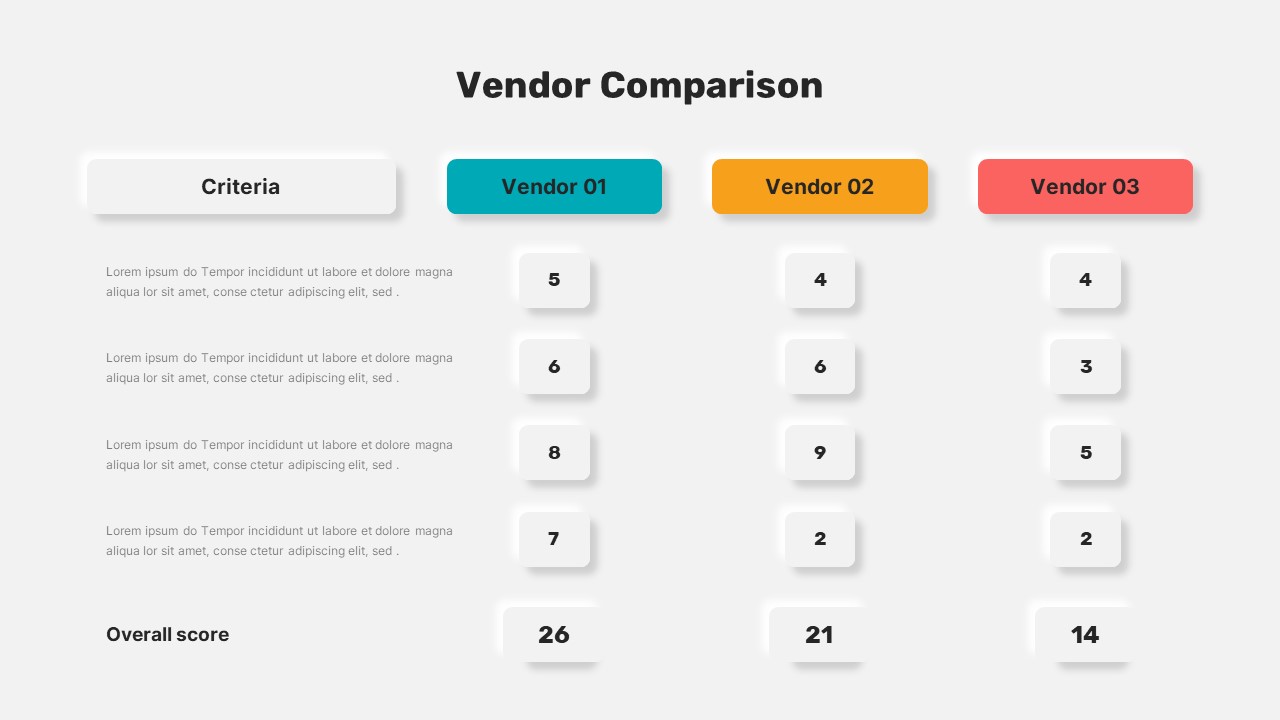
Vendor Comparison PowerPoint Template
Infographic
Premium
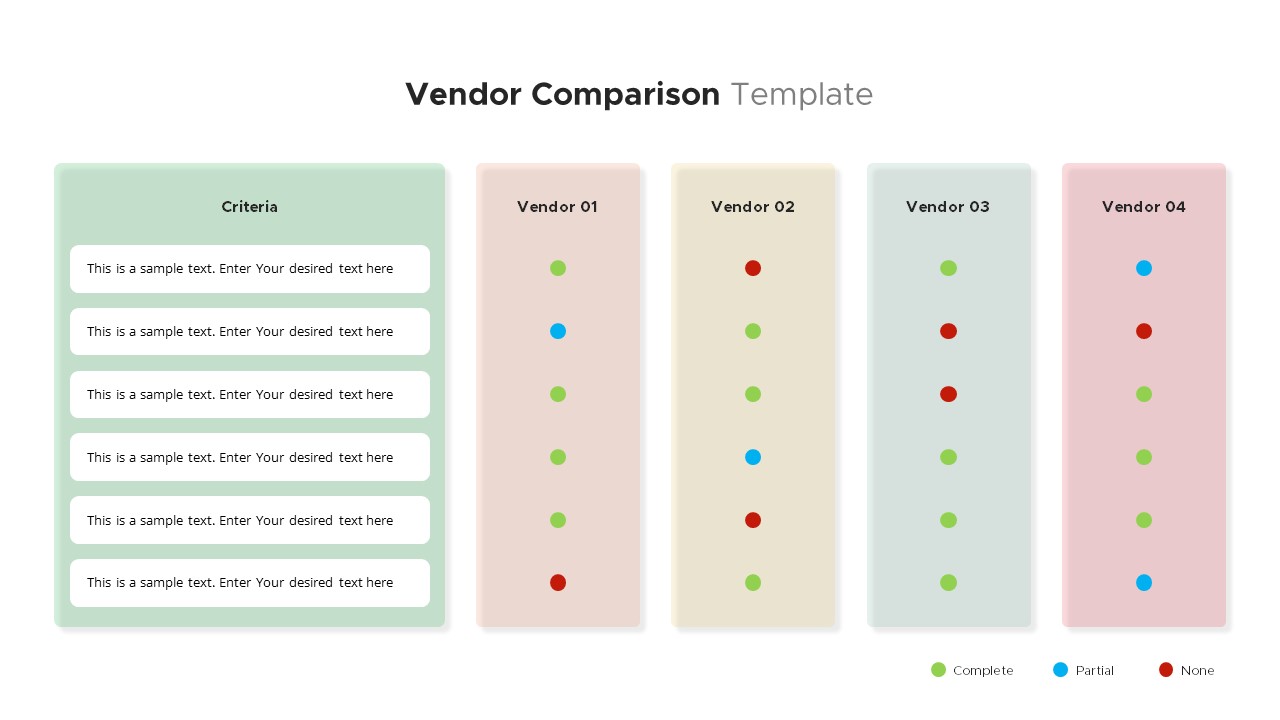
Vendor Comparison Template for PowerPoint
Infographic
Premium
Timeline Comparison PowerPoint Template
Timeline PowerPoint Template
Premium
Cost Comparison PowerPoint Template
PowerPoint Templates
Premium
Free Product Comparison PowerPoint Template
Business Models
Premium
3 Comparison PowerPoint Template Free
PowerPoint Templates
Free
AI vs Human Comparison PowerPoint Template
PowerPoint Templates
Premium
Comparison Roadmap PowerPoint Template
PowerPoint Templates
Premium
Sales Growth Comparison PowerPoint Template
PowerPoint Templates
Premium
Comparison PPT Presentation Template
PowerPoint Charts
Premium
Vendor Comparison PPT Template
Infographic
Premium
Vendor Comparison Template Slides
Infographic
Premium
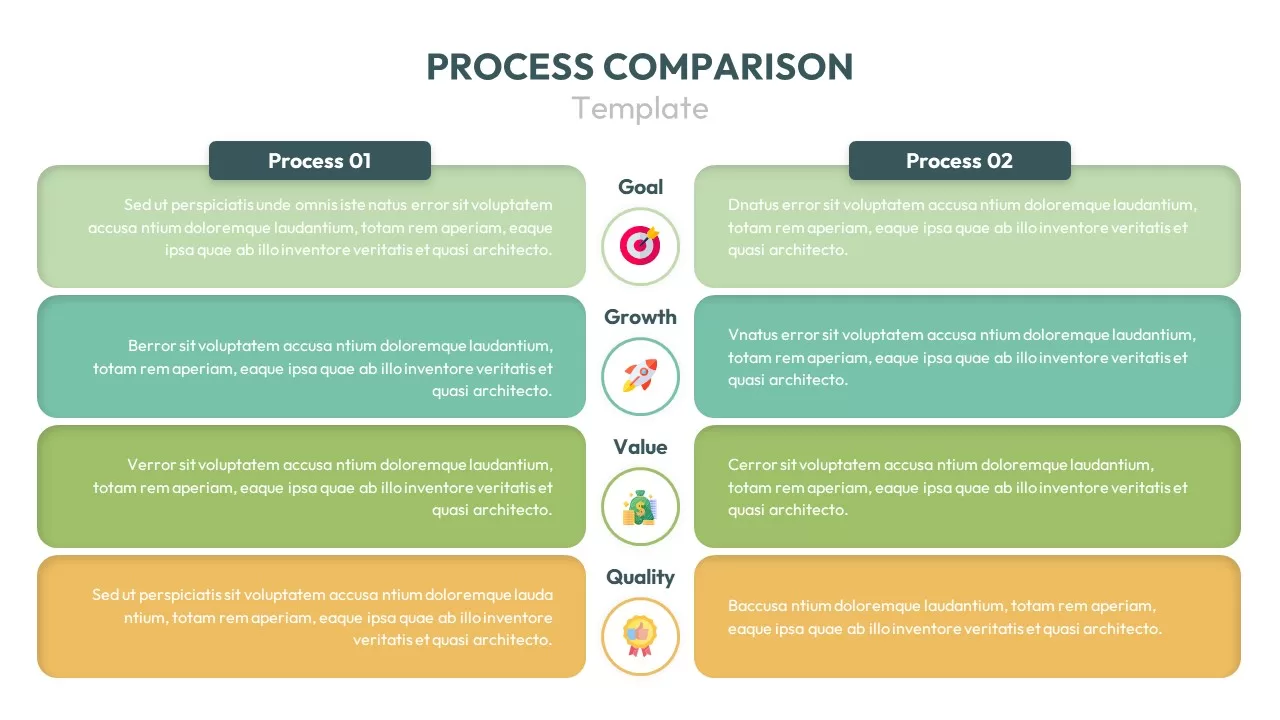
Process Comparison Chart
PowerPoint Charts
Premium
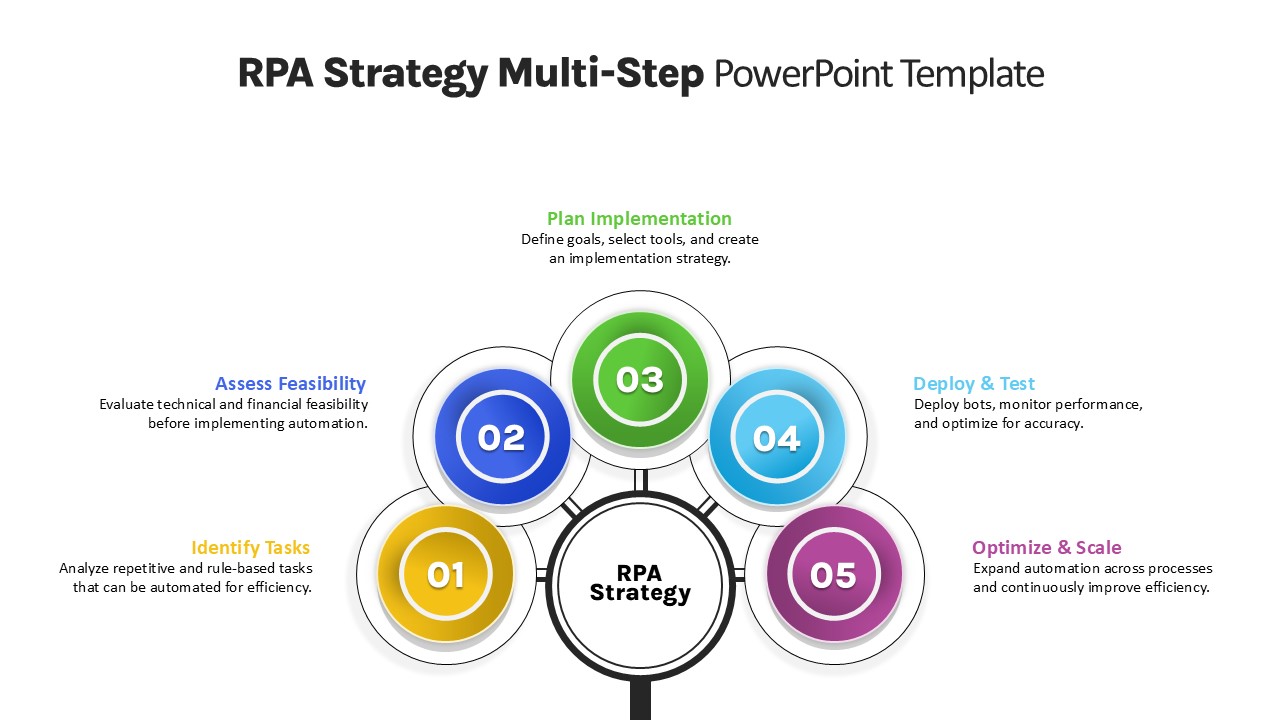
RPA Strategy Multi-Step PowerPoint Template
PowerPoint Templates
Premium
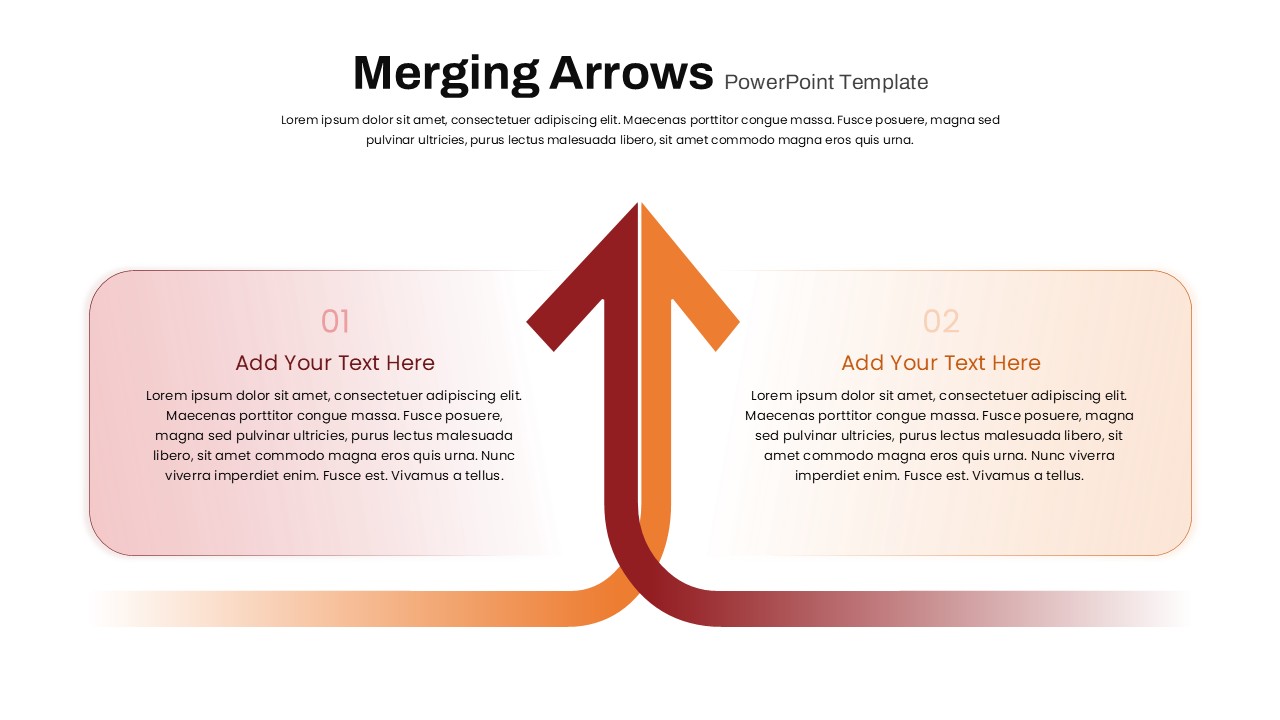
Merging Arrows PowerPoint Template
Business PowerPoint Templates
Premium
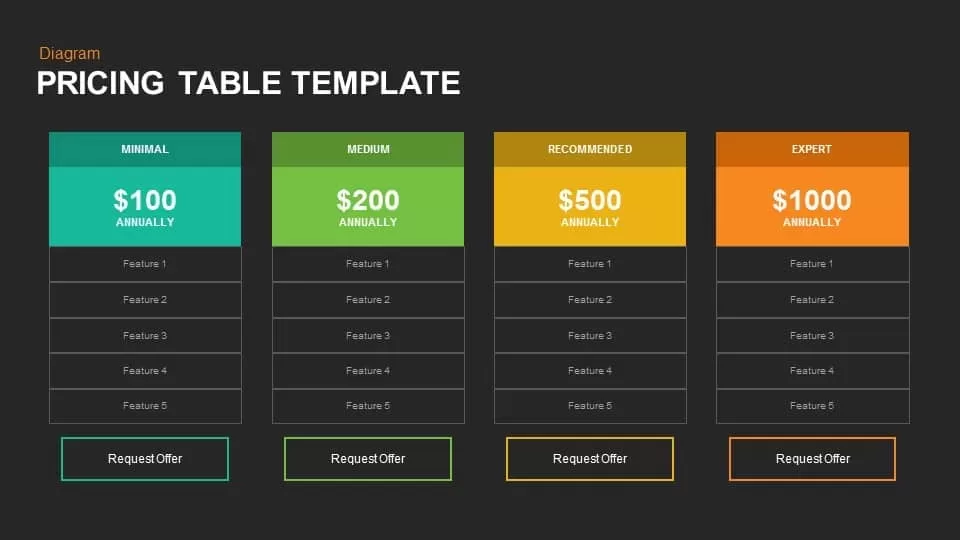
Pricing Table PowerPoint Template and Keynote Slide
Business Models
Premium
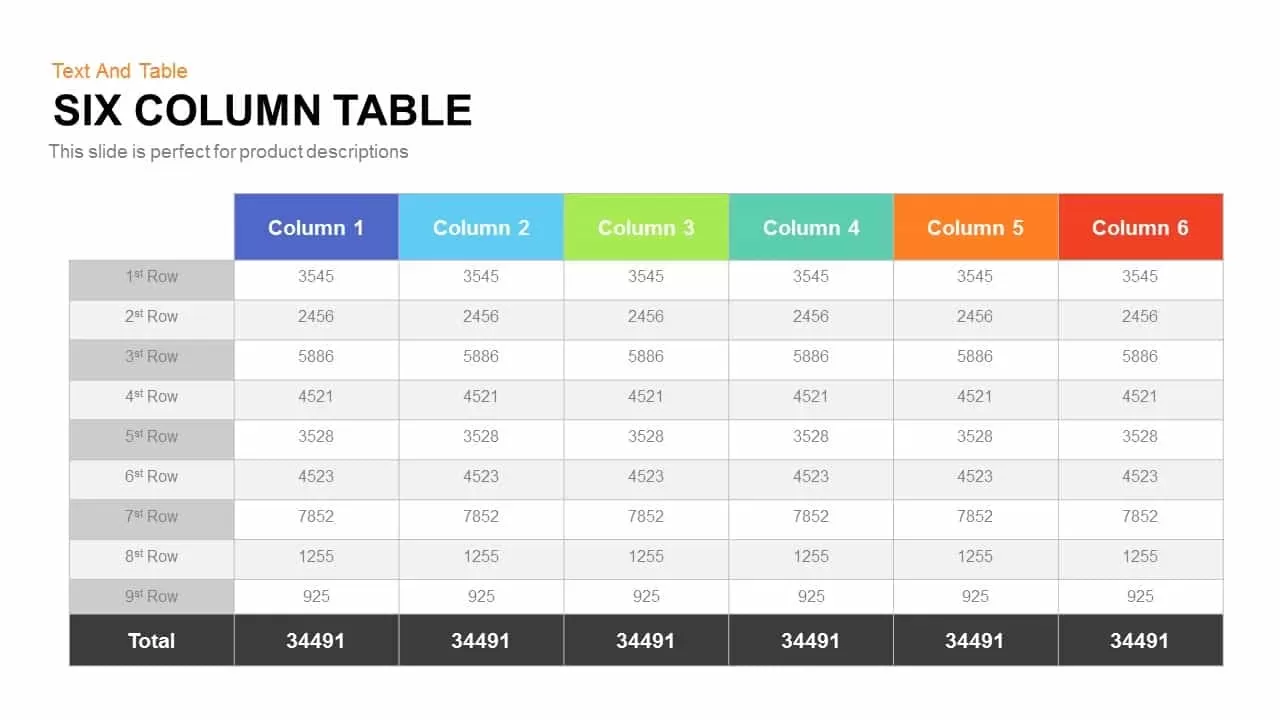
Six Column Table Template for PowerPoint and Keynote
Keynote Templates
Premium
Pricing Table PowerPoint Template and Keynote
Keynote Templates
Premium
Pricing Table PowerPoint Template and Keynote Slide
Keynote Templates
Premium
SWOT Analysis Table Template for PowerPoint and Keynote
Business Models
Premium
3 and 4 Columns Table Slide PowerPoint Template & Keynote
Keynote Templates
Premium
4 Steps Business Plan Table Template for PowerPoint & Keynote
Business Models
Premium
Table Of Contents PowerPoint Template
Infographic
Premium
Table Of Content PowerPoint Template
Infographic
Premium
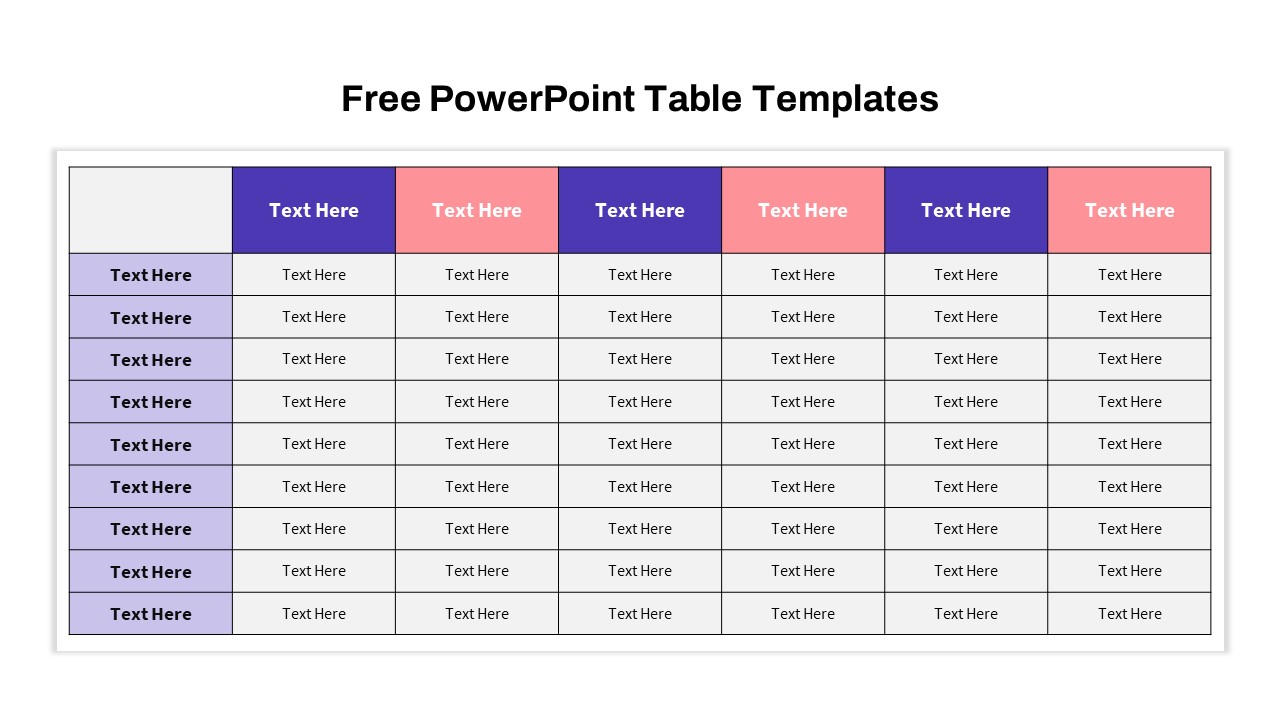
Free PowerPoint Table Templates
PowerPoint Templates
Free
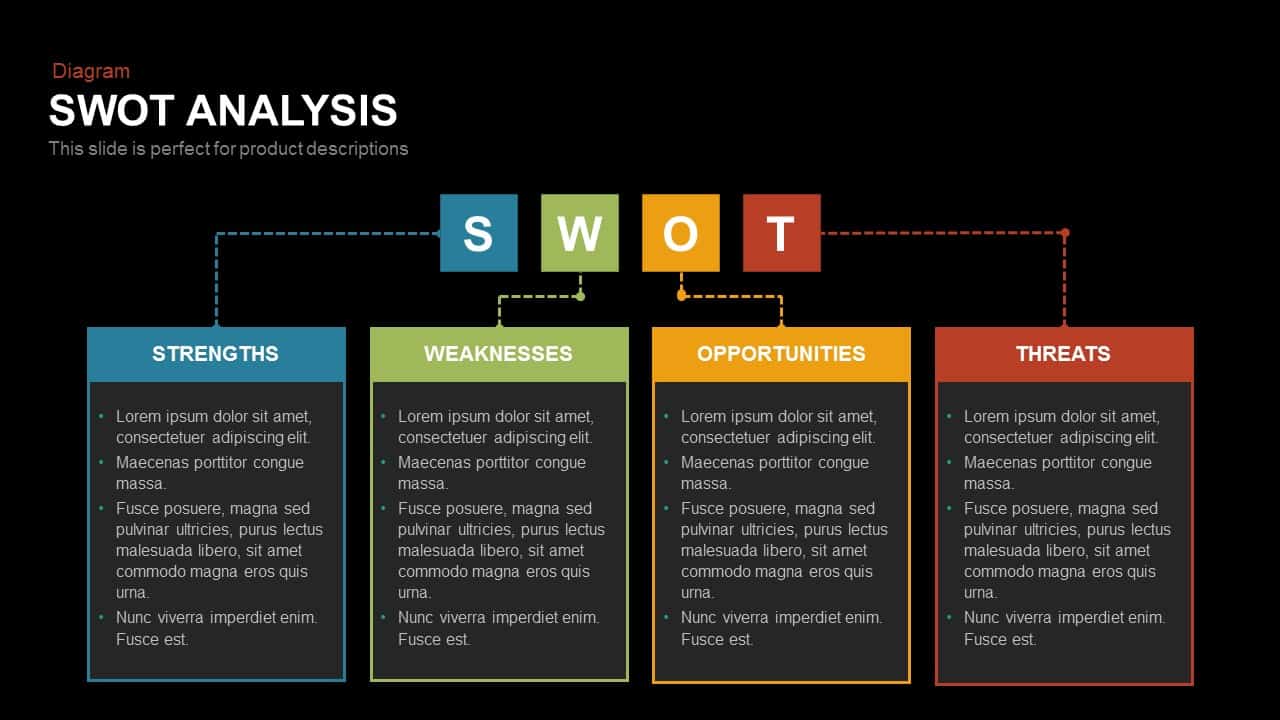
SWOT analysis table PPT Template And Keynote
Diagrams
Premium
Table Of Contents Template
Infographic
Premium
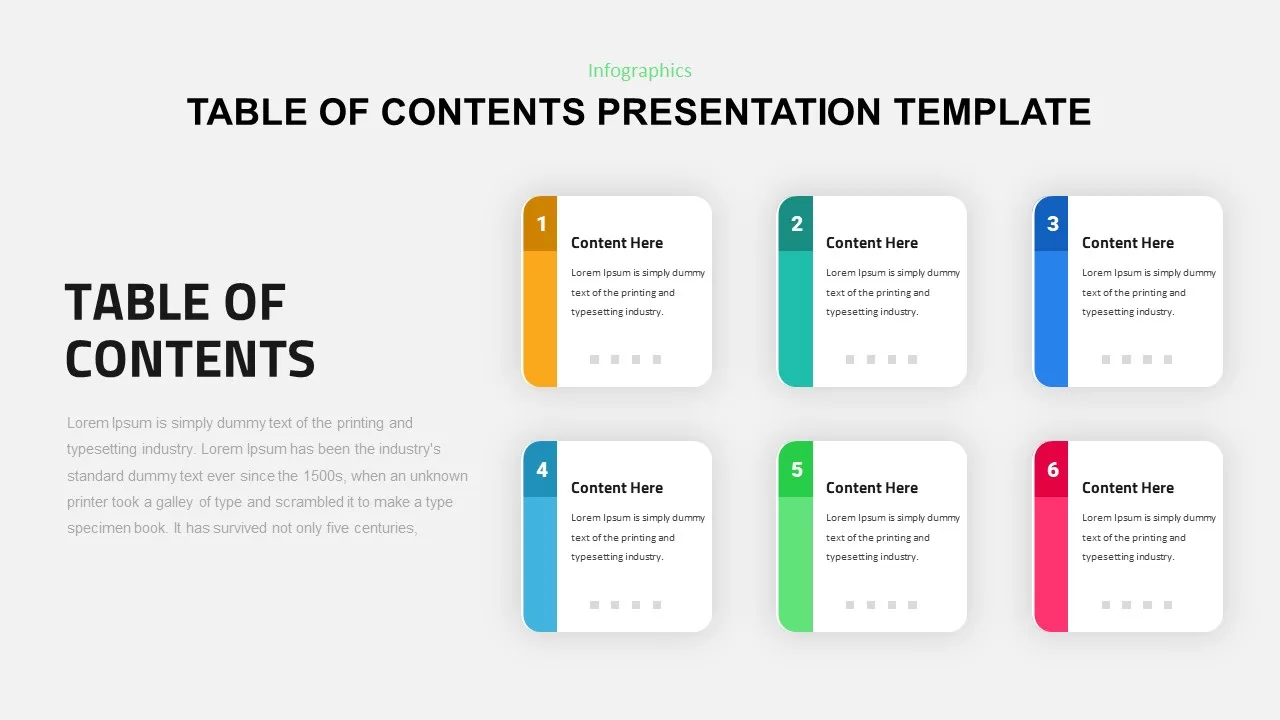
Table Of Contents Presentation Template
Infographic
Premium
Table Of Content Template
Infographic
Premium
Table Of Content Presentation Template
Infographic
Premium
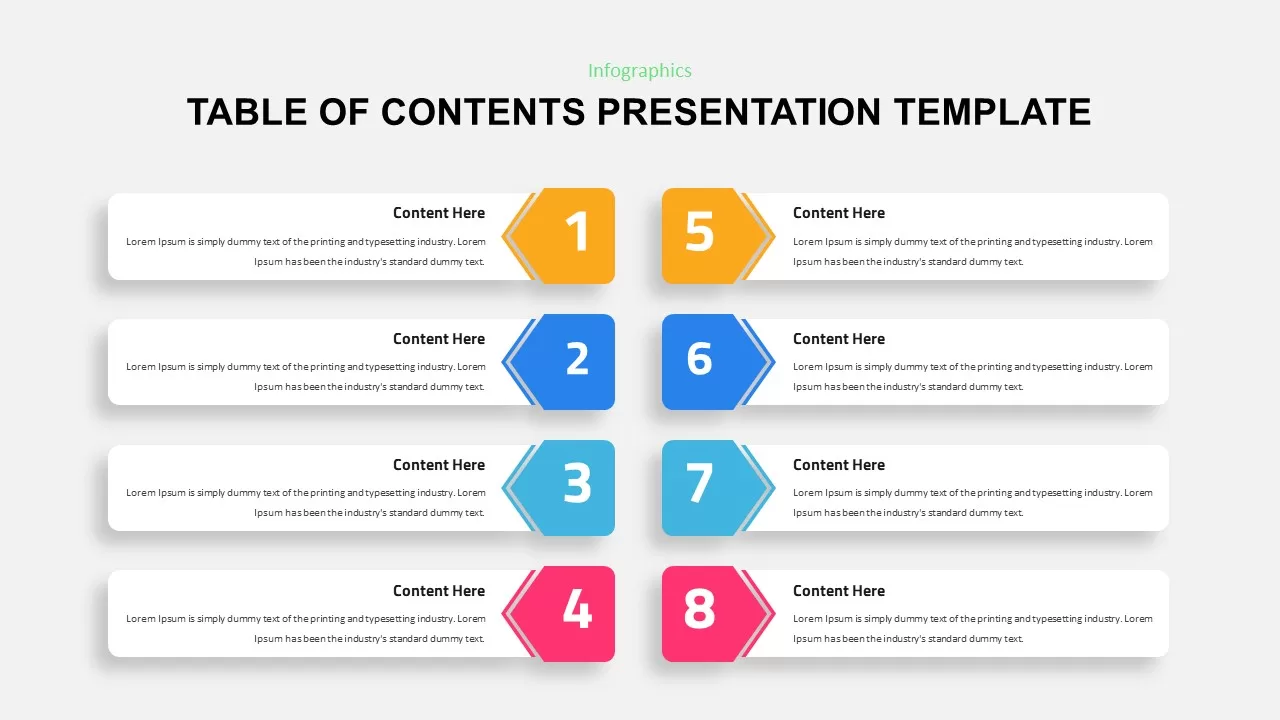
Table Of Contents Presentation Template
Infographic
Premium
Table Of Content Presentation Template
Infographic
Premium
Table of Words Slide Template
Infographic
Premium
Table of Contents Slide
Infographic
Premium
Table Of Contents Infographics
Infographic
Premium
Table Of Contents Infographic
Infographic
Premium
Table Of Contents For Presentation
Infographic
Premium
Table Of Contents Infographic
Infographic
Premium
Table Of Content Infographics
Infographic
Premium
Table Of Content Infographic
Infographic
Premium
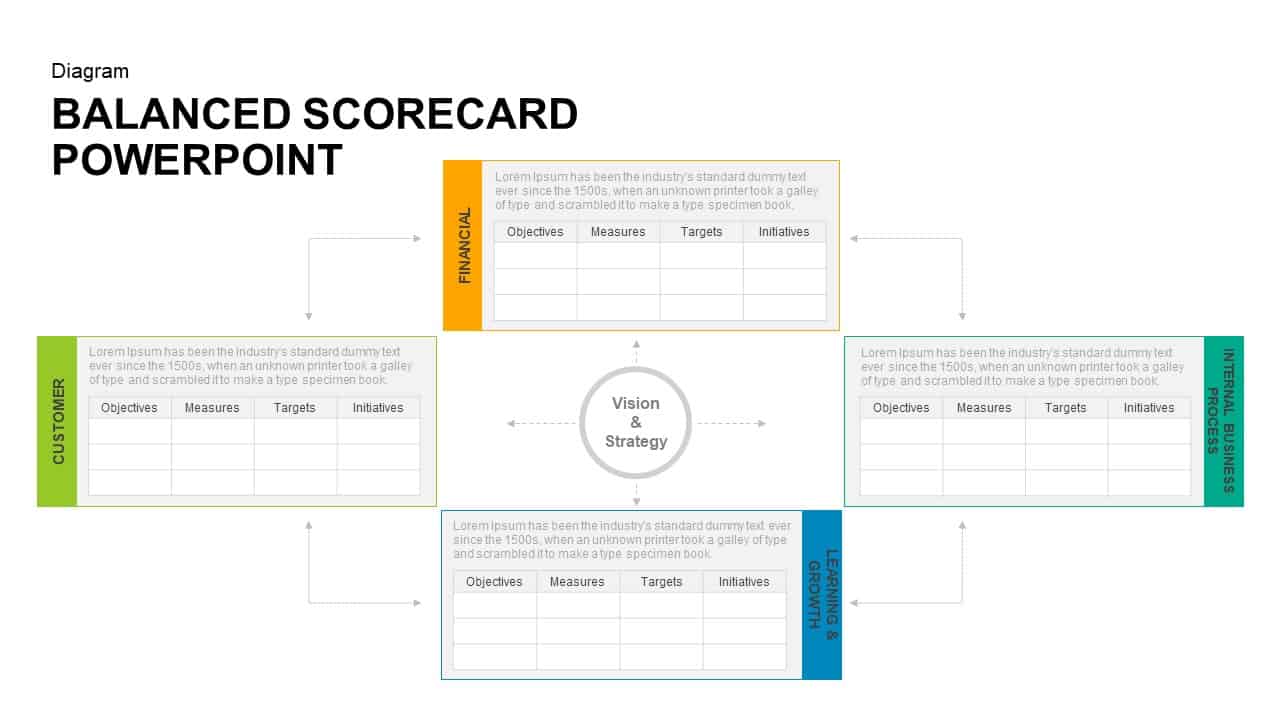
Balanced Scorecard PowerPoint Template and Keynote
Business Models
Premium
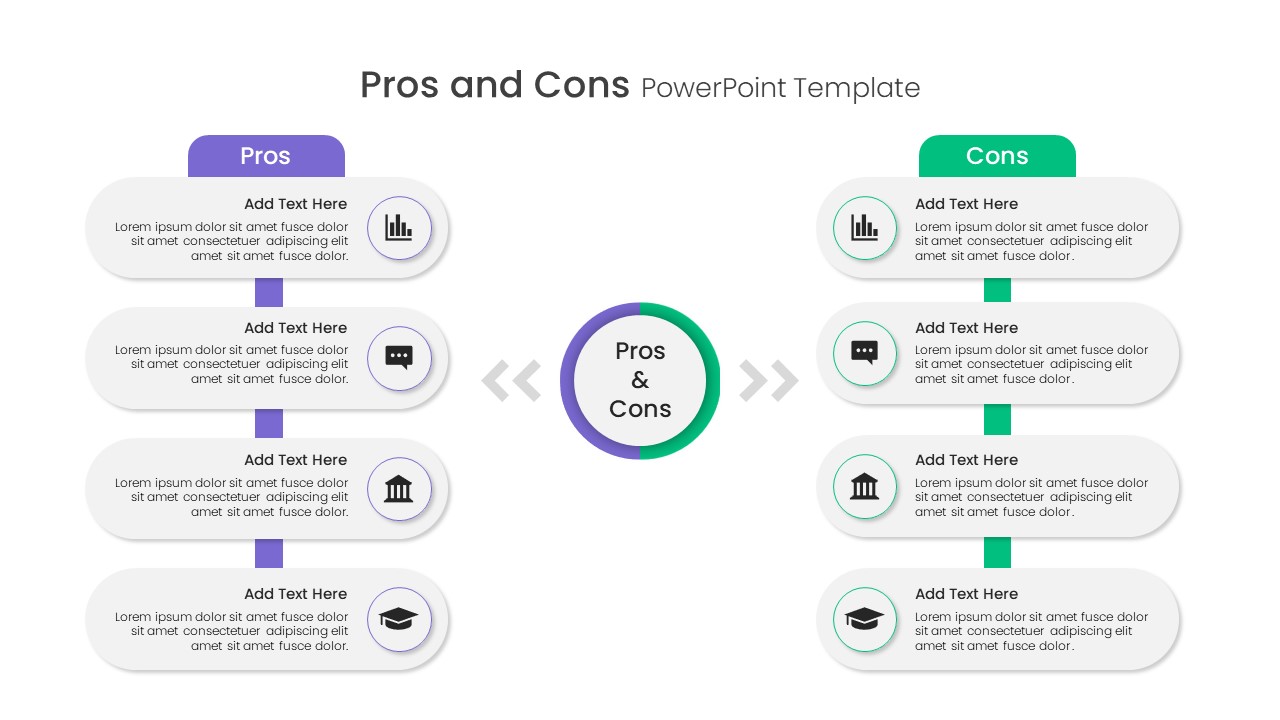
Free Pros And Cons PowerPoint Template
Infographic
Free
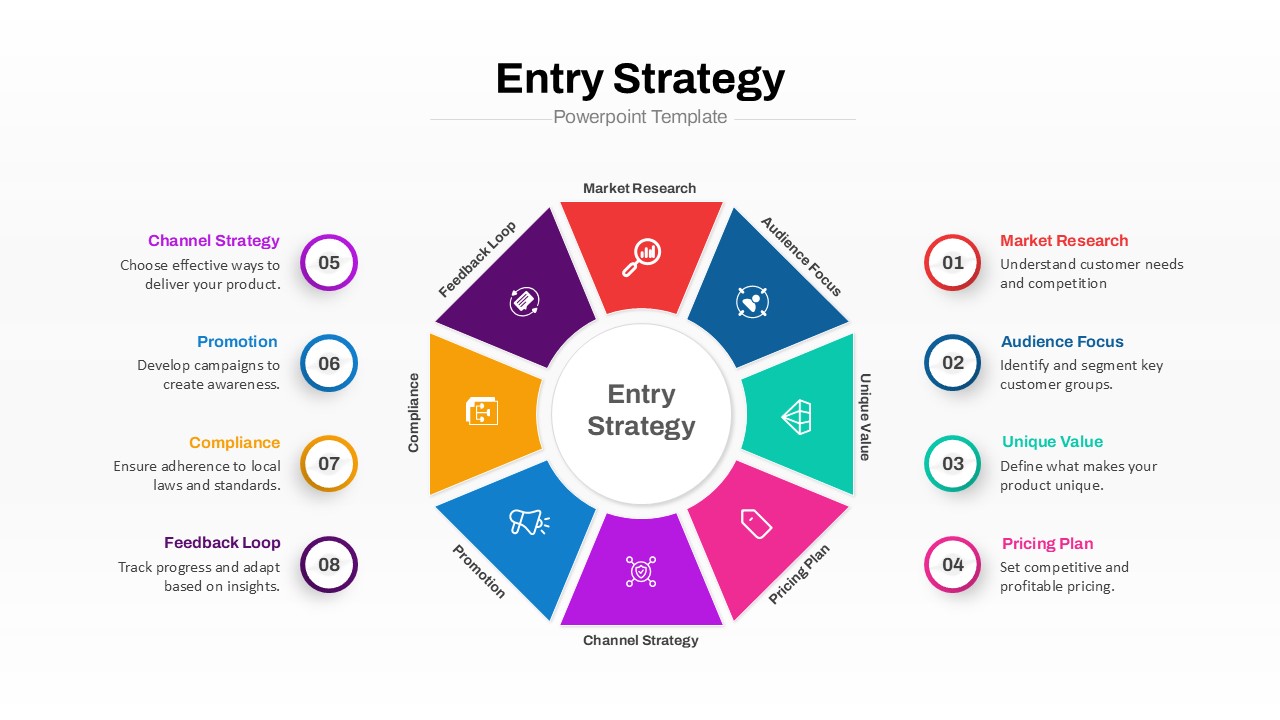
Market Entry Strategy PowerPoint Template
PowerPoint Templates
Premium
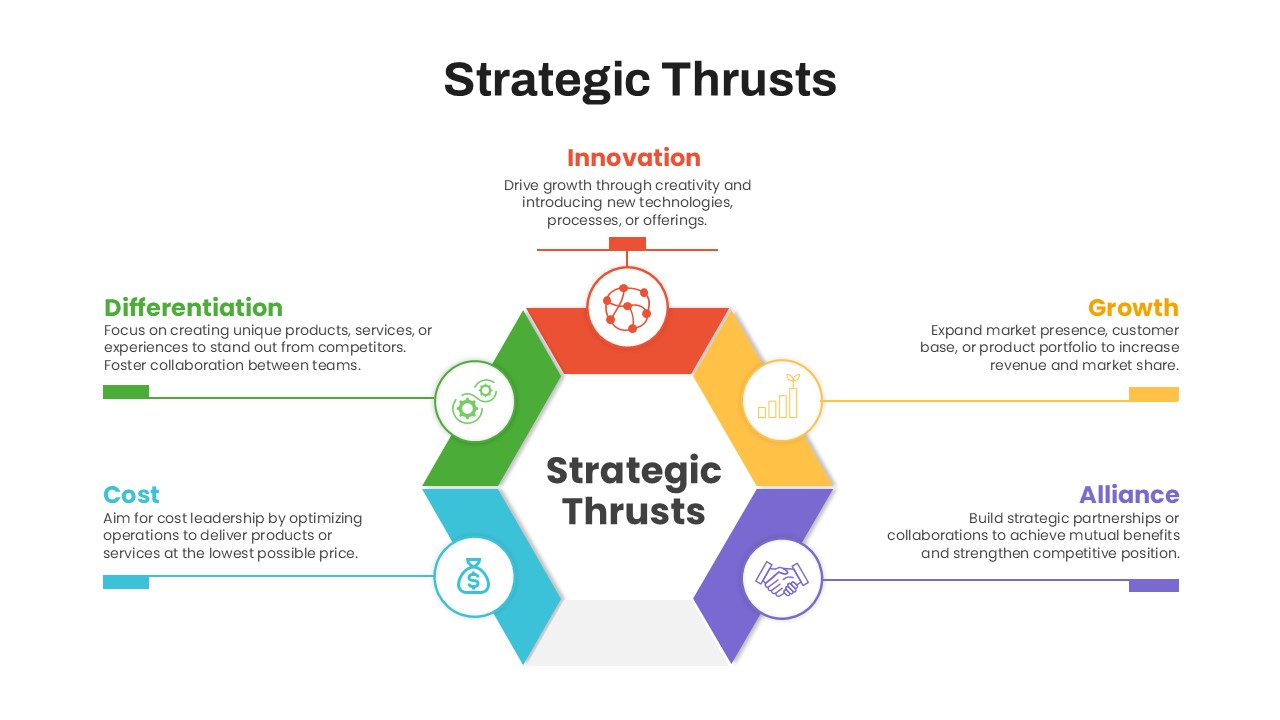
Strategic Thrust PowerPoint Template
PowerPoint Templates
Premium
Categories PowerPoint Template
Business PowerPoint Templates
Premium
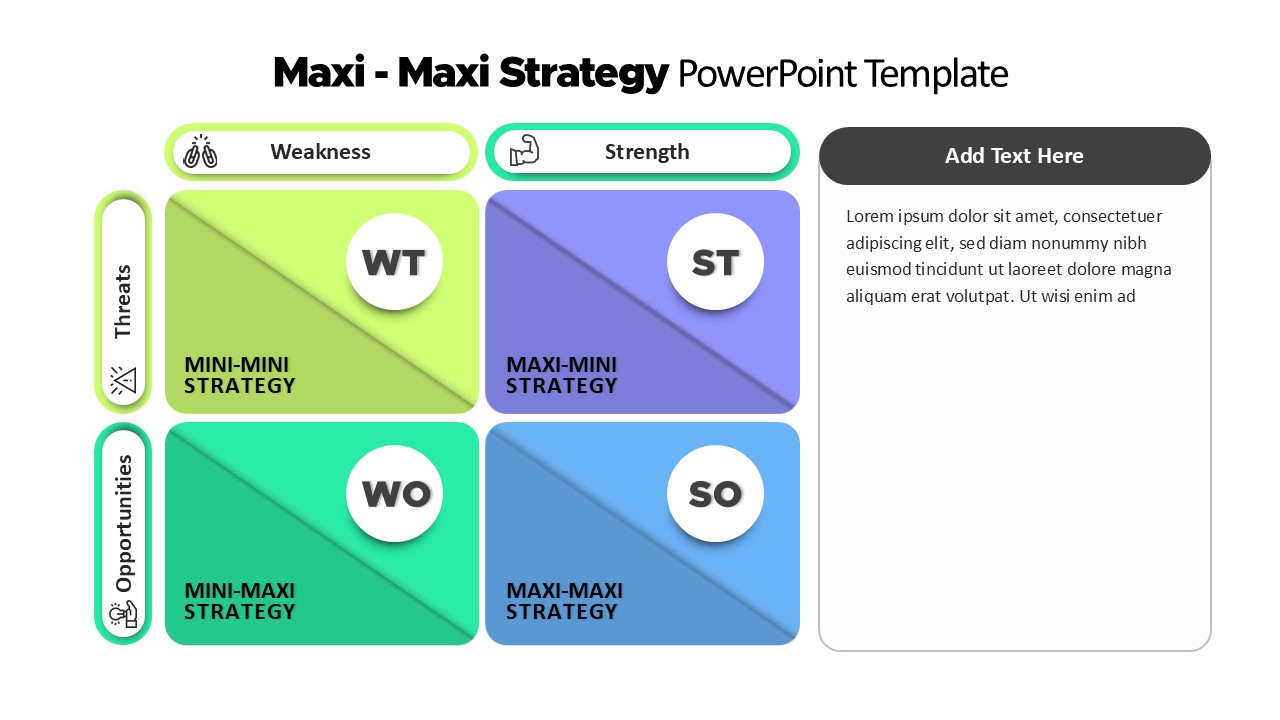
Maxi Maxi Strategy Template for PowerPoint
PowerPoint Templates
Premium
SWOT Analysis PowerPoint Template
Business PowerPoint Templates
Premium
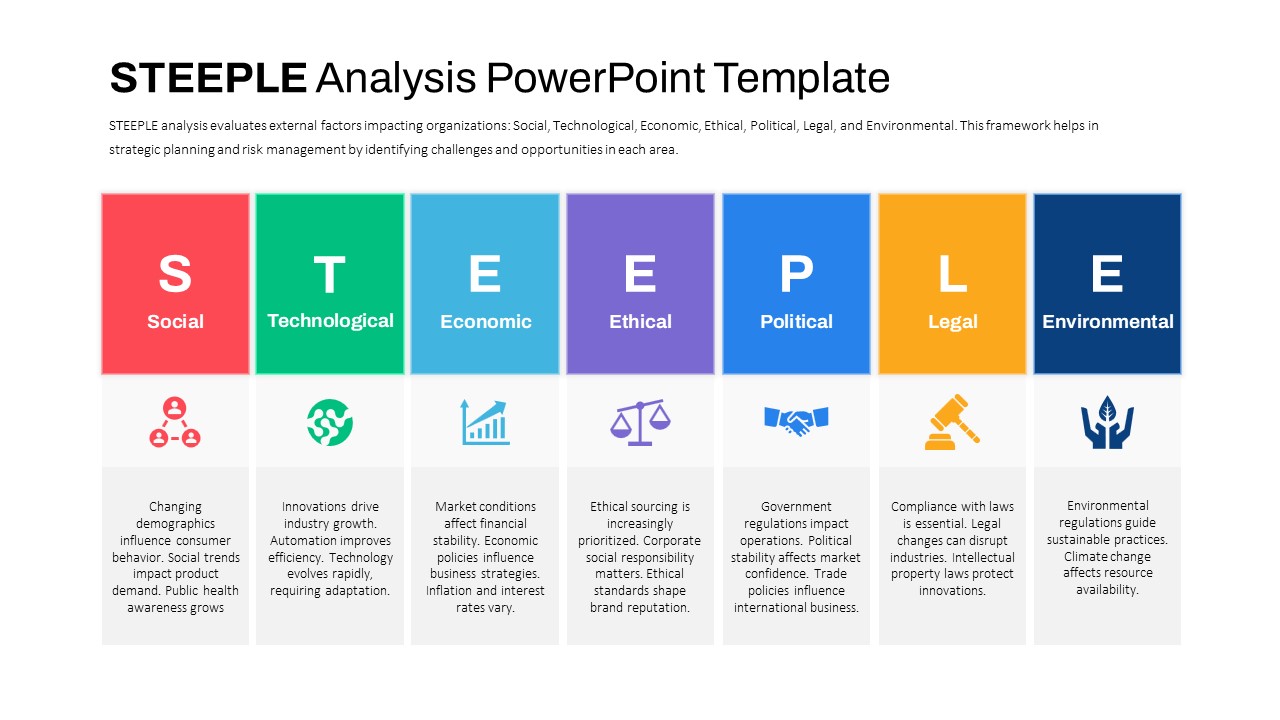
STEEPLE Analysis PowerPoint Template
PowerPoint Templates
Premium
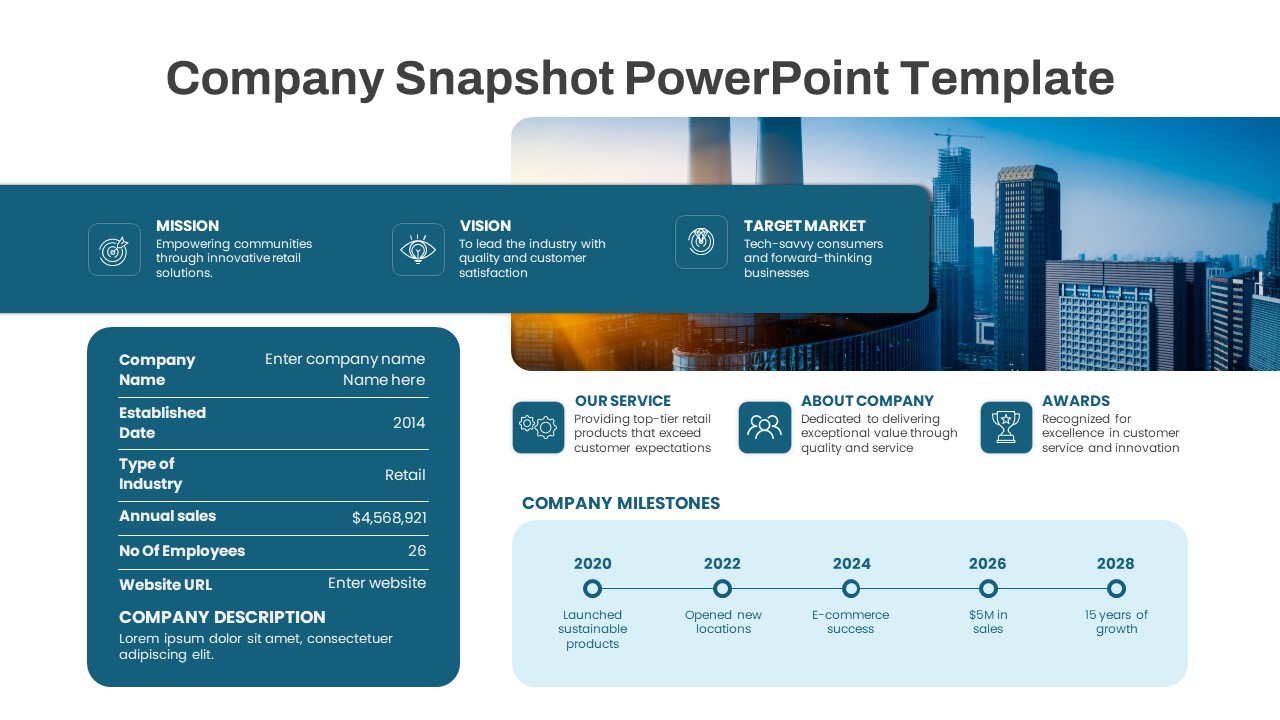
Company Snapshot PowerPoint Template
PowerPoint Templates
Premium
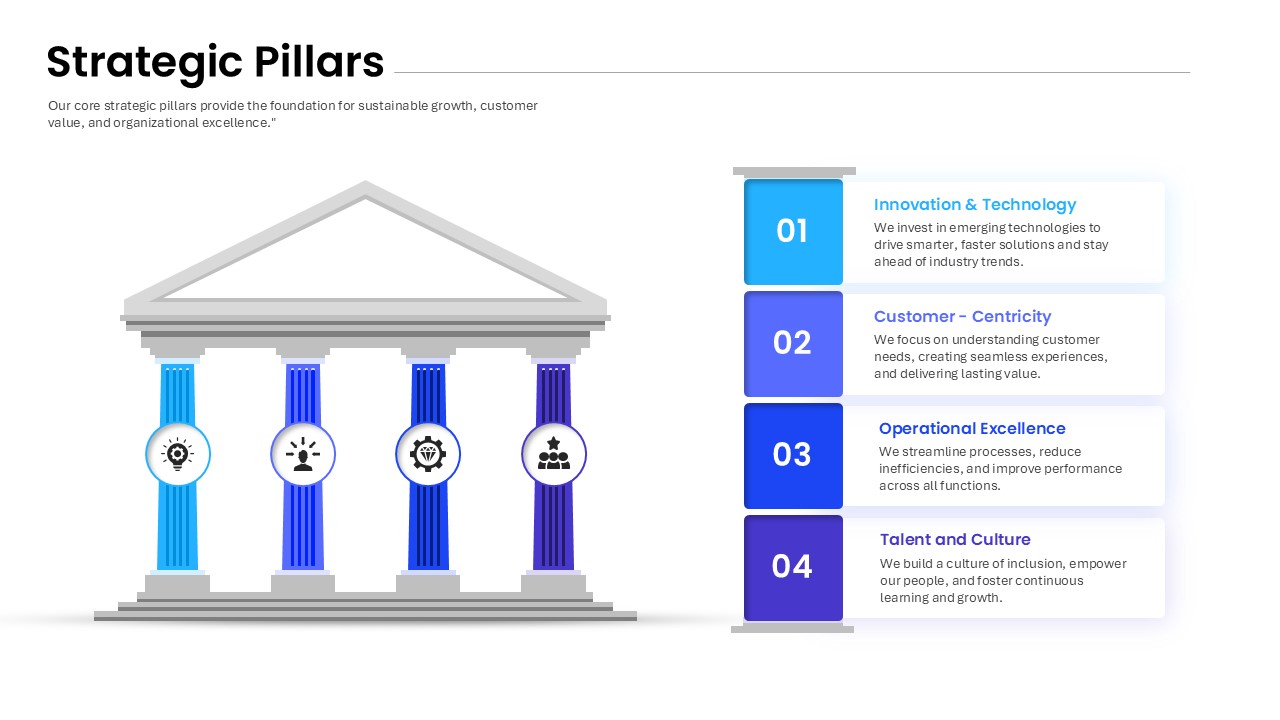
Strategic Pillars PowerPoint Template
PowerPoint Templates
Premium
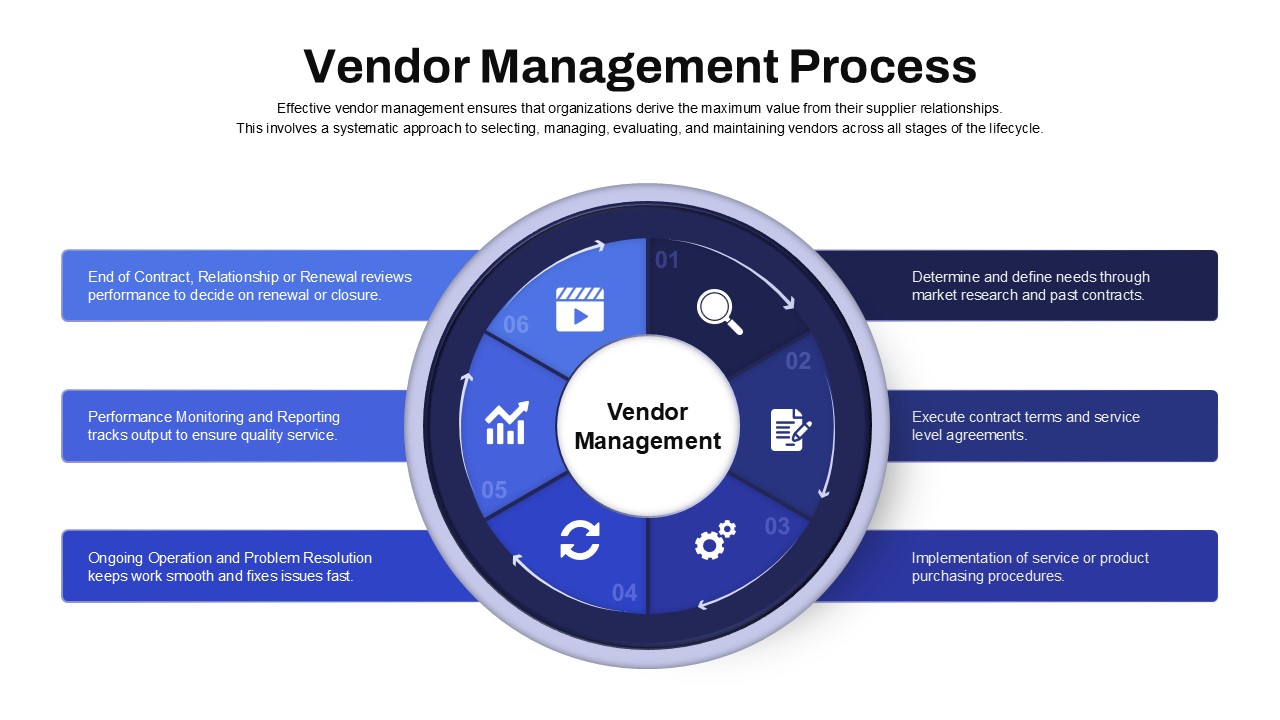
Vendor Management PowerPoint Template
PowerPoint Templates
Premium
2 Sides of a Coin PowerPoint Template
PowerPoint Templates
Premium
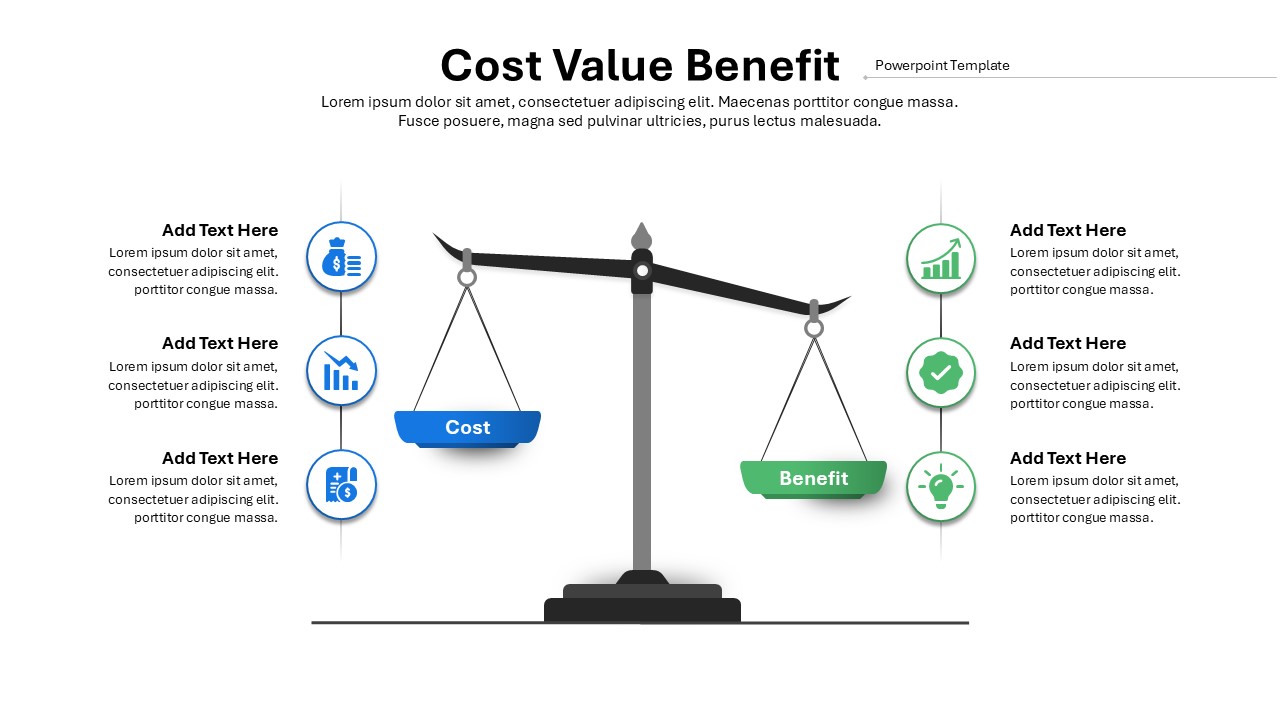
Cost Value Benefit PowerPoint Template
Business PowerPoint Templates
Premium
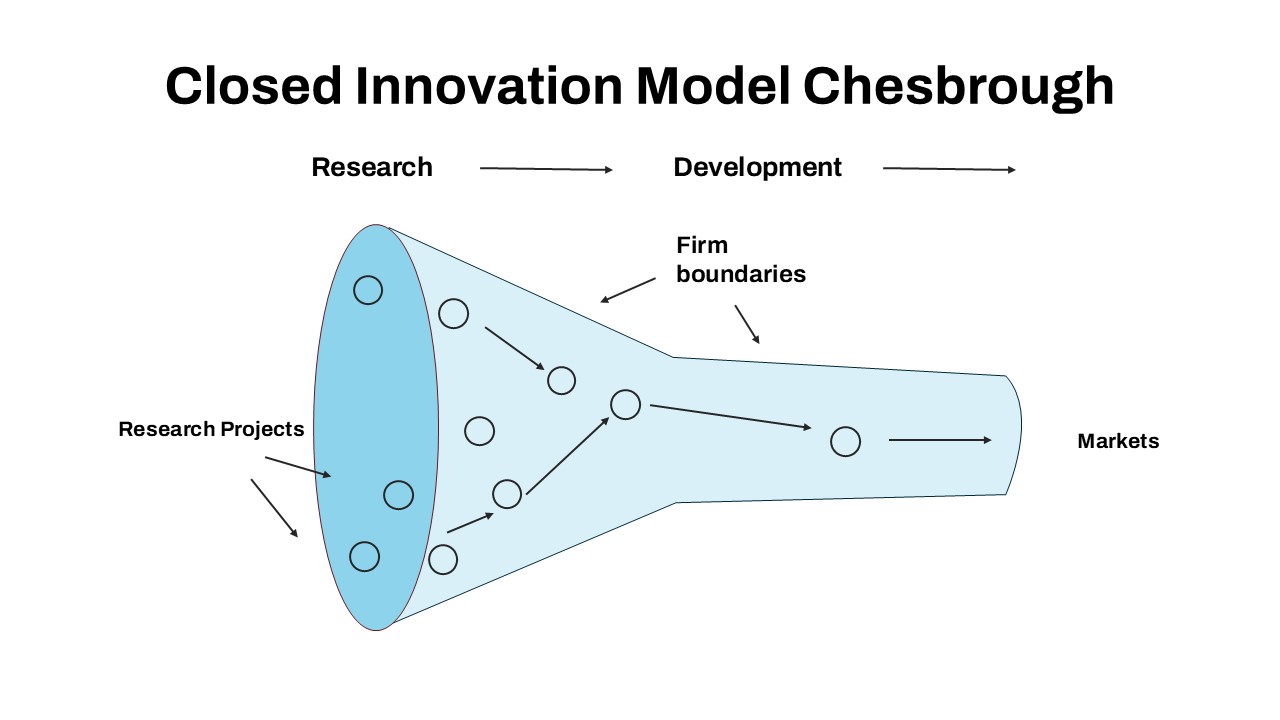
Closed Innovation Model Chesbrough PowerPoint Template
Business PowerPoint Templates
Premium
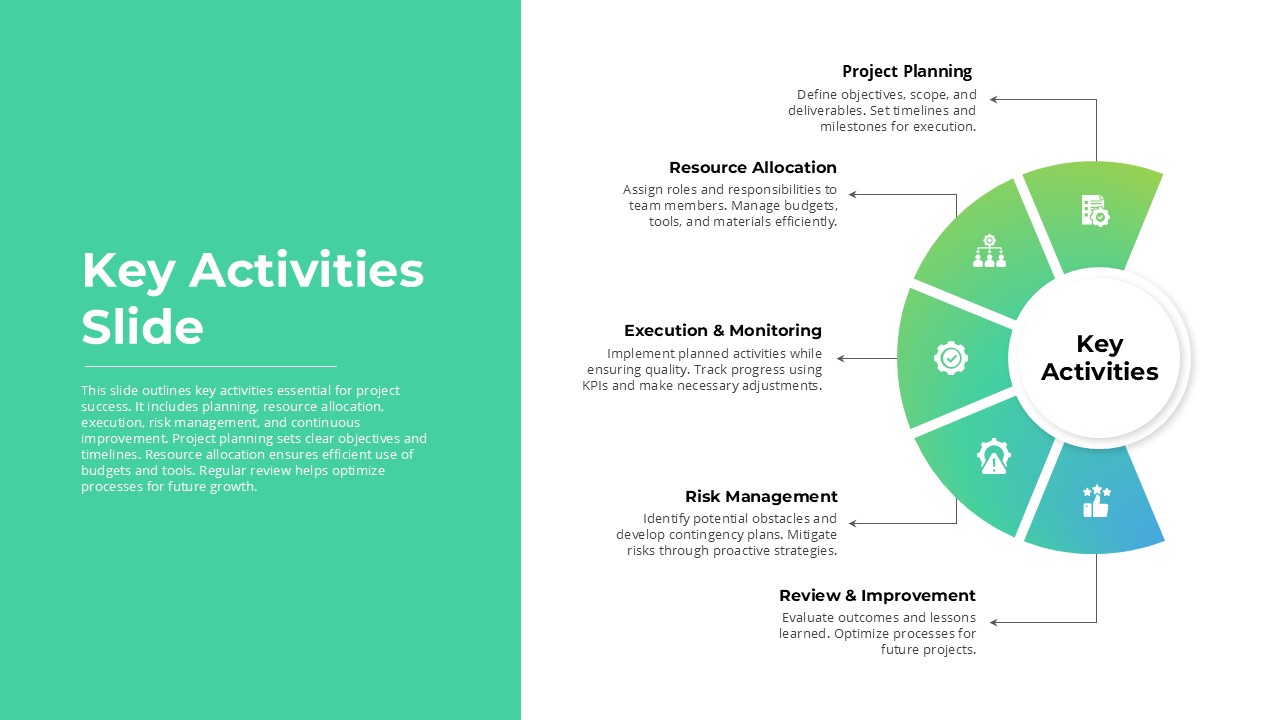
Key Activities Slide PowerPoint Template
Diagrams
Premium
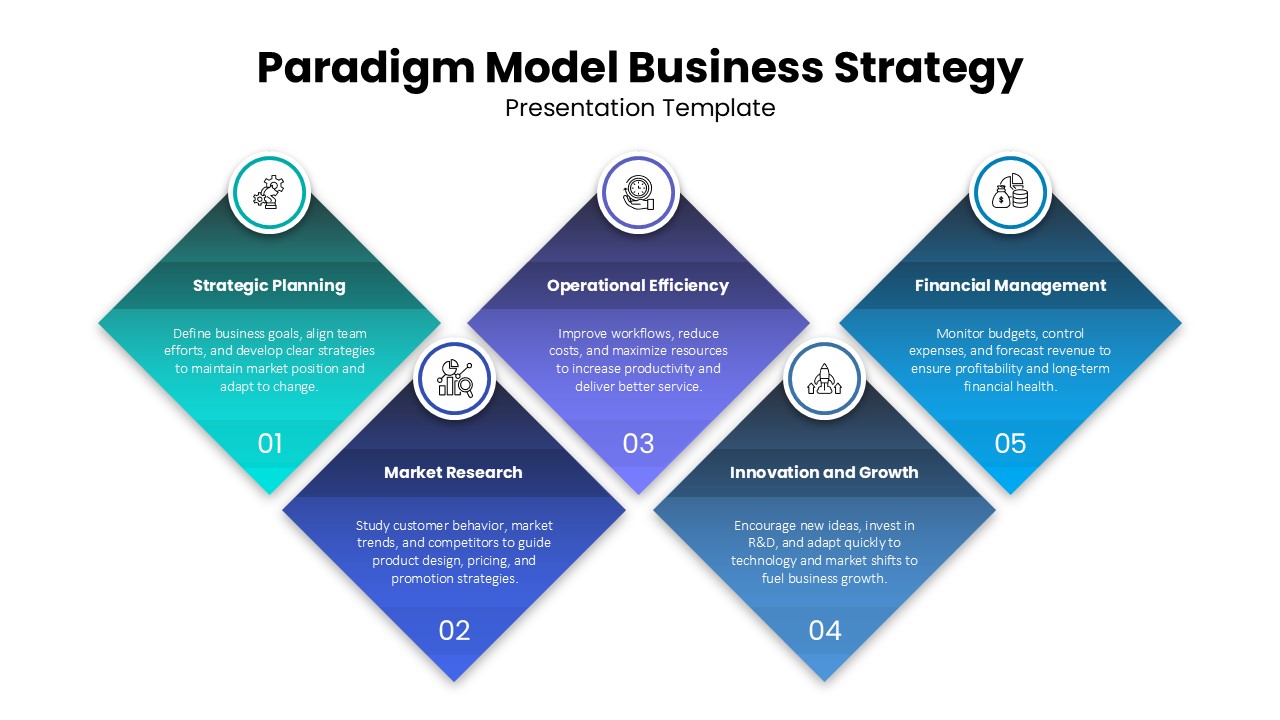
Paradigm Model Business Strategy Presentation Template
Business PowerPoint Templates
Premium
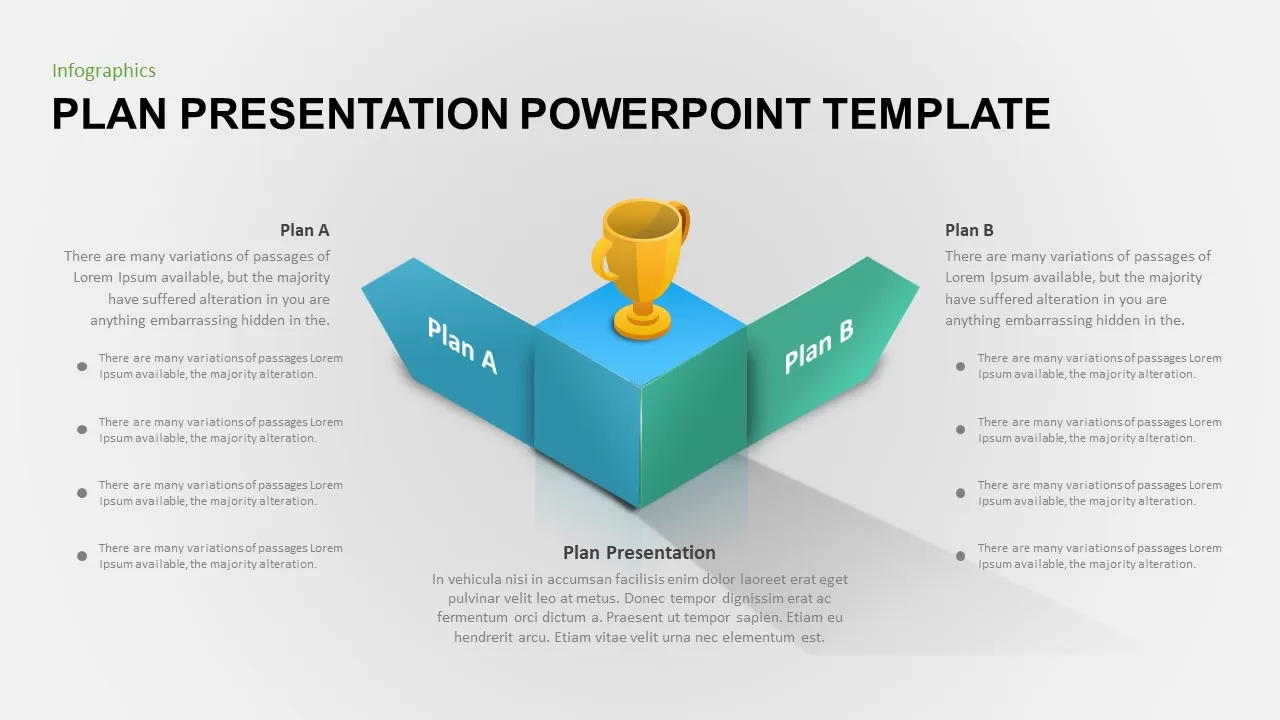
Business Plan Presentation PowerPoint Template
Business Models
Premium
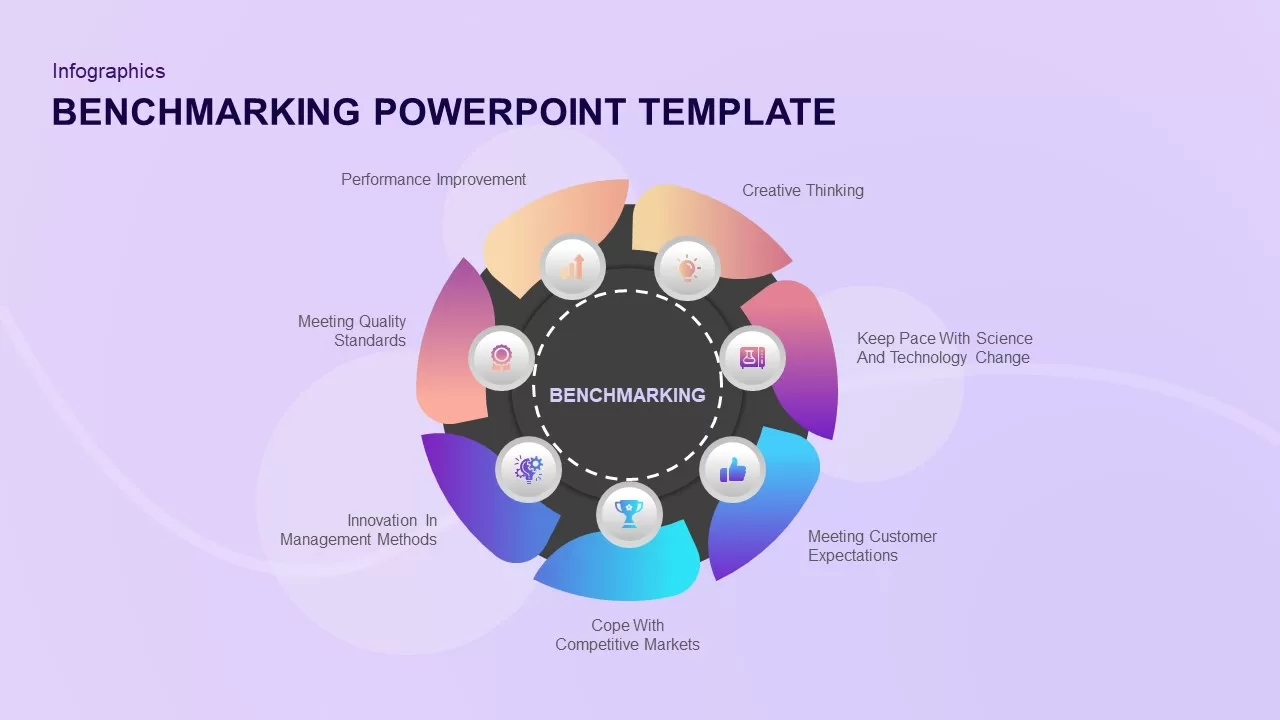
Benchmarking PowerPoint Template
Circular Diagrams
Premium
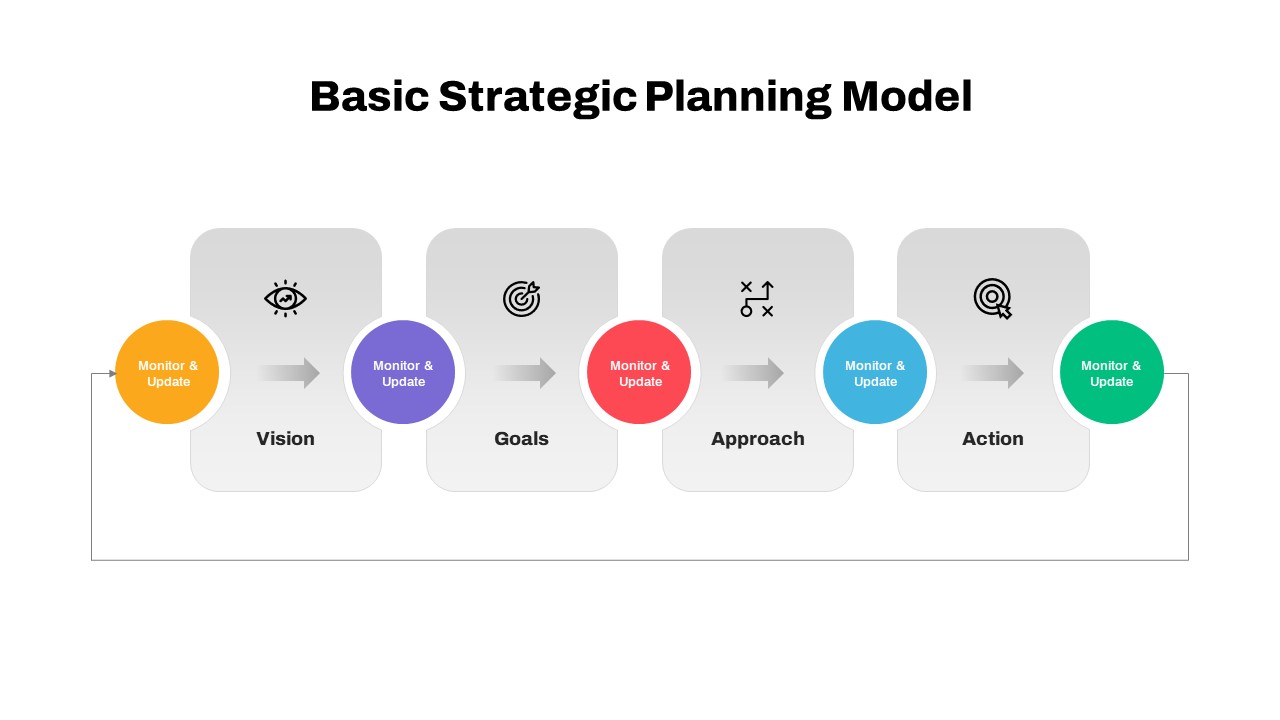
Basic Strategic Planning Model PowerPoint Template
PowerPoint Templates
Premium
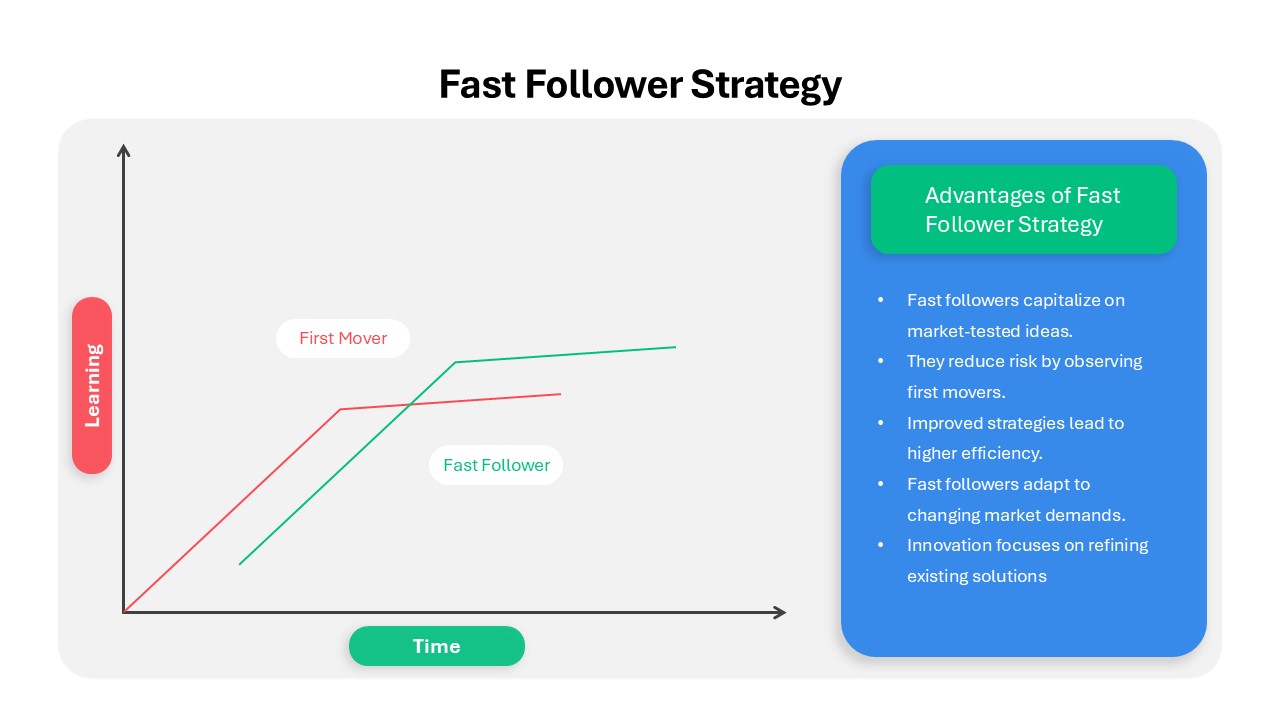
Fast Follower PowerPoint Template
PowerPoint Templates
Premium
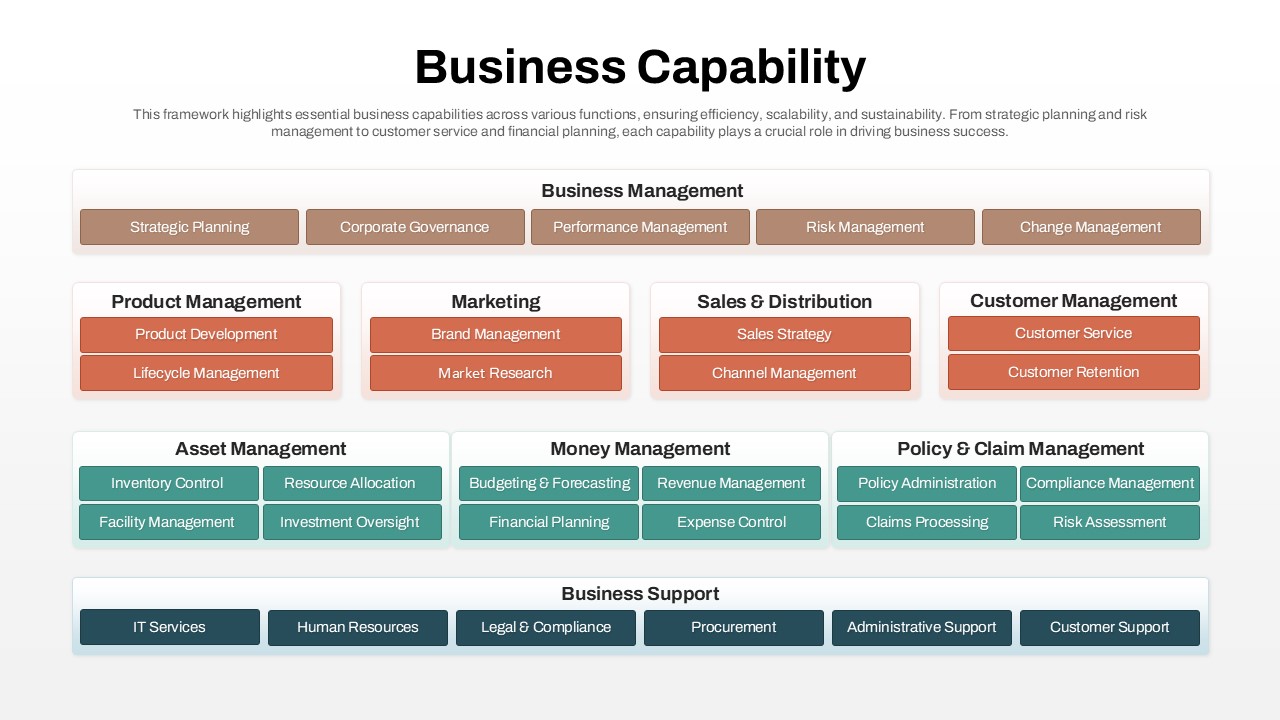
Business Capability PowerPoint Template
PowerPoint Templates
Premium
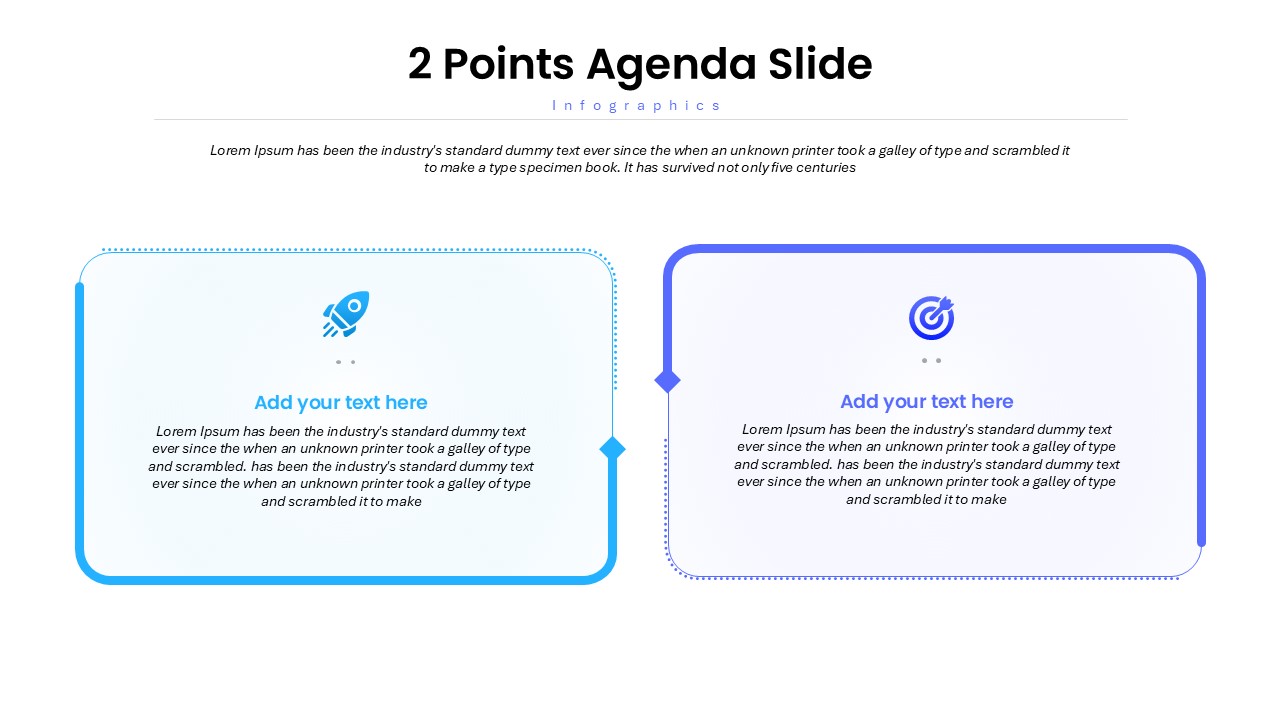
2 Points Agenda PowerPoint Template
PowerPoint Templates
Premium
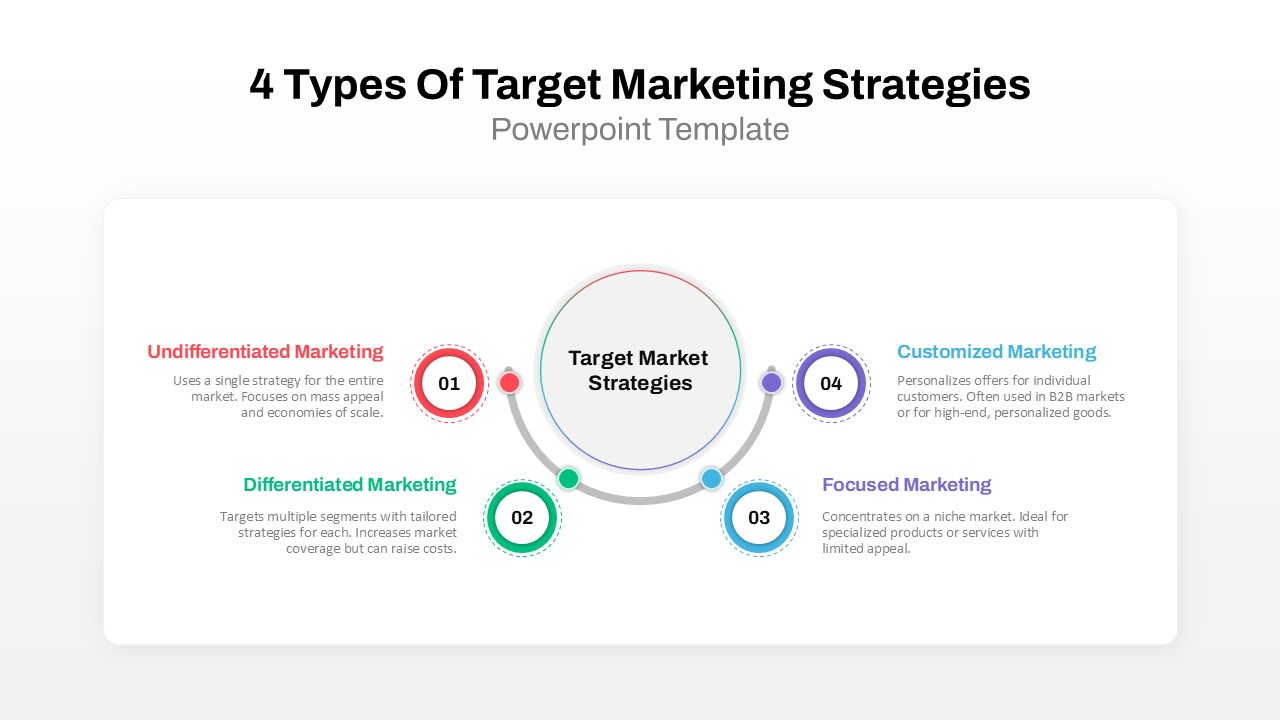
Target Marketing 4 Types PowerPoint Template
Business PowerPoint Templates
Premium