Research Gantt Chart template for PowerPoint & Google Slides

Description
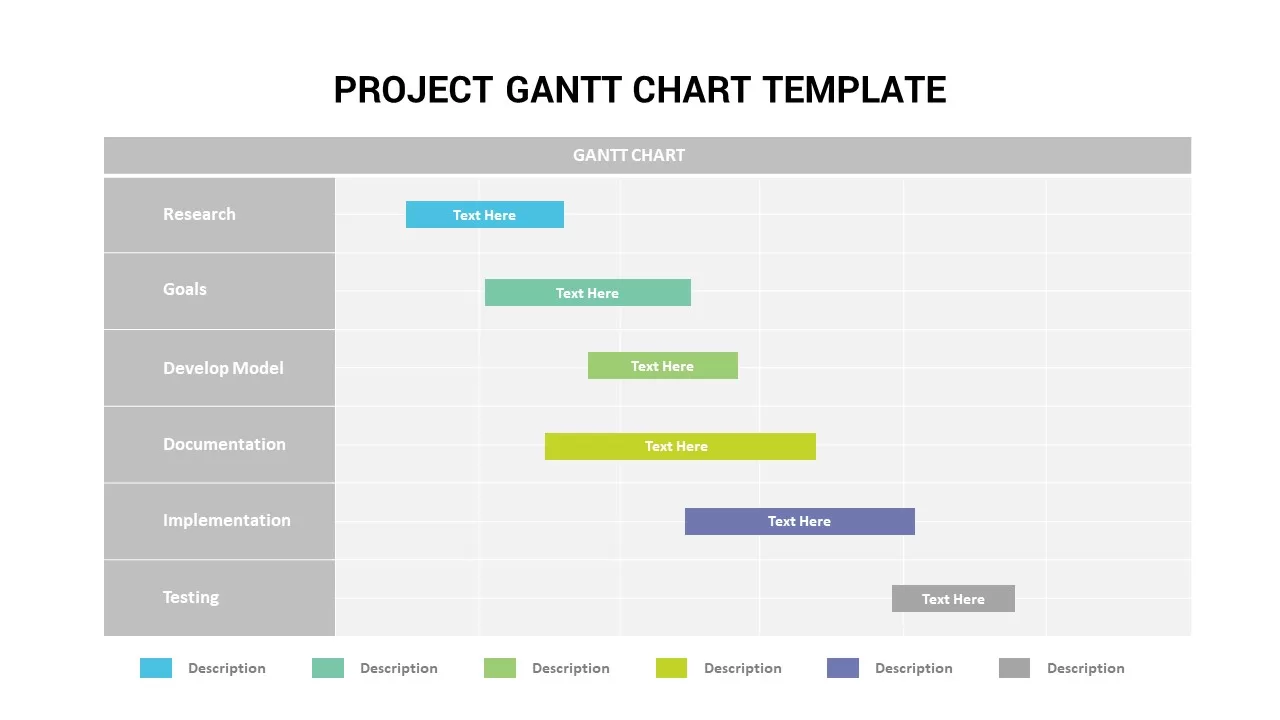
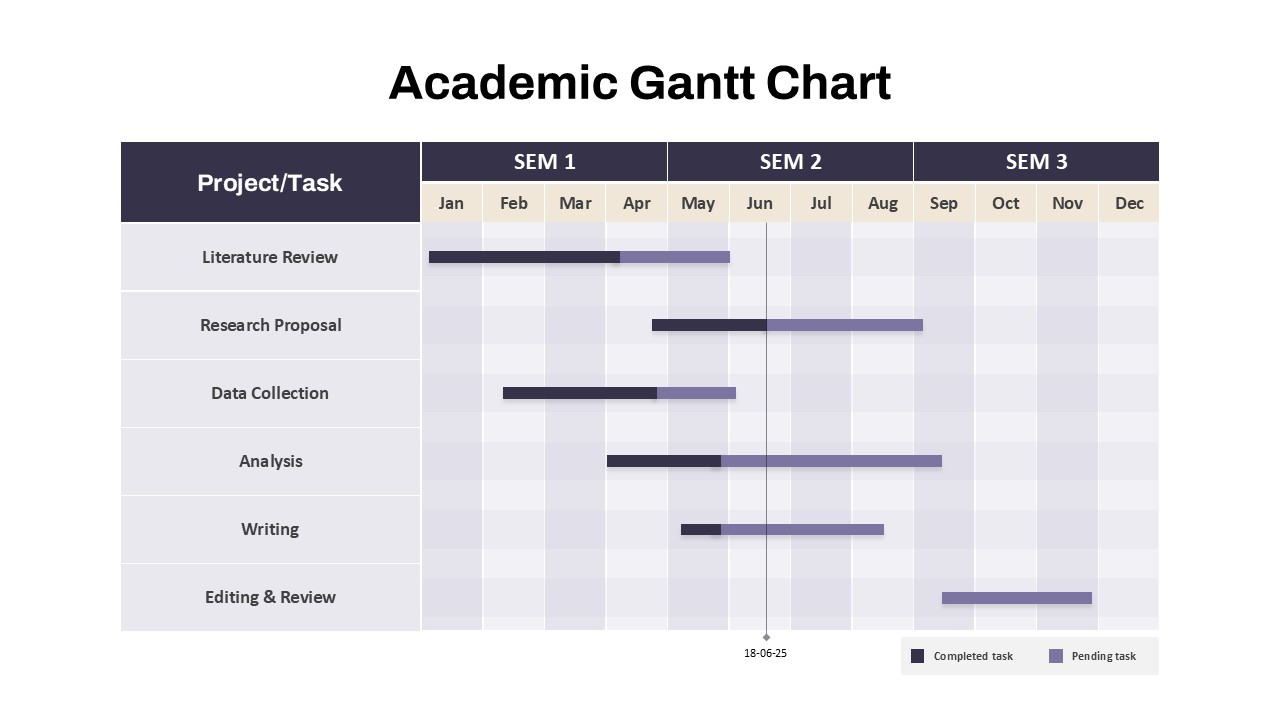
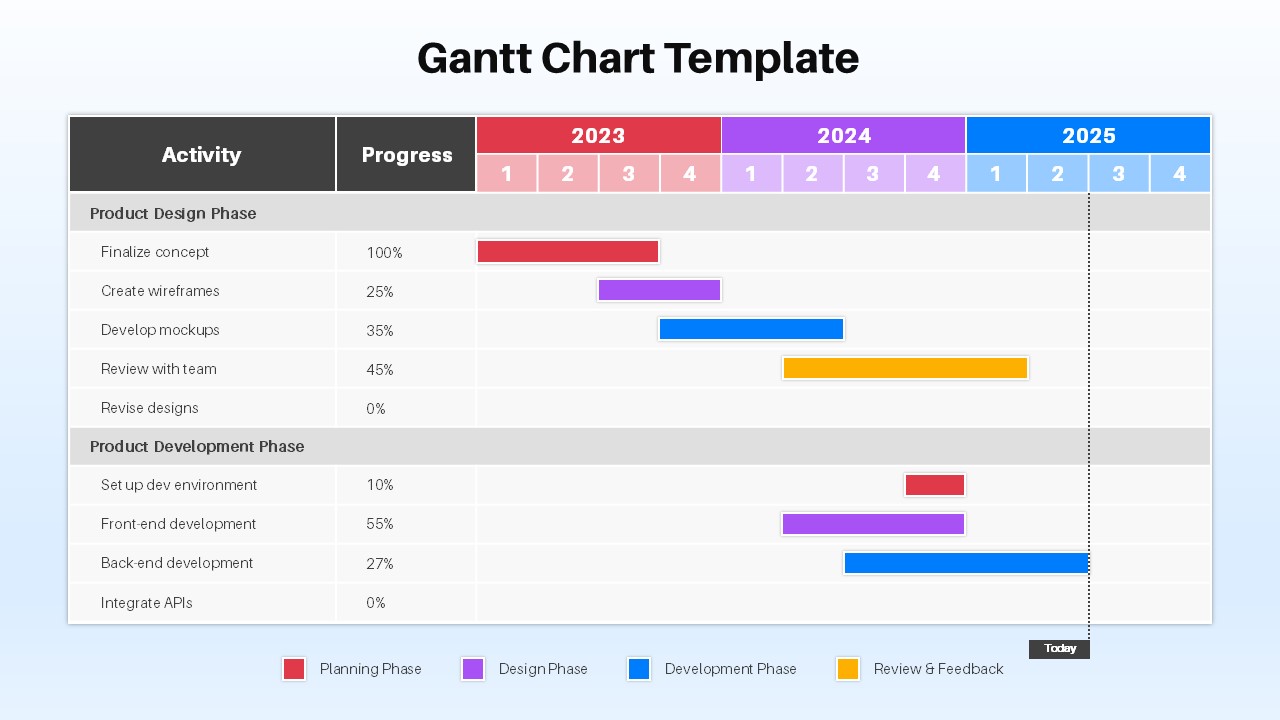
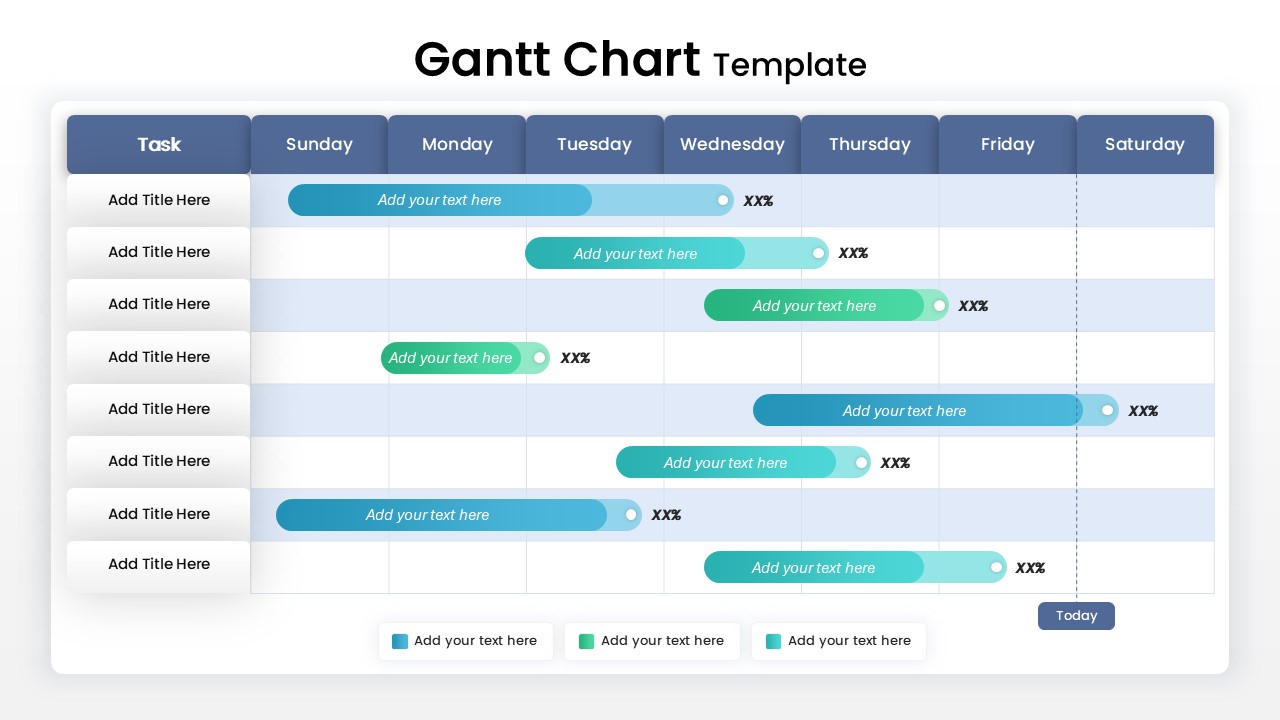
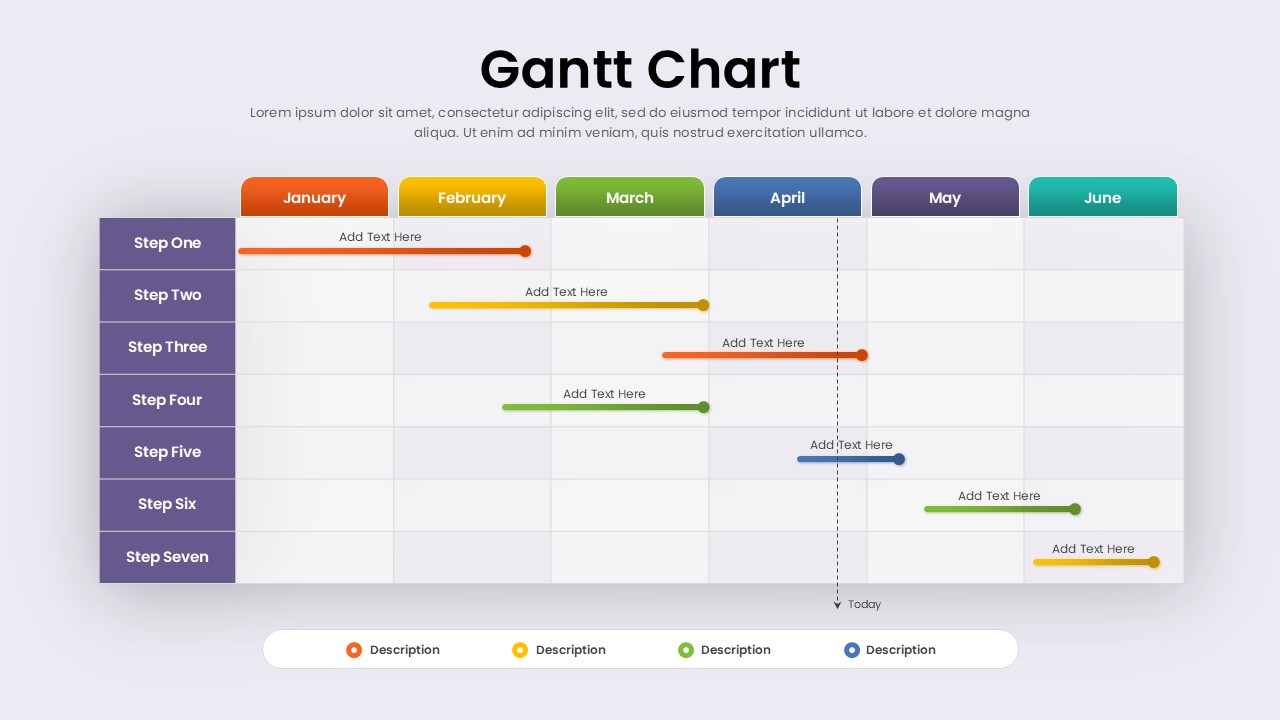
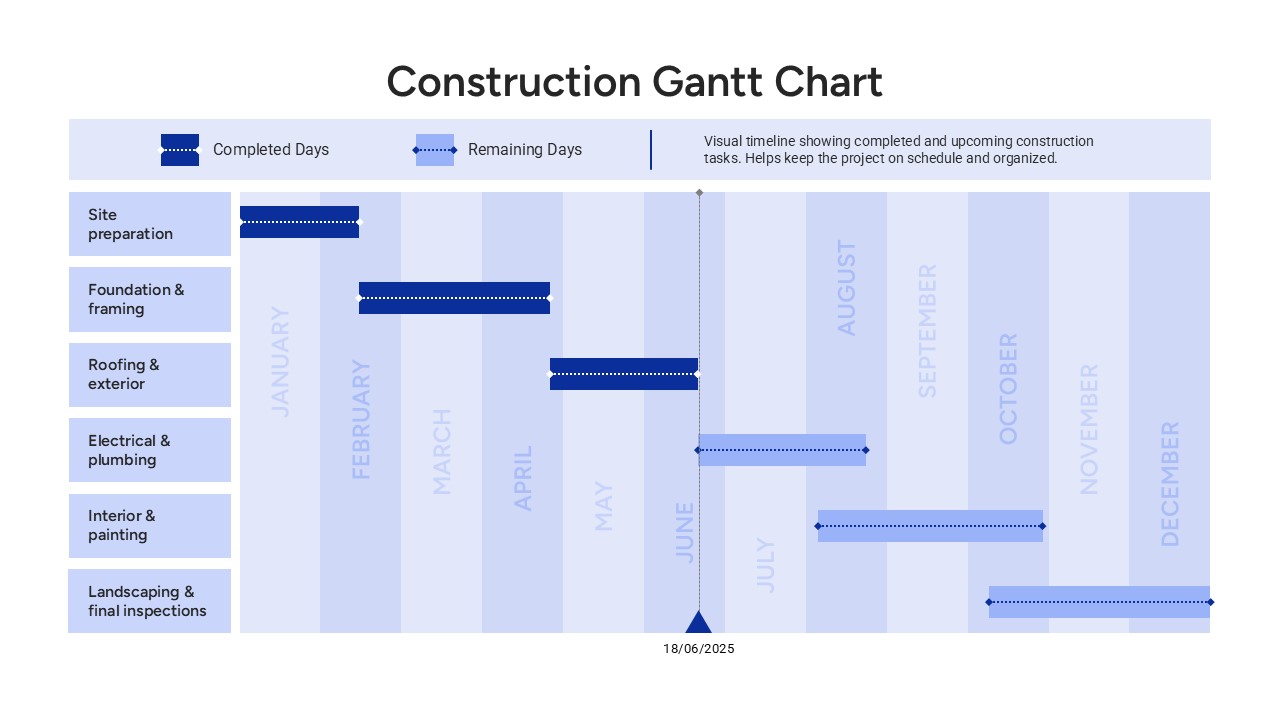
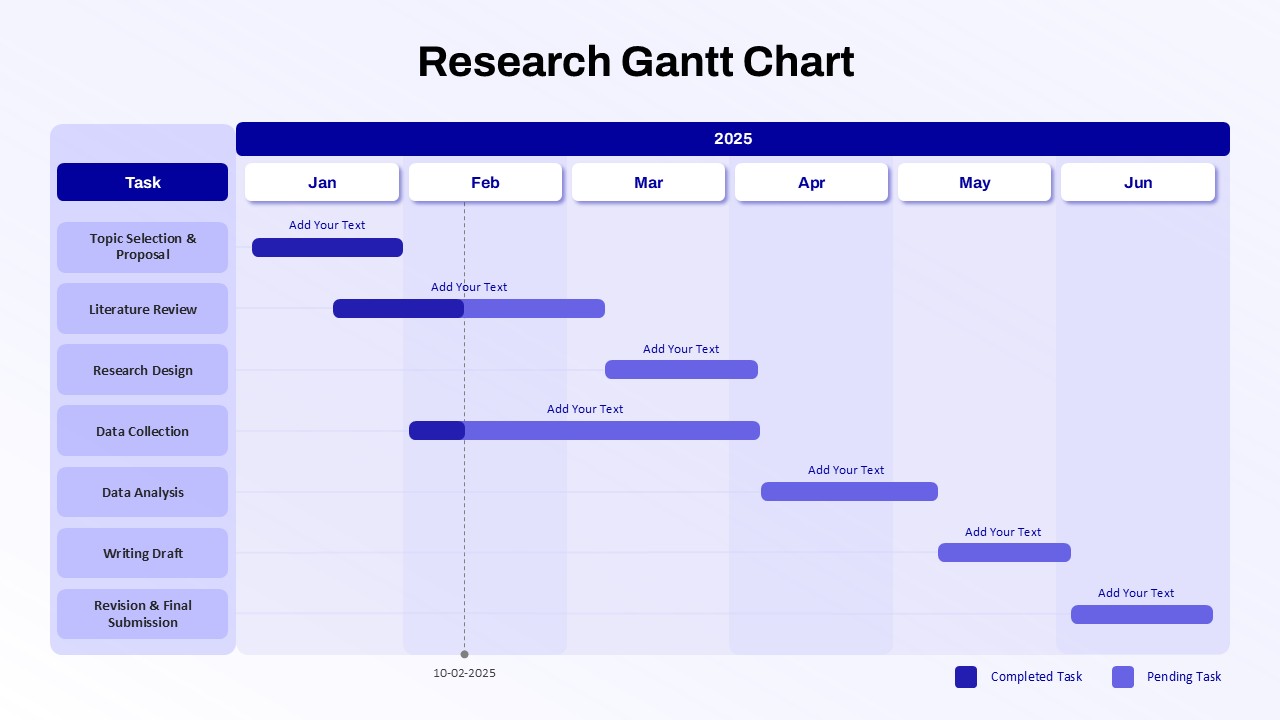
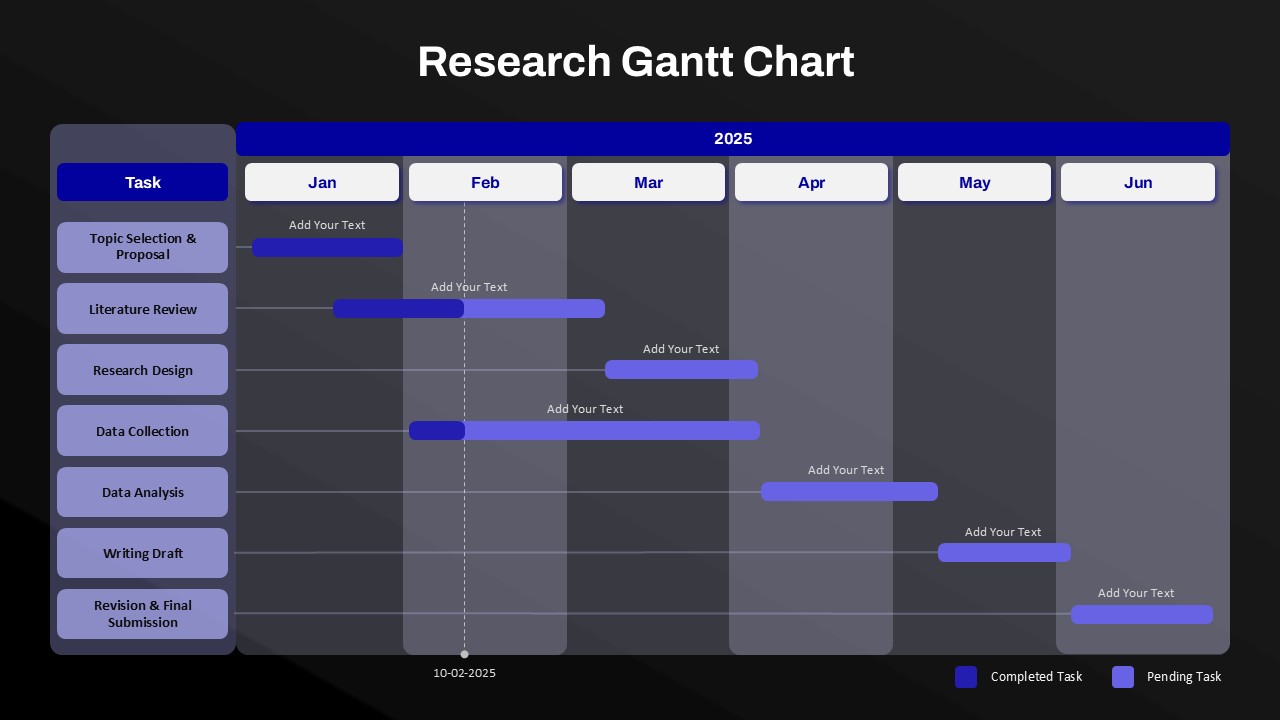
This Research Gantt Chart slide offers a clear, visually structured layout for tracking the progress of research tasks over a six-month period. Ideal for project management and academic settings, the slide includes key stages such as Topic Selection & Proposal, Literature Review, Research Design, Data Collection, Data Analysis, Writing Draft, and Revision & Final Submission. Each task is mapped to a specific timeline, providing a visual representation of the schedule with completed and pending tasks color-coded for clarity.
The purple and blue color scheme highlights the distinction between completed and pending tasks, ensuring easy monitoring of progress. The design is clean and professional, making it suitable for both academic research presentations and corporate project tracking. This customizable Gantt chart allows users to adjust task descriptions, dates, and progress markers, making it an ideal tool for managing timelines in research projects, thesis work, or any project with detailed phases.
By using this slide, users can streamline the communication of project milestones, manage deadlines effectively, and keep stakeholders aligned on progress. Whether you are managing a thesis, dissertation, or a complex research initiative, this Gantt chart provides an efficient way to visualize and update your project status.
Who is it for
This slide is perfect for researchers, students, project managers, and academics involved in managing long-term research projects. It is especially useful for those working on thesis, dissertation, or any research-driven projects that require a detailed timeline.
Other Uses
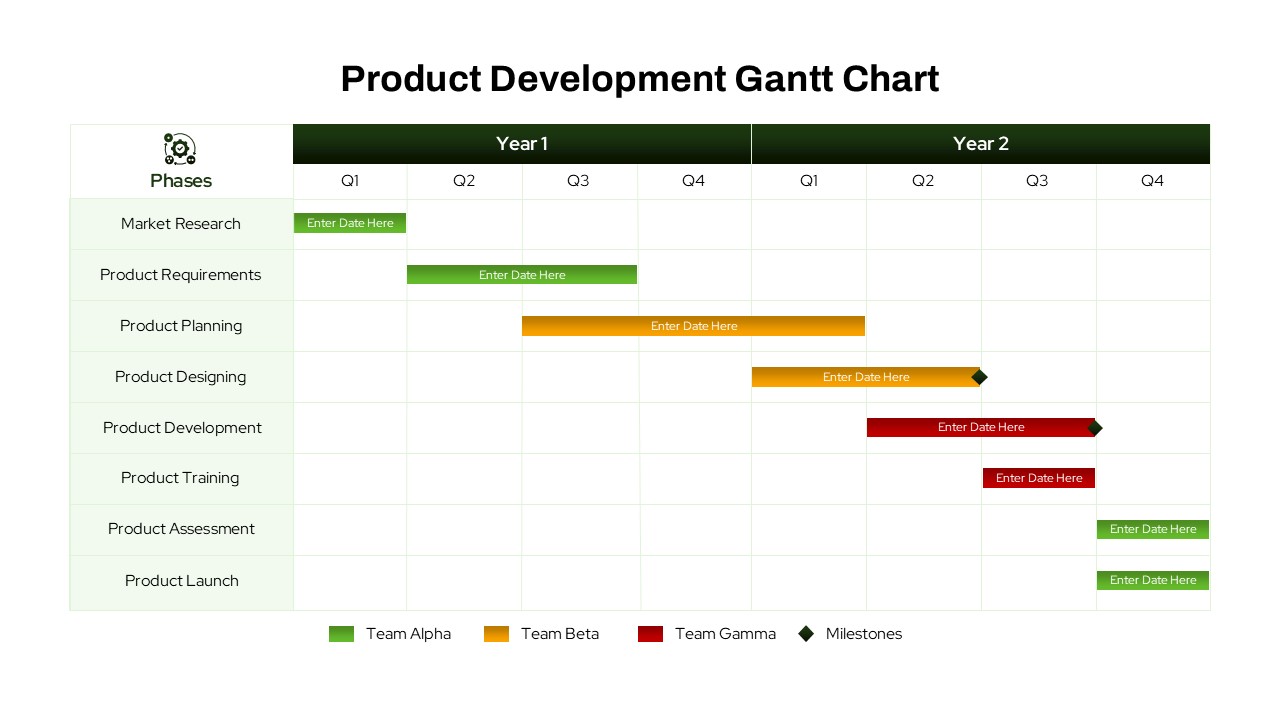
Beyond research projects, this Gantt chart template can be adapted for tracking other types of projects such as product development, business strategies, or event planning. The structure can be customized for any multi-phase project where task scheduling and tracking are required.
Login to download this file

Item ID
SB05141
Related Templates

Free Professional Gantt Chart Pack – 4 Slides Template for PowerPoint & Google Slides
Gantt Chart
Free
Creative Dynamic Gantt Chart Timeline Template for PowerPoint & Google Slides
Timeline

Fully Editable Gantt Chart Timeline template for PowerPoint & Google Slides
Gantt Chart

Product Roadmap Gantt Chart Timeline template for PowerPoint & Google Slides
Gantt Chart
Project Gantt Chart template for PowerPoint & Google Slides
Gantt Chart
Interactive Project Gantt Chart Timeline Template for PowerPoint & Google Slides
Gantt Chart
Annual Project Gantt Chart Timeline Template for PowerPoint & Google Slides
Gantt Chart
Project Gantt Chart Template for PowerPoint & Google Slides
Gantt Chart
Overlapping Timeline Gantt Chart Diagram Template for PowerPoint & Google Slides
Timeline
Project Tracker Timeline Gantt Chart Template for PowerPoint & Google Slides
Project Status
Baseline vs Actual Gantt Chart Template for PowerPoint & Google Slides
Gantt Chart
Weekly Gantt Chart Project Timeline Template for PowerPoint & Google Slides
Gantt Chart
Event Planning Gantt Chart template for PowerPoint & Google Slides
Business
Color-Coded Gantt Chart template for PowerPoint & Google Slides
Business
Team Gantt Chart Overview template for PowerPoint & Google Slides
Project Status
Academic Gantt Chart template for PowerPoint & Google Slides
Business
Stacked Gantt Chart Timeline Slide Template for PowerPoint & Google Slides
Gantt Chart
Product Development Gantt Chart template for PowerPoint & Google Slides
Gantt Chart
Static Gantt Chart Overview template for PowerPoint & Google Slides
Project Status
Bar Gantt Chart Template for PowerPoint & Google Slides
Gantt Chart
Project Gantt Chart Template for PowerPoint & Google Slides
Gantt Chart
Green Gantt Chart Template for PowerPoint & Google Slides
Gantt Chart
Project Timeline Gantt Chart Template for PowerPoint & Google Slides
Gantt Chart
Colorful Annual Gantt Chart Project Planner Template for PowerPoint & Google Slides
Gantt Chart
Weekly Gantt Chart with Milestones Template for PowerPoint & Google Slides
Gantt Chart
7 Step 6 Month Gantt Chart Timeline Template for PowerPoint & Google Slides
Gantt Chart
Yearly Gantt Chart with Presentation Template for PowerPoint & Google Slides
Gantt Chart
Quarterly Gantt Chart with Today Marker Template for PowerPoint & Google Slides
Gantt Chart
Colorful Annual Gantt Chart Timeline Template for PowerPoint & Google Slides
Gantt Chart
Half Year Gantt Chart Templat for PowerPoint & Google Slides
Gantt Chart
Construction Gantt Chart Template
Gantt Chart

Magnifying Glass Research Metaphor Template for PowerPoint & Google Slides
Process
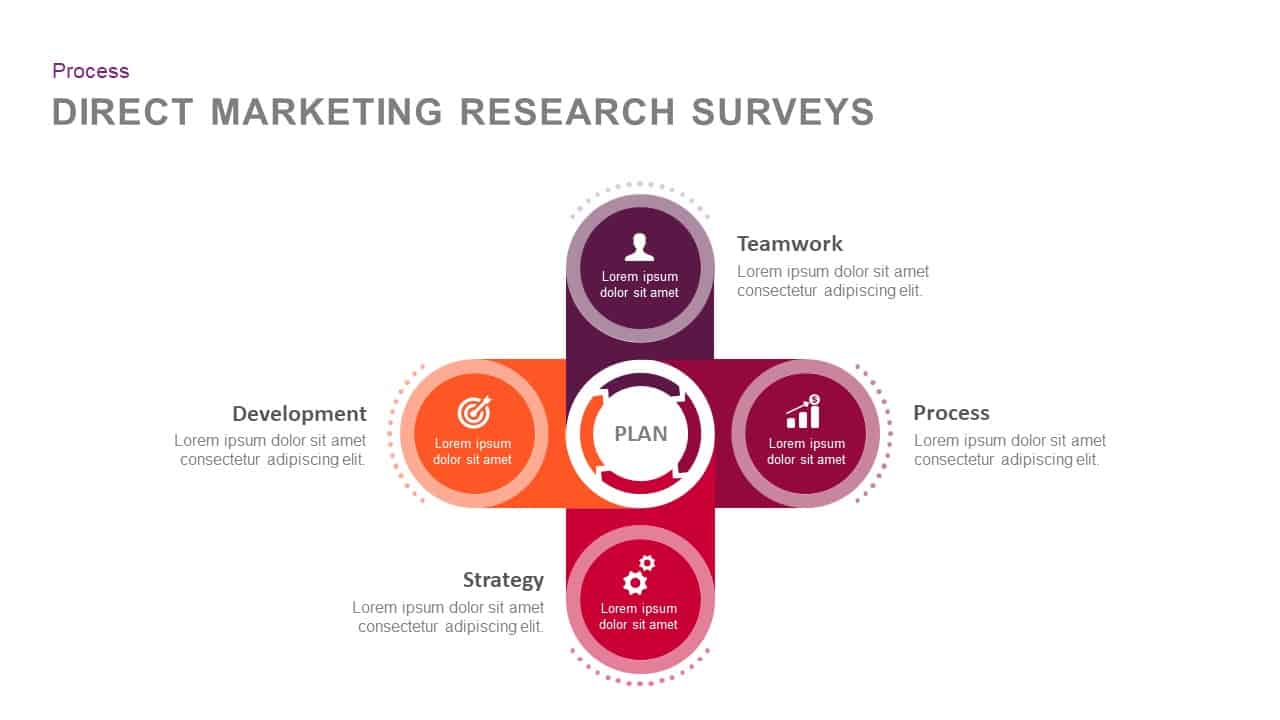
Direct Marketing Research Surveys template for PowerPoint & Google Slides
Marketing

Modern Biotechnology Services & Research Template for PowerPoint & Google Slides
Health
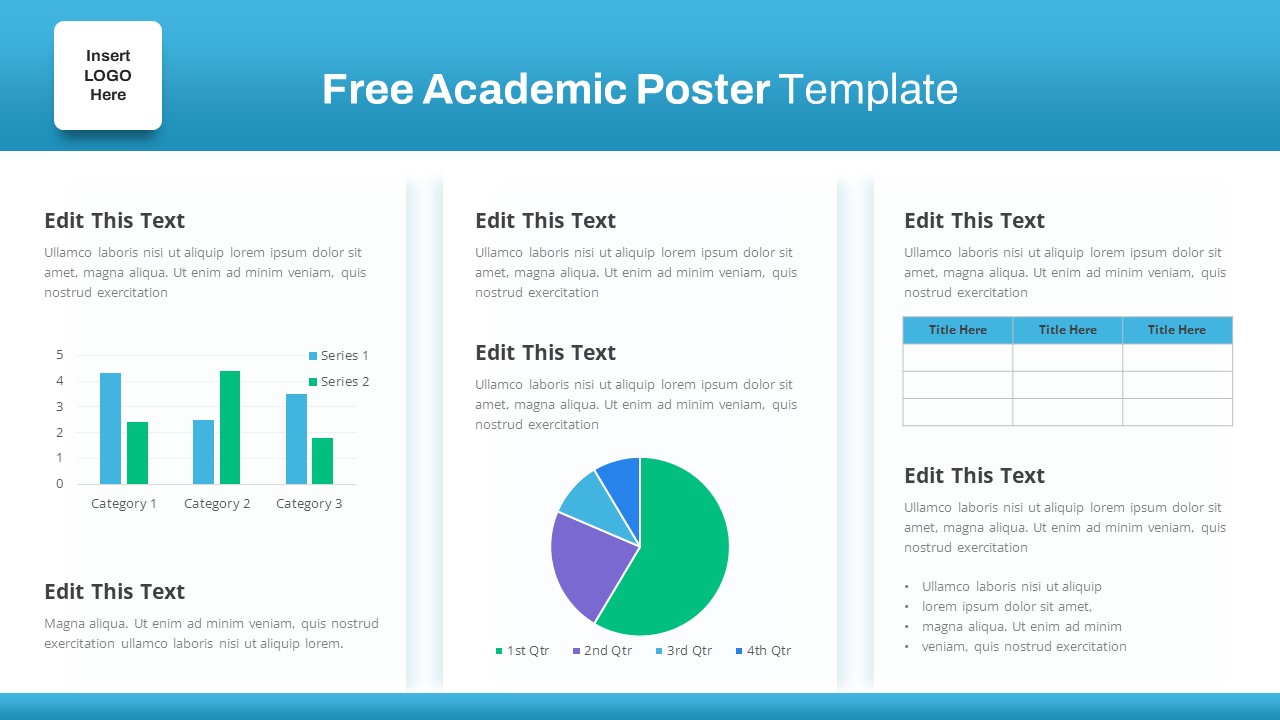
Free Academic Research Poster Design Template for PowerPoint & Google Slides
Bar/Column
Free
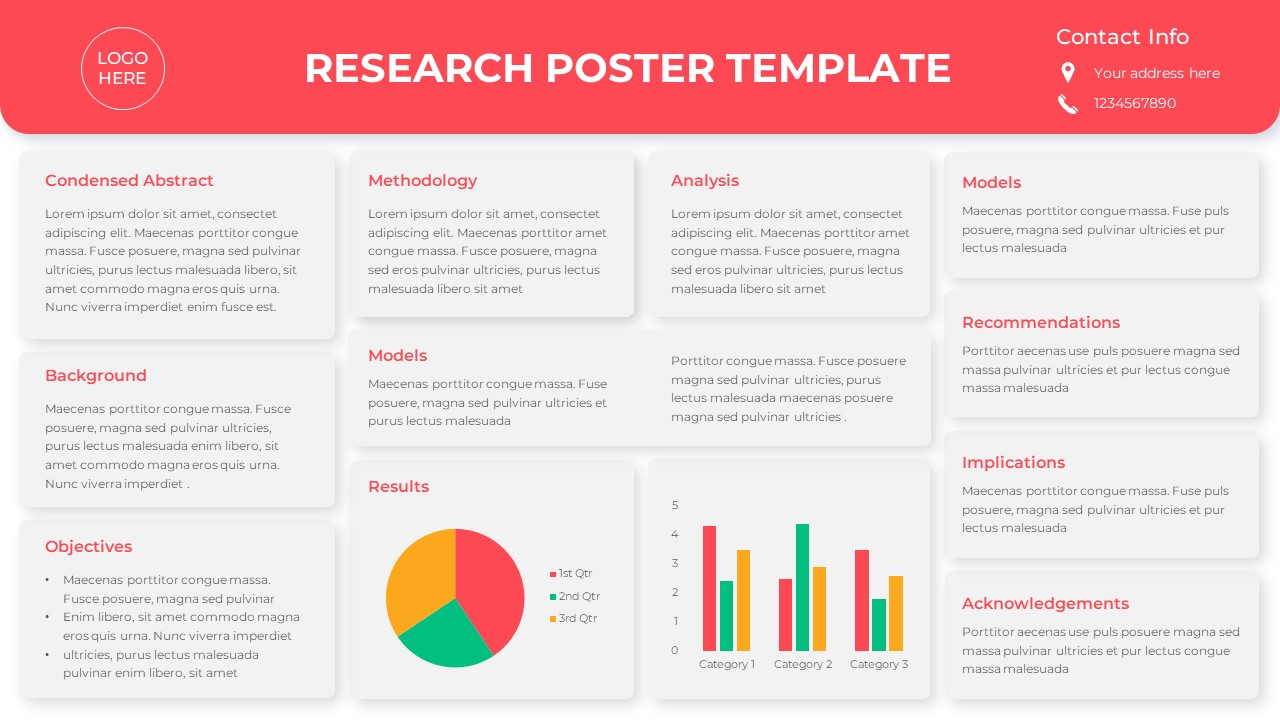
Free Research Poster with Charts Template for PowerPoint & Google Slides
Pie/Donut
Free
Multi-Phase Research Roadmap Infographic Template for PowerPoint & Google Slides
Roadmap
Free Research Presentation Slide Deck Template for PowerPoint & Google Slides
Decks
Free
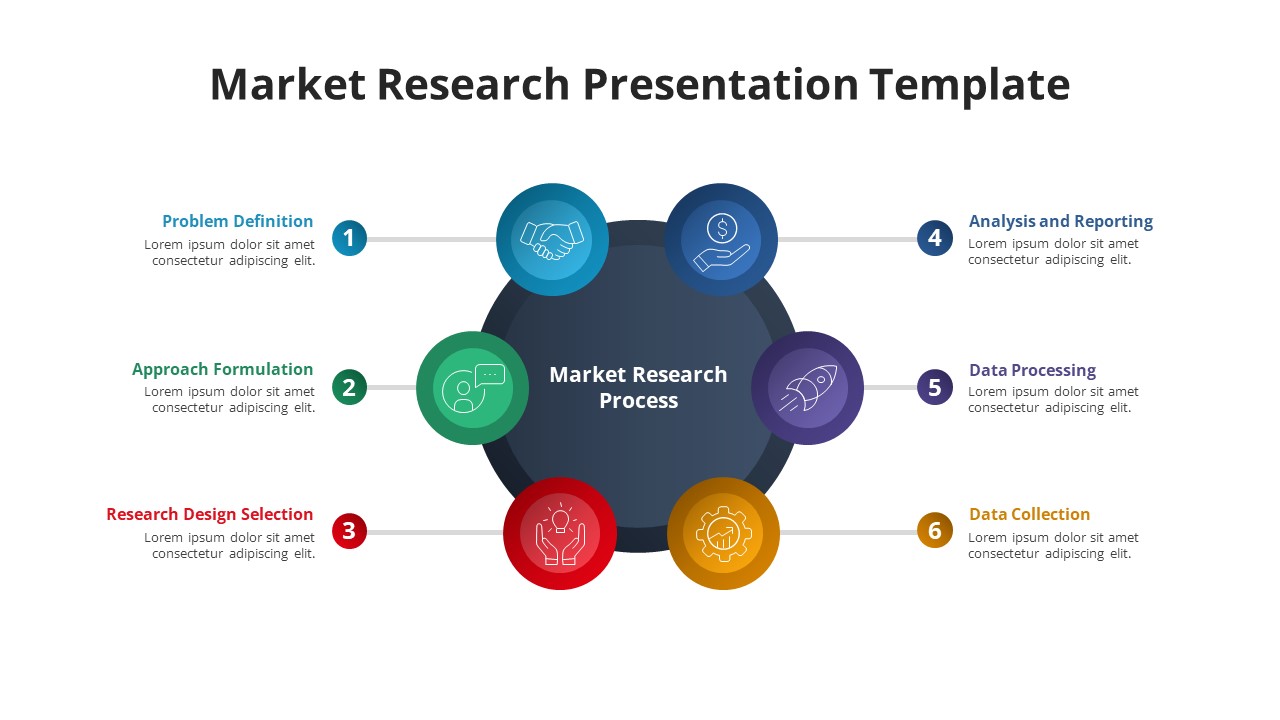
Free Six-Phase Market Research Process Template for PowerPoint & Google Slides
Process
Free
Free Thesis Research Presentation Template for PowerPoint & Google Slides
Decks
Free
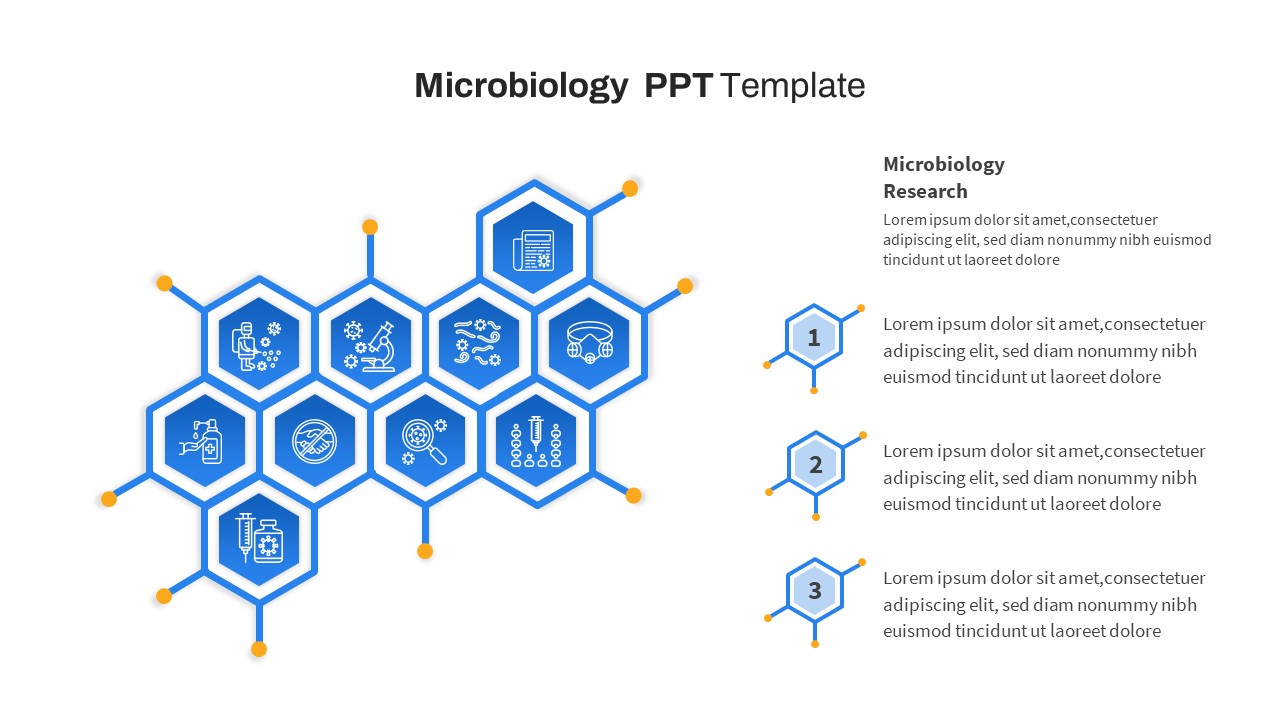
Free Hexagonal Microbiology Research Process Template for PowerPoint & Google Slides
Process
Free
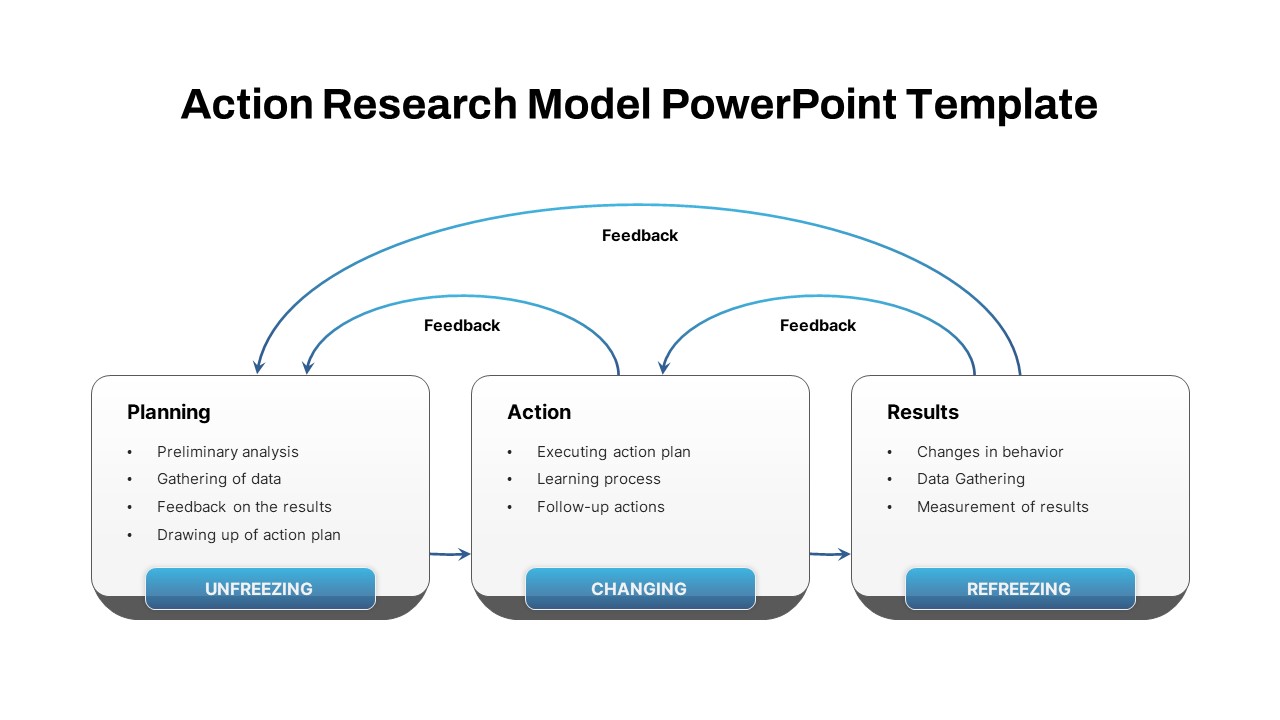
Action Research Feedback Process Model Template for PowerPoint & Google Slides
Process
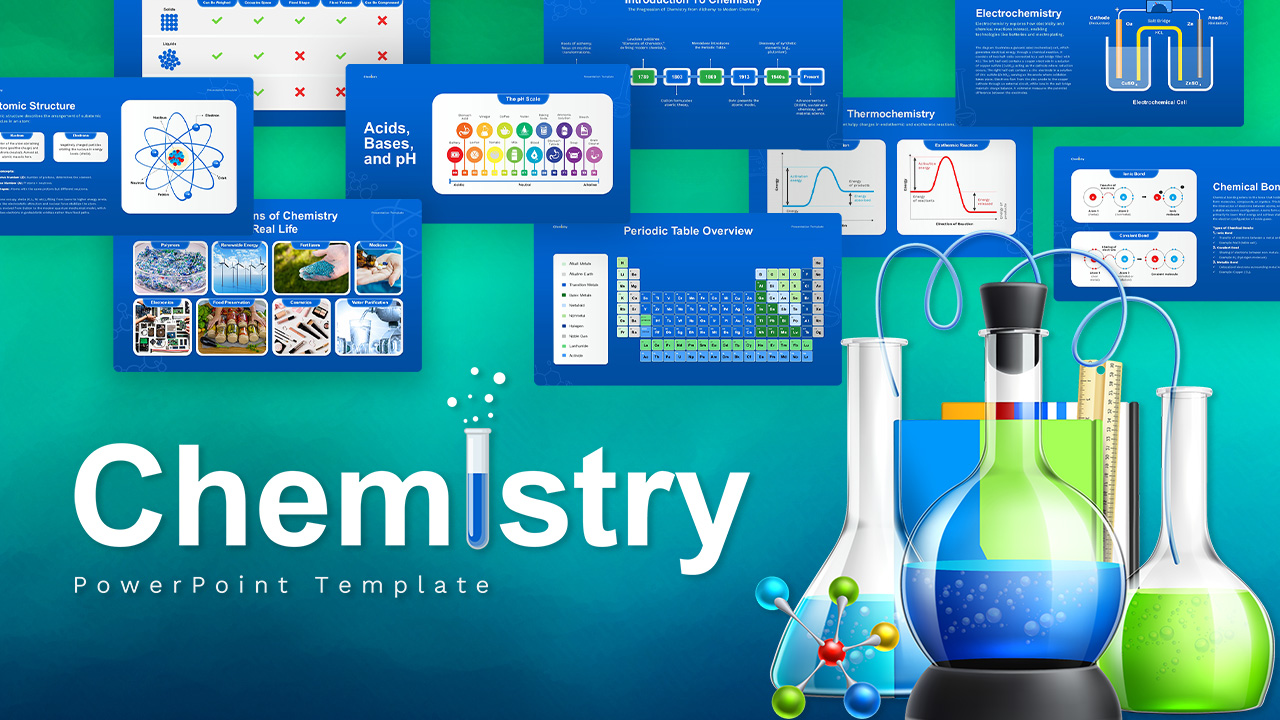
Chemistry Education & Research Template for PowerPoint & Google Slides
Pitch Deck
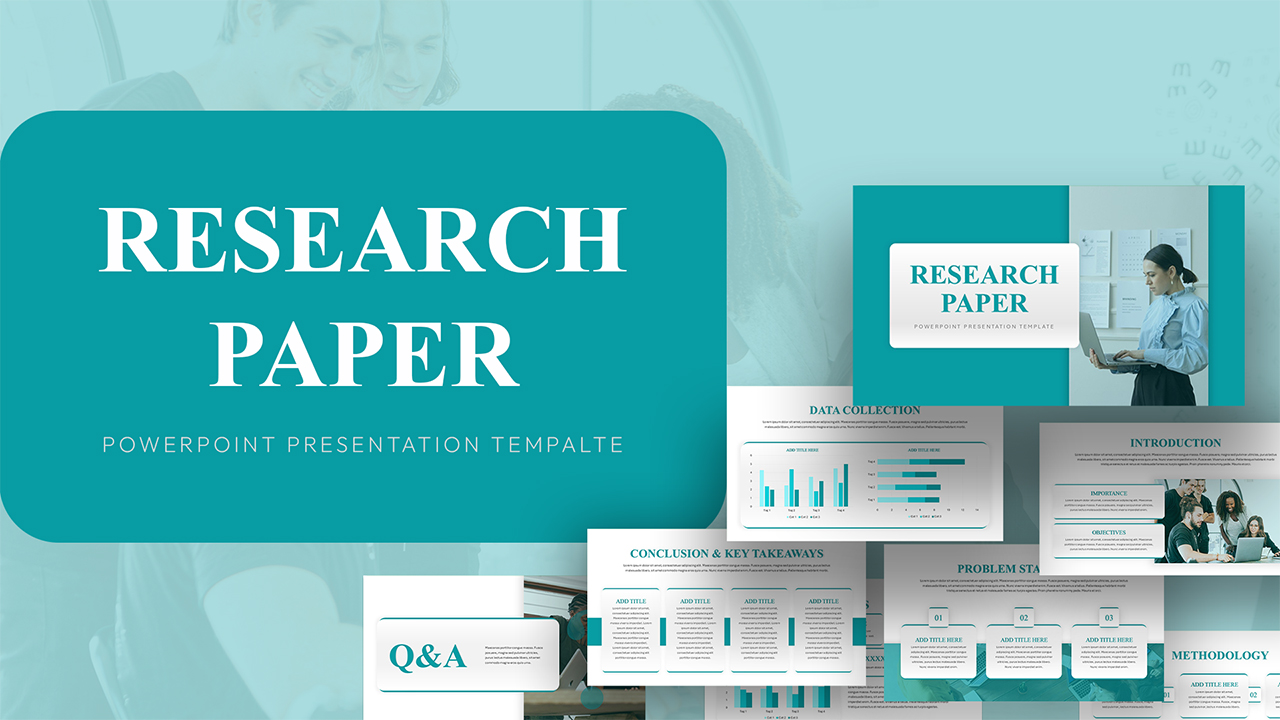
Academic Research Paper Presentation Template for PowerPoint & Google Slides
Pitch Deck
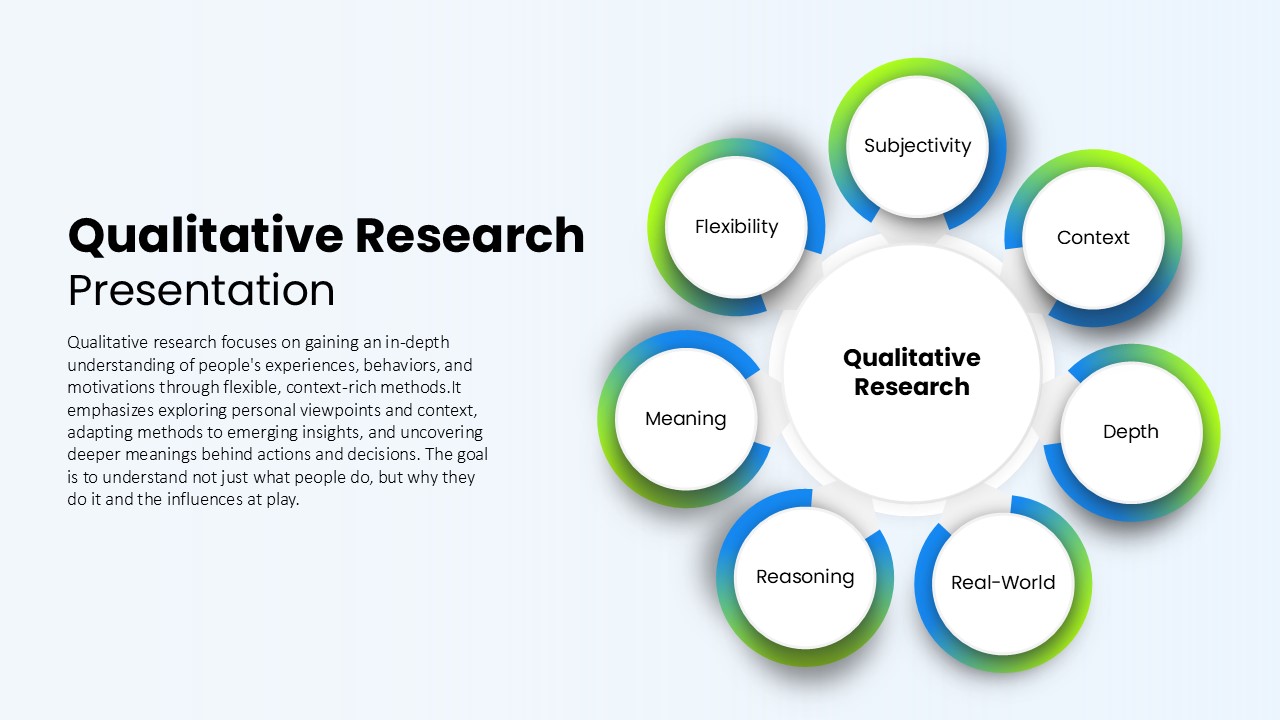
Qualitative Research Hub and Spoke Template for PowerPoint & Google Slides
Circular
Medical Research Concept infographic for PowerPoint & Google Slides
Medical
Research Project Proposal Deck for PowerPoint & Google Slides
Pitch Deck
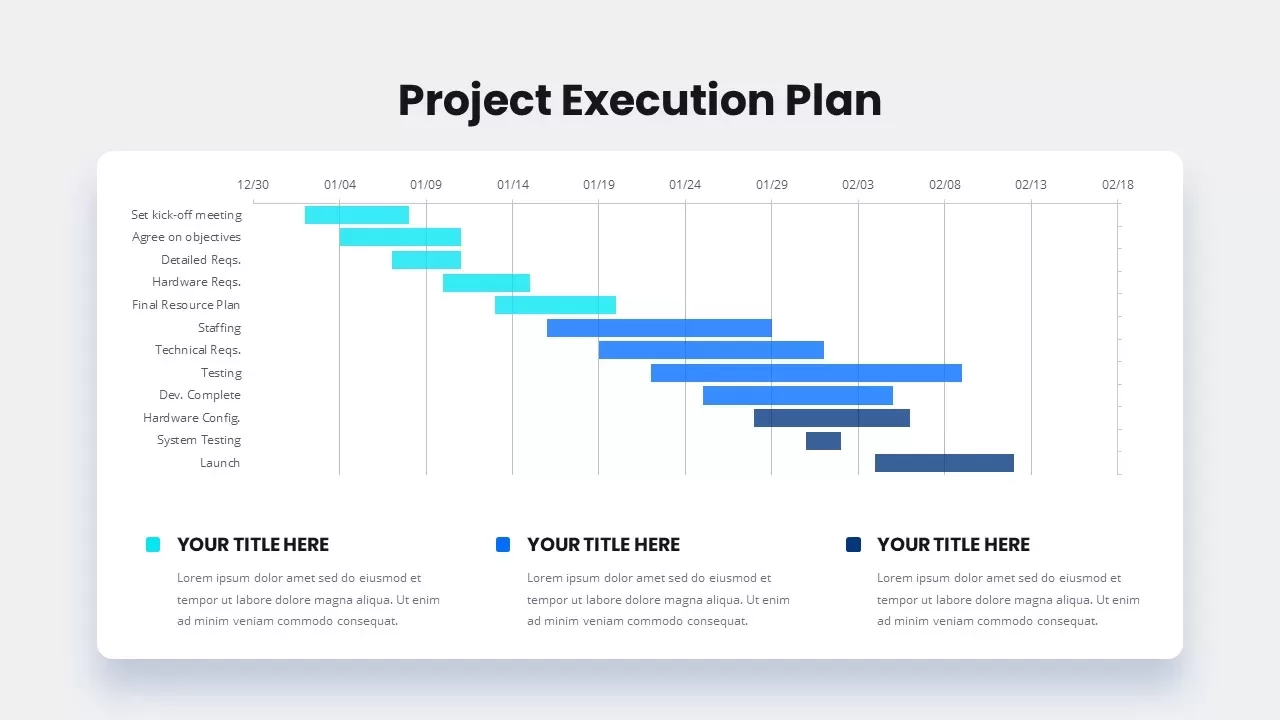
Project Execution Gantt Timeline Template for PowerPoint & Google Slides
Gantt Chart
Quad Chart Infographic Pack of 8 Slides Template for PowerPoint & Google Slides
Comparison Chart
Bar Chart Sample template for PowerPoint & Google Slides
Bar/Column

Creative data chart analytics template for PowerPoint & Google Slides
Charts
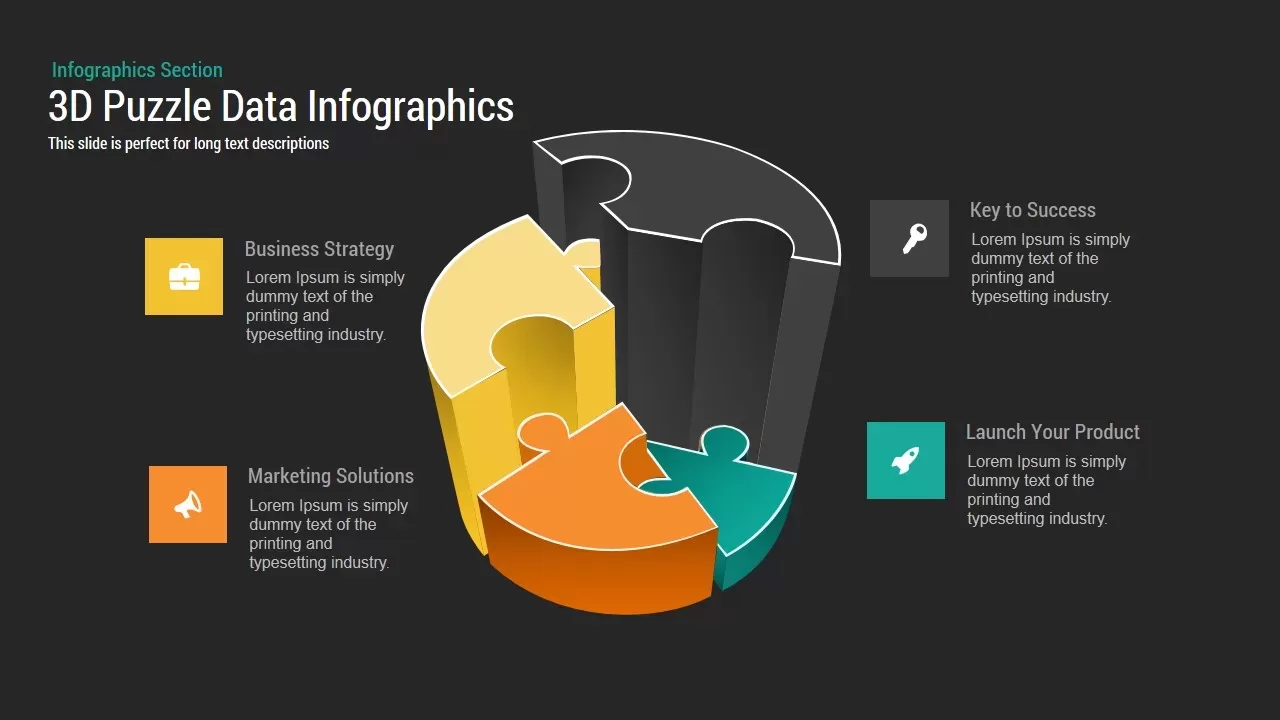
3D Puzzle Chart template for PowerPoint & Google Slides
Infographics
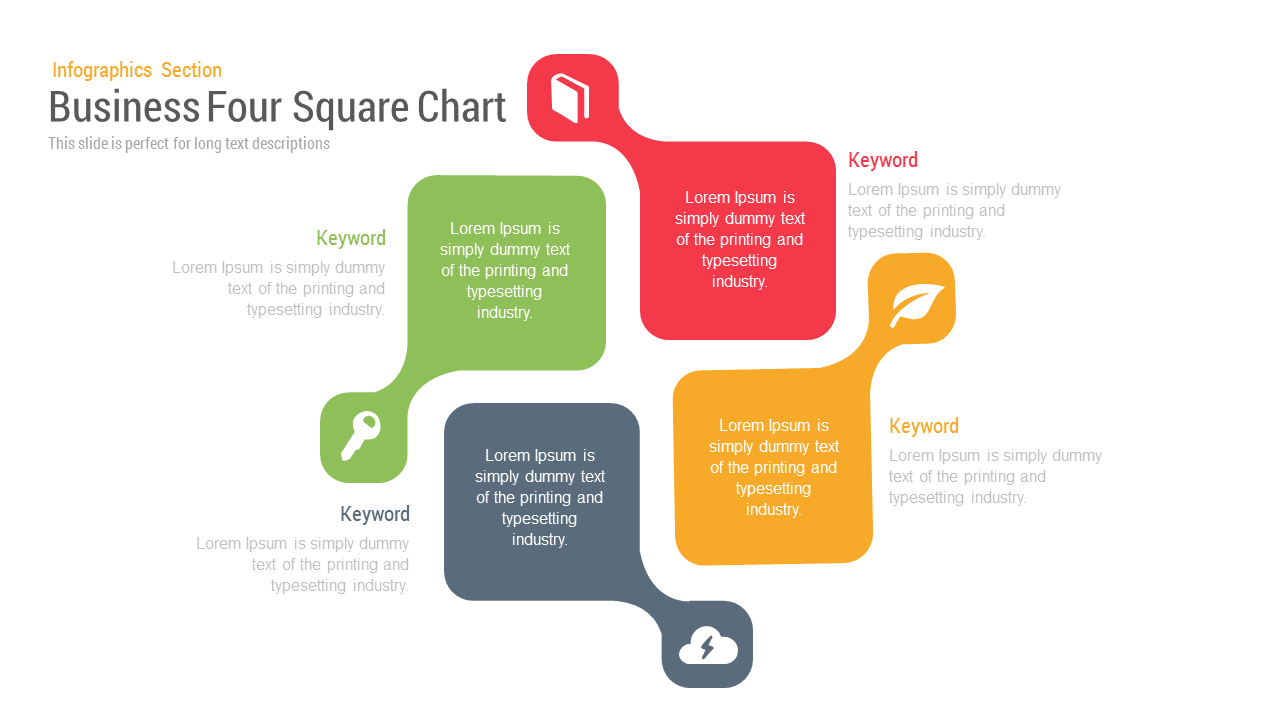
Business Four Square Chart template for PowerPoint & Google Slides
Business

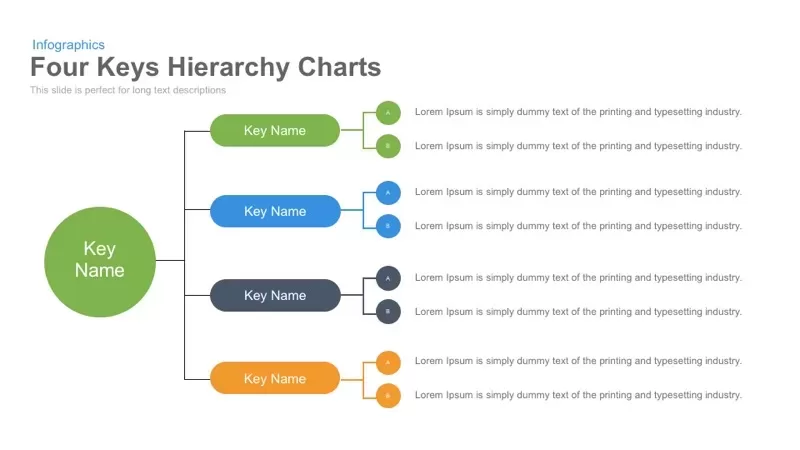
Four Keys Hierarchy Chart template for PowerPoint & Google Slides
Process
Profit Performance Trend Chart Template for PowerPoint & Google Slides
Finance
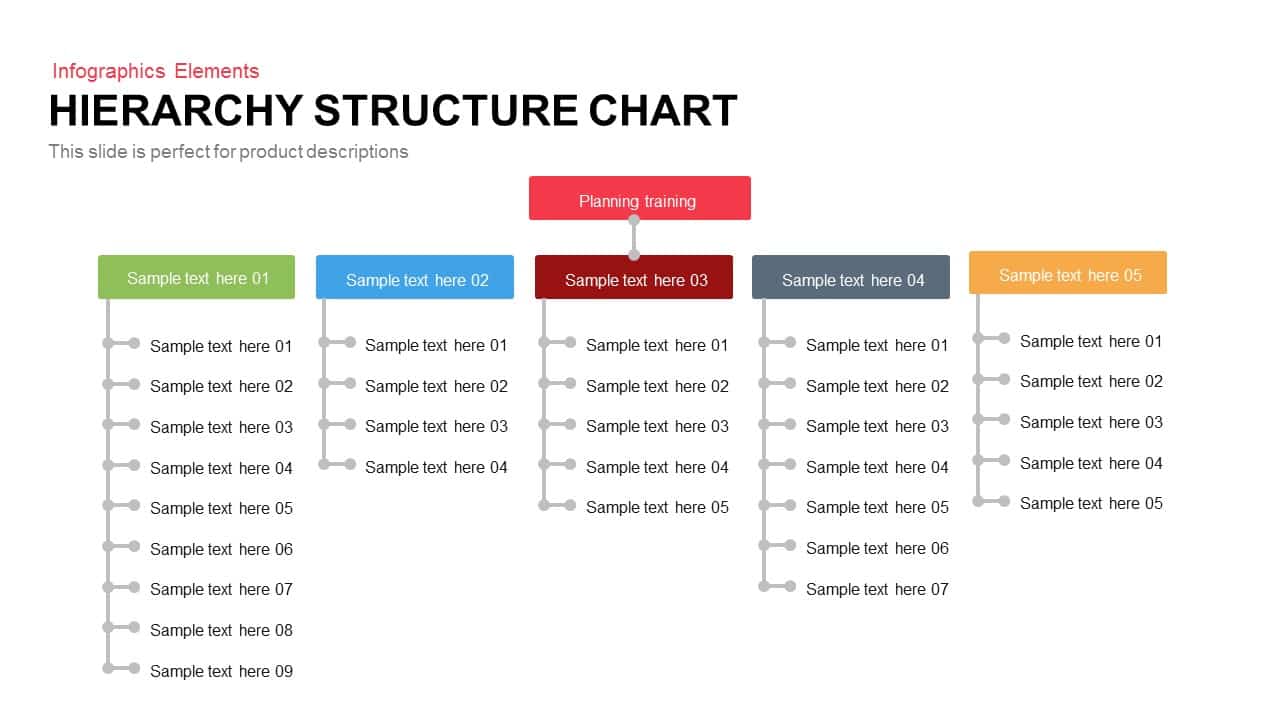
Five-Branch Hierarchy Structure Chart template for PowerPoint & Google Slides
Org Chart
Horizontal Org Chart template for PowerPoint & Google Slides
Org Chart
3D Cone Chart Data Visualization template for PowerPoint & Google Slides
Bar/Column
Eight Section Donut Chart Infographic Template for PowerPoint & Google Slides
Pie/Donut

Pyramid Chart Area template for PowerPoint & Google Slides
Pyramid
Comparison Chart Overview template for PowerPoint & Google Slides
Comparison Chart
RASCI Responsibility Matrix Chart Template for PowerPoint & Google Slides
Business
File Structure Organization Chart Template for PowerPoint & Google Slides
Org Chart
Capital Structure Dynamic Split Chart Template for PowerPoint & Google Slides
Comparison Chart
Burndown Chart Template for PowerPoint & Google Slides
Charts
Pugh Matrix Decision Comparison Chart Template for PowerPoint & Google Slides
Comparison Chart
Flow Chart Diagram template for PowerPoint & Google Slides
Flow Charts
Organizational Chart Structure template for PowerPoint & Google Slides
Business Plan
Flow Chart Decision Tree Template for PowerPoint & Google Slides
Flow Charts
Organizational Chart Template for PowerPoint & Google Slides
Our Team
Organizational Chart template for PowerPoint & Google Slides
Org Chart
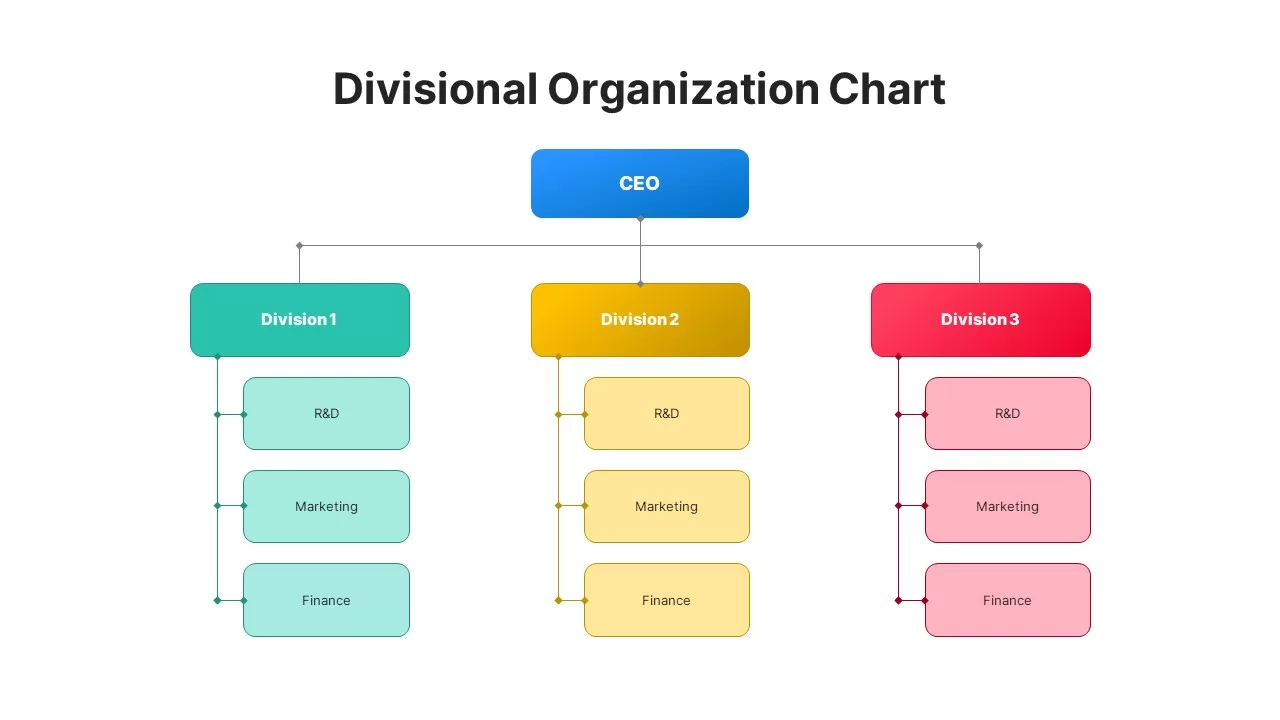
Divisional Organizational Chart Diagram Template for PowerPoint & Google Slides
Org Chart
MABA Attractiveness Matrix Chart Template for PowerPoint & Google Slides
Comparison Chart
Comprehensive Hiring Process Flow Chart Template for PowerPoint & Google Slides
Flow Charts
Waffle Chart Data Visualization Template for PowerPoint & Google Slides
Comparison Chart
People Demographic Comparison Chart Template for PowerPoint & Google Slides
Comparison
Simple Bar Chart Data Visualization Template for PowerPoint & Google Slides
Bar/Column
Minimal Multi-Year Column Chart Template for PowerPoint & Google Slides
Bar/Column
Waterfall Column Chart Analysis Template for PowerPoint & Google Slides
Bar/Column
Arrow Line Chart Template for PowerPoint & Google Slides
Comparison Chart
Colorful Four-Segment Wheel Chart Template for PowerPoint & Google Slides
Circular
Four Quadrant Scatter Chart Analysis Template for PowerPoint & Google Slides
Comparison Chart
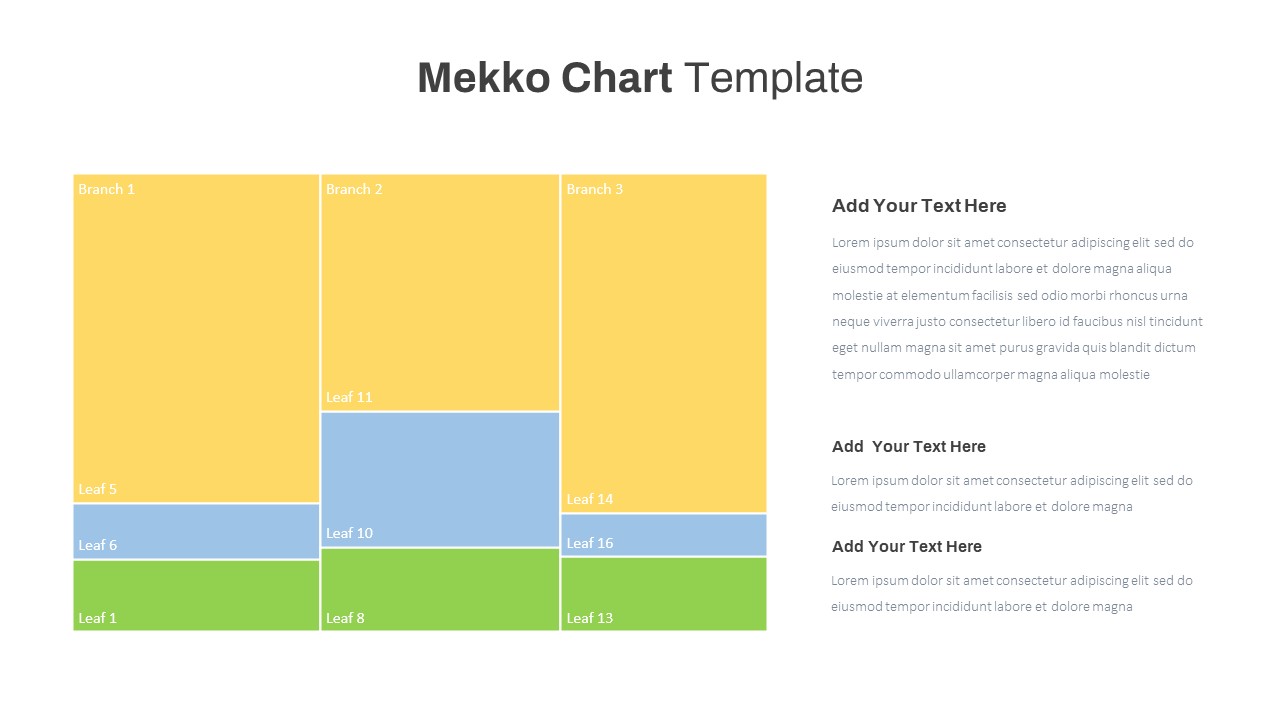
Mekko Chart with Segmented Branches & Leaves Template for PowerPoint & Google Slides
Bar/Column
Five-Phase Horizontal Timeline Chart Template for PowerPoint & Google Slides
Timeline
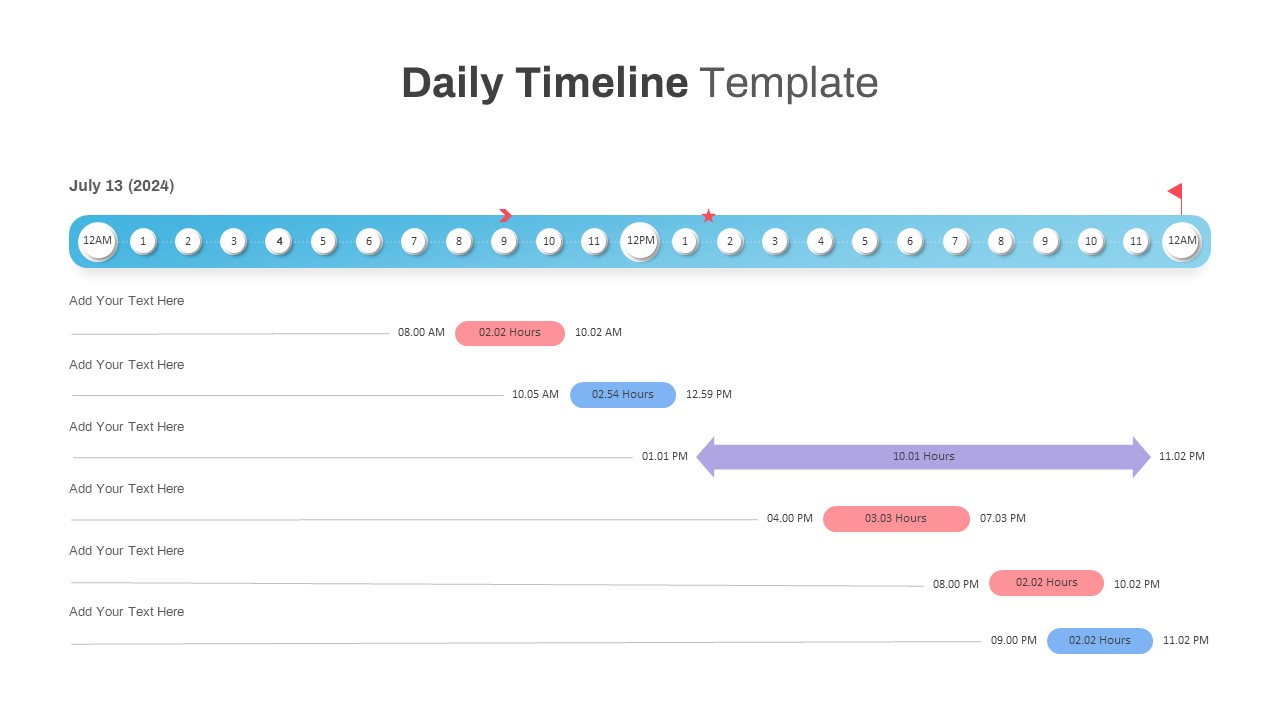
Interactive Daily Timeline Schedule Chart Template for PowerPoint & Google Slides
Timeline
Mirror Bar Chart Comparison Template for PowerPoint & Google Slides
Bar/Column
Free Learning Retention Pyramid Chart Template for PowerPoint & Google Slides
Pyramid
Free
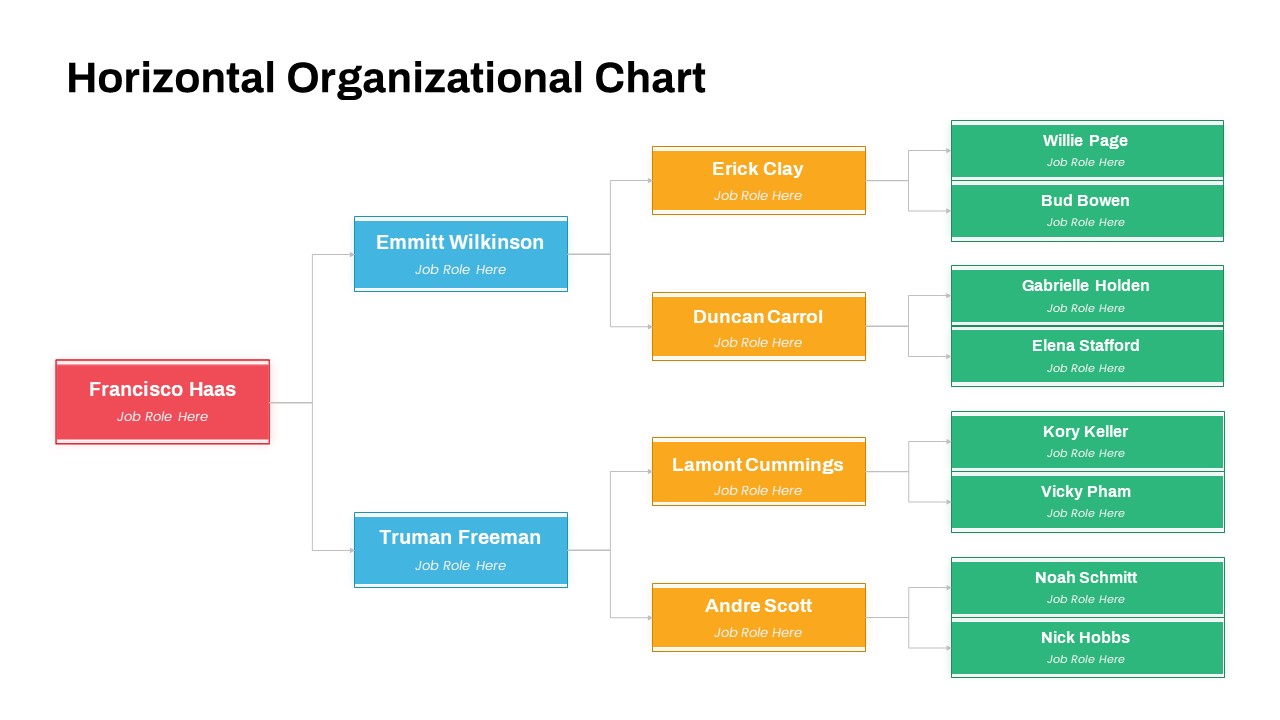
Horizontal Organizational Chart Template for PowerPoint & Google Slides
Org Chart
Modern Multi-Color Polar Chart Diagram Template for PowerPoint & Google Slides
Charts
Segmented Scatter Chart Data Visualization Template for PowerPoint & Google Slides
Business Strategy
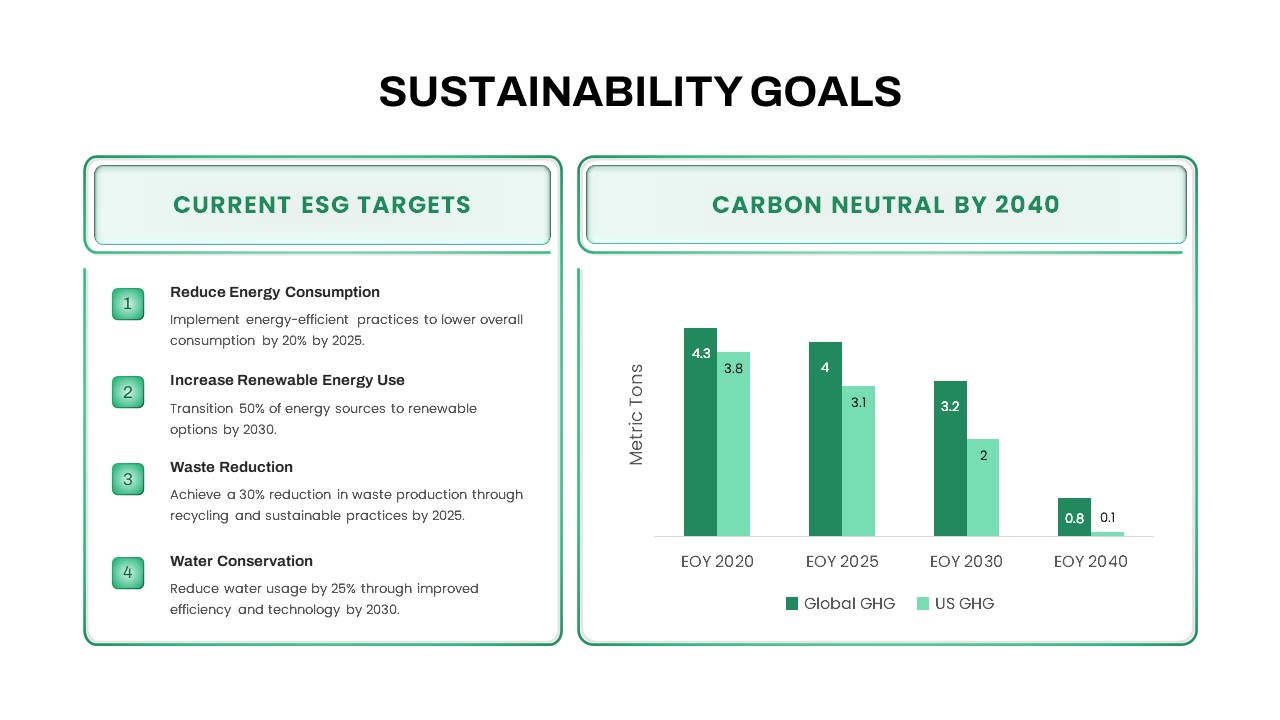
Sustainability Goals and Targets Chart Template for PowerPoint & Google Slides
Goals
ESG Initiatives Comparison Chart Template for PowerPoint & Google Slides
Business
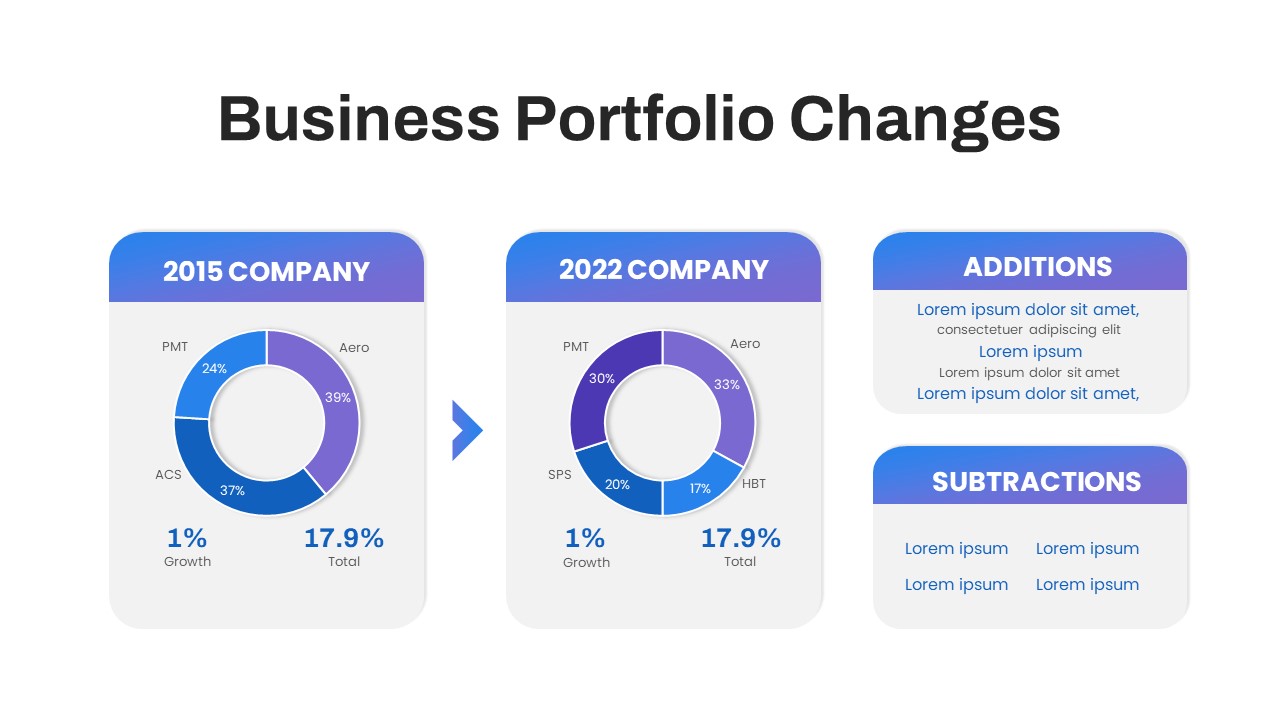
Business Portfolio Changes Donut Chart Template for PowerPoint & Google Slides
Pie/Donut
Decision Matrix & Prioritization Chart Template for PowerPoint & Google Slides
Comparison Chart
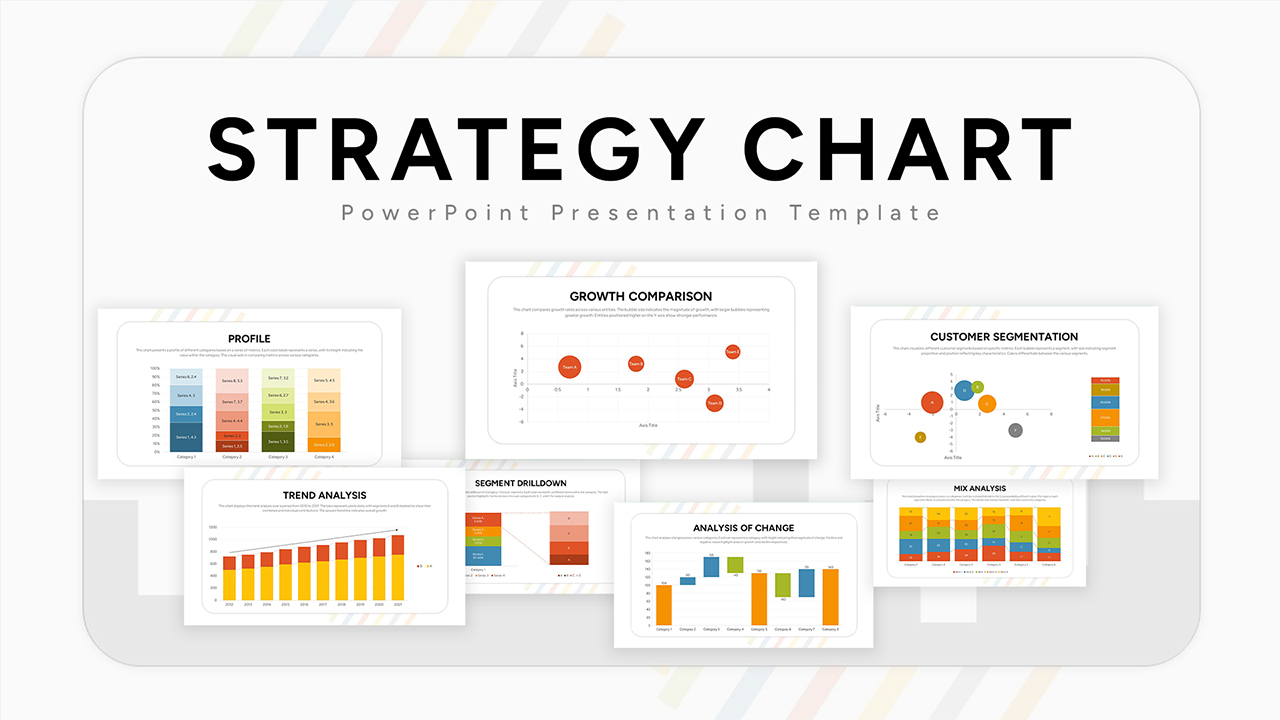
Ultimate Strategy Chart Presentation Template for PowerPoint & Google Slides
Charts
3D Pyramid Column Chart Infographic Template for PowerPoint & Google Slides
Bar/Column
Marketing Budget Allocation Donut Chart Template for PowerPoint & Google Slides
Marketing
Disaster Response Role Matrix RACI Chart Template for PowerPoint & Google Slides
Project Status
USA Map with Bar Chart Template for PowerPoint & Google Slides
World Maps
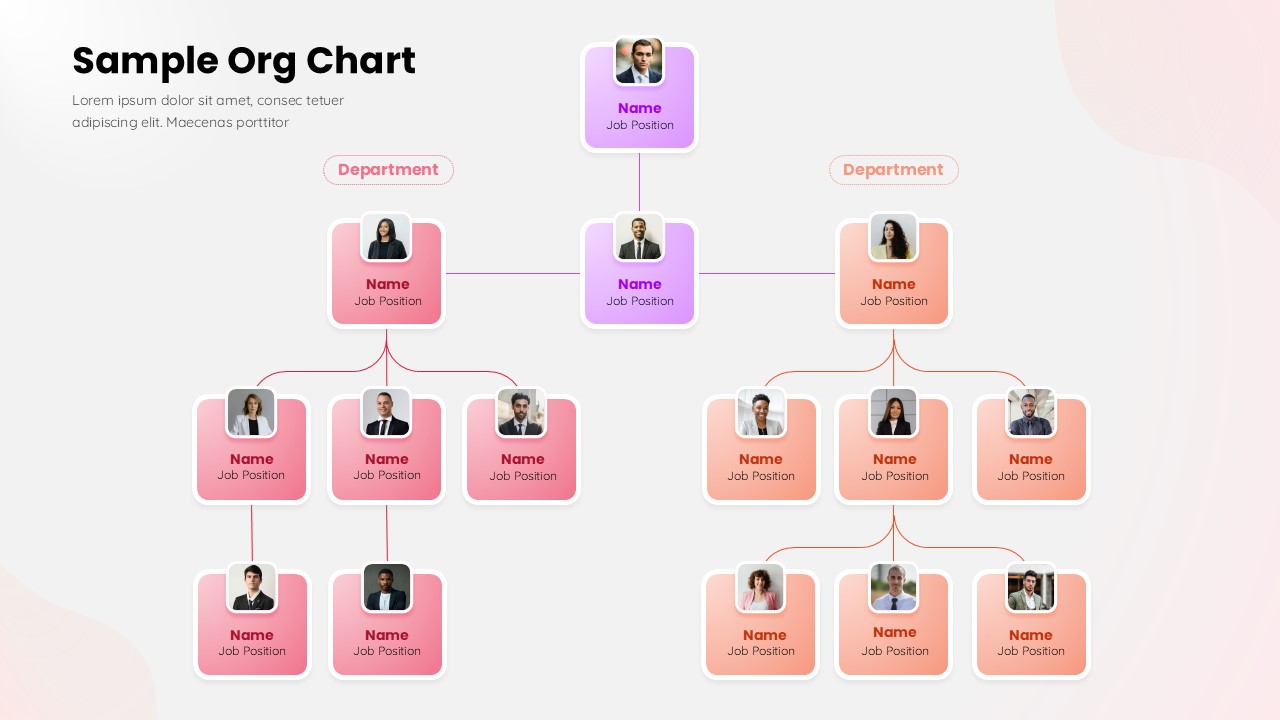
Sample Org Chart Template for PowerPoint & Google Slides
Org Chart