Progress Chart Slide for PowerPoint & Google Slides


Description
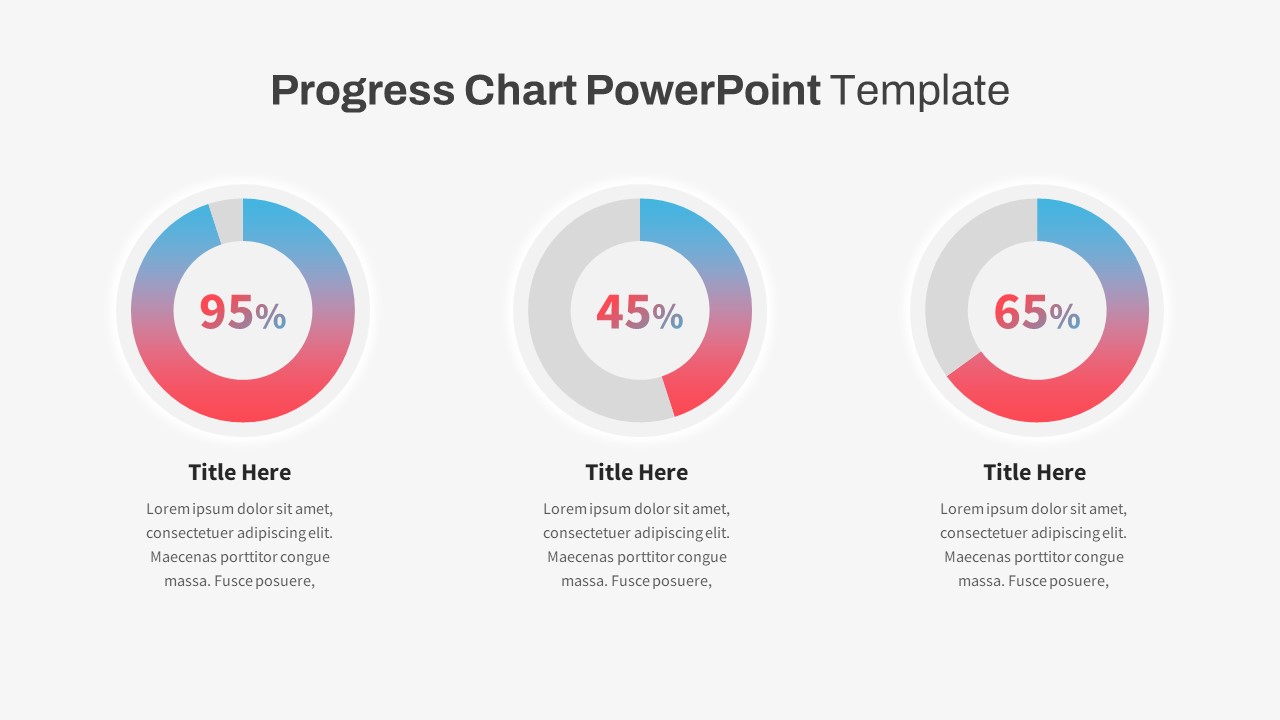
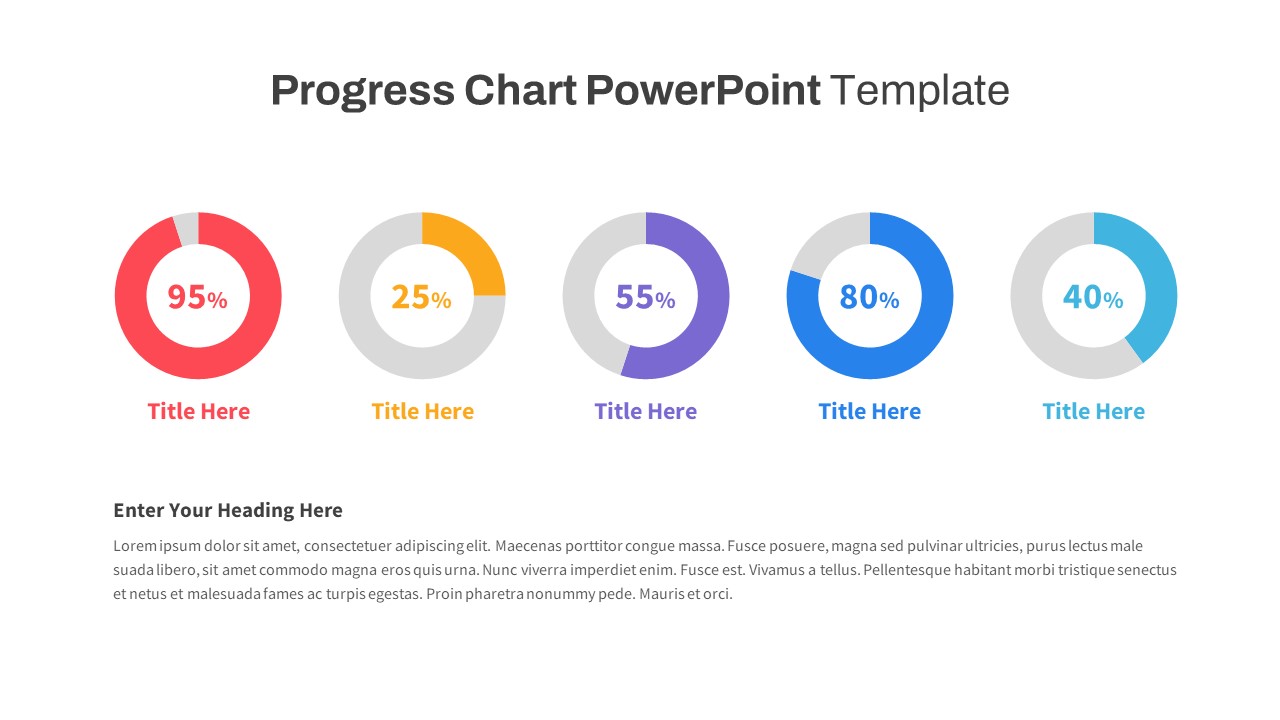
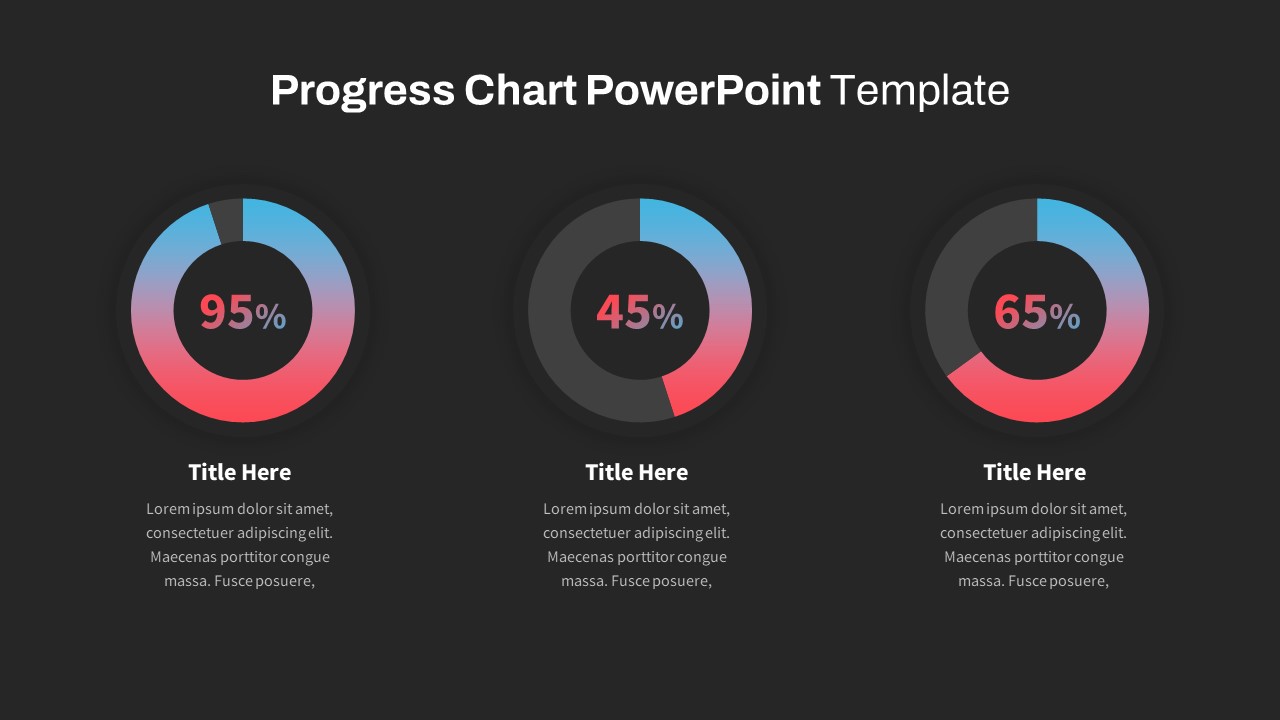
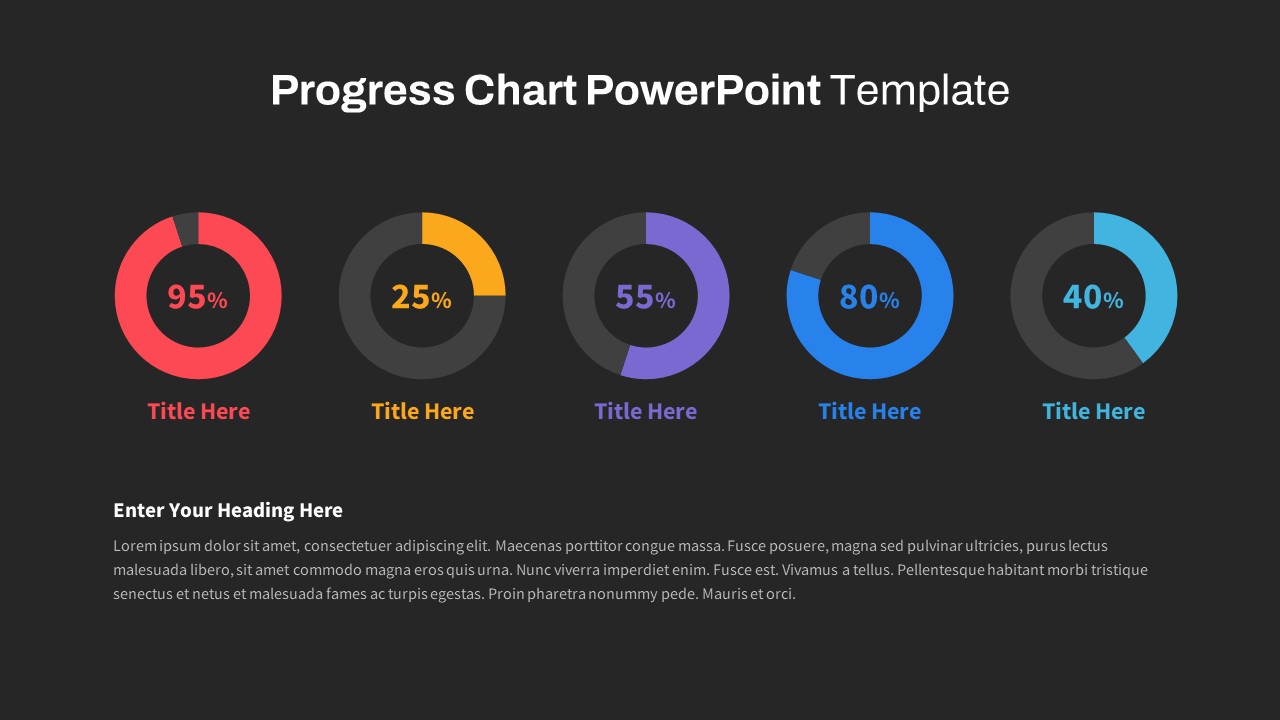
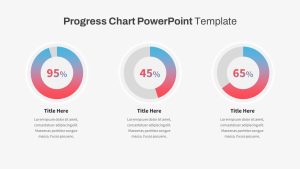
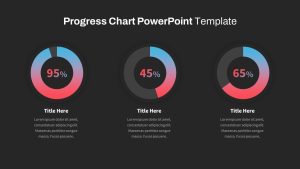
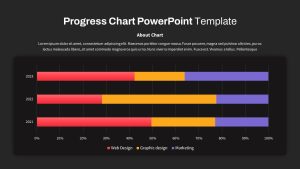
Visualize performance metrics with clarity using this sleek progress chart slide. Featuring three side-by-side donut-style gauges, each chart dynamically displays percentage values—95%, 45%, and 65%—in bold, center-aligned typography. The gradient coloring across red, purple, and blue tones adds visual interest while maintaining a clean, professional look.
Ideal for status updates, KPI tracking, or performance benchmarking, this layout helps audiences instantly interpret progress at a glance. Beneath each chart is a placeholder for concise labels and descriptions, allowing for easy annotation of project stages, departmental goals, or completion statuses.
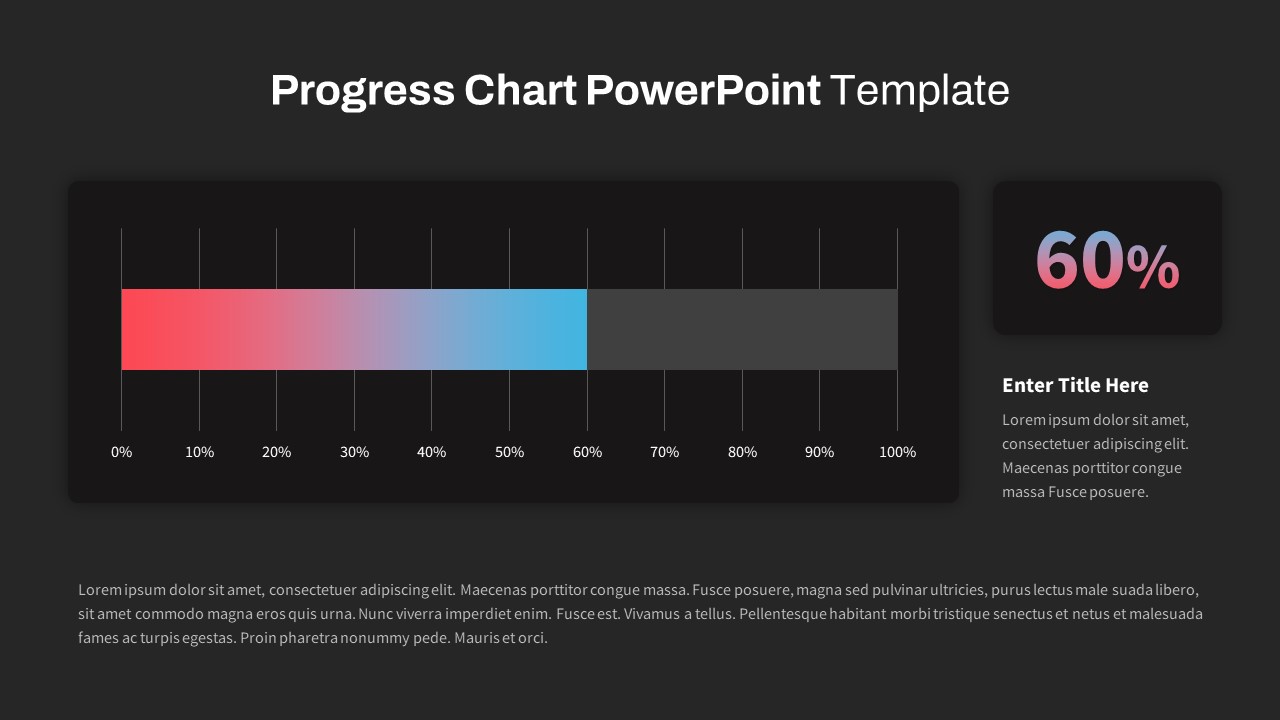
Optimized for both PowerPoint and Google Slides, the template is fully editable—adjust percentages, colors, fonts, or text fields in seconds. The format supports comparisons while conserving slide space, making it a favorite for dashboards, quarterly reports, and executive briefings.
Who is it for
Best suited for project managers, marketing teams, executives, and analysts needing to present progress or performance data visually and effectively in meetings or reports.
Other Uses
Can be repurposed for team assessments, budget tracking, sales pipeline updates, academic grading visuals, or event planning progress. The modular layout also works well in pitch decks and stakeholder updates.
Login to download this file

Item ID
SB04153
Related Templates

Free Curved Arrow Progress Chart template for PowerPoint & Google Slides
Project
Free
Agriculture Infographics Slide with Progress Rings & Metrics Template for PowerPoint & Google Slides
Pie/Donut
iPad App Mockup with Progress Metrics Template for PowerPoint & Google Slides
Bar/Column
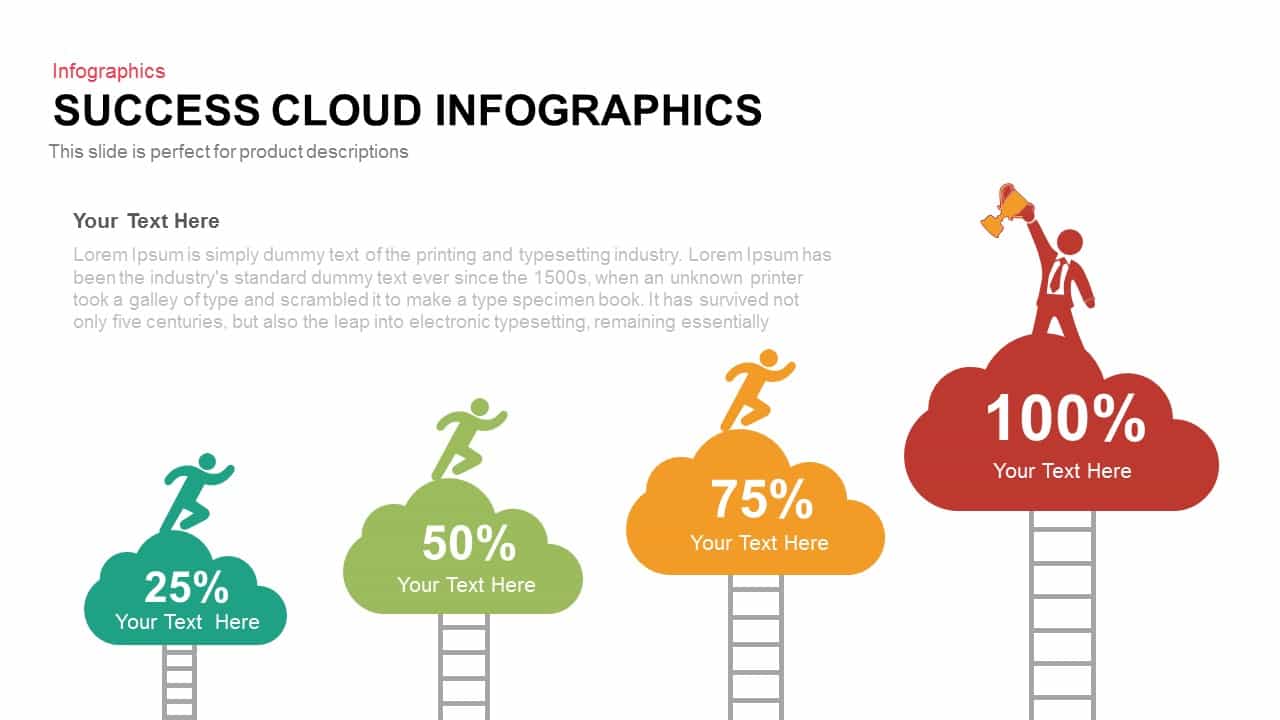
Success Cloud Progress Infographics Template for PowerPoint & Google Slides
Charts

Growth Arrow for Progress & Growth template for PowerPoint & Google Slides
Arrow
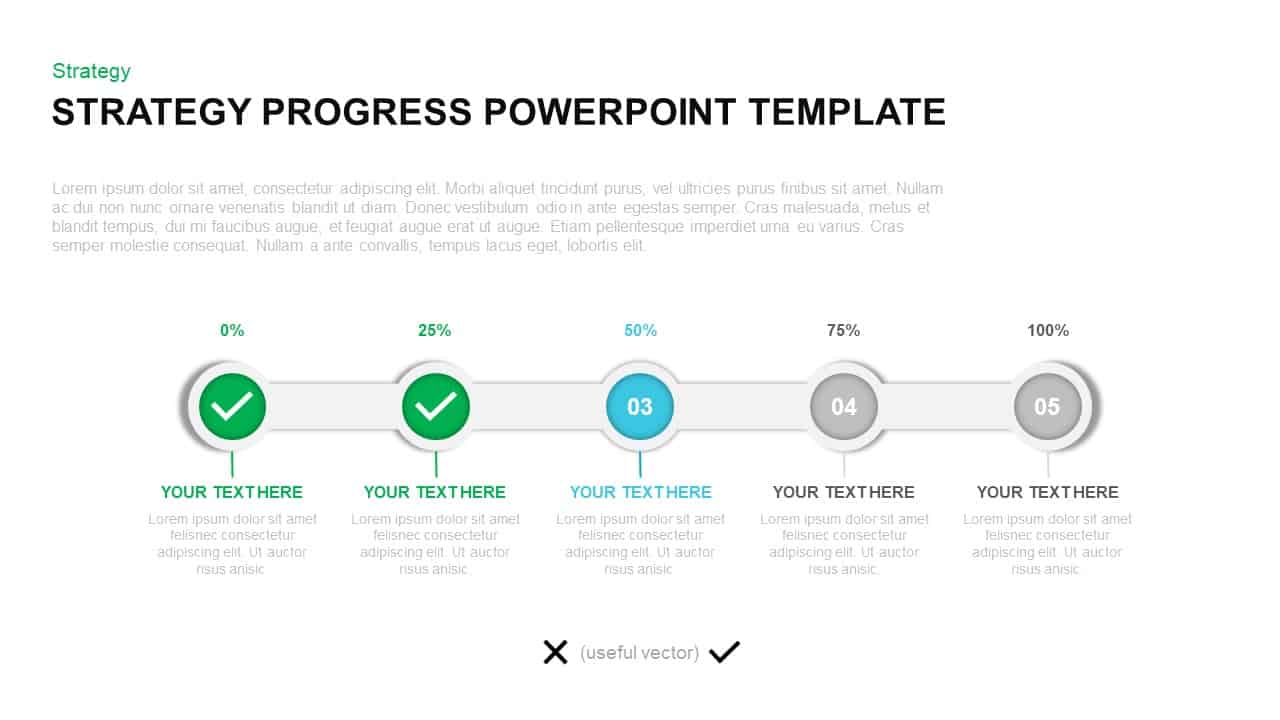
Strategy Progress Timeline Template for PowerPoint & Google Slides
Process
Performance Review Progress Management Template for PowerPoint & Google Slides
Process
Progress Bar Graph Layout Design for PowerPoint & Google Slides
Charts
Progress Bar Infographic for PowerPoint & Google Slides
Business
Progress Bar infographic pack for PowerPoint & Google Slides
Business
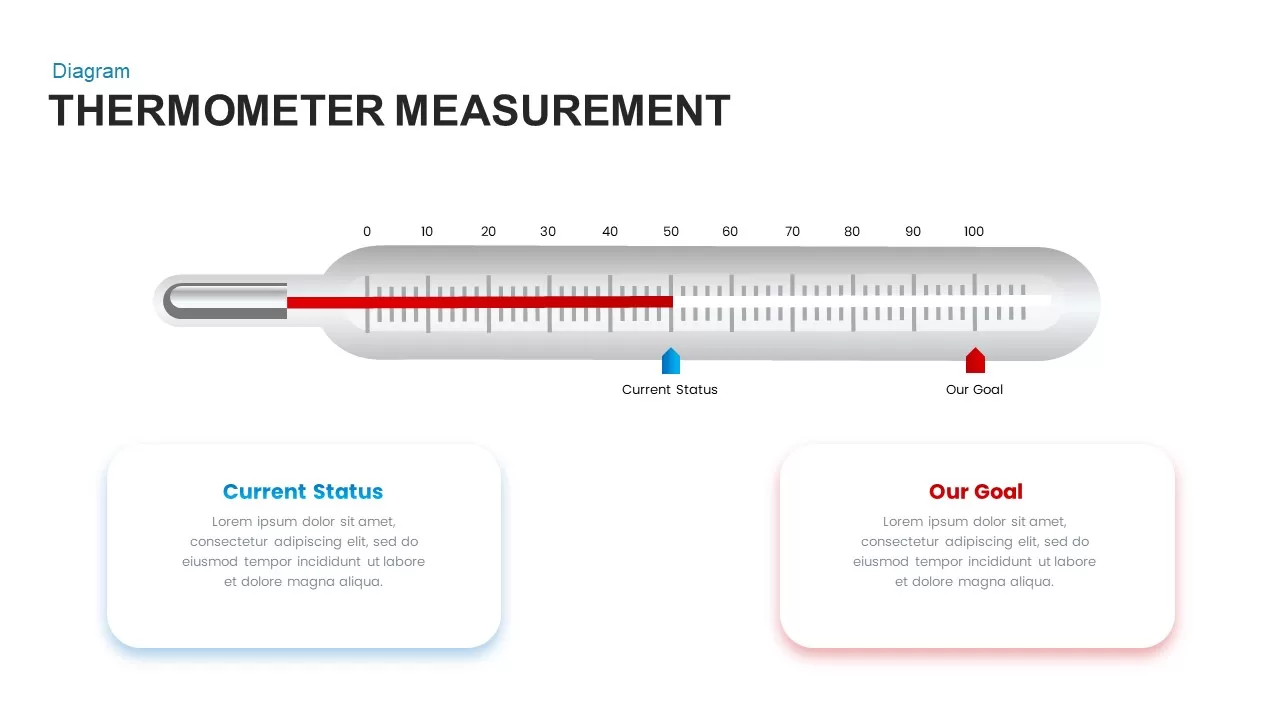
Thermometer Gauge Progress Measurement Template for PowerPoint & Google Slides
Comparison
Dynamic Statistics & Progress Charts Template for PowerPoint & Google Slides
Pie/Donut
Timeline Roadmap with Progress Bar Template for PowerPoint & Google Slides
Timeline
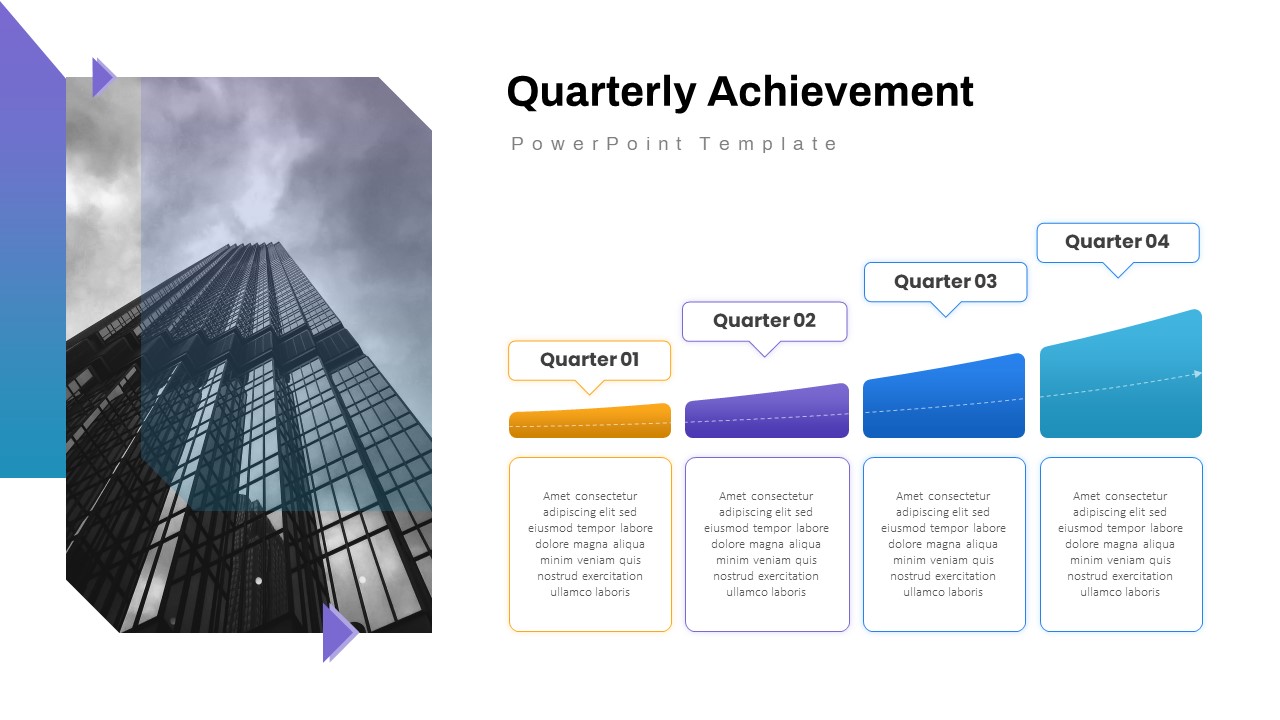
Quarterly Achievement Progress Template for PowerPoint & Google Slides
Accomplishment
Progress Bar and Milestone Visualization Template for PowerPoint & Google Slides
Timeline
Project Progress Dashboard Pie Charts Template for PowerPoint & Google Slides
Project
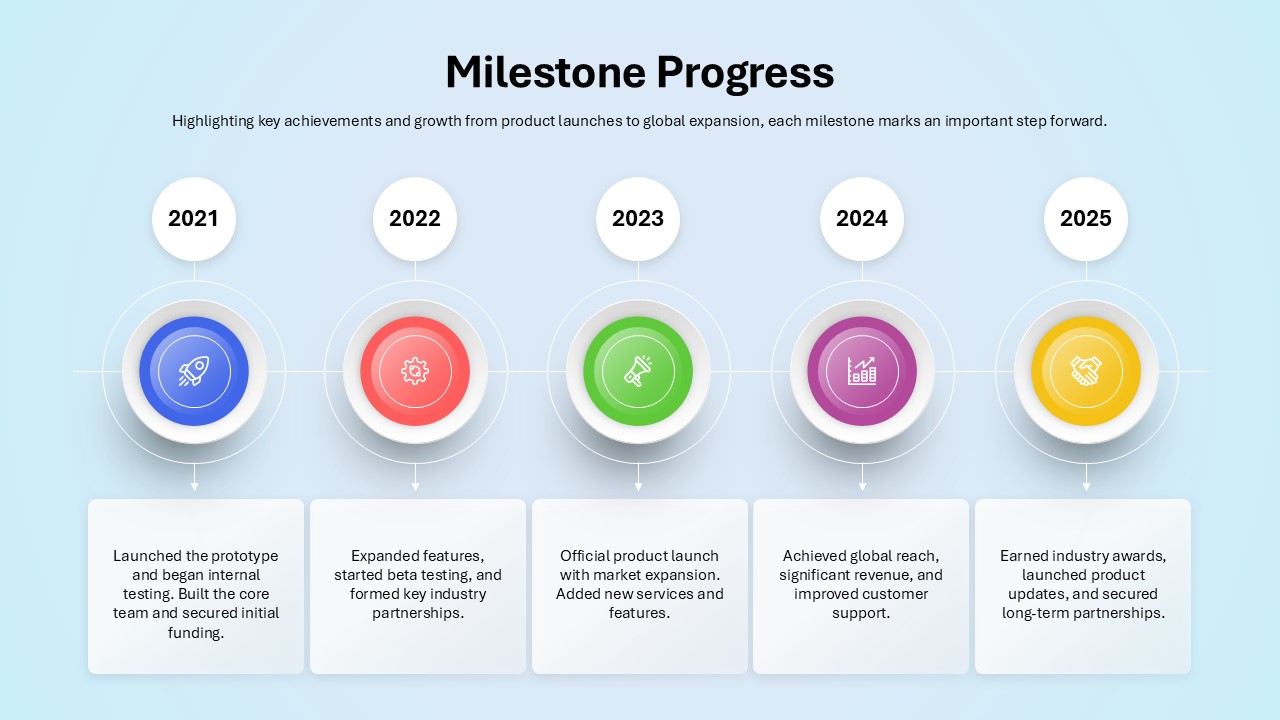
Milestone Progress template for PowerPoint & Google Slides
Business Plan
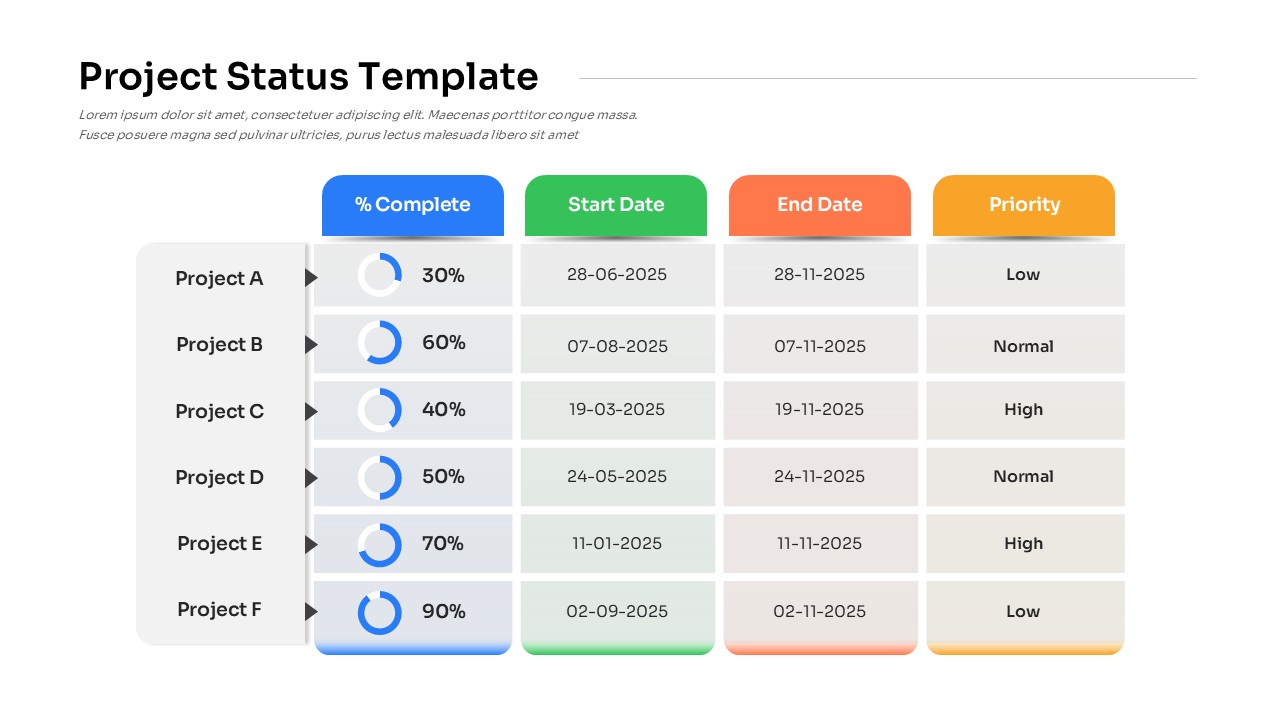
Project Status with Progress & Priority Template for PowerPoint & Google Slides
Table
Bar Data Chart Slide for PowerPoint & Google Slides
Bar/Column
Weekly Data Chart Slide for PowerPoint & Google Slides
Comparison Chart
Tornado Chart Data Comparison Slide Template for PowerPoint & Google Slides
Bar/Column
3D Color Block Organizational Chart Slide for PowerPoint & Google Slides
Org Chart
Free Editable Simple Column Chart Slide Template for PowerPoint & Google Slides
Bar/Column
Free
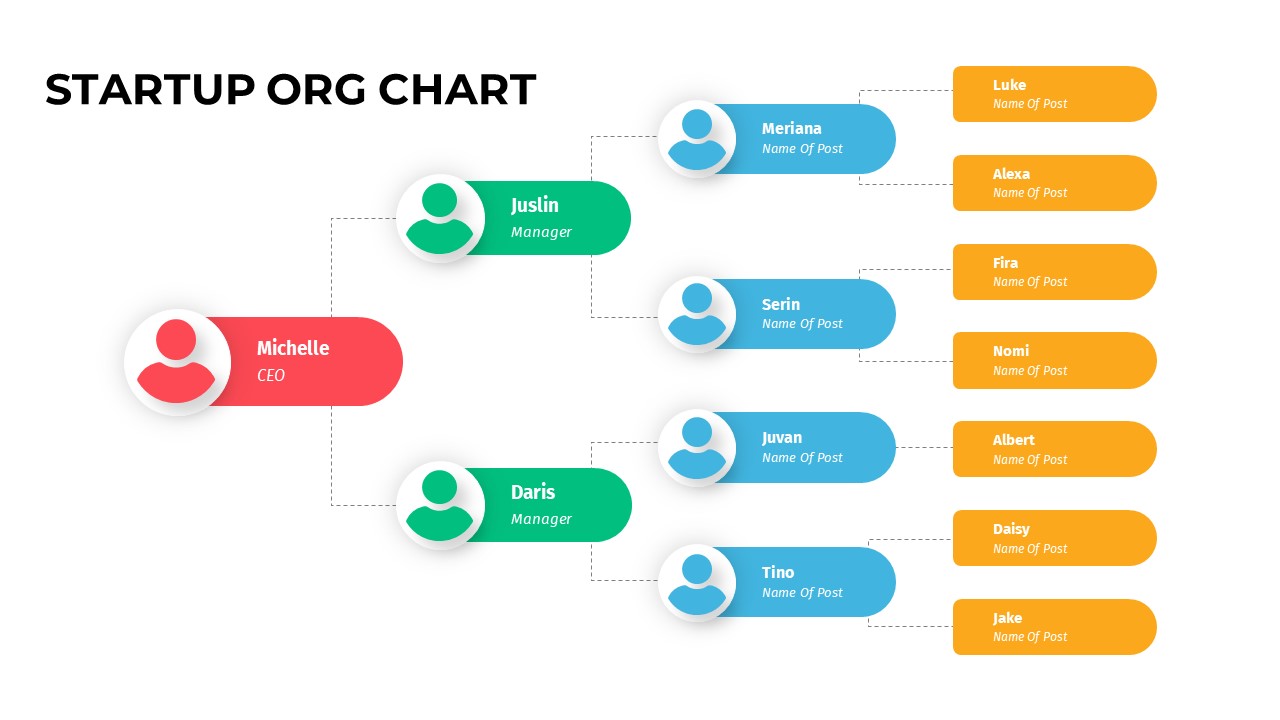
Color-Coded Startup Org Chart Slide for PowerPoint & Google Slides
Org Chart
Horizontal Bar Chart Slide with Icons Template for PowerPoint & Google Slides
Bar/Column
Stacked Gantt Chart Timeline Slide Template for PowerPoint & Google Slides
Gantt Chart
Quad Chart Infographic Pack of 8 Slides Template for PowerPoint & Google Slides
Comparison Chart
Free Professional Gantt Chart Pack – 4 Slides Template for PowerPoint & Google Slides
Gantt Chart
Free
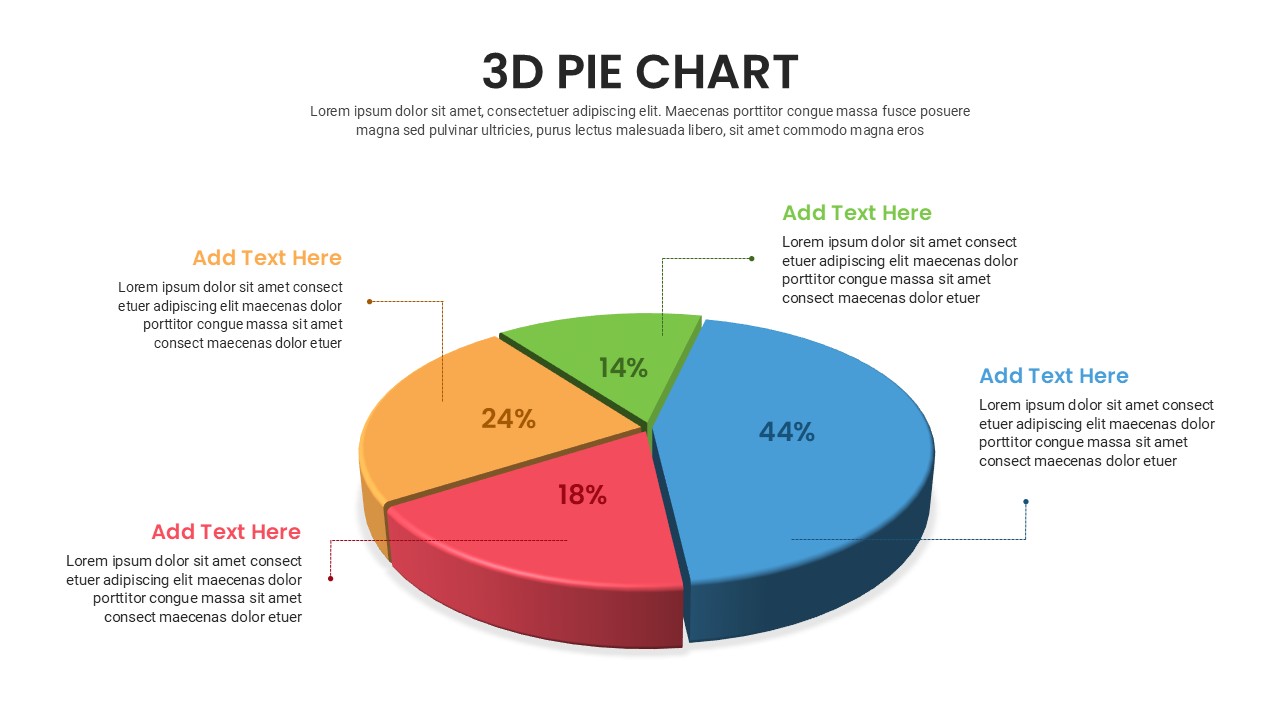
Free 3D Pie Chart template for PowerPoint & Google Slides
Pie/Donut
Free
Bar Chart Sample template for PowerPoint & Google Slides
Bar/Column
Mobile Data Analysis Chart template for PowerPoint & Google Slides
Charts
Creative Data Analysis Bar Chart template for PowerPoint & Google Slides
Bar/Column
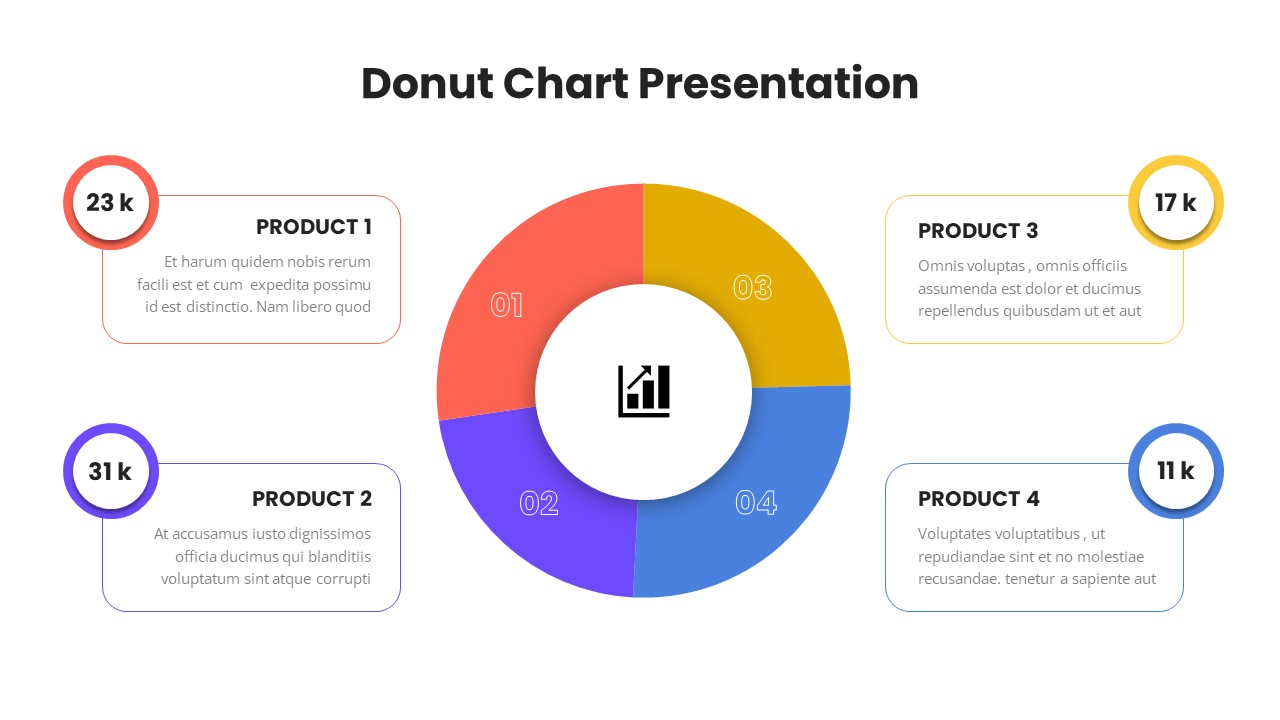
Donut Chart template for PowerPoint & Google Slides
Pie/Donut
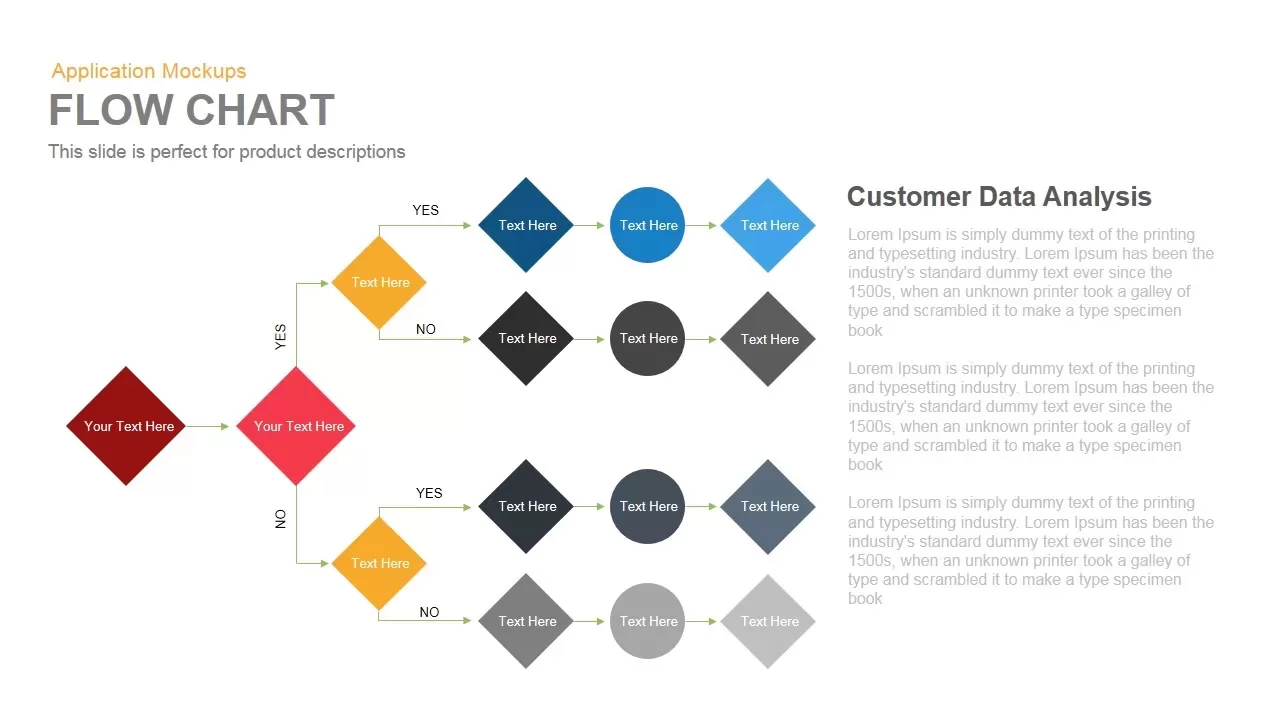
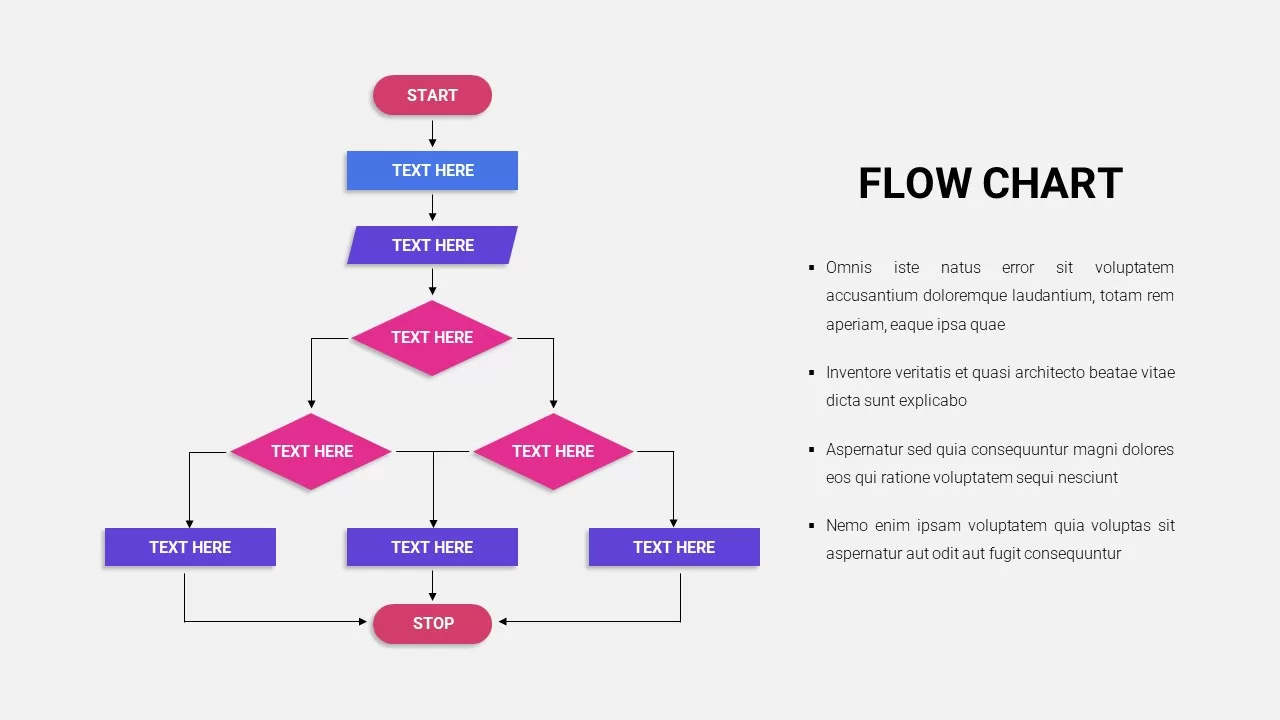
Flow Chart template for PowerPoint & Google Slides
Flow Charts
Donut Chart Split Template for PowerPoint & Google Slides
Charts
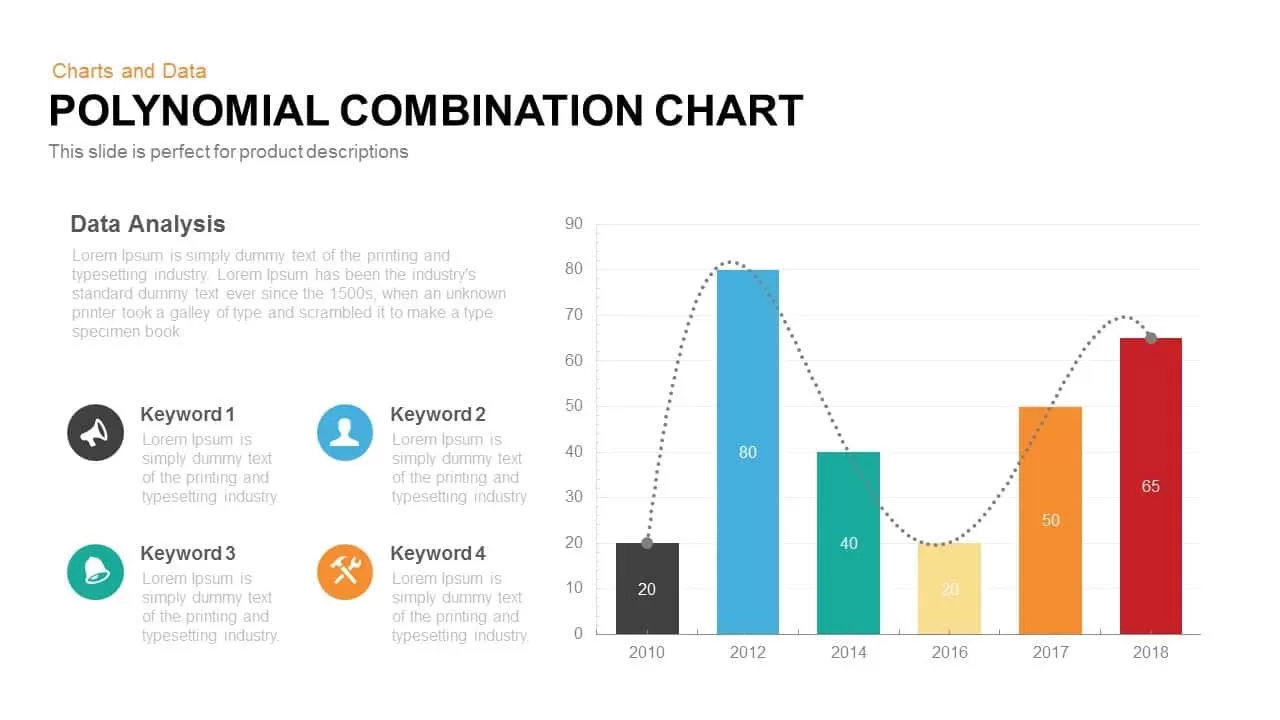
Combination Chart template for PowerPoint & Google Slides
Charts
Comparison Bar Chart template for PowerPoint & Google Slides
Comparison Chart
Three-Year Bar Chart template for PowerPoint & Google Slides
Charts
3D Cylinder Bar Chart Template for PowerPoint & Google Slides
Bar/Column
Isometric Organization Chart Diagram Template for PowerPoint & Google Slides
Org Chart
Success Key Diagram with Donut Chart Template for PowerPoint & Google Slides
Pie/Donut
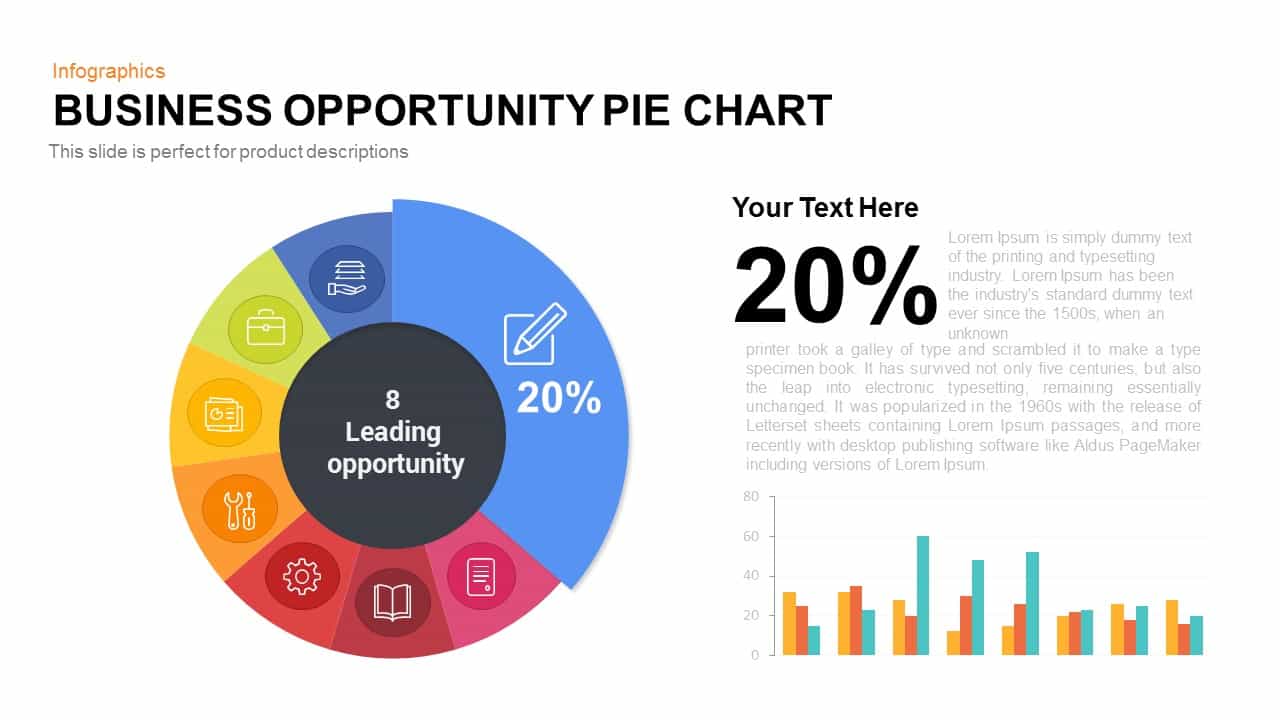
Business Opportunity Pie Chart Template for PowerPoint & Google Slides
Pie/Donut
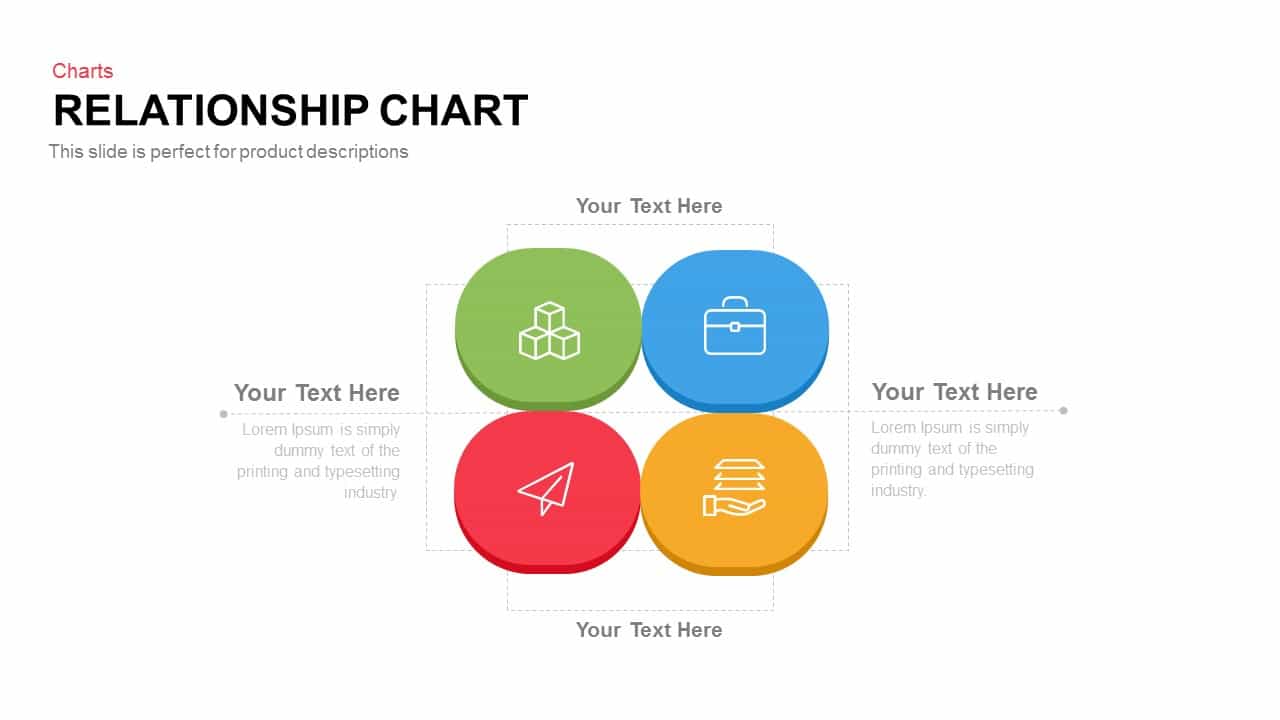
Relationship Chart template for PowerPoint & Google Slides
Flow Charts
Horizontal Multi-Level Hierarchy Chart template for PowerPoint & Google Slides
Org Chart

Monthly Reports Bar Chart template for PowerPoint & Google Slides
Bar/Column
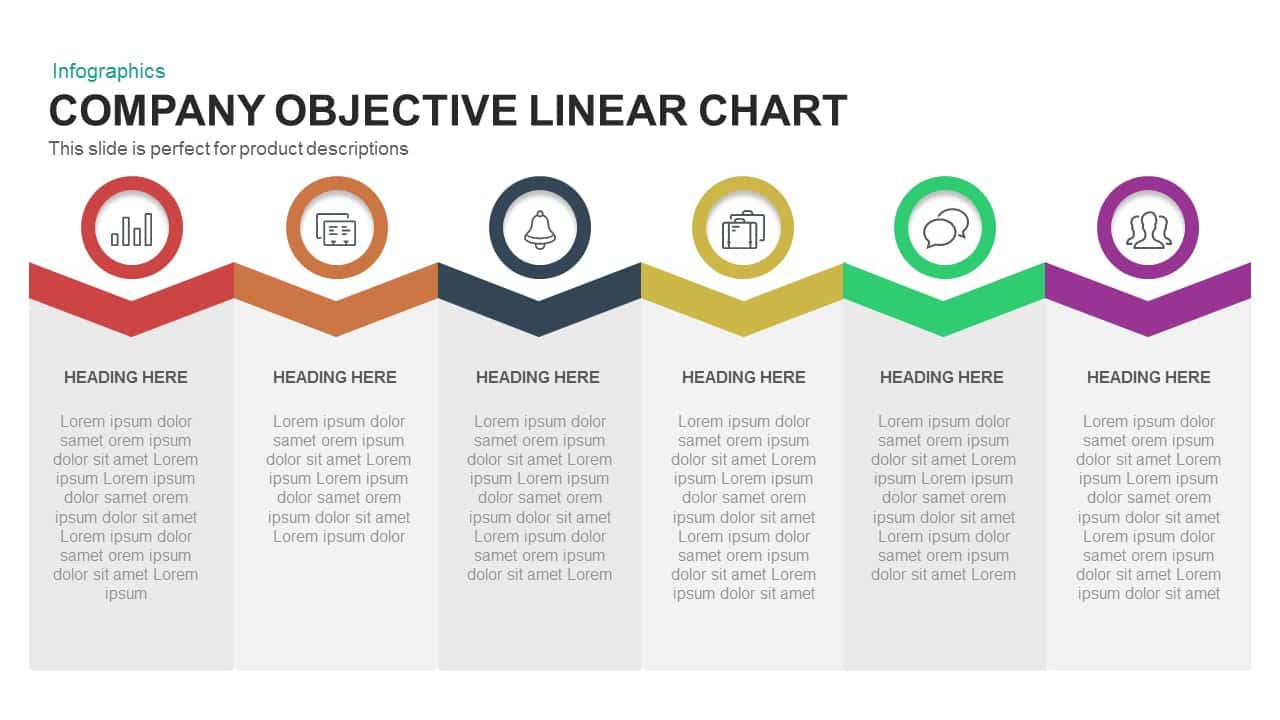
Company Objective Linear Chart Template for PowerPoint & Google Slides
Flow Charts
3D Line Chart for PowerPoint & Google Slides
Charts
Cone Data Chart for PowerPoint & Google Slides
Charts
Comparison Chart Overview template for PowerPoint & Google Slides
Comparison Chart
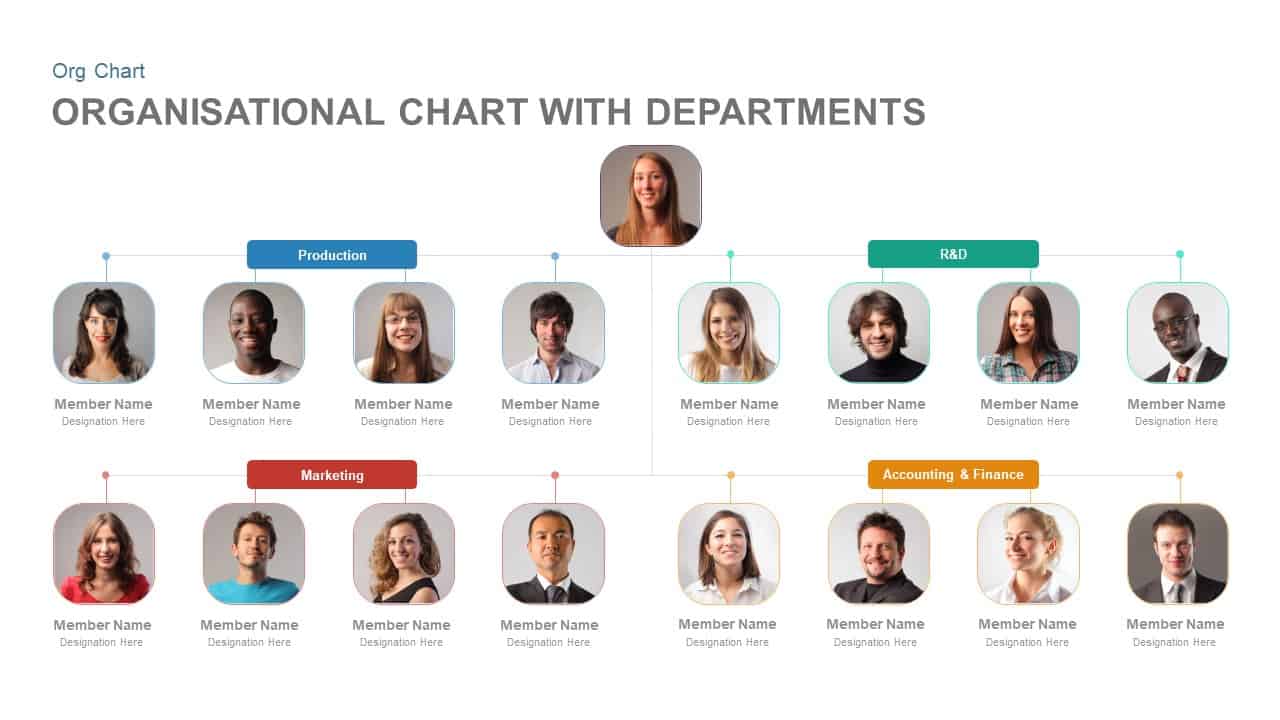
Organisational Chart with Departments Template for PowerPoint & Google Slides
Org Chart
RASCI Responsibility Matrix Chart Template for PowerPoint & Google Slides
Business
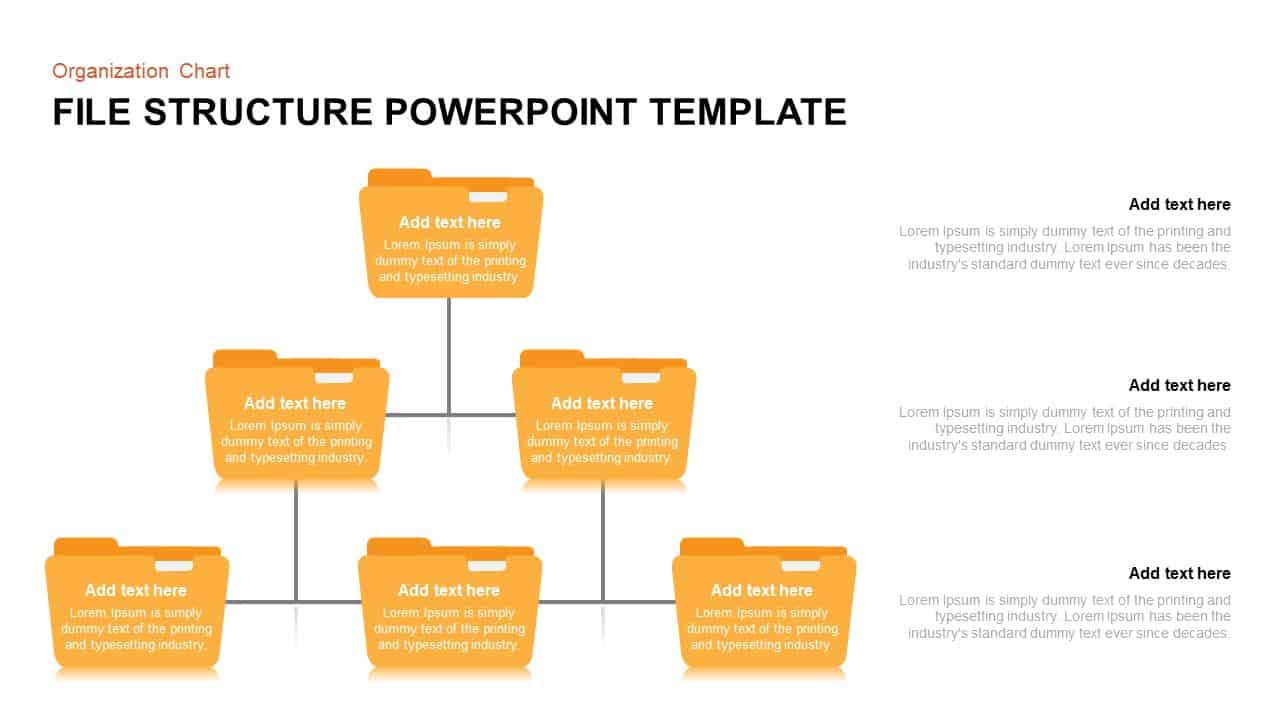
File Structure Organization Chart Template for PowerPoint & Google Slides
Org Chart
Flow Chart Diagram Template for PowerPoint & Google Slides
Flow Charts
30-60-90 Day Donut Chart Plan Infographic Template for PowerPoint & Google Slides
Timeline
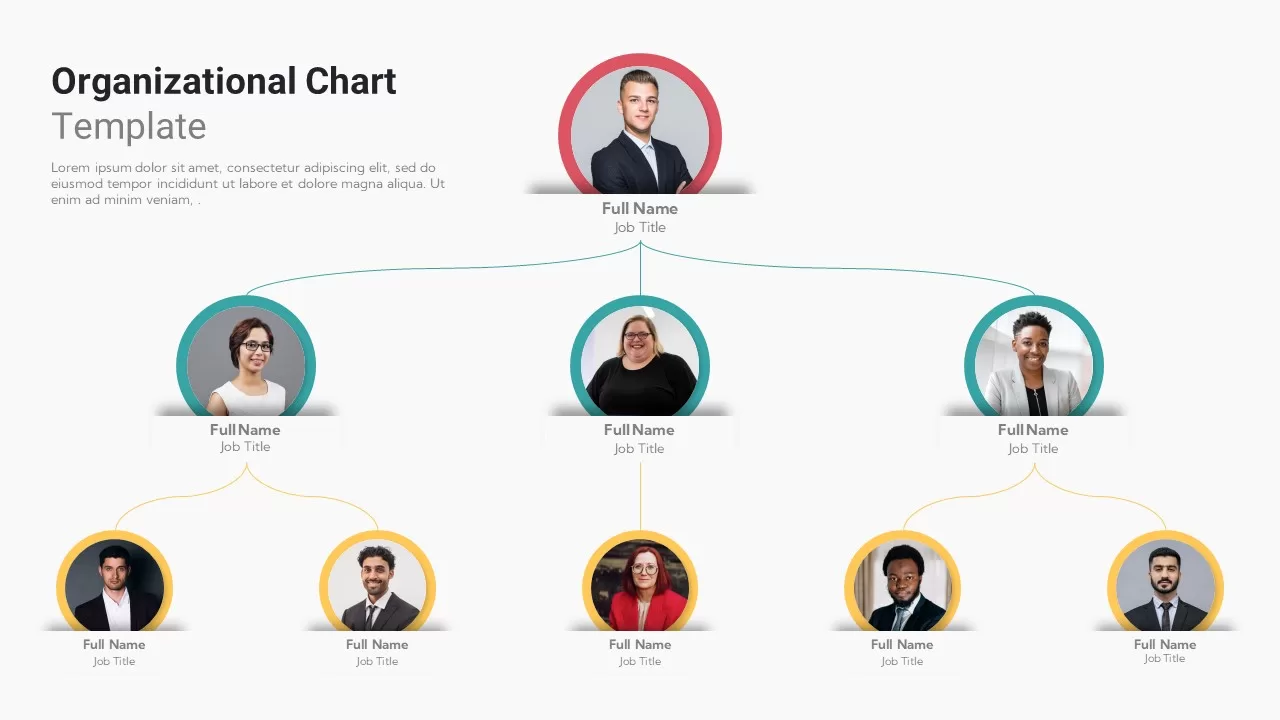
Modern Photo-Based Organizational Chart Template for PowerPoint & Google Slides
Org Chart
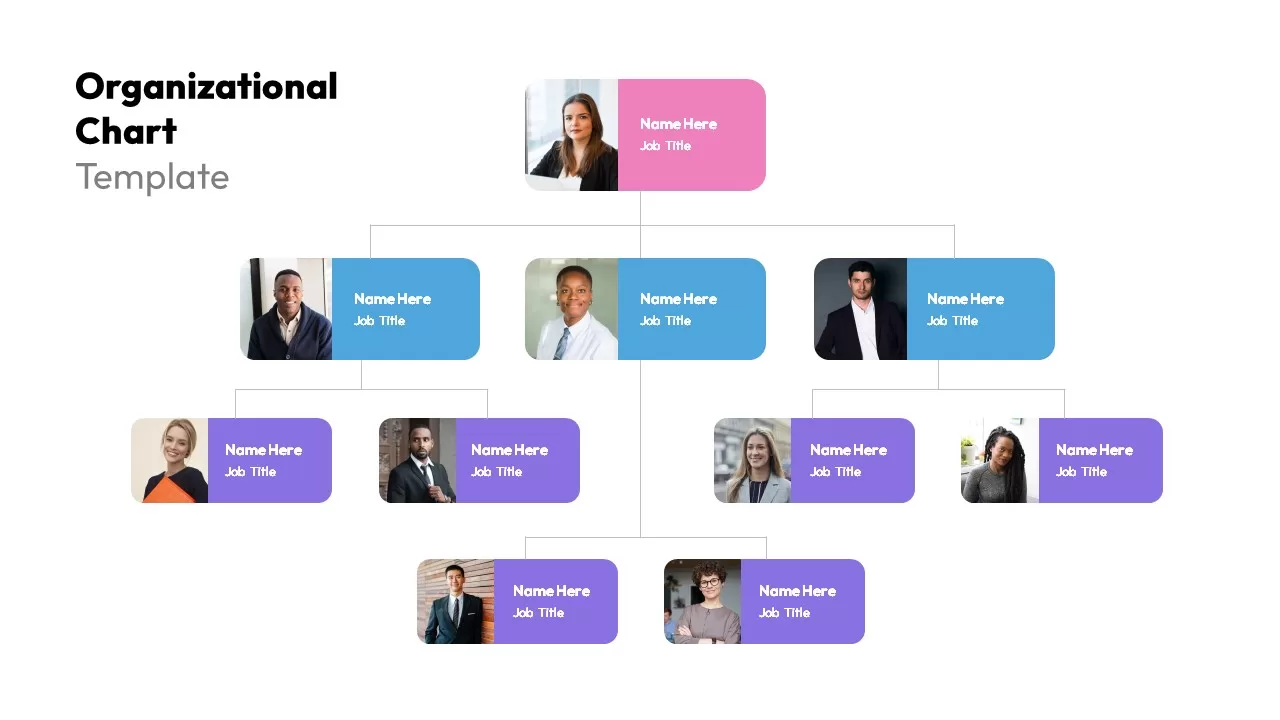
Modern Image-Based Organizational Chart Template for PowerPoint & Google Slides
Infographics
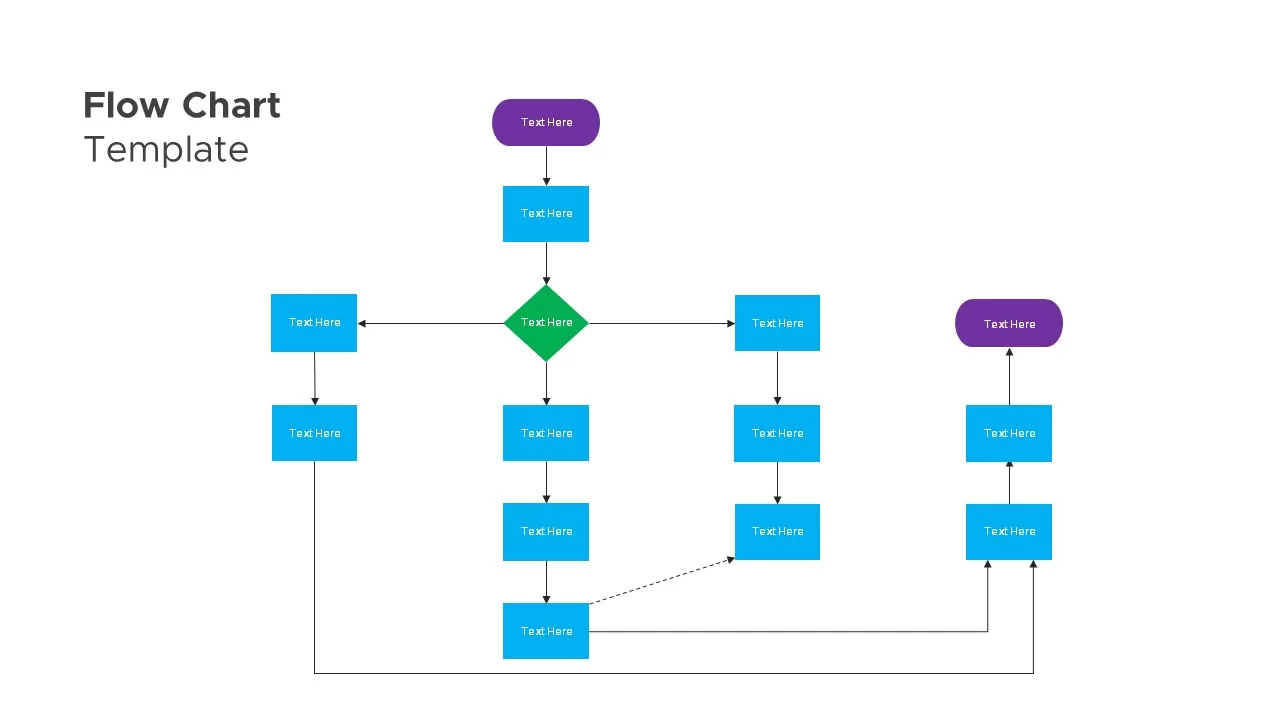
Flow Chart Template for PowerPoint & Google Slides
Flow Charts
Flow Chart Template for PowerPoint & Google Slides
Flow Charts
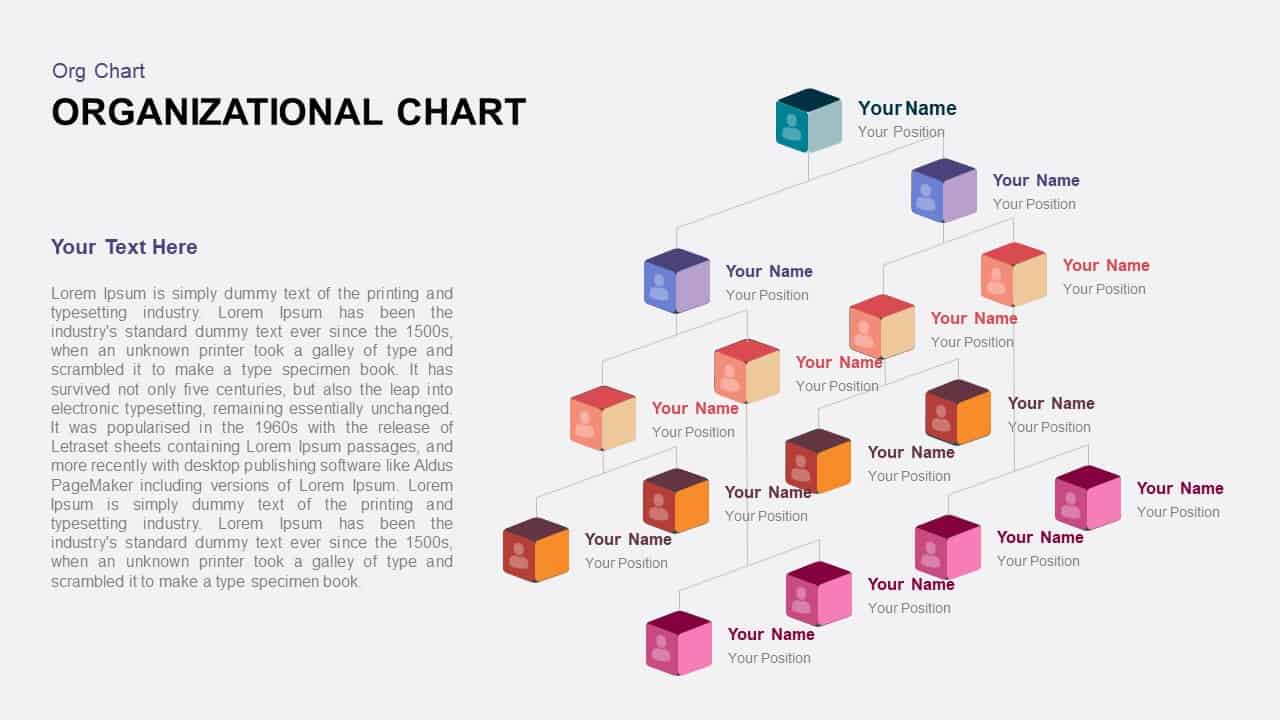
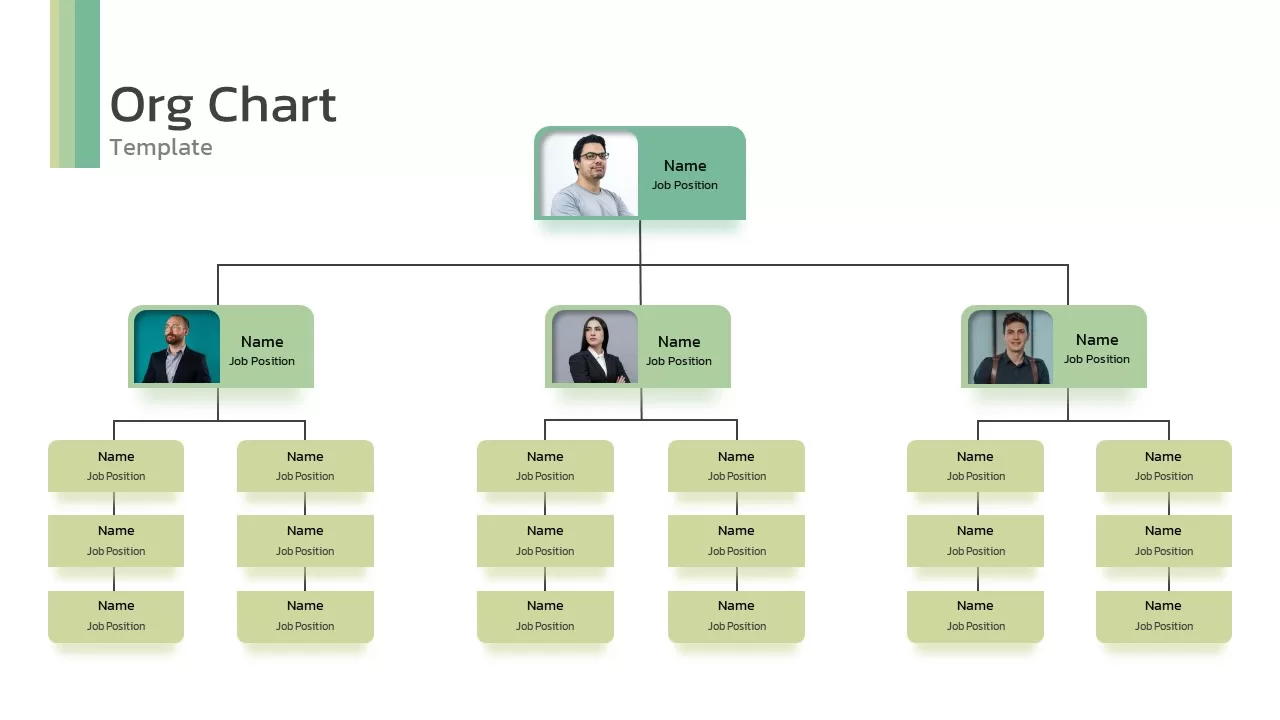
Organizational Chart template for PowerPoint & Google Slides
Org Chart
Free Circular Multi-Step Flow Chart Diagram Template for PowerPoint & Google Slides
Flow Charts
Free
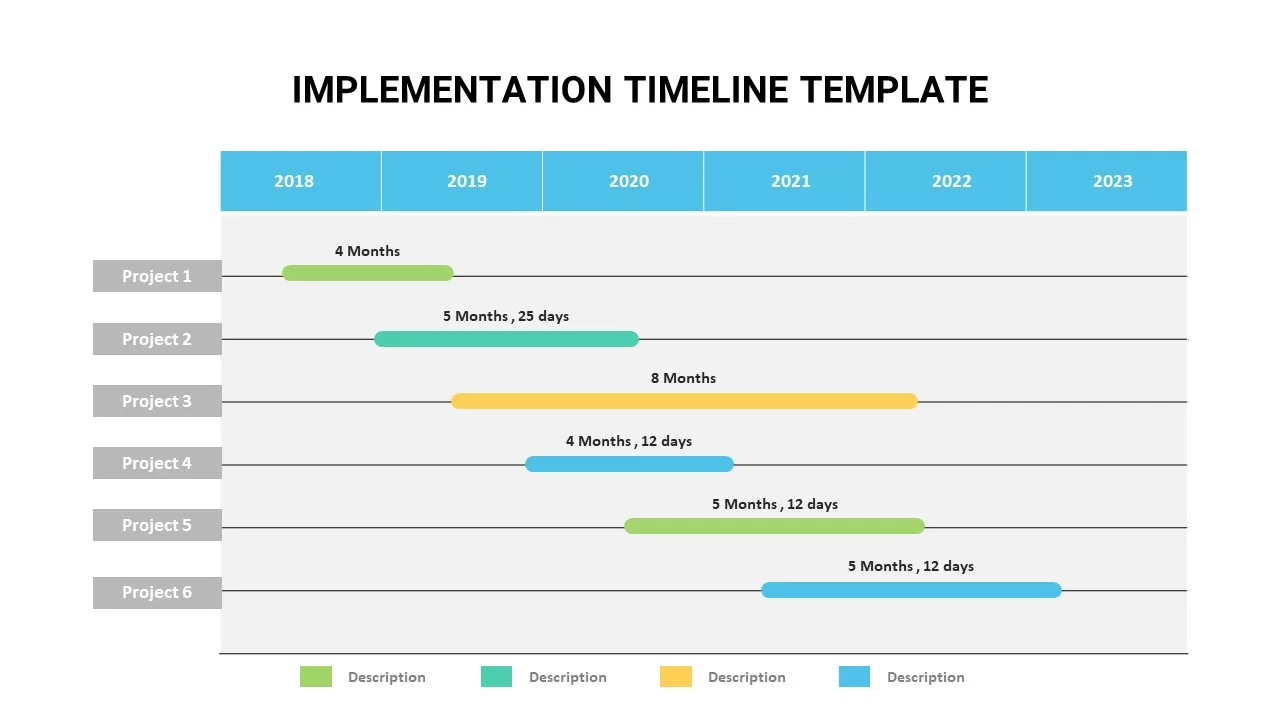
Animated Implementation Timeline Chart Template for PowerPoint & Google Slides
Timeline
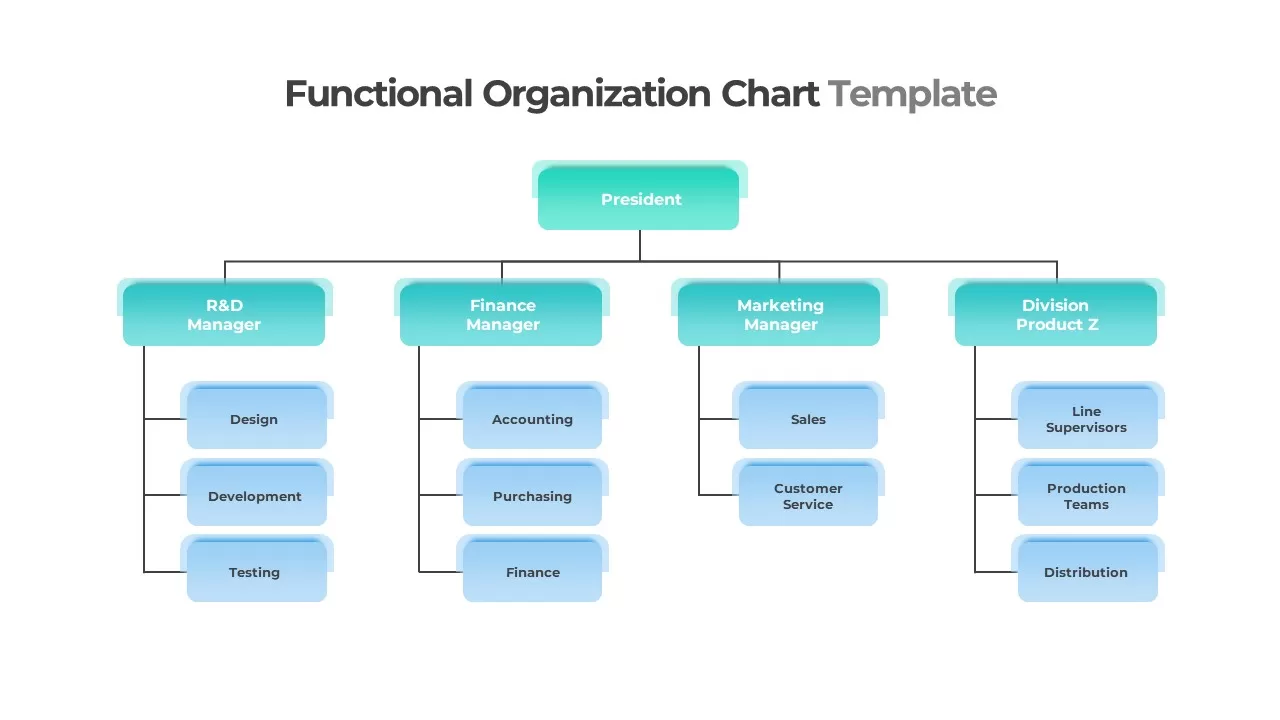
Functional Organization Chart Structure Template for PowerPoint & Google Slides
Org Chart
Donut Chart Presentation for PowerPoint & Google Slides
Pie/Donut
Monthly Recurring Revenue KPI Bar Chart Template for PowerPoint & Google Slides
Bar/Column
Free Stacked Column Chart Data Visualization Template for PowerPoint & Google Slides
Bar/Column
Free
Combination Bar and Line Chart Template for PowerPoint & Google Slides
Bar/Column
Animated Clustered Bar Chart Template for PowerPoint & Google Slides
Bar/Column
Simple Scatter Chart Analysis Template for PowerPoint & Google Slides
Comparison Chart
XY Bubble Chart Data Visualization Template for PowerPoint & Google Slides
Comparison Chart
Simple Area Chart Data Trends Analysis Template for PowerPoint & Google Slides
Comparison Chart
Waterfall Bar Chart Analysis Template for PowerPoint & Google Slides
Bar/Column
Data Over Time Line Chart template for PowerPoint & Google Slides
Charts
Rectangle Area Chart with Gradient Fill Template for PowerPoint & Google Slides
Comparison Chart
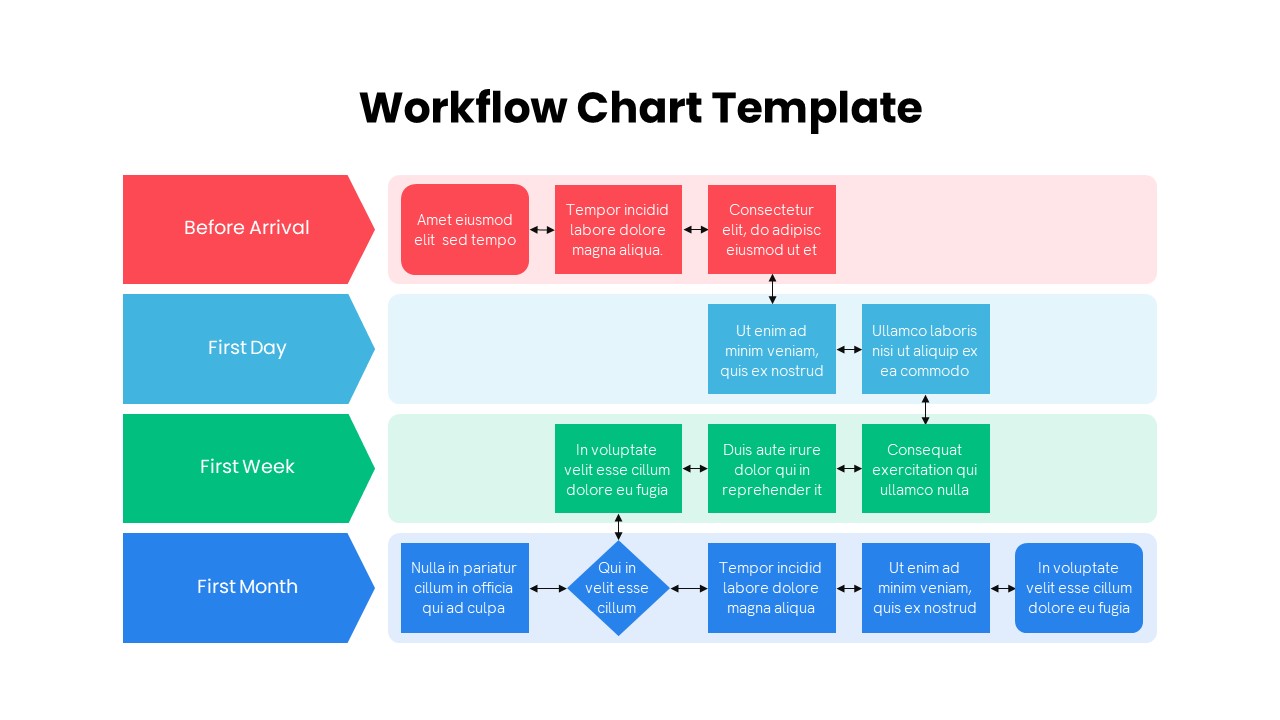
Colorful Multistage Workflow Chart Template for PowerPoint & Google Slides
Flow Charts
Stacked Waterfall Chart Template for PowerPoint & Google Slides
Bar/Column
Professional Milestone Timeline Chart Template for PowerPoint & Google Slides
Timeline
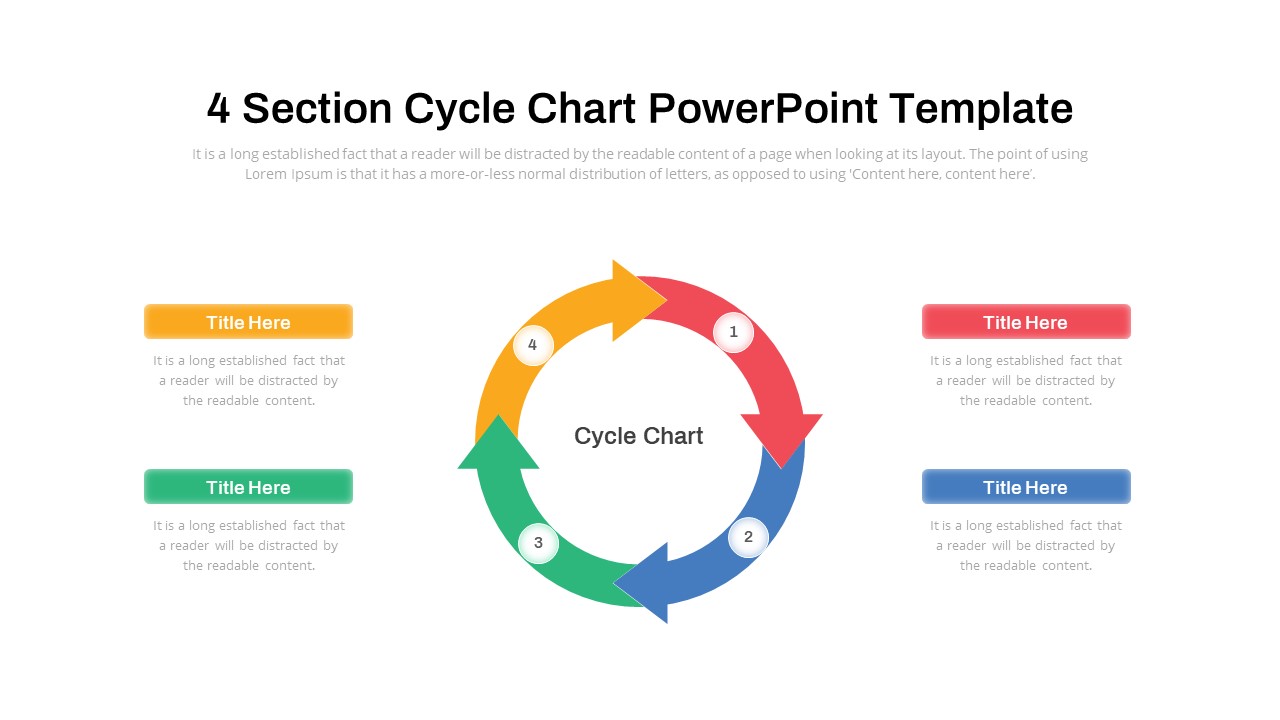
Cycle Chart Template for PowerPoint & Google Slides
Circular
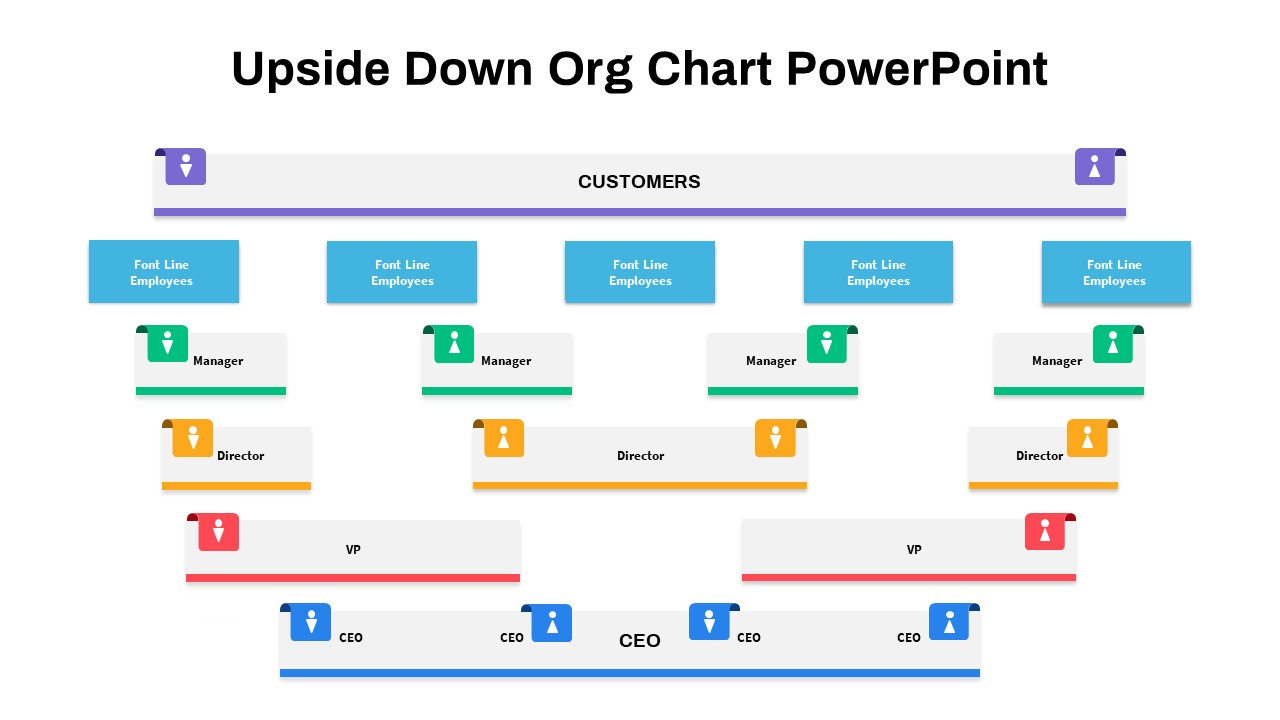
Upside-Down Organizational Chart Diagram Template for PowerPoint & Google Slides
Org Chart
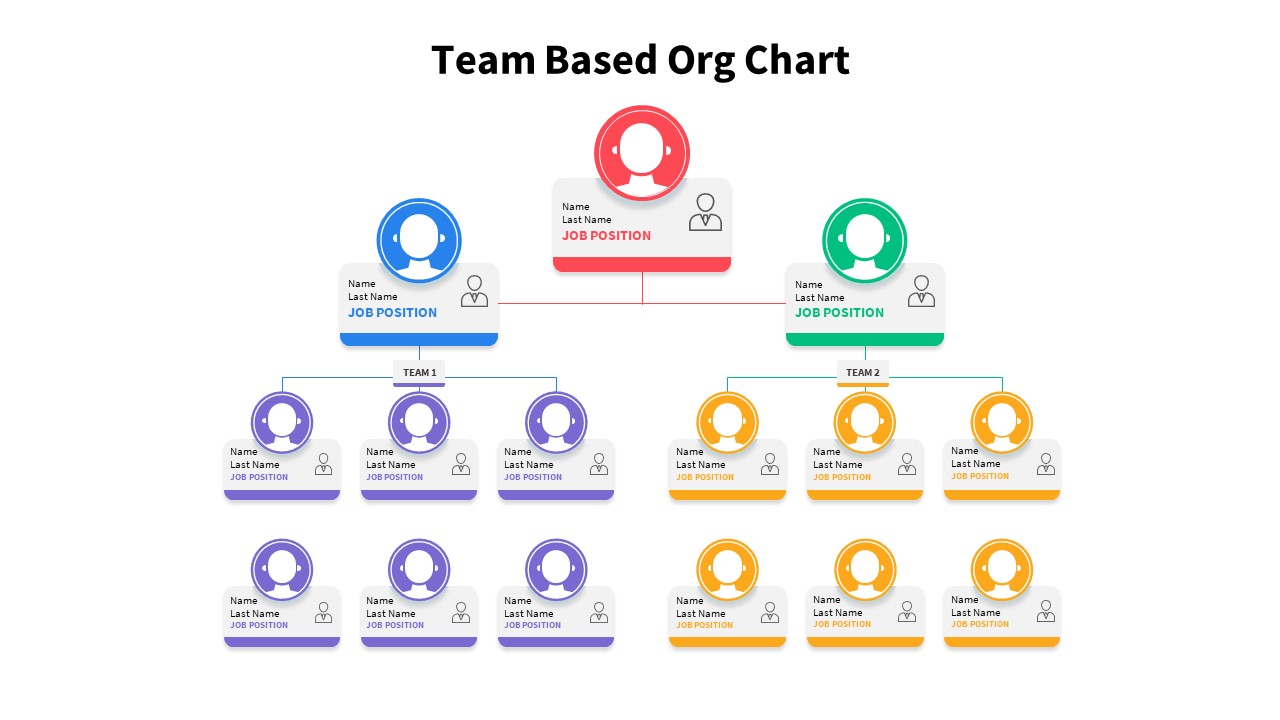
Team-Based Organizational Chart Template for PowerPoint & Google Slides
Org Chart
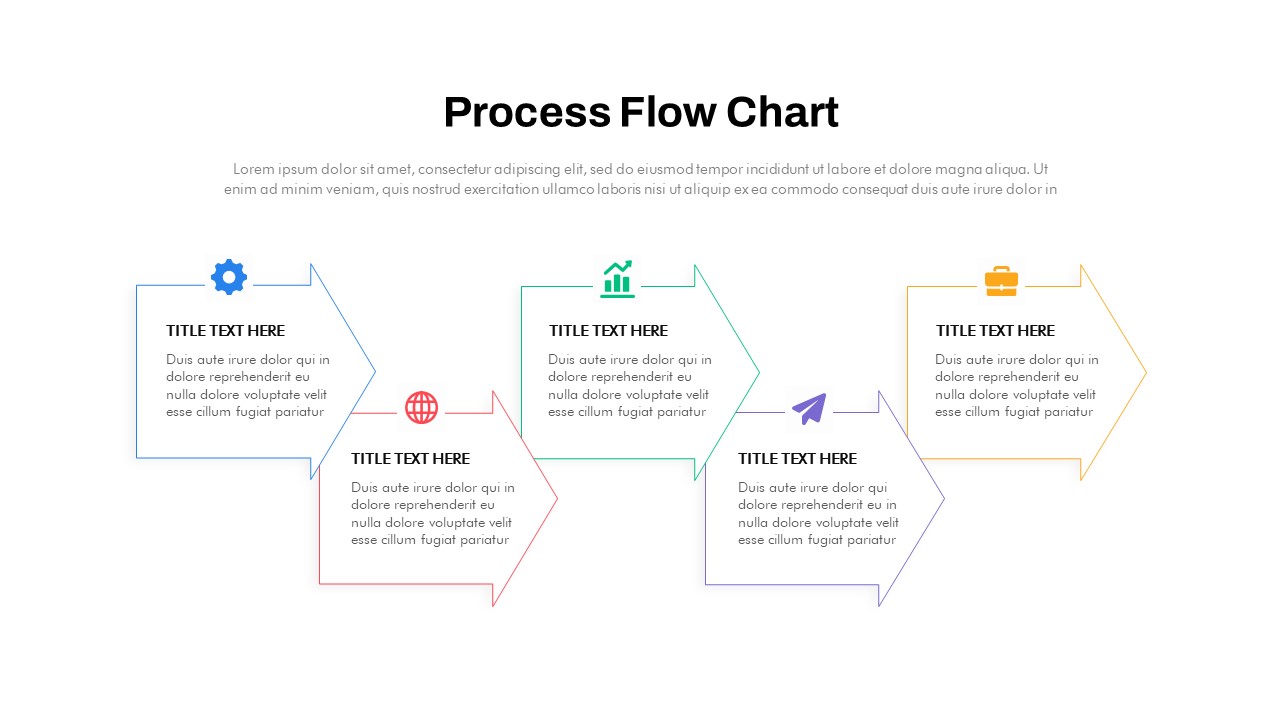
Animated Process Flow Chart Template for PowerPoint & Google Slides
Infographics
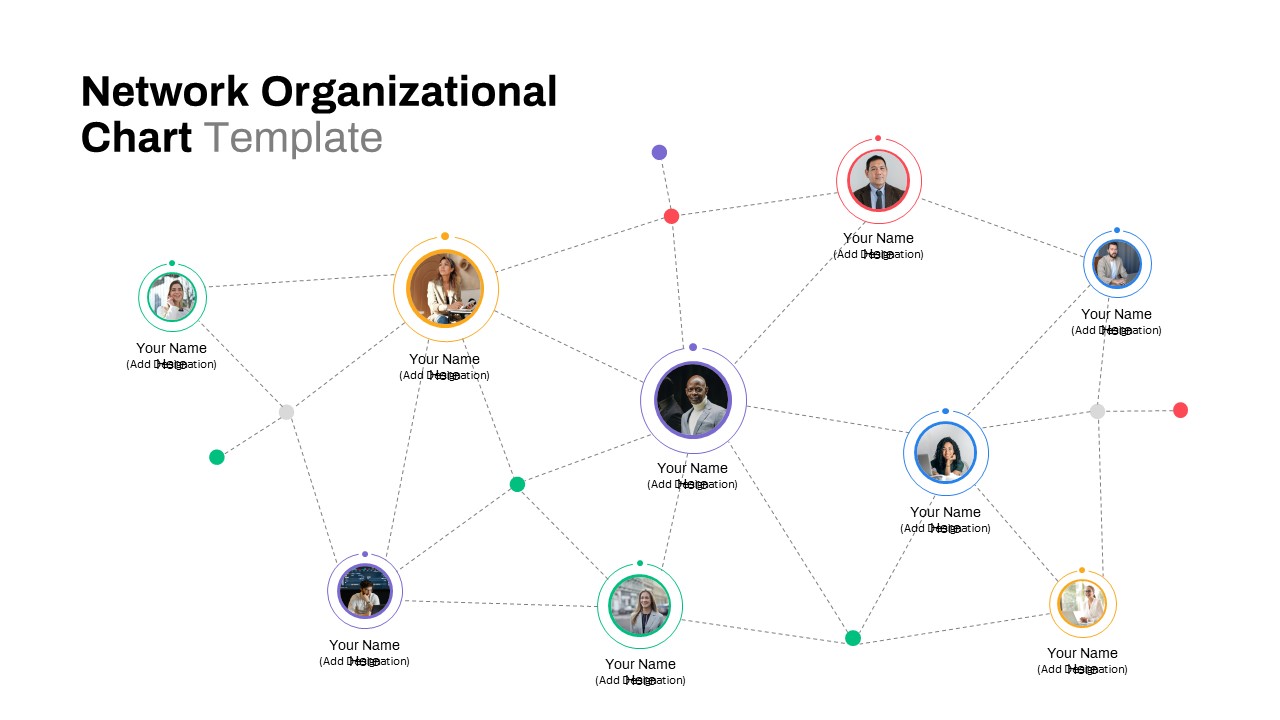
Network Organizational Chart for PowerPoint & Google Slides
Business
Dynamic Sunburst Chart Visualization Template for PowerPoint & Google Slides
Charts
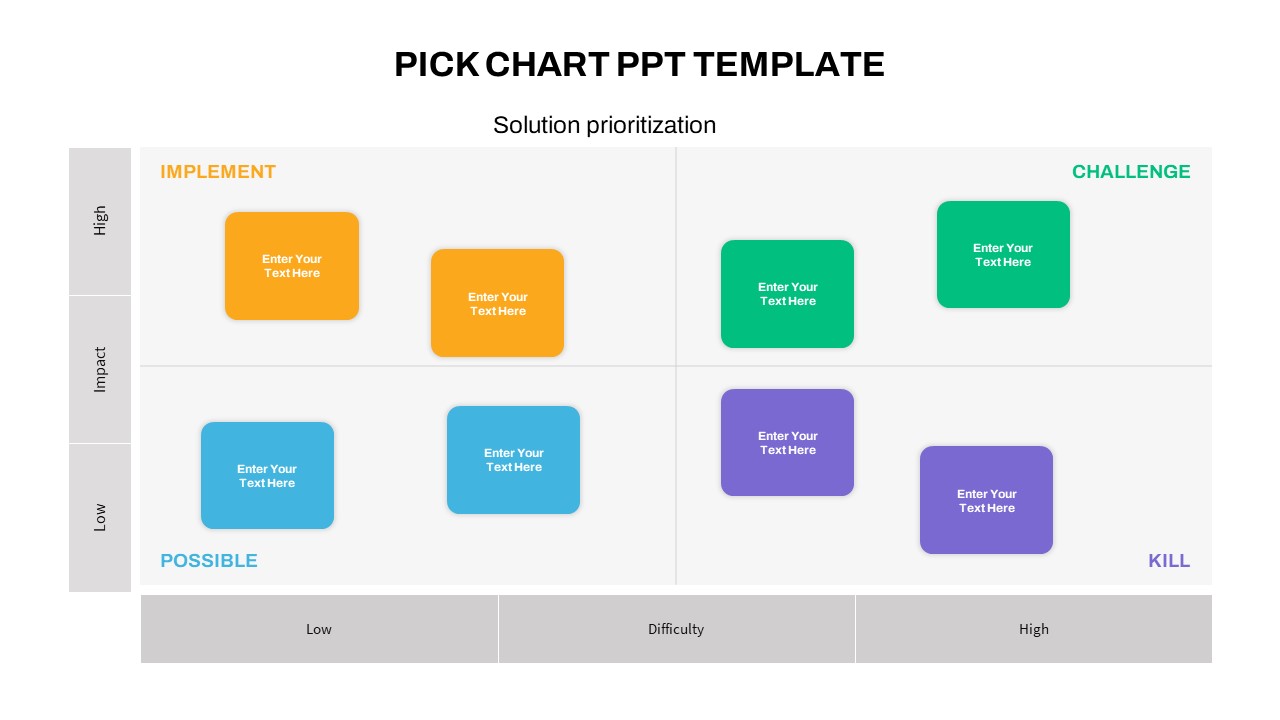
PICK Chart Matrix for Solution Prioritization in PowerPoint & Google Slides
Comparison
Dynamic Bar-of-Pie Chart Comparison Template for PowerPoint & Google Slides
Pie/Donut
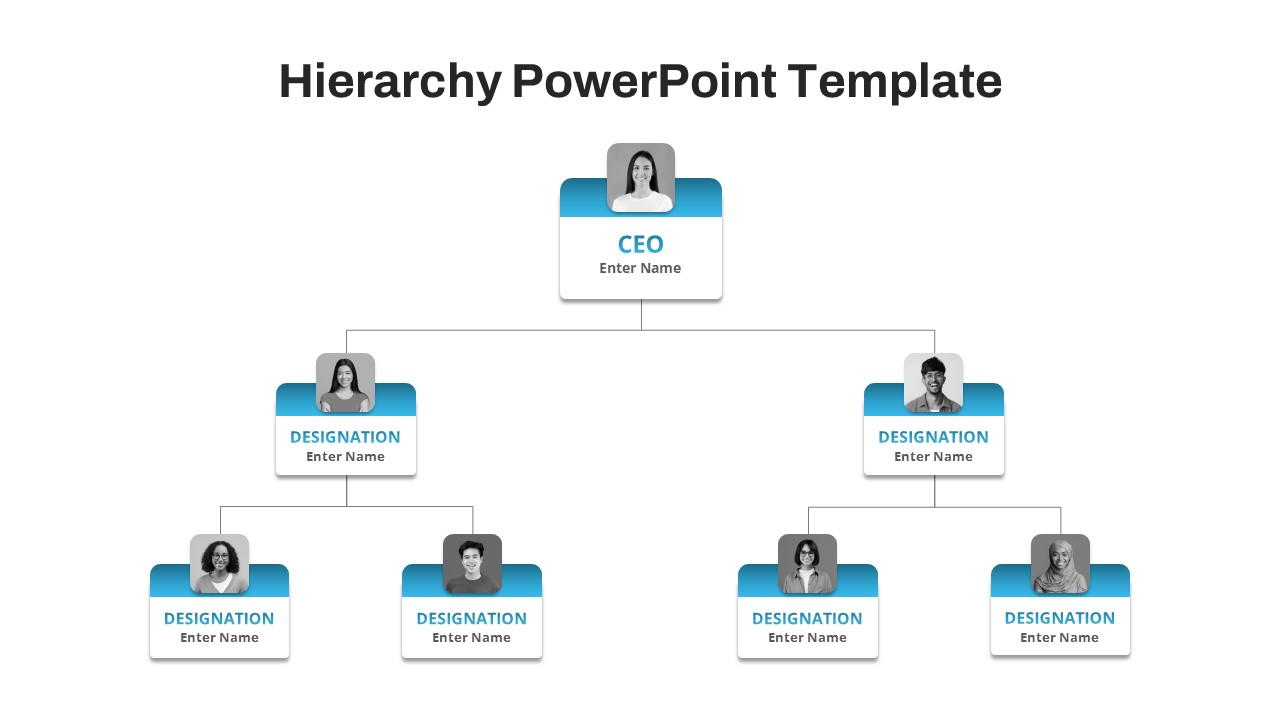
Free Corporate Hierarchy Organizational Chart Template for PowerPoint & Google Slides
Org Chart
Free
Quarterly Credit Loss Provisions Chart Template for PowerPoint & Google Slides
Bar/Column
Expanding Margins Analysis Bar Chart Template for PowerPoint & Google Slides
Charts
Dynamic Financial Analysis Line Chart Template for PowerPoint & Google Slides
Finance
Profile Comparison Chart template for PowerPoint & Google Slides
Comparison Chart
Sales Growth Comparison Chart & Table Template for PowerPoint & Google Slides
Bar/Column
3D Pyramid Column Chart Infographic Template for PowerPoint & Google Slides
Bar/Column
Technical Skills Donut Chart Overview Template for PowerPoint & Google Slides
HR
Skills Gap Analysis Comparison Chart Template for PowerPoint & Google Slides
Gap
Color-Coded Gantt Chart template for PowerPoint & Google Slides
Business
Team Gantt Chart Overview template for PowerPoint & Google Slides
Project Status
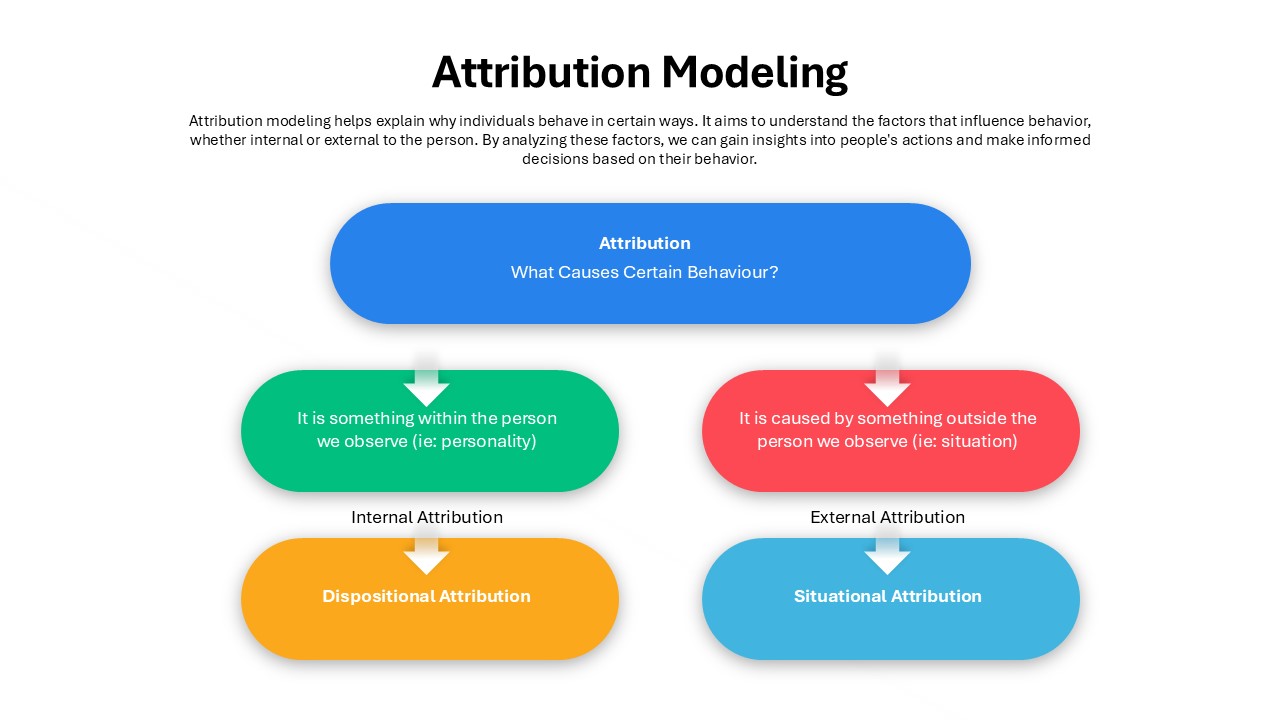
Attribution Modeling Flow Chart Template for PowerPoint & Google Slides
Flow Charts
Marketing Budget Allocation Donut Chart Template for PowerPoint & Google Slides
Marketing
Static Gantt Chart Overview template for PowerPoint & Google Slides
Project Status
USA Map with Bar Chart Template for PowerPoint & Google Slides
World Maps
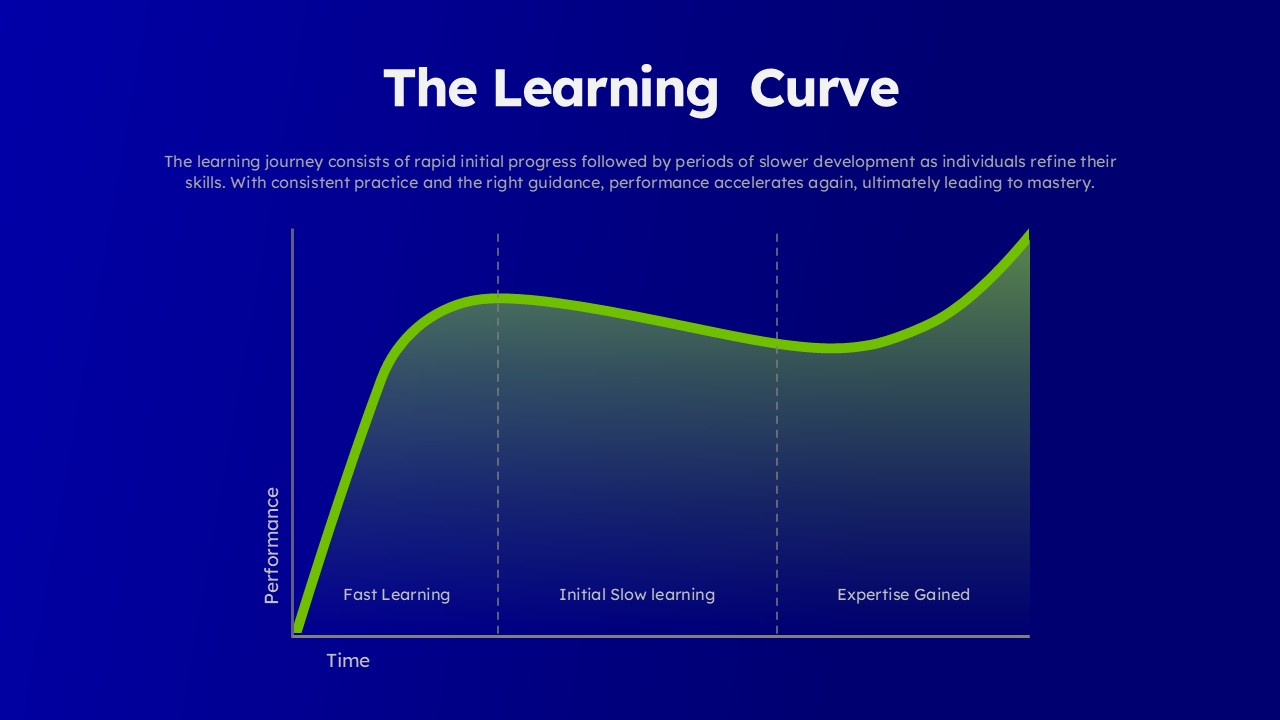
Learning Curve Performance Growth Chart Template for PowerPoint & Google Slides
Employee Performance