Effort Optimization PDCA Circle Diagram Template for PowerPoint & Google Slides

Description
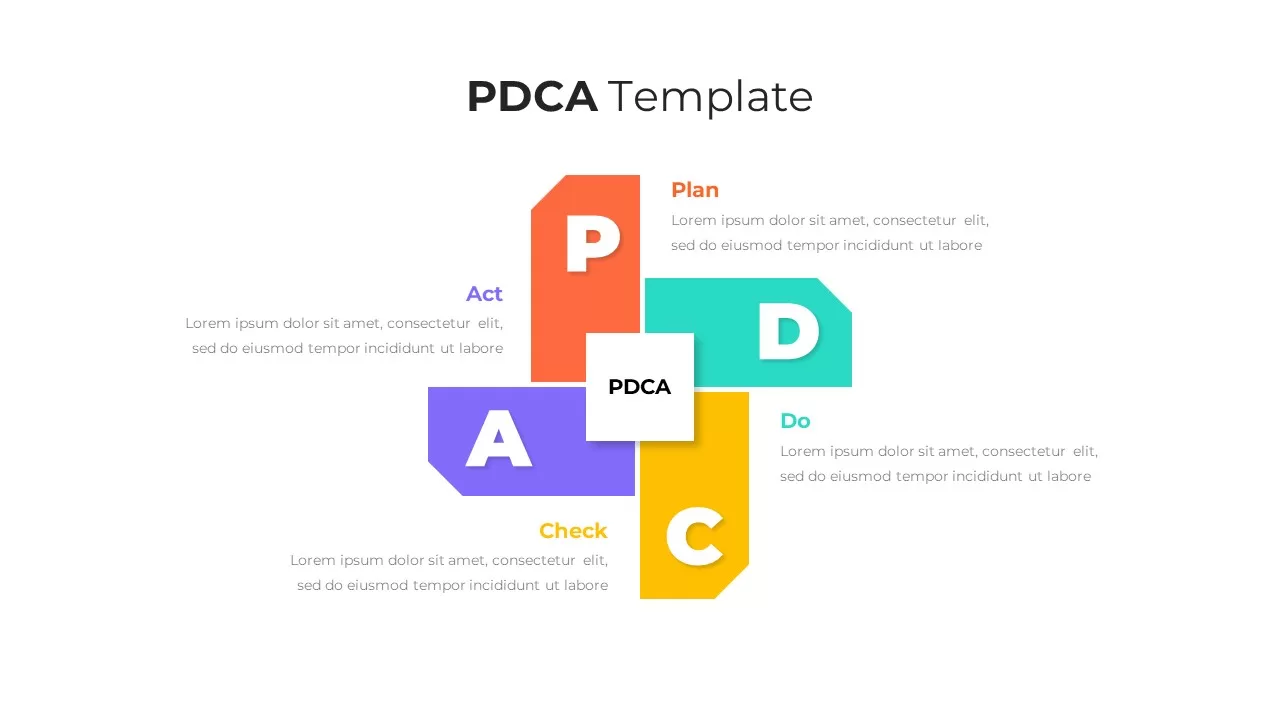
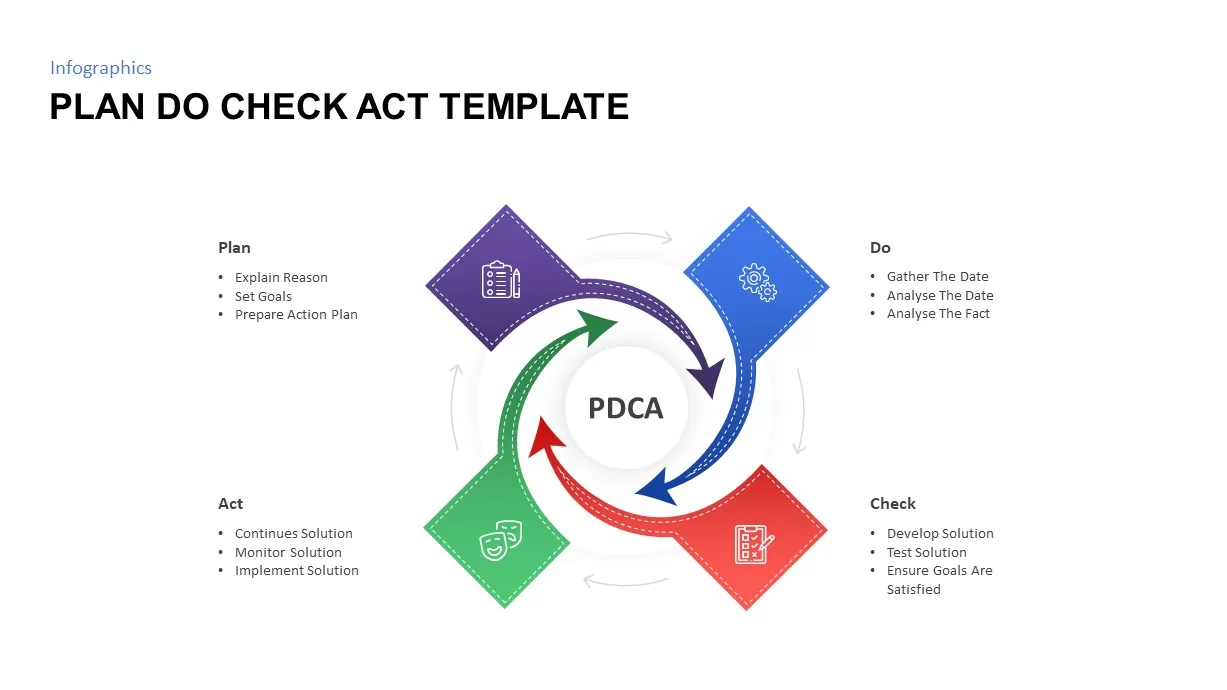
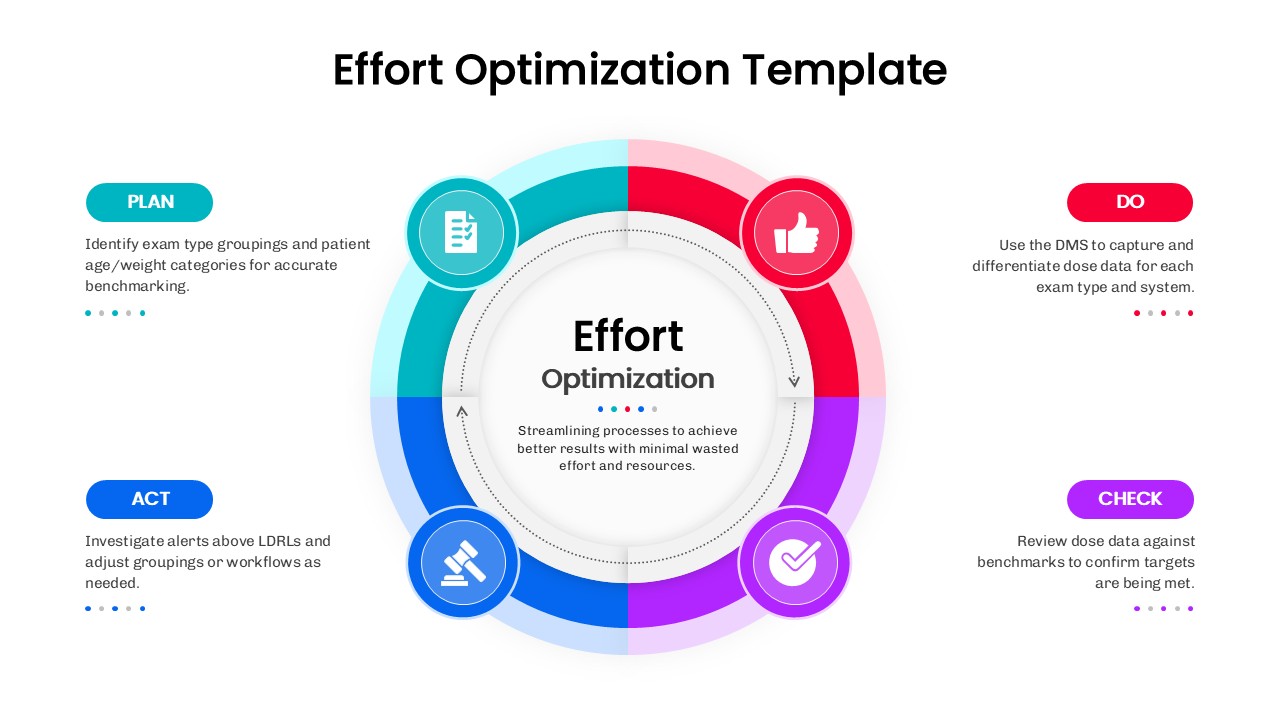
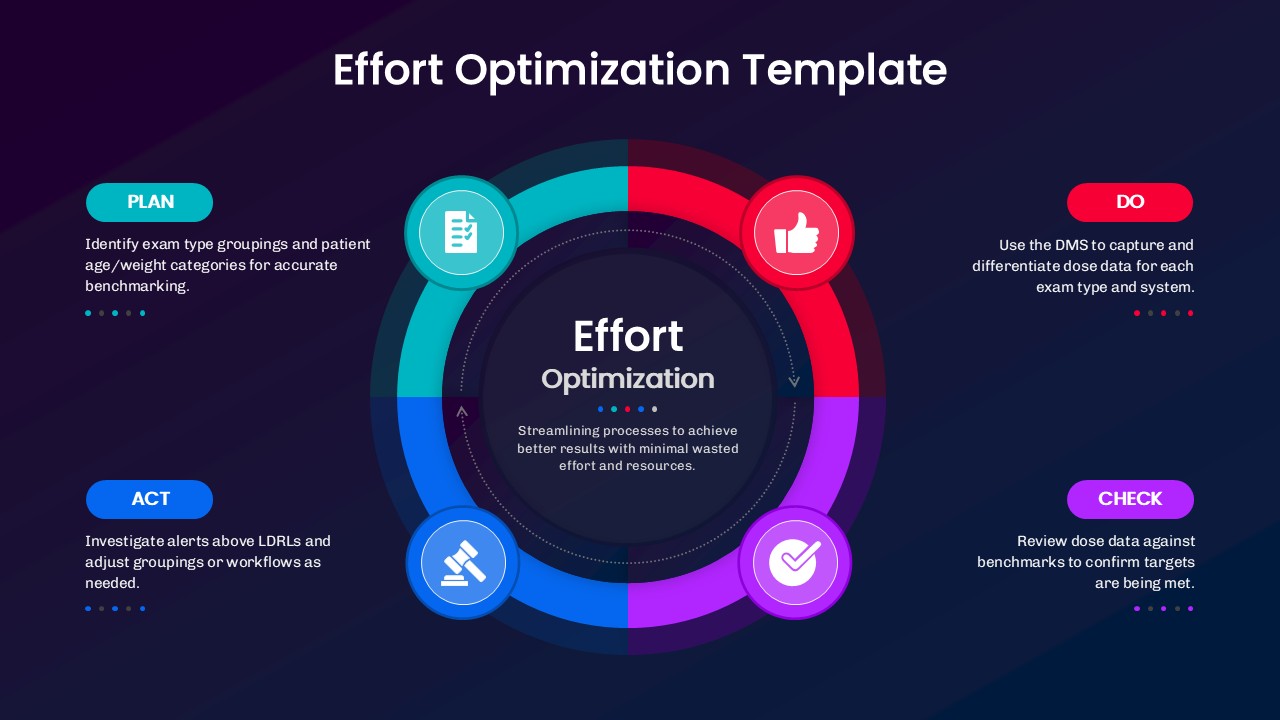
Showcase continuous improvement with a polished PDCA cycle focused on effort optimization. This slide centers a soft-shadow circular core titled “Effort Optimization,” surrounded by four bold, color-coded quadrants. Each segment maps a phase—PLAN, DO, CHECK, ACT—with a matching icon (clipboard, thumbs-up, checkmark, gavel) to boost instant recognition. Side callouts provide space for brief guidance, metrics, or benchmarks, while the concentric rings and subtle arrows emphasize iteration and momentum. The layout is clean, balanced, and presentation-ready, ensuring your message remains clear from the boardroom to operational huddles.
Every element is fully editable in both PowerPoint and Google Slides: swap icons, rewrite labels, recolor quadrants to match brand palettes, or resize the central objective to spotlight outcomes. The composition works equally well for summarizing procedures, standardizing workflows, or reporting improvements against targets. Its circular form communicates continuity and accountability, making it ideal for Kaizen, Lean, and quality management updates. Use the center to state the goal (e.g., “Streamlining processes to achieve better results with minimal wasted effort and resources”) and the surrounding panels to detail actions, responsibilities, and evidence.
With its modern typography, rounded buttons, and crisp spacing, this diagram turns complex cycles into an easy-to-scan narrative. Duplicate the slide to track progress over multiple sprints, compare teams, or document lessons learned—without rebuilding visuals from scratch.
Who is it for
Operations leaders, quality managers, project managers, consultants, and PMO teams seeking a clear PDCA framework for reviews, stand-ups, and executive updates.
Other Uses
Apply the cycle to compliance checks, service delivery tuning, healthcare process reviews, product support loops, onboarding improvements, or quarterly performance retrospectives.
Login to download this file

Item ID
SB05590Designed By
Naseeba
Related Templates

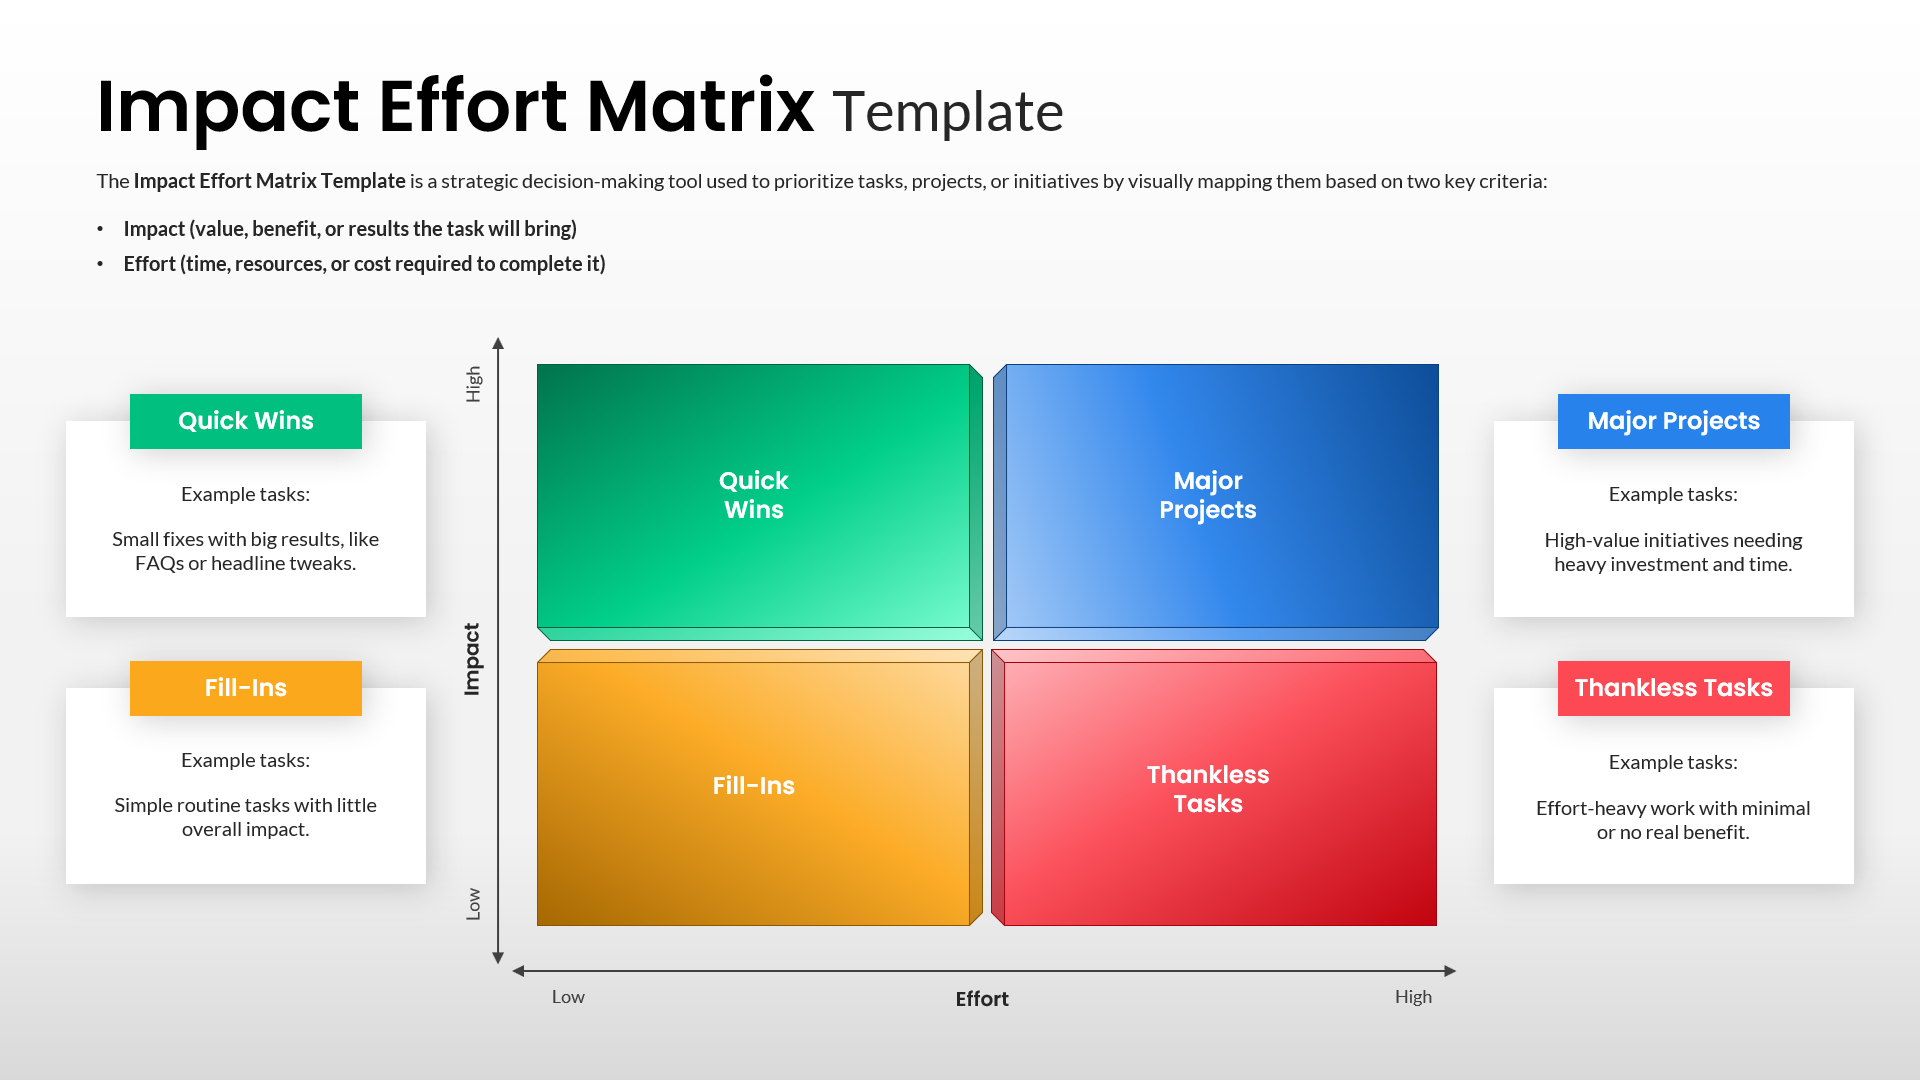
Impact Effort Matrix Template for PowerPoint & Google Slides
Comparison Chart

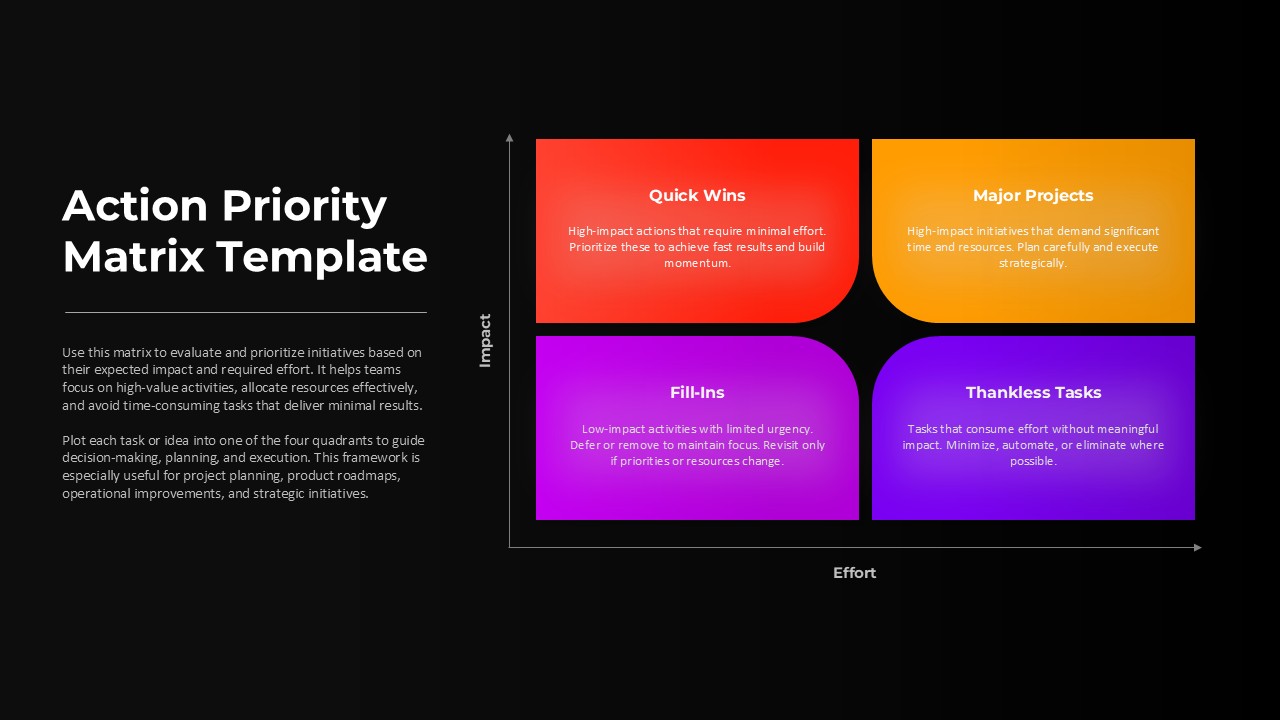
Action Priority Impact Effort Matrix Template for PowerPoint & Google Slides
Business Strategy
Google Ads Optimization & Performance Infographic Template for PowerPoint & Google Slides
Digital Marketing
Voice Search Optimization Strategies Template for PowerPoint & Google Slides
Digital Marketing
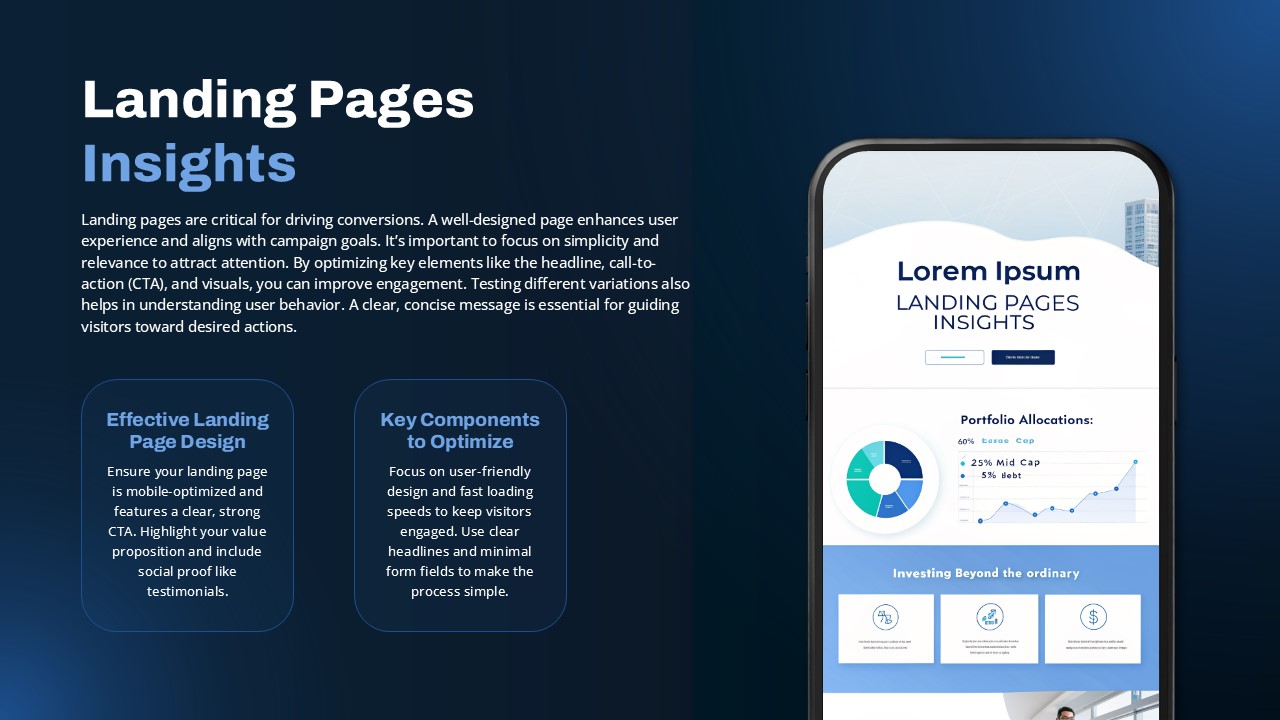
Landing Pages Optimization Insights Template for PowerPoint & Google Slides
Marketing Funnel
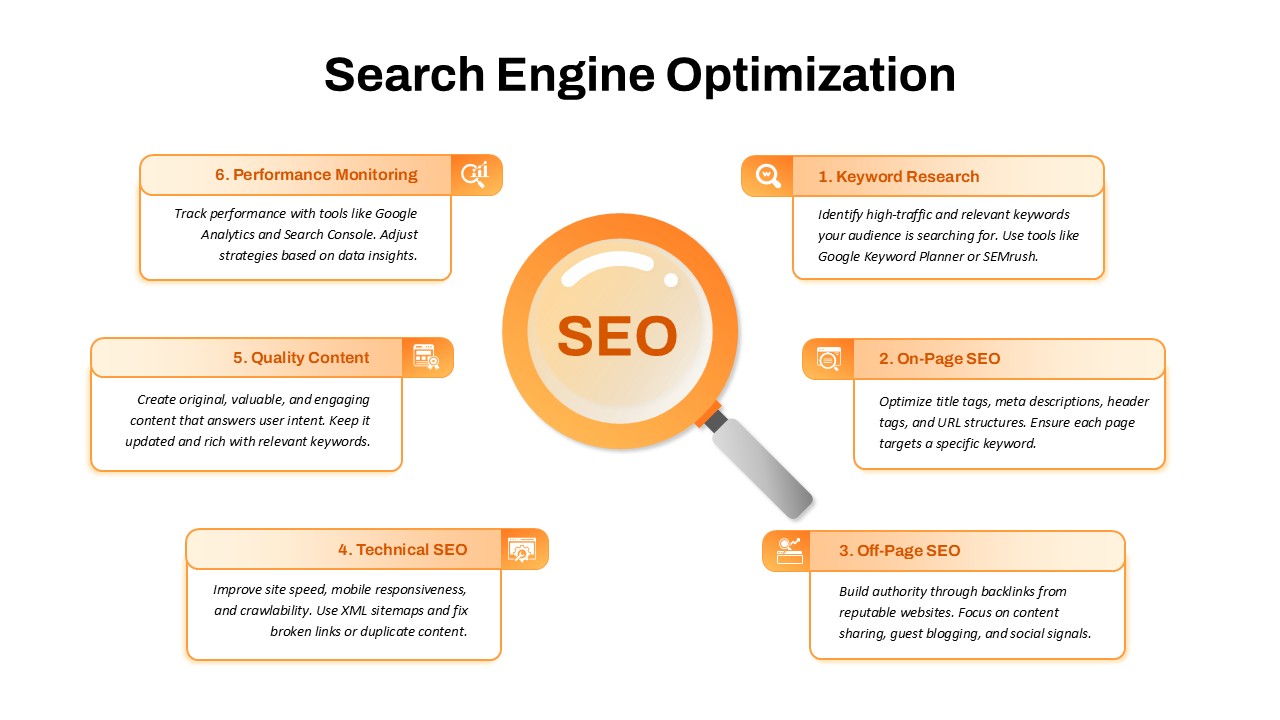
Search Engine Optimization Process Template for PowerPoint & Google Slides
Digital Marketing
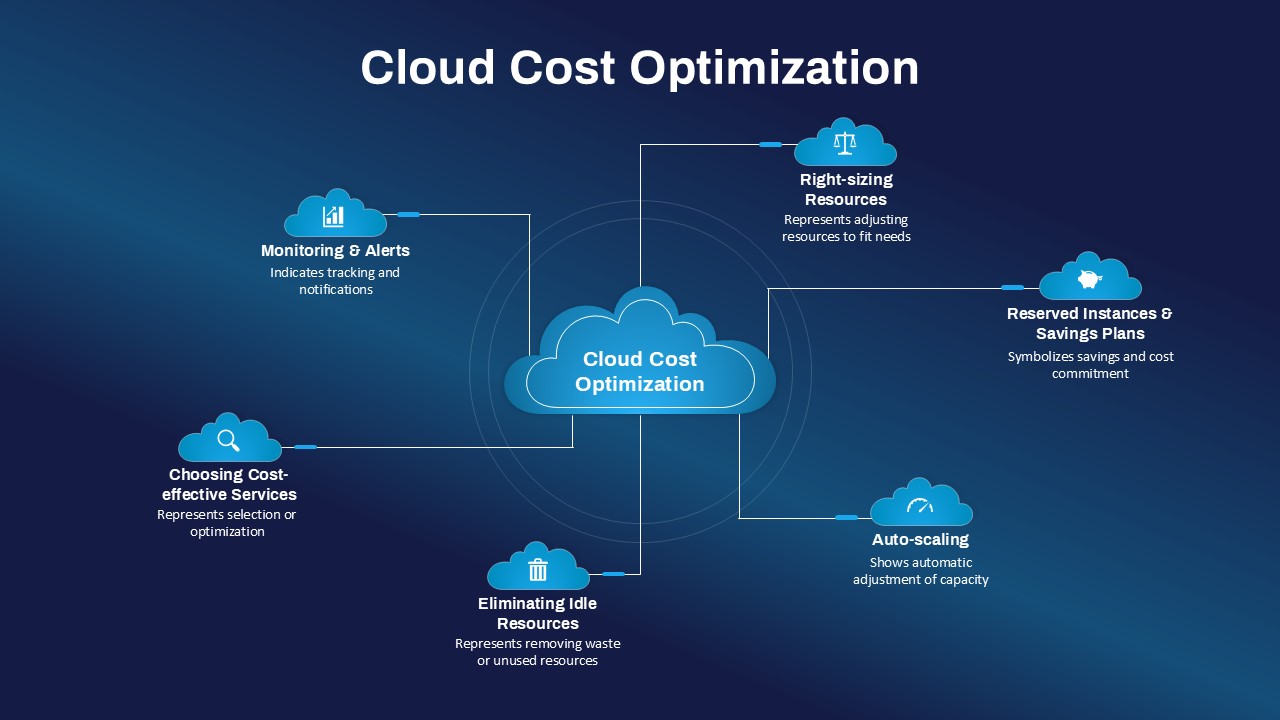
Cloud Cost Optimization Hub-and-Spoke Template for PowerPoint & Google Slides
Cloud Computing
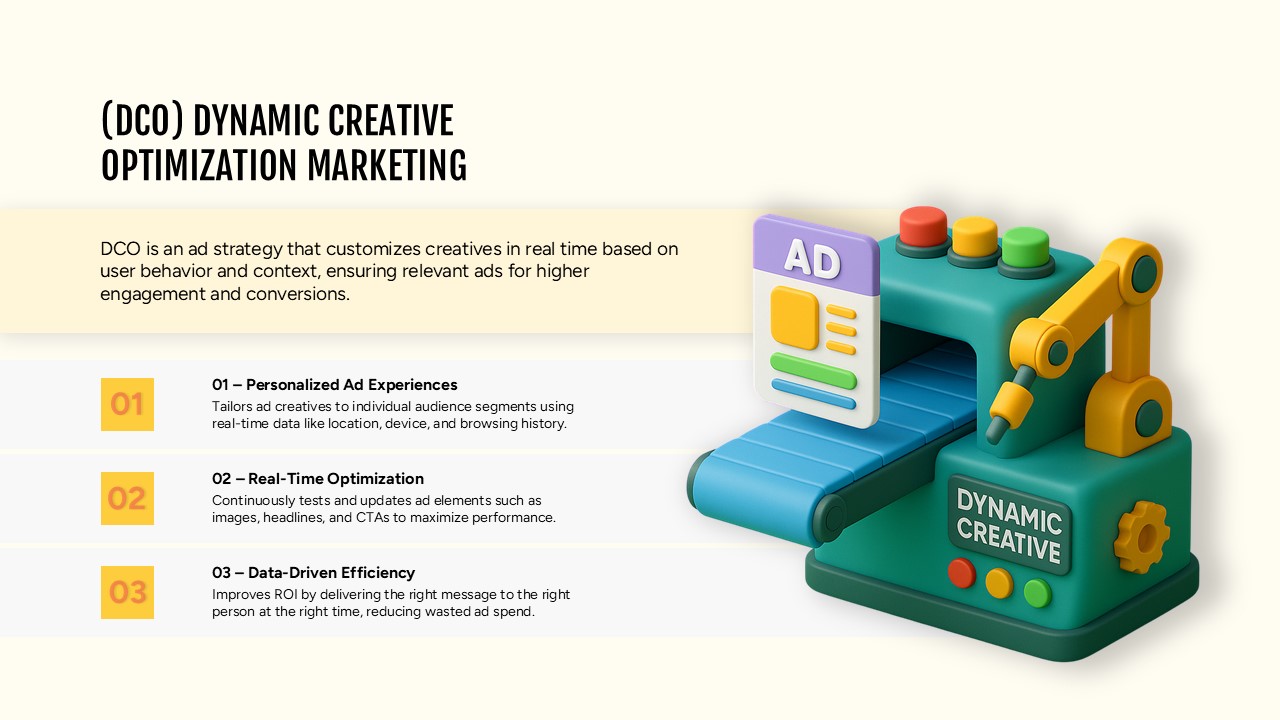
Dynamic Creative Optimization Marketing Template for PowerPoint & Google Slides
Digital Marketing
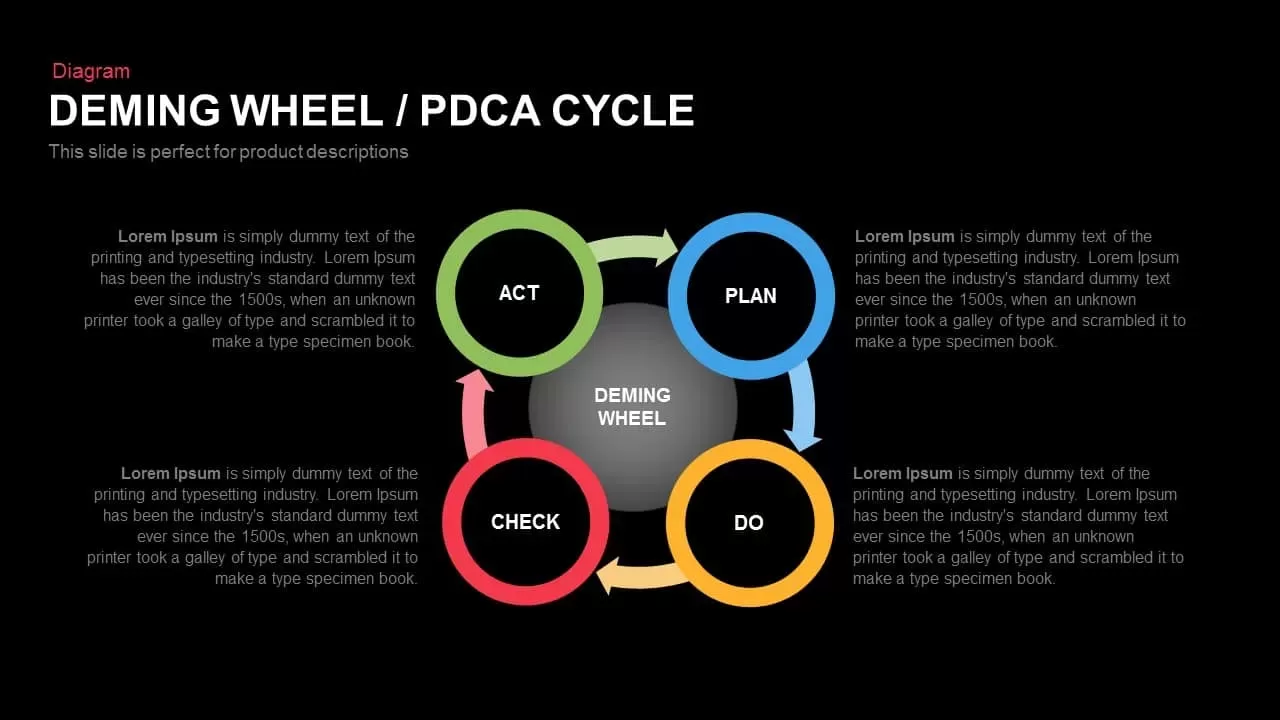
Deming Wheel PDCA Cycle Diagram Template for PowerPoint & Google Slides
Business Plan

4-Step Circular PDCA Cycle Diagram Template for PowerPoint & Google Slides
Process
Elegant PDCA Four-Step Process Diagram Template for PowerPoint & Google Slides
Process
Plan Do Check Act PDCA Cycle Infographic Template for PowerPoint & Google Slides
Process
PDCA Cycle Infographic with Four Stages Template for PowerPoint & Google Slides
Process
PDCA Plan Do Check Act Cycle Infographic Template for PowerPoint & Google Slides
Process
PDCA Four-Stage Cycle Infographic Template for PowerPoint & Google Slides
Process
Free Eight Circle Creative Diagram template for PowerPoint & Google Slides
Circular
Free
Circle Spider Diagram Representation Template for PowerPoint & Google Slides
Circular
Modern Circle SWOT Analysis Diagram Template for PowerPoint & Google Slides
SWOT
Modern Nine Circle Network Diagram Template for PowerPoint & Google Slides
Circular
Alternating Circle Timeline Diagram Template for PowerPoint & Google Slides
Timeline
Three Circle Arrow Process Diagram template for PowerPoint & Google Slides
Circular
Multi-Segment Circle Split Diagram template for PowerPoint & Google Slides
Circular

Eight Circle Diagram Template for PowerPoint & Google Slides
Circular
Multi-layout Circle Spoke Diagram Template for PowerPoint & Google Slides
Circular

Four-Circle Venn Process Diagram template for PowerPoint & Google Slides
Process
Editable Twin Circle Process Diagram Template for PowerPoint & Google Slides
Process
Three-Level Sequence Circle Diagram Template for PowerPoint & Google Slides
Circular
Five-Staged Circle Sections Diagram Template for PowerPoint & Google Slides
Circular
Five-Stage Semi-Circle Diagram Template for PowerPoint & Google Slides
Process
Five-Stage Circle Arrow Diagram Template for PowerPoint & Google Slides
Circular
Two-Stage Semi-Circle Diagram Overview Template for PowerPoint & Google Slides
Circular
Three-Circle Diagram Infographic Template for PowerPoint & Google Slides
Circular
Modern Multi-Section Circle Diagram Template for PowerPoint & Google Slides
Circular
Six-Stage Semi-Circle Diagram with Icons Template for PowerPoint & Google Slides
Circular
Four-Circle Hub and Spoke Diagram Template for PowerPoint & Google Slides
Process
Six Staged Circle Diagram template for PowerPoint & Google Slides
Circular
Five-Point Circle Timeline Diagram Template for PowerPoint & Google Slides
Timeline
Six-Stage Circle Process Diagram Template for PowerPoint & Google Slides
Process
Four-Stage Agenda Circle Diagram Slide Template for PowerPoint & Google Slides
Agenda
Creative Three-Circle Venn Diagram Template for PowerPoint & Google Slides
Comparison
Six-Circle Process Infographic Diagram Template for PowerPoint & Google Slides
Circular
Dan Harmon Story Circle Diagram Template for PowerPoint & Google Slides
Circular
Circle Arrows Diagram template for PowerPoint & Google Slides
Process
Five Circle Venn Diagram for Template for PowerPoint & Google Slides
Circular
8 Circle Venn Diagram Infographic Design Template for PowerPoint & Google Slides
Circular
Professional 6 Circle Venn Diagram Template for PowerPoint & Google Slides
Circular
Four Linked Circle Diagram for PowerPoint & Google Slides
Process
Arrow Circle Flow Diagram for PowerPoint & Google Slides
Infographics
Company Features Circle Diagram for PowerPoint & Google Slides
Process
Colorful Venn Diagram with 4 Circle for PowerPoint & Google Slides
Circular
12 Segment Circle Puzzle Diagram Template for PowerPoint and Keynote
Circular
3D Circle Sample template for PowerPoint & Google Slides
Circular
Circle Strategy Creative Chart template for PowerPoint & Google Slides
Business Strategy
Circle Timeline Infographics template for PowerPoint & Google Slides
Timeline
Circle Chart Data template for PowerPoint & Google Slides
Pie/Donut
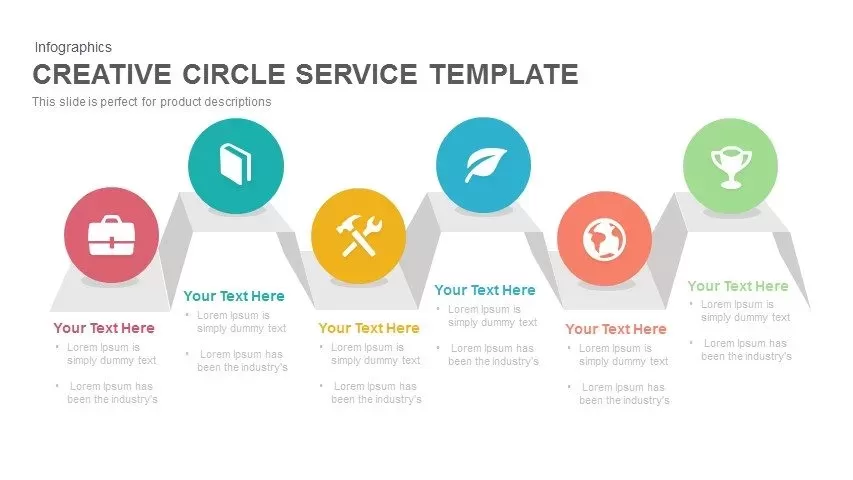
Four Circle Service template for PowerPoint & Google Slides
Process
Circle Abstract Shape Infographics Template for PowerPoint & Google Slides
Circular
Circle Segment Sales Metrics Infographic Template for PowerPoint & Google Slides
Circular
Circle Graph Data Visualization Template for PowerPoint & Google Slides
Circular
Four-Circle Business Process Infographic Template for PowerPoint & Google Slides
Circular
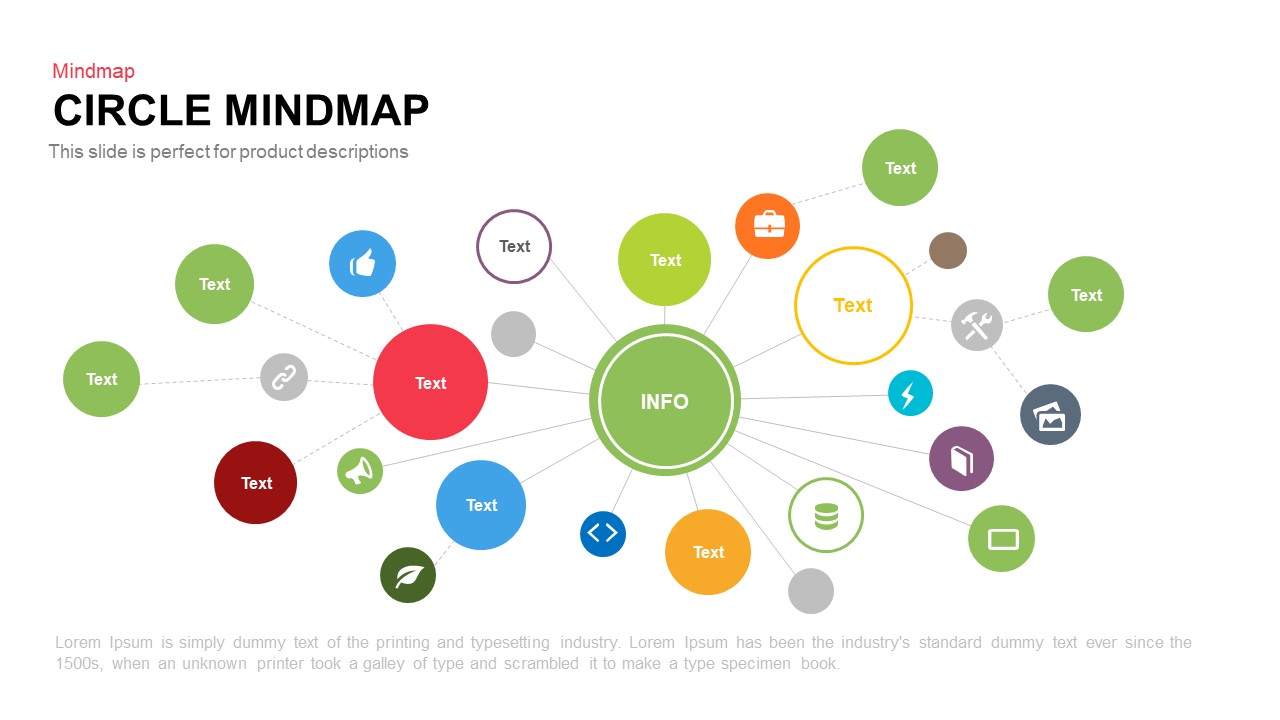
Circle Mindmap template for PowerPoint & Google Slides
Mind Maps
Dynamic Circle Timeline Infographics template for PowerPoint & Google Slides
Timeline

Creative Zigzag Circle Service Steps Template for PowerPoint & Google Slides
Process
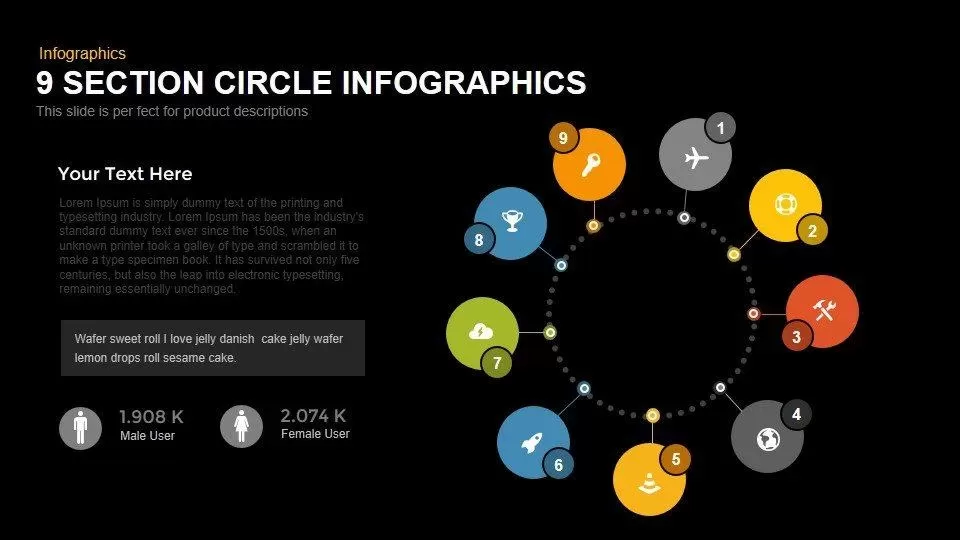
Modern 9-Section Circle Infographics Template for PowerPoint & Google Slides
Circular
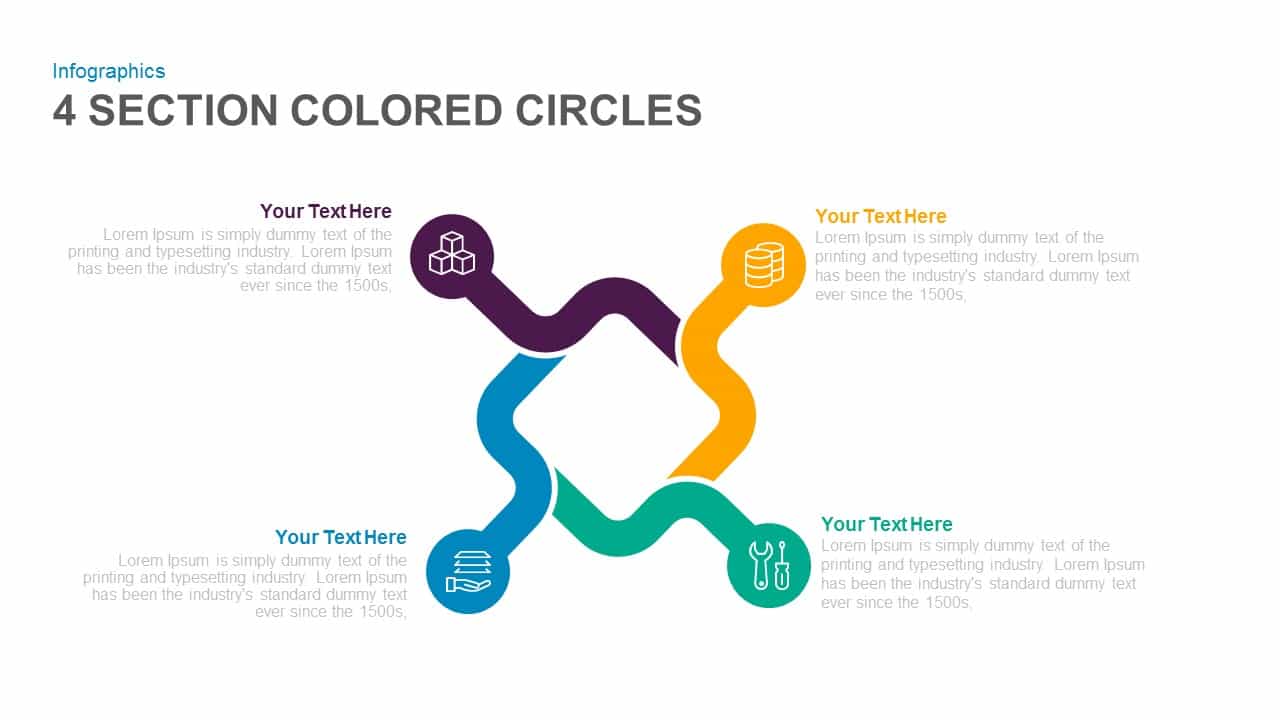
Four-Section Colored Circle Infographic Template for PowerPoint & Google Slides
Circular

Three-Circle Process Infographic Template for PowerPoint & Google Slides
Circular
Circle Arrows Process Flow template for PowerPoint & Google Slides
Process
Circle Arrow Process Flow template for PowerPoint & Google Slides
Process
Circle Arrow Process Flow template for PowerPoint & Google Slides
Process
Four-Stage Circle Arrow Infographic Template for PowerPoint & Google Slides
Circular
Four-Stage Circle Arrow Infographic Template for PowerPoint & Google Slides
Circular
Free Graduation Photo Collage Circle Slide Template for PowerPoint & Google Slides
Decks
Free
Blue Circle Mobile Apps Presentation Template for PowerPoint & Google Slides
Information Technology
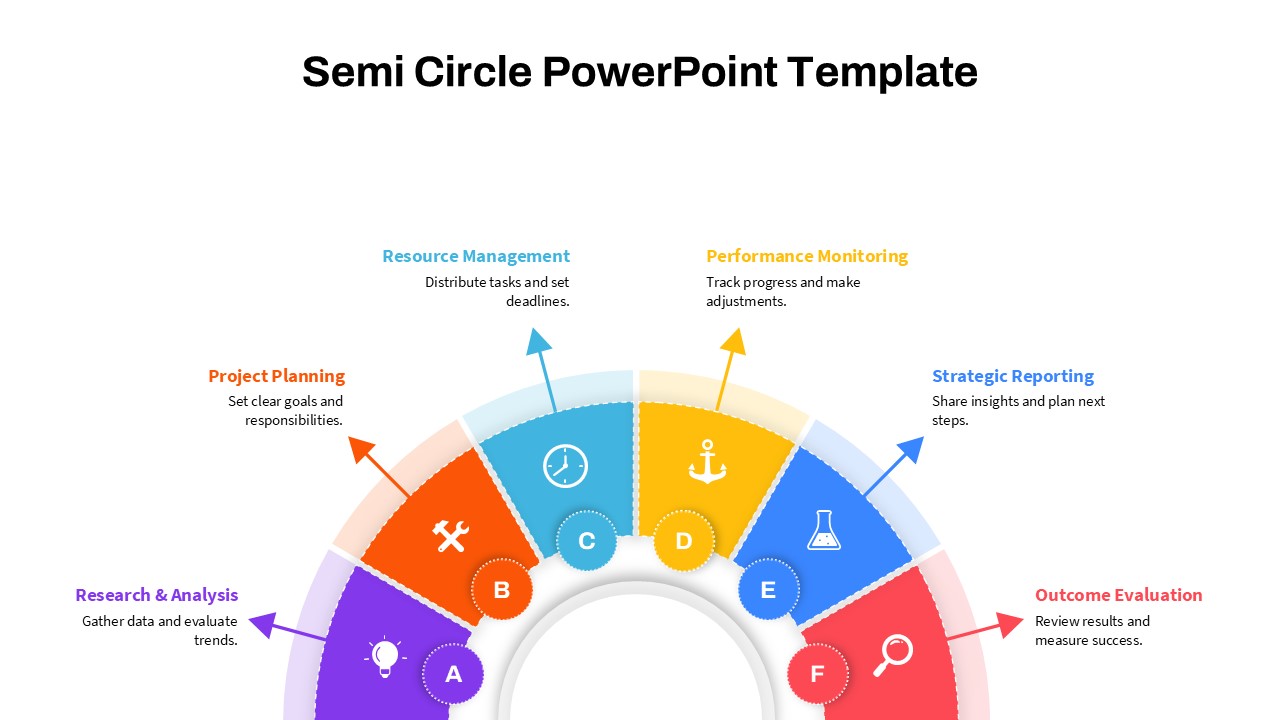
Modern Semi Circle Infographic Template for PowerPoint & Google Slides
Circular
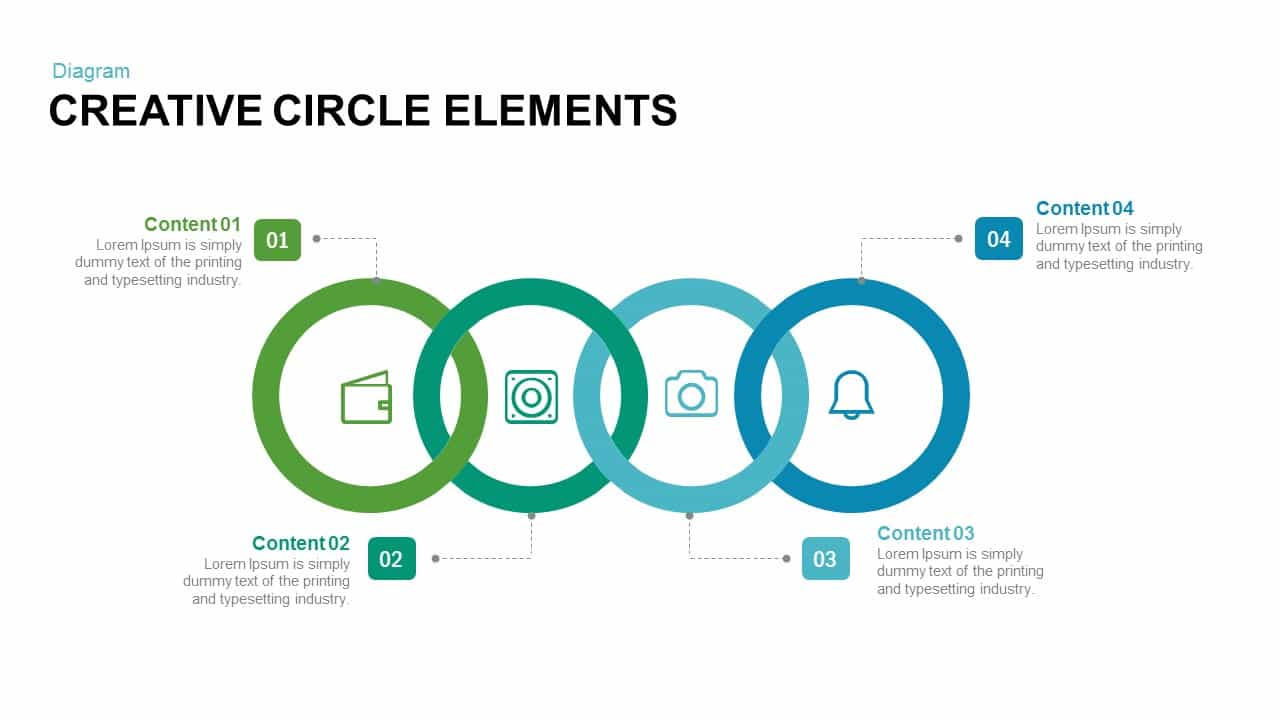
Creative Circle Elements for PowerPoint & Google Slides
Infographics
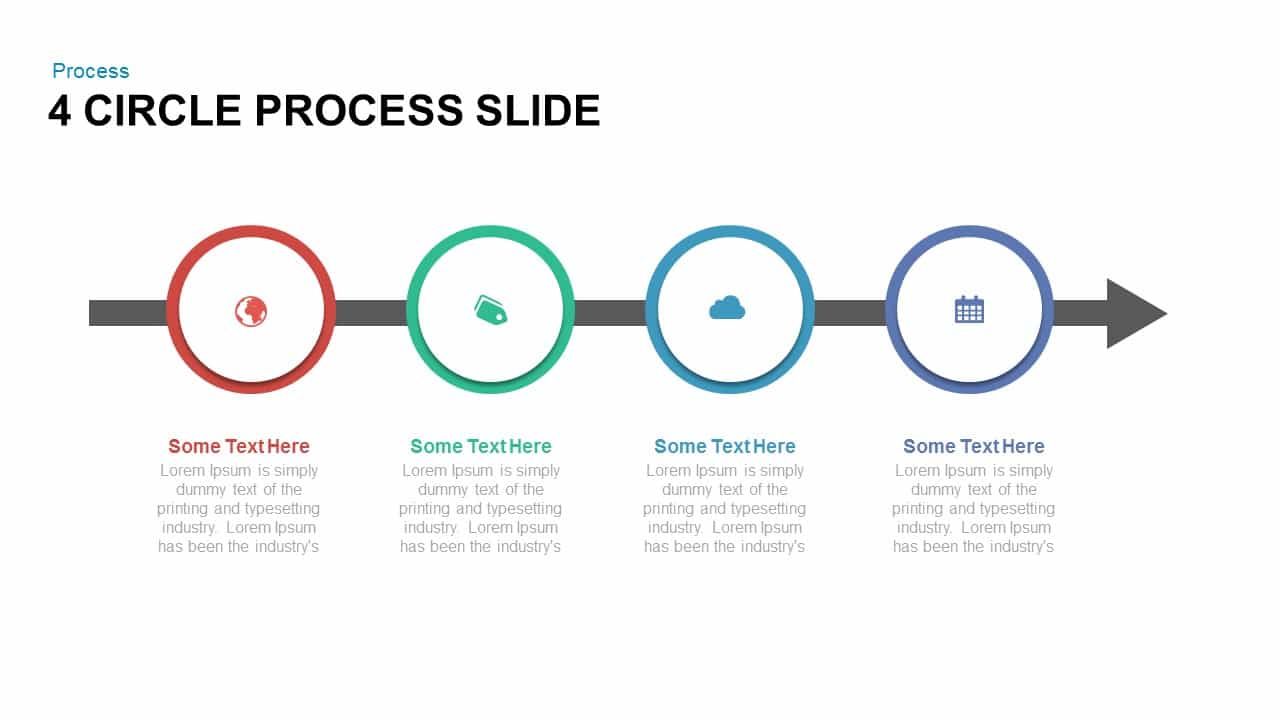
4 Circle Process for PowerPoint & Google Slides
Process
Snake Diagram Pack of 8 Slides template for PowerPoint & Google Slides
Process
Gear Process Diagram PowerPoint Template for PowerPoint & Google Slides
Process
Sales Process Workflow Funnel Diagram PowerPoint Template for PowerPoint & Google Slides
Funnel
Puzzle Diagram PowerPoint Template for PowerPoint & Google Slides
Process
Transportation Logistics PowerPoint Diagram template for PowerPoint & Google Slides
Process
Emoji Scale PowerPoint Diagram for PowerPoint & Google Slides
Infographics
4 Step Problem Solving PowerPoint Diagram for PowerPoint & Google Slides
Process
15-Step Process Flow Diagram Template for PowerPoint & Google Slides
Process

Problem Solving Concept Diagram Template for PowerPoint & Google Slides
Infographics
Five-Stage Pyramid Infographics Diagram Template for PowerPoint & Google Slides
Pyramid
Fishbone Diagram Overview template for PowerPoint & Google Slides
Infographics
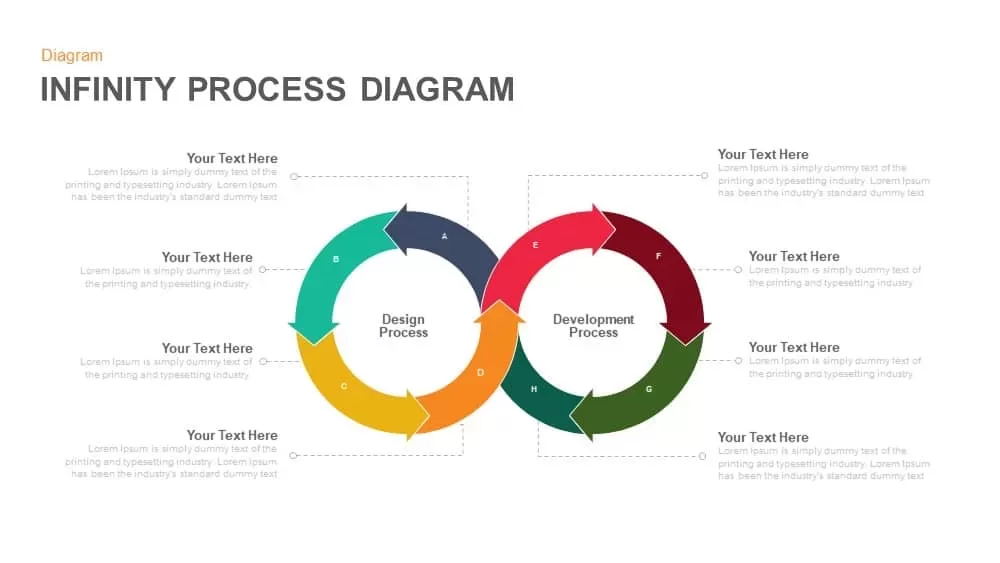
Infinity Process Diagram Template for PowerPoint & Google Slides
Process
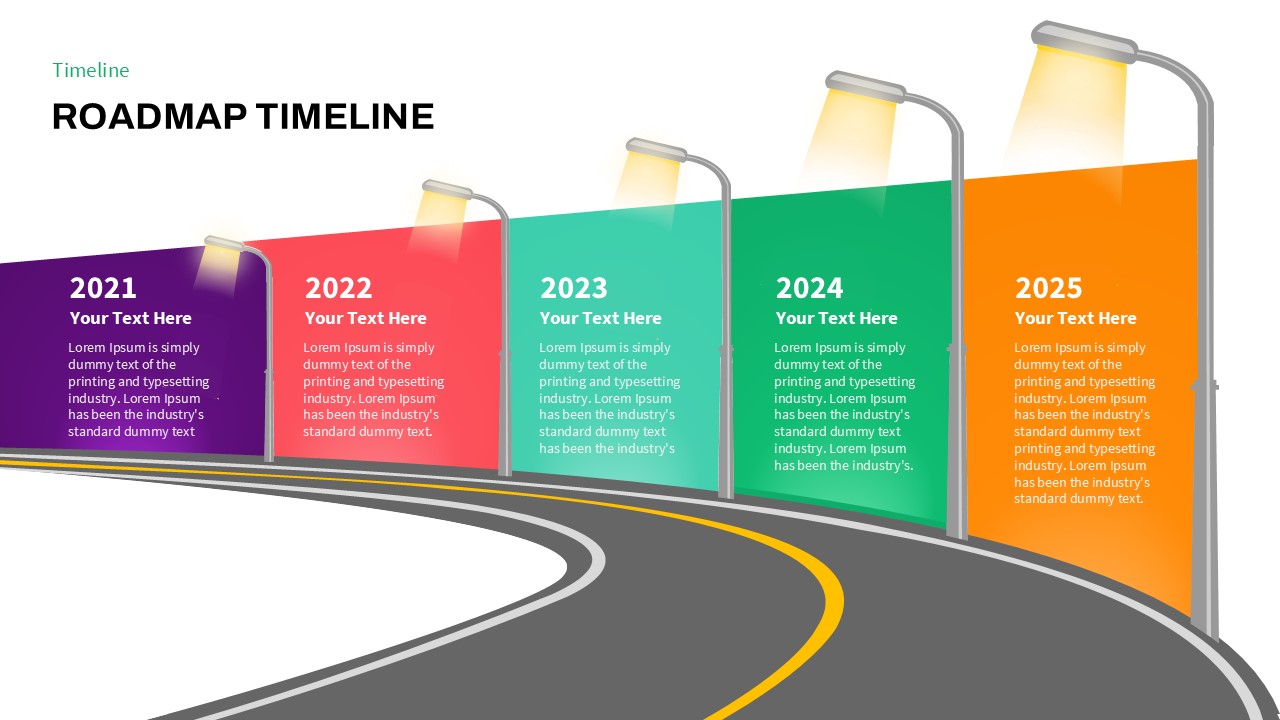
Curved Road Roadmap Timeline Diagram Template for PowerPoint & Google Slides
Roadmap
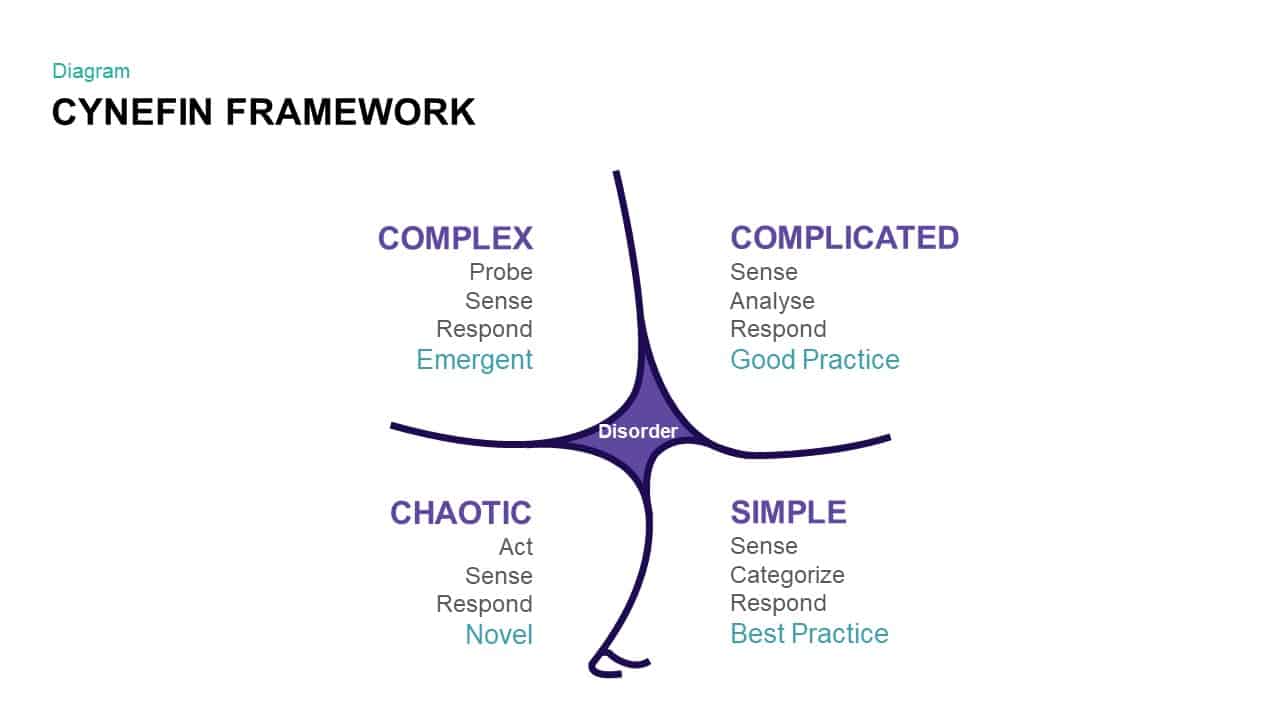
Comprehensive Cynefin Framework Diagram Template for PowerPoint & Google Slides
Opportunities Challenges
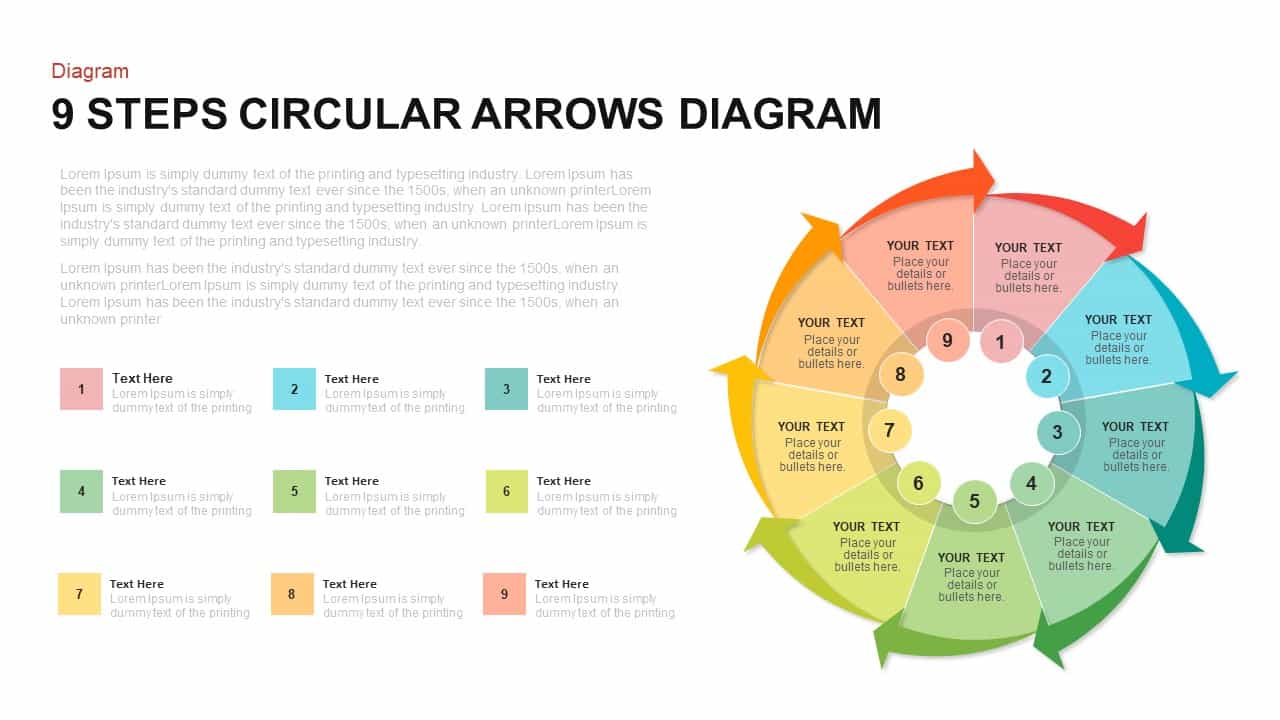
9-Step Circular Arrows Process Diagram Template for PowerPoint & Google Slides
Process
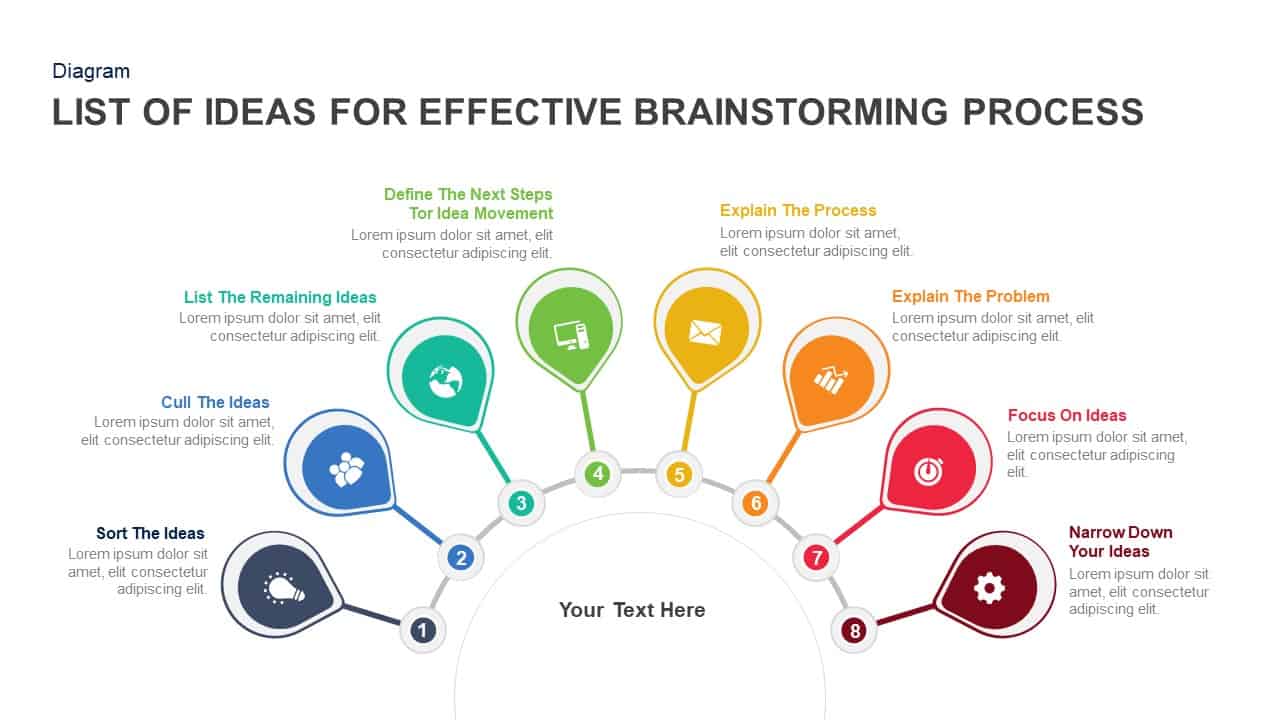
Eight-Step Brainstorming Process Diagram Template for PowerPoint & Google Slides
Process
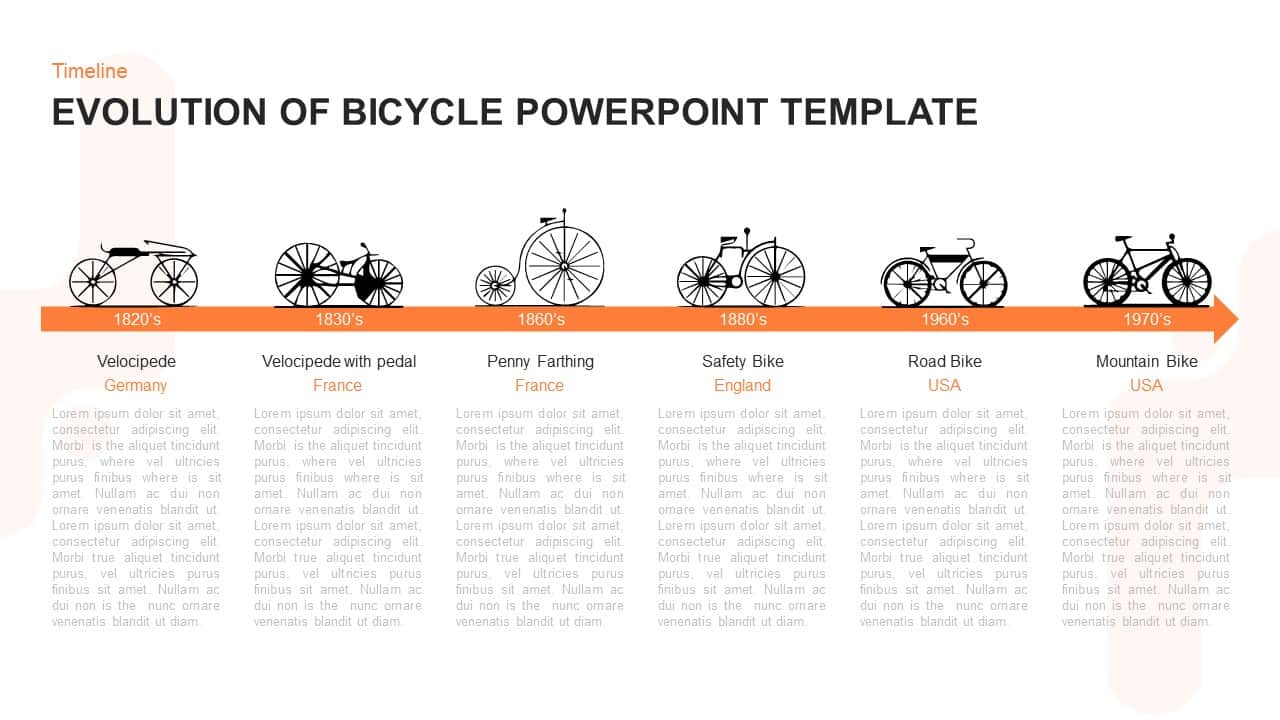
Evolution of Bicycle Timeline Diagram Template for PowerPoint & Google Slides
Timeline
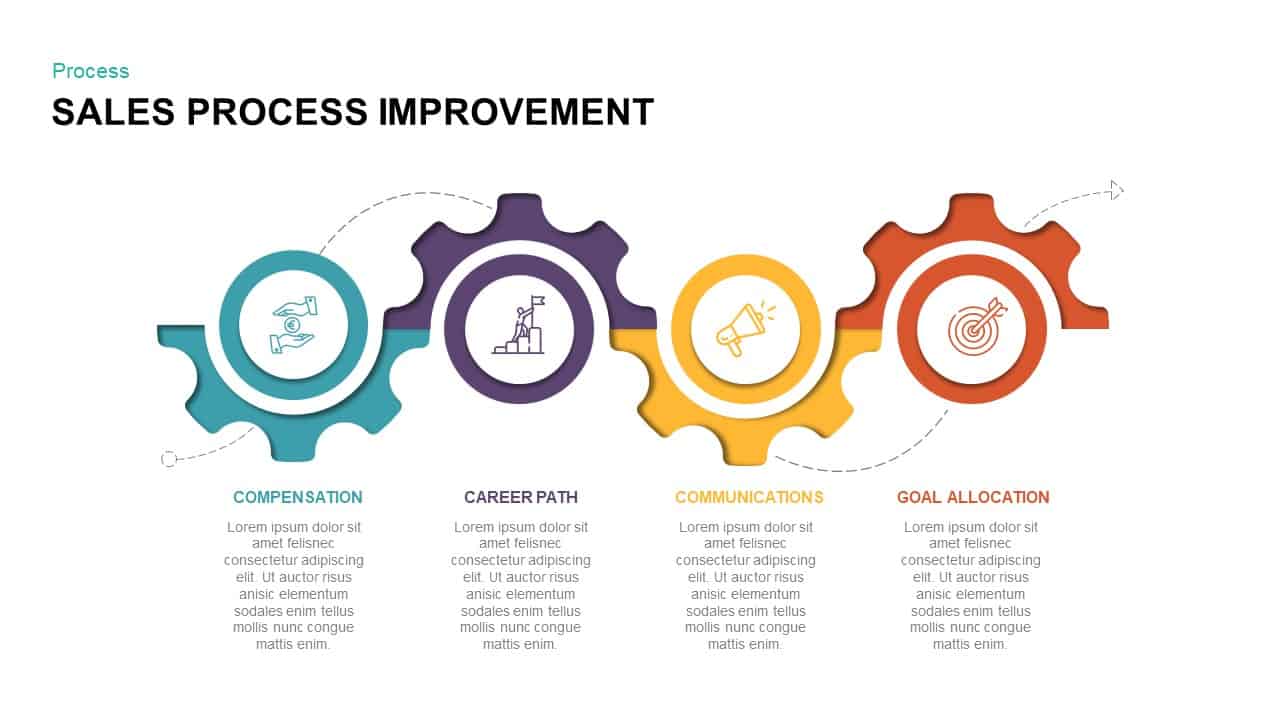
Sales Process Improvement Gear Diagram Template for PowerPoint & Google Slides
Process
8-Step Circular Gear Infographic Diagram Template for PowerPoint & Google Slides
Circular
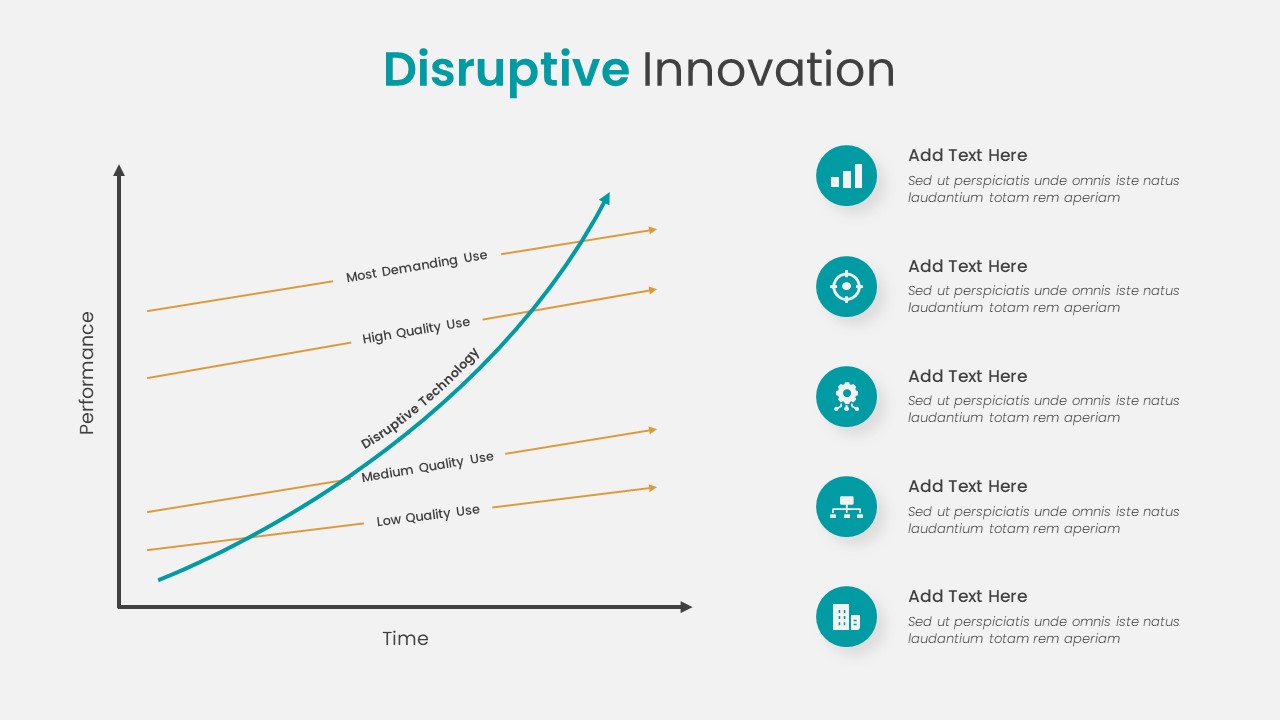
Disruptive Innovation Framework Diagram Template for PowerPoint & Google Slides
Comparison Chart
Release Management Cycle Circular Diagram Template for PowerPoint & Google Slides
Software Development
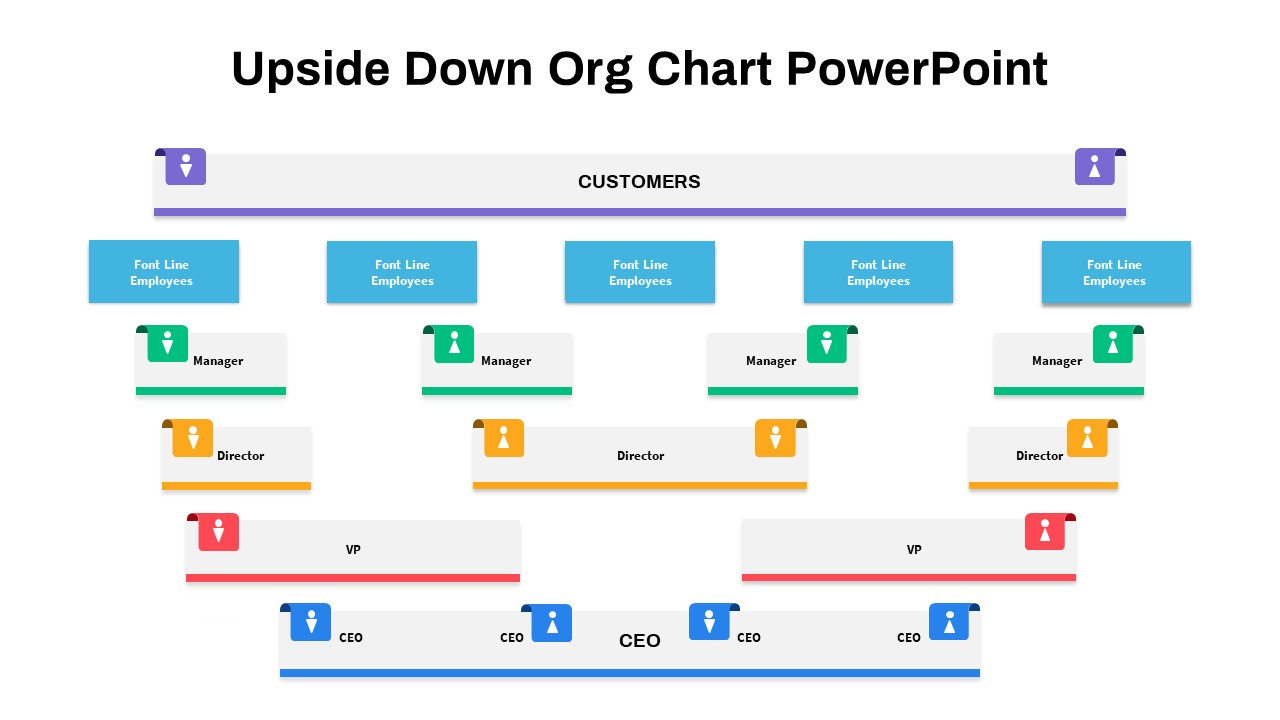
Upside-Down Organizational Chart Diagram Template for PowerPoint & Google Slides
Org Chart
Free Root Cause Analysis Fishbone Diagram Template for PowerPoint & Google Slides
Process
Free
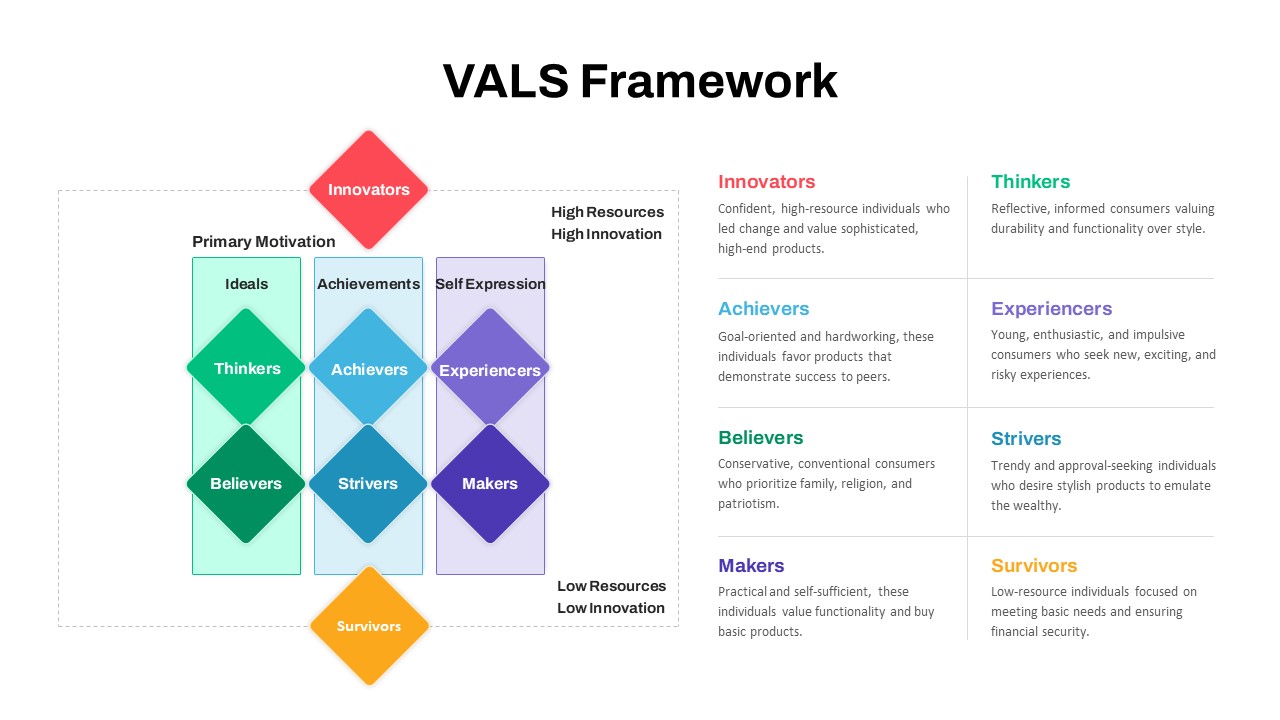
VALS Segmentation Framework Diagram Template for PowerPoint & Google Slides
Marketing