Modern Multi-Color Polar Chart Diagram Template for PowerPoint & Google Slides


Description
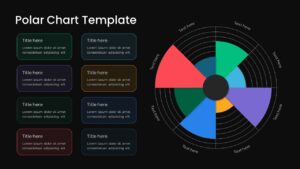
Leverage this modern multi-color polar chart slide to present radial data insights across eight key dimensions in a visually compelling layout. The right side features a customizable polar bar chart with concentric gridlines and eight radial segments—each color-coded to match the corresponding legend boxes on the left. Each legend card includes a title placeholder and a text block for definitions, metrics, or strategic notes, styled with soft fills and coordinating borders to maintain visual harmony. The concentric rings provide clear scale markers, while adjustable axis labels around the circumference let you annotate each segment with concise descriptions.
Built on master slides with drag-and-drop functionality, this template supports instant color palette swaps, font adjustments, and resizing without breaking alignment. Connector lines automatically realign when you add or remove data points. Slide notes guide you through importing spreadsheet data and fine-tuning chart properties, while auto-snap alignment ensures a polished result. The flat design, ample white space, and consistent typography deliver a professional aesthetic that adapts to any brand. Fully compatible with PowerPoint and Google Slides, this slide preserves vector shapes, animations, and data links across platforms. Whether you’re presenting performance metrics, survey results, or strategic priorities, this polar chart diagram turns complex datasets into clear, actionable visuals.
Who is it for
Data analysts, market researchers, and business strategists will benefit from this slide when visualizing multi-dimensional metrics. Marketing managers, product teams, and consultants can also leverage the polar chart to compare feature performance, customer satisfaction scores, or risk assessments.
Other Uses
Beyond core analytics, repurpose this template to illustrate SWOT variable weightings, competitive benchmarking, project risk levels, resource allocation, or operational maturity models. The eight-segment design can also map development sprints, stakeholder priorities, KPI dashboards, or thematic scorecards.
Login to download this file

Item ID
SB03826
Related Templates

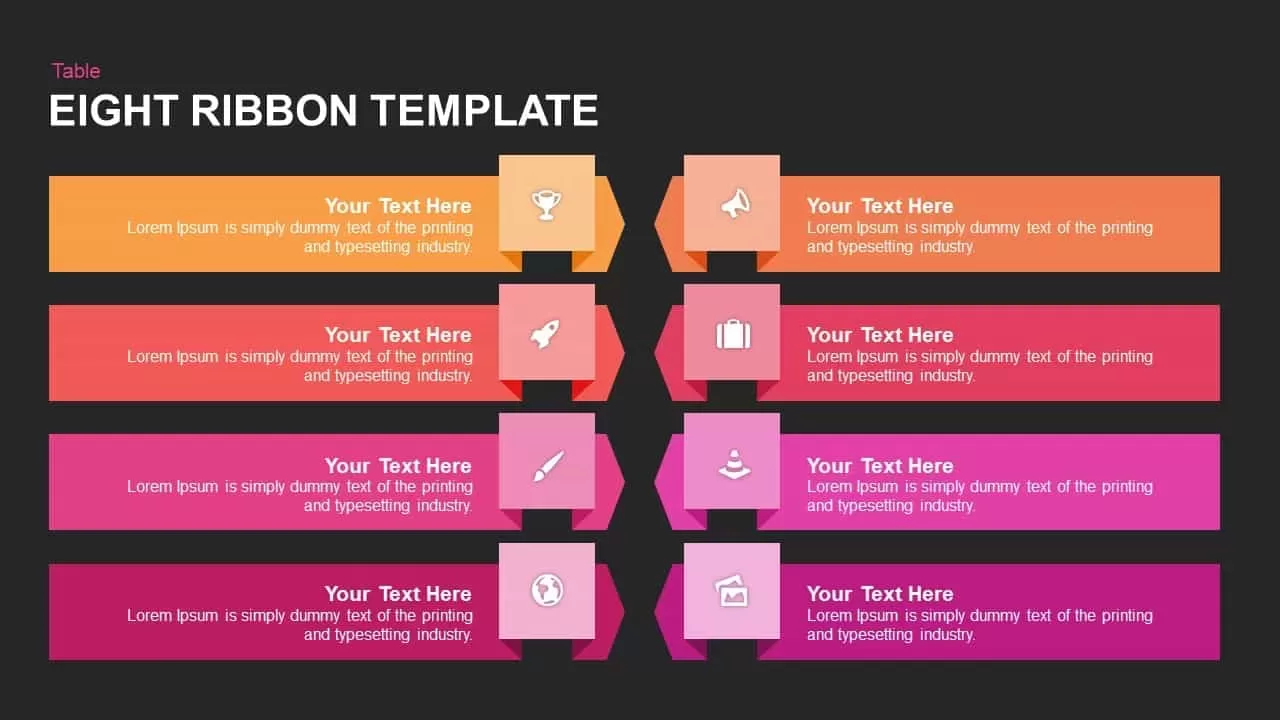
Multi-Color Eight-Step Ribbon Diagram Template for PowerPoint & Google Slides
Process
Multi-Color Enneagram Circular Diagram Template for PowerPoint & Google Slides
Circular
Multi-Color Five-Step Curved Arrow Template for PowerPoint & Google Slides
Process
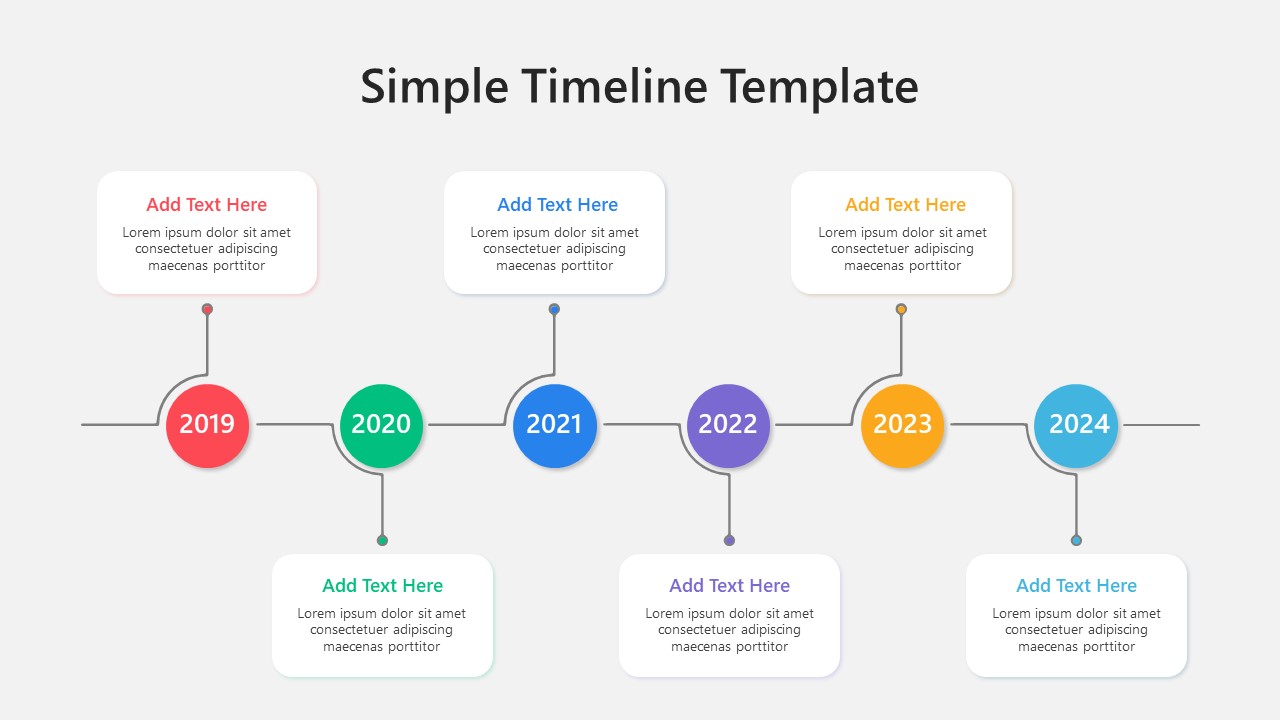
Multi-Color Milestone Timeline Layout Template for PowerPoint & Google Slides
Timeline
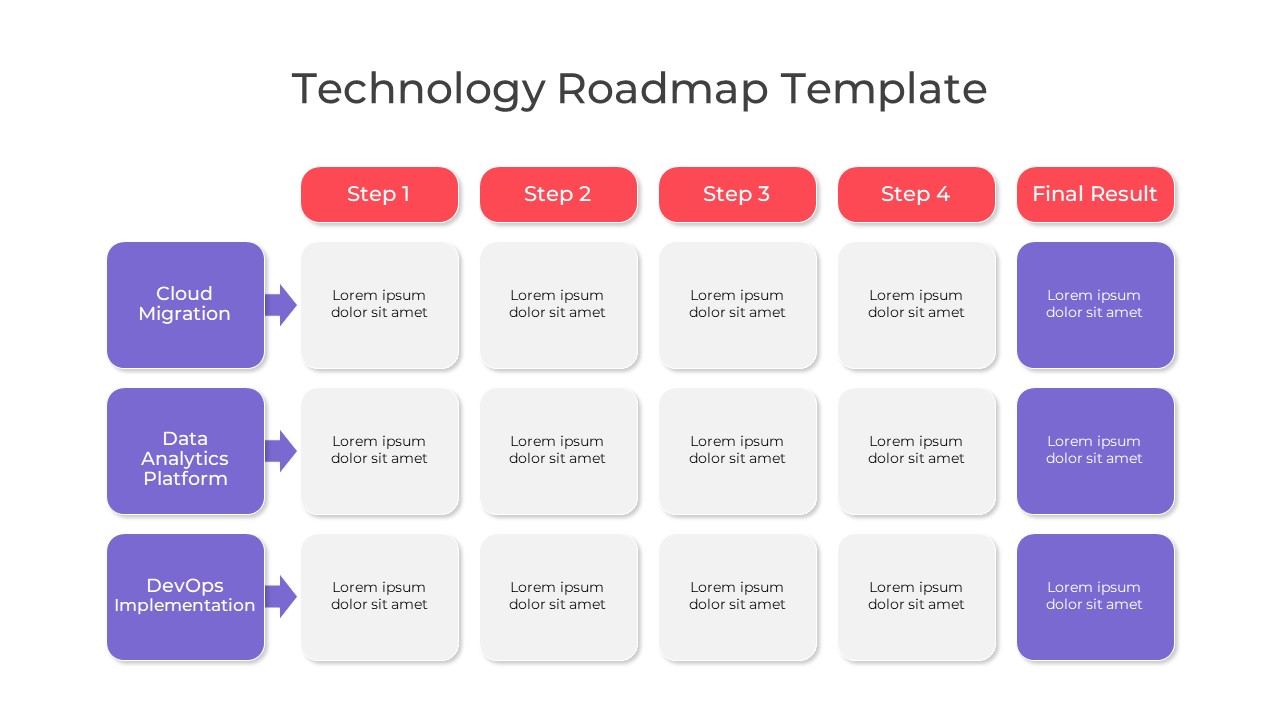
Multi-Color Technology Roadmap Template Pack for PowerPoint & Google Slides
Roadmap
Free Minimal Multi-Color Table of Contents Template for PowerPoint & Google Slides
Agenda
Free
Multi-color Curved Timeline Roadmap Template for PowerPoint & Google Slides
Timeline
Multi Color SWOT Analysis Quadrant Template for PowerPoint & Google Slides
SWOT
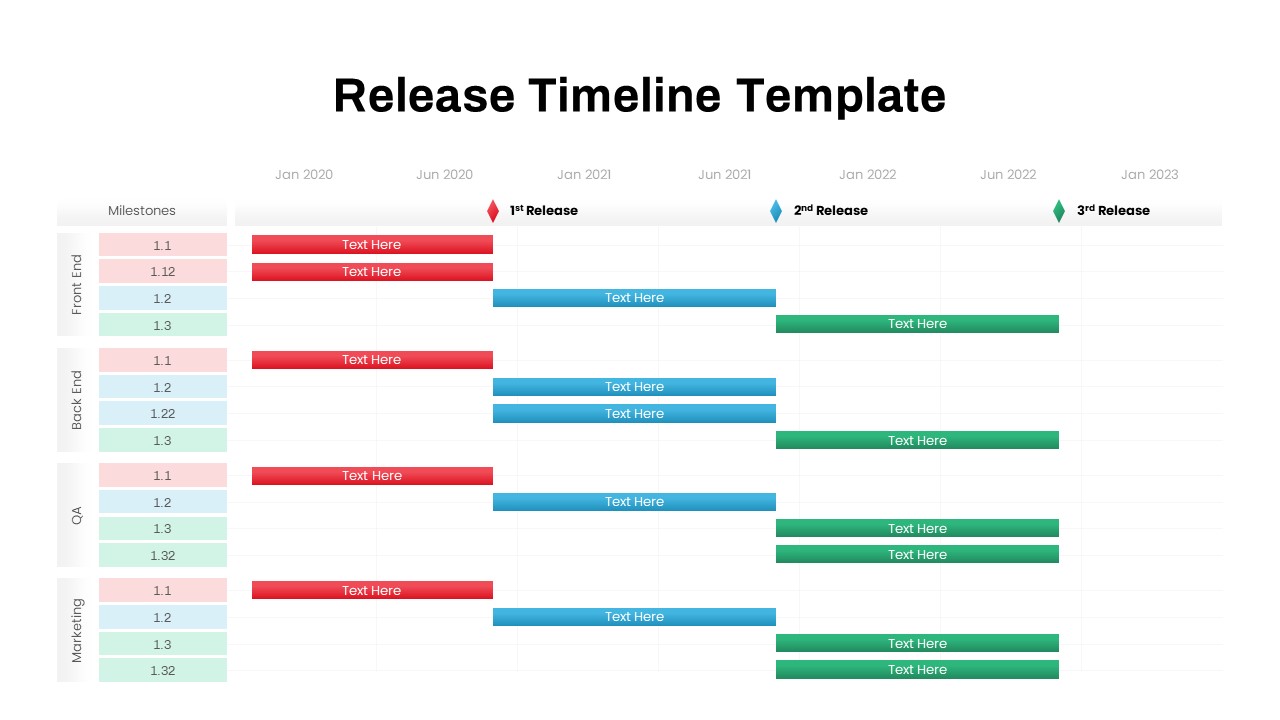
Multi-Team Multi-Phase Release Timeline Template for PowerPoint & Google Slides
Timeline
Modern Multi-Section Circle Diagram Template for PowerPoint & Google Slides
Circular
Free Circular Multi-Step Flow Chart Diagram Template for PowerPoint & Google Slides
Flow Charts
Free
Multi-Style Clock Chart Diagram Template for PowerPoint & Google Slides
Circular
Multi-Variation Circular Chart Diagram Template for PowerPoint & Google Slides
Circular
Multi-Level Wheel Chart Diagram template for PowerPoint & Google Slides
Pie/Donut
Color-Coded Gantt Chart template for PowerPoint & Google Slides
Business
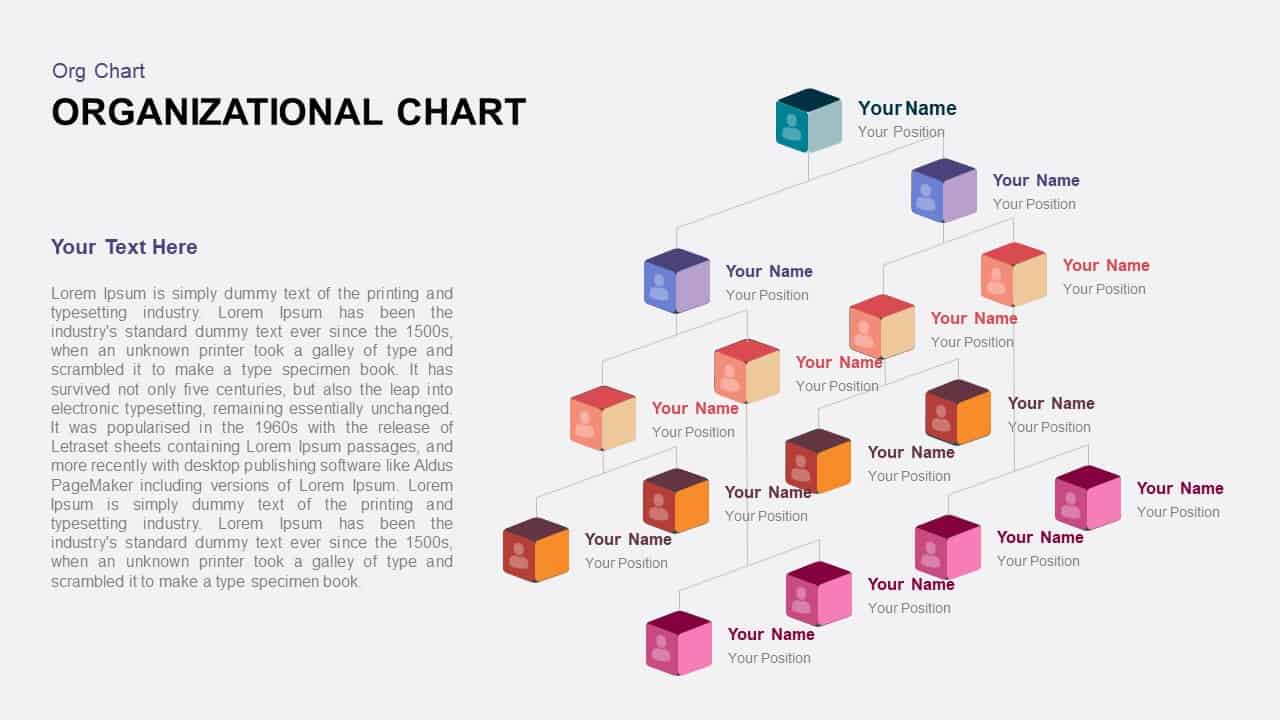
3D Color Block Organizational Chart Slide for PowerPoint & Google Slides
Org Chart
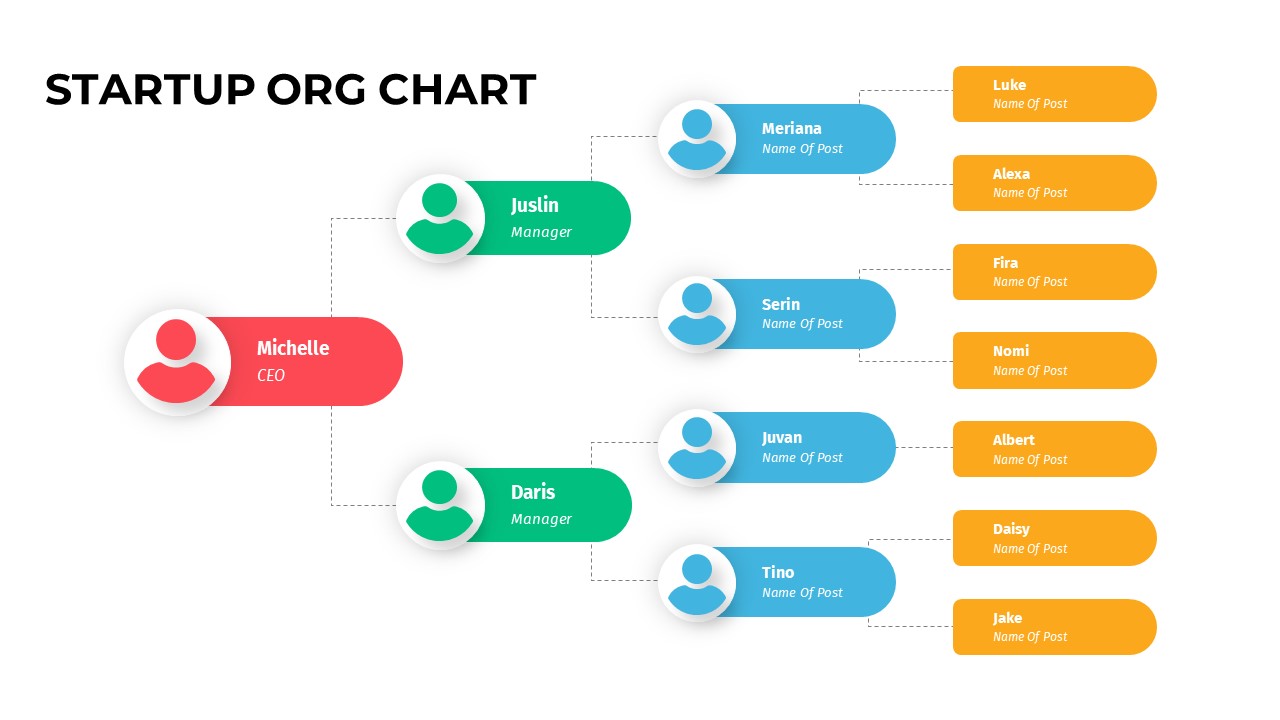
Color-Coded Startup Org Chart Slide for PowerPoint & Google Slides
Org Chart
Horizontal Multi-Level Hierarchy Chart template for PowerPoint & Google Slides
Org Chart
Multi-Series Stacked Bar Chart Template for PowerPoint & Google Slides
Bar/Column
Minimal Multi-Year Column Chart Template for PowerPoint & Google Slides
Bar/Column
Editable Multi-Series Peak Line Chart Template for PowerPoint & Google Slides
Comparison Chart
Multi-Series Line Chart with Icons Template for PowerPoint & Google Slides
Comparison Chart
Multi-Series Vertical Dot Chart Template for PowerPoint & Google Slides
Comparison Chart
Multi-Variation Thermometer Chart Template for PowerPoint & Google Slides
Bar/Column
Multi-Level Colorful Pyramid Chart Template for PowerPoint & Google Slides
Pyramid
Free Color-Coded Fishbone Diagram Template for PowerPoint & Google Slides
Project
Free

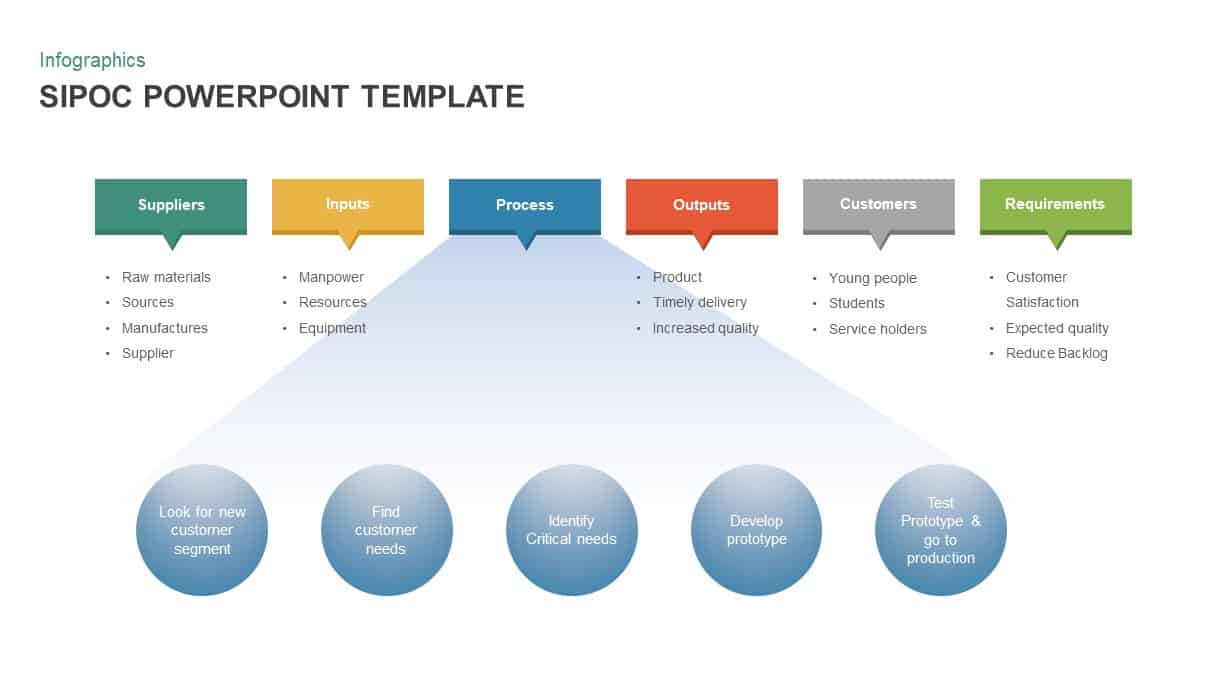
Color-Coded SIPOC Diagram with Process Flow for PowerPoint & Google Slides
Process
Multi-Segment Circle Split Diagram template for PowerPoint & Google Slides
Circular
Multi-layout Circle Spoke Diagram Template for PowerPoint & Google Slides
Circular
Multi-Style Project Life Cycle Diagram Template for PowerPoint & Google Slides
Process
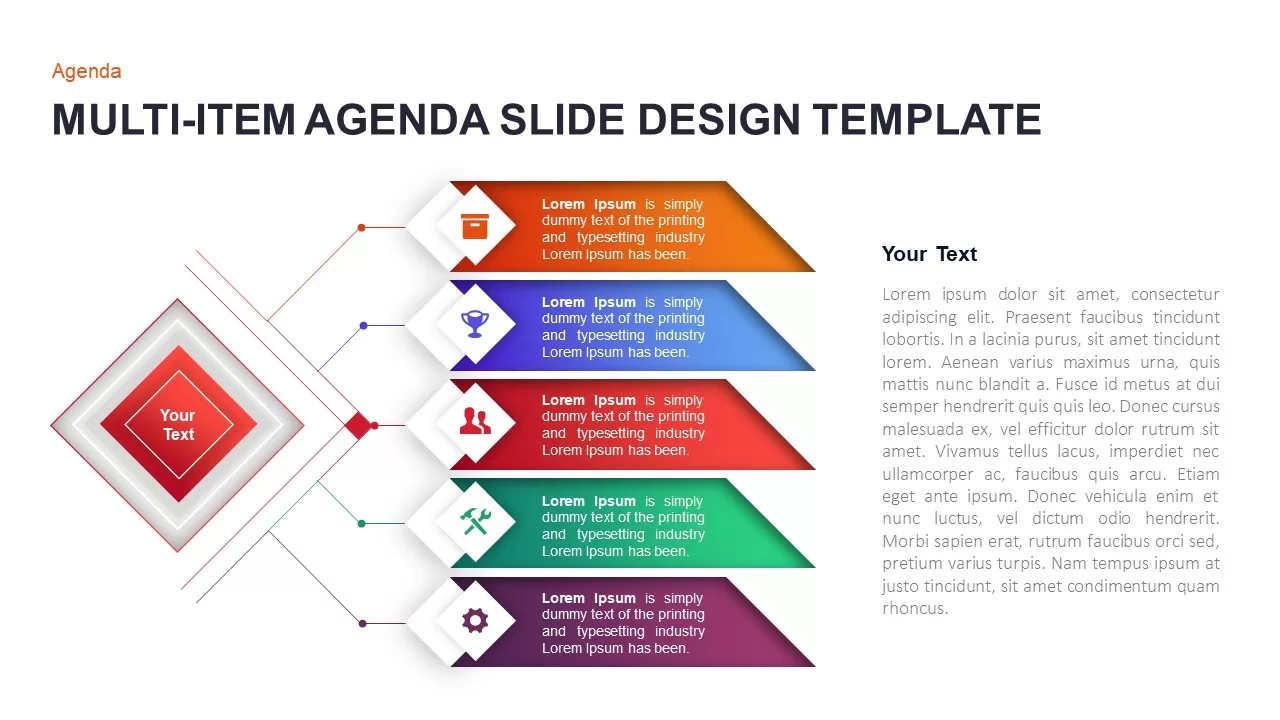
Multi-Item Agenda Hub-and-Spoke Diagram Template for PowerPoint & Google Slides
Agenda
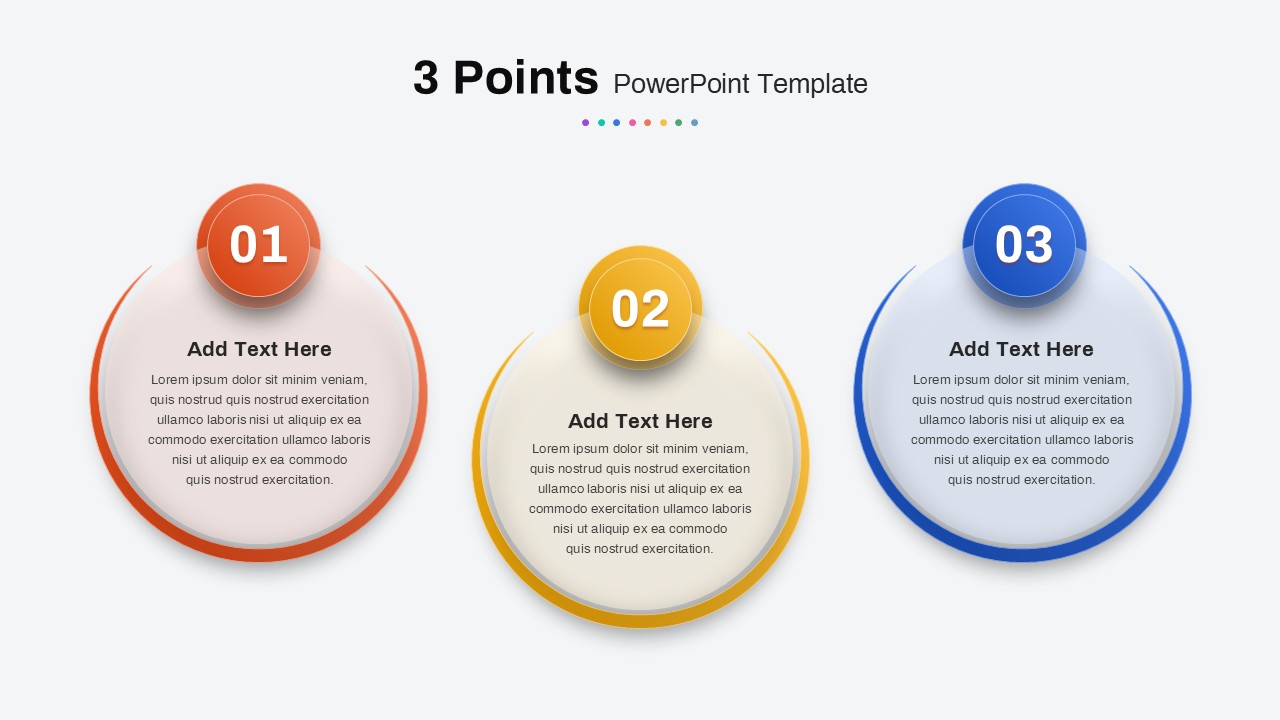
Multi-Point Diagram Presentation Template for PowerPoint & Google Slides
Process
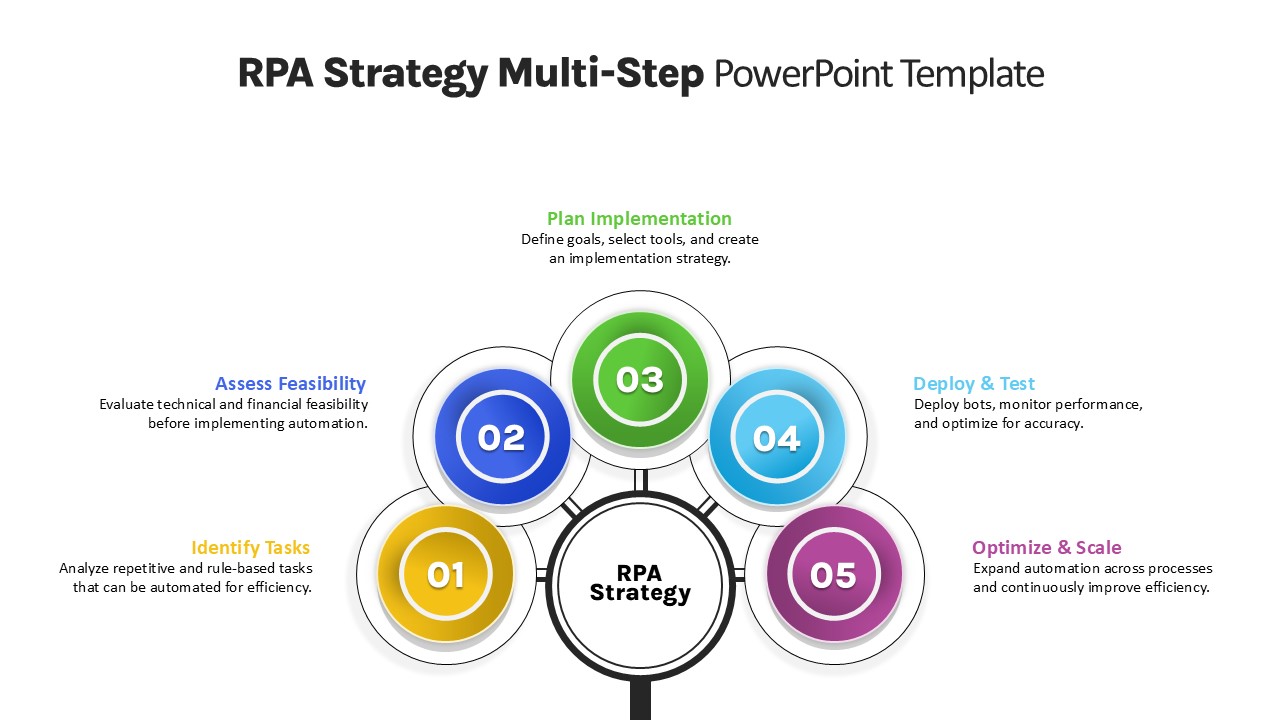
RPA Strategy Multi-Step Diagram Template for PowerPoint & Google Slides
Process
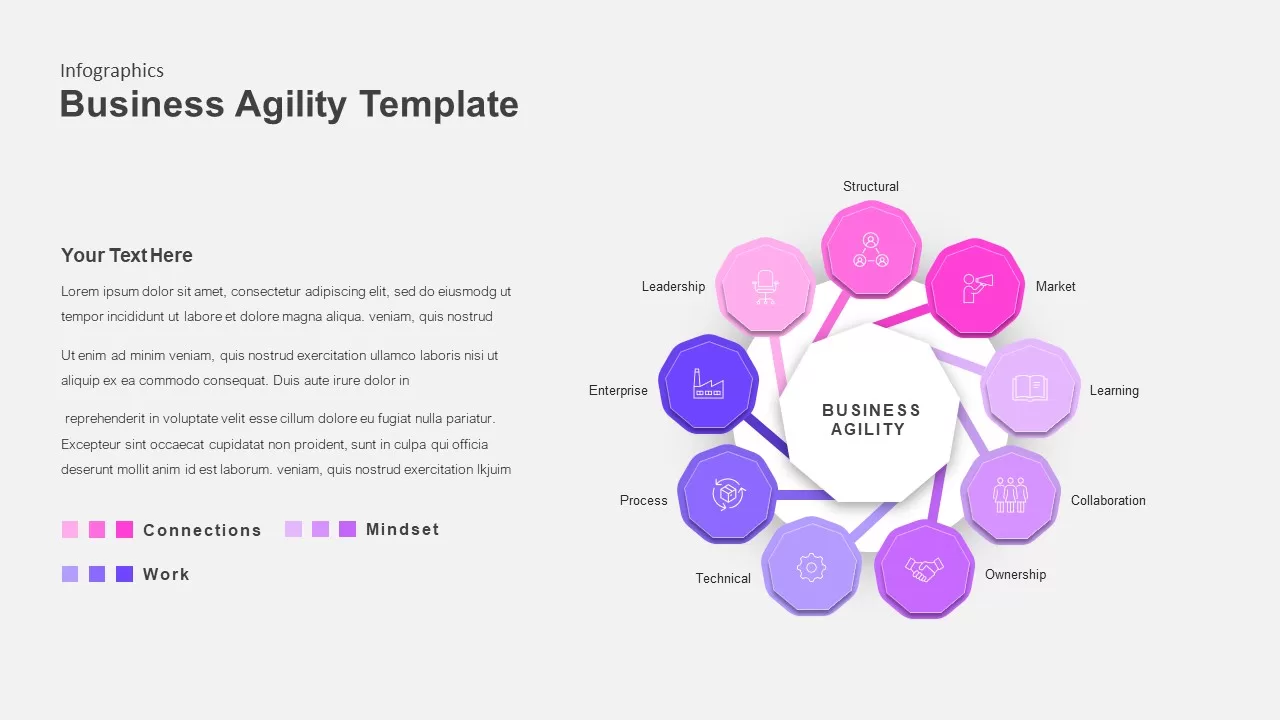
Color-Coded Business Agility Radial Template for PowerPoint & Google Slides
Business
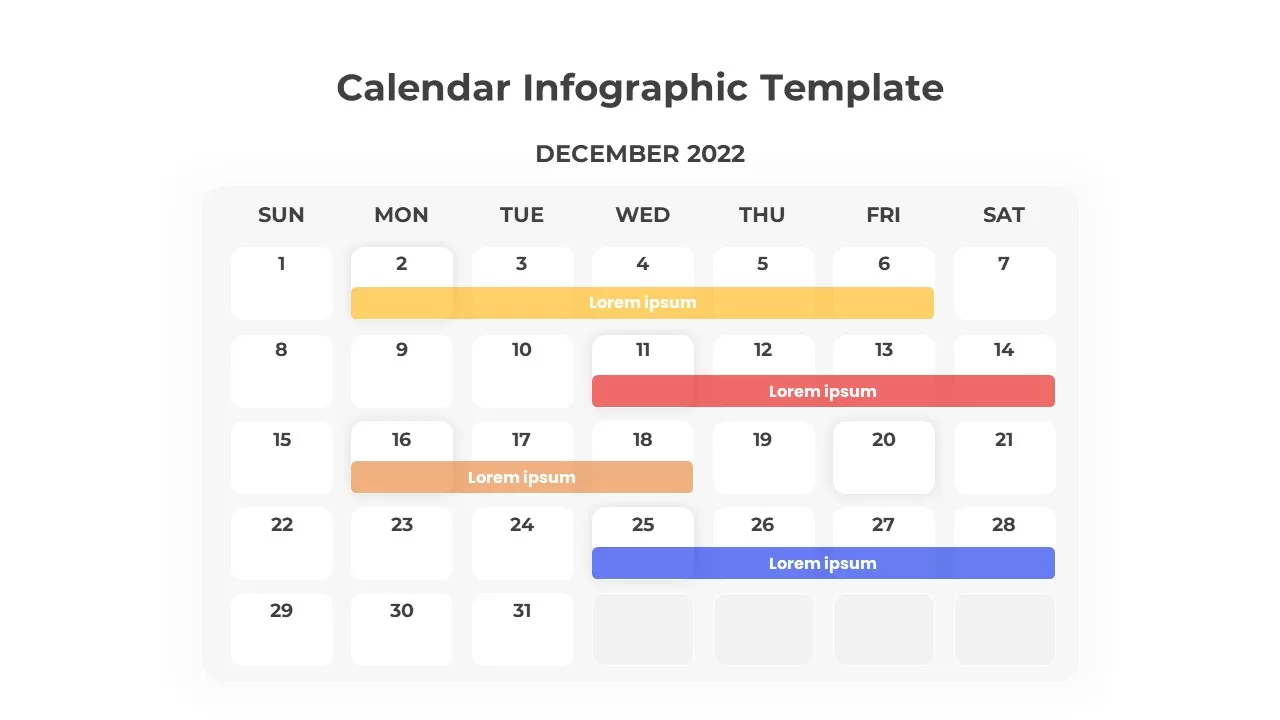
Color-Coded Calendar Infographic Template for PowerPoint & Google Slides
Infographics
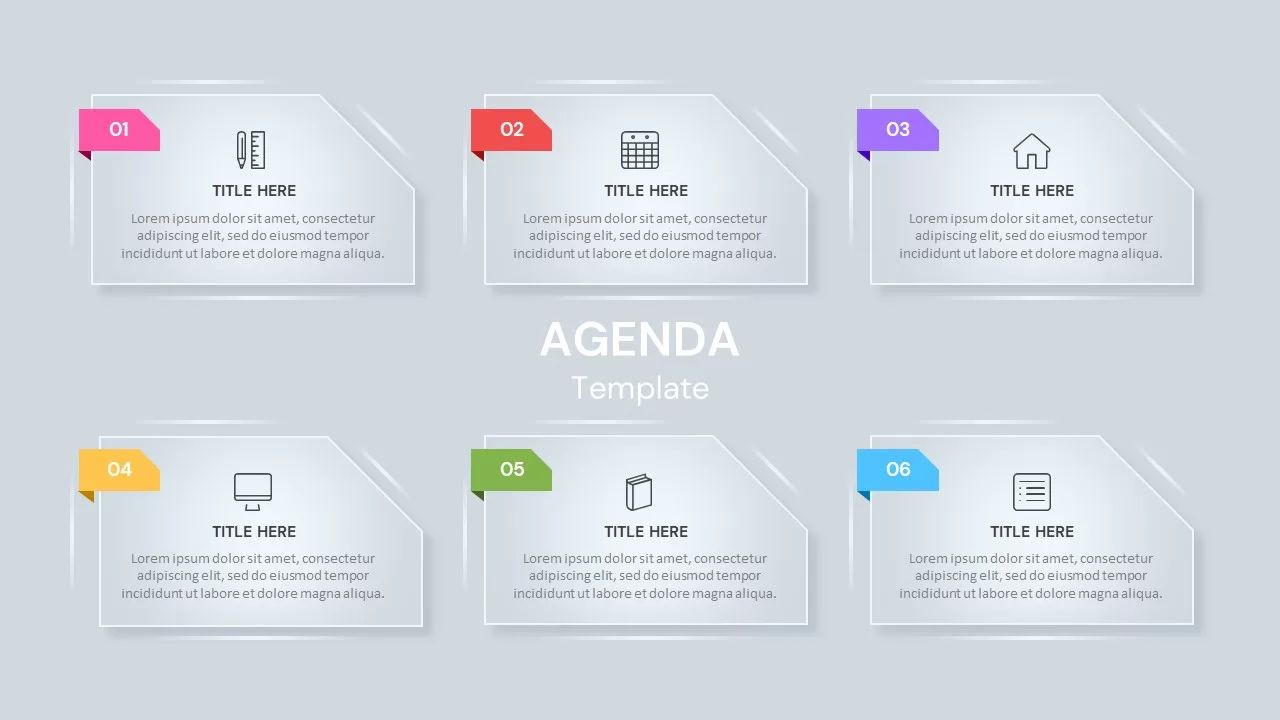
Six-Section Color-Coded Agenda Template for PowerPoint & Google Slides
Agenda

Blured Color Duo Pitch Template for PowerPoint & Google Slides
Company Profile
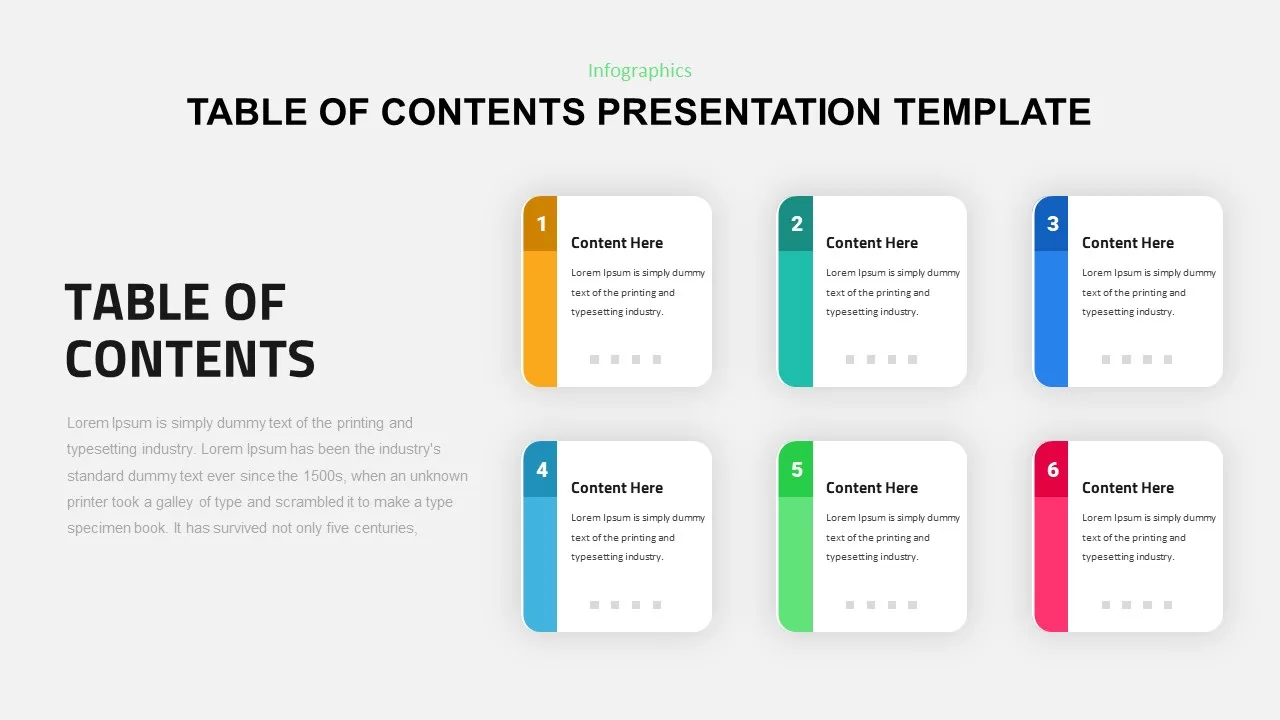
Six-Step Color-Coded Table of Contents Template for PowerPoint & Google Slides
Agenda

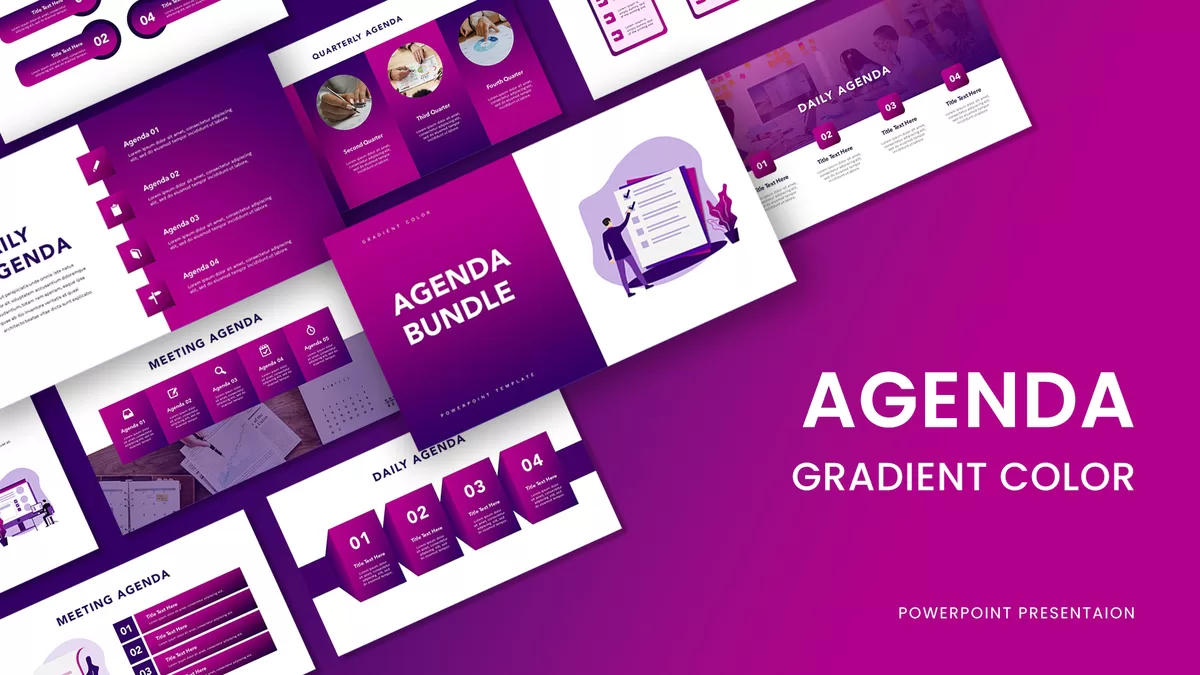
Gradient Color Agenda Slide Bundle Template for PowerPoint & Google Slides
Agenda
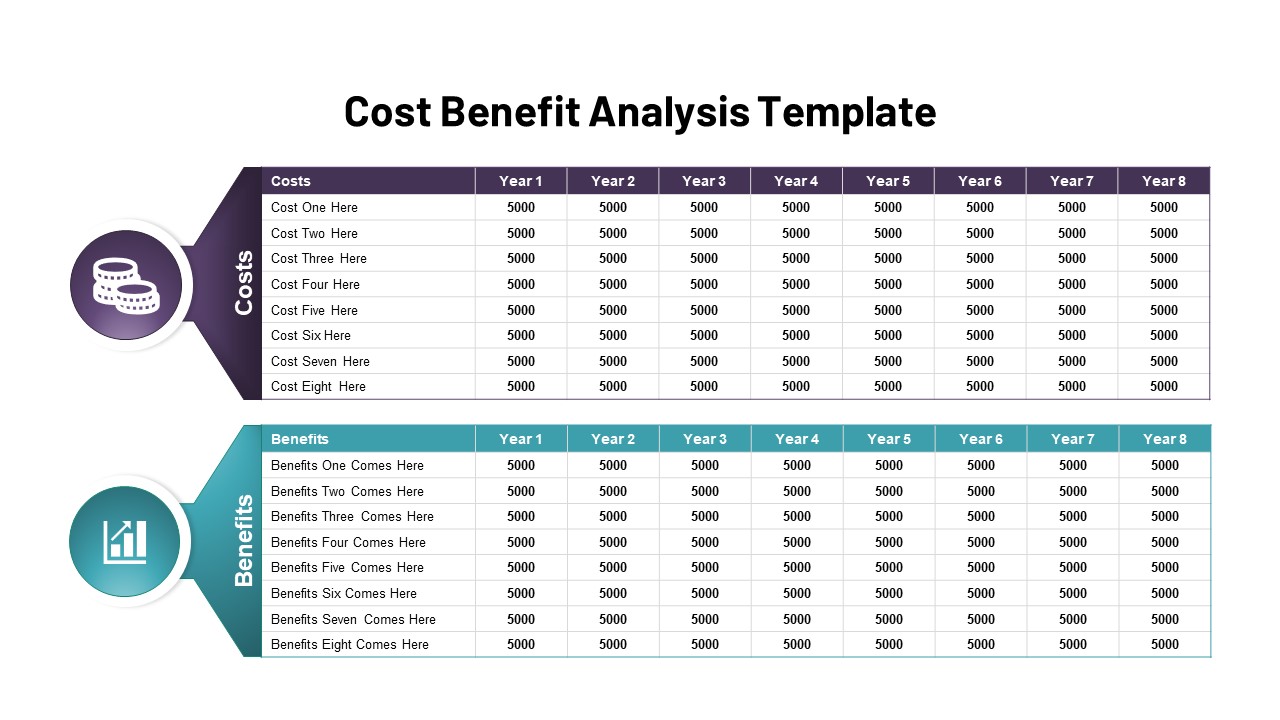
Dual-Color Cost vs Benefit Analysis Template for PowerPoint & Google Slides
Comparison
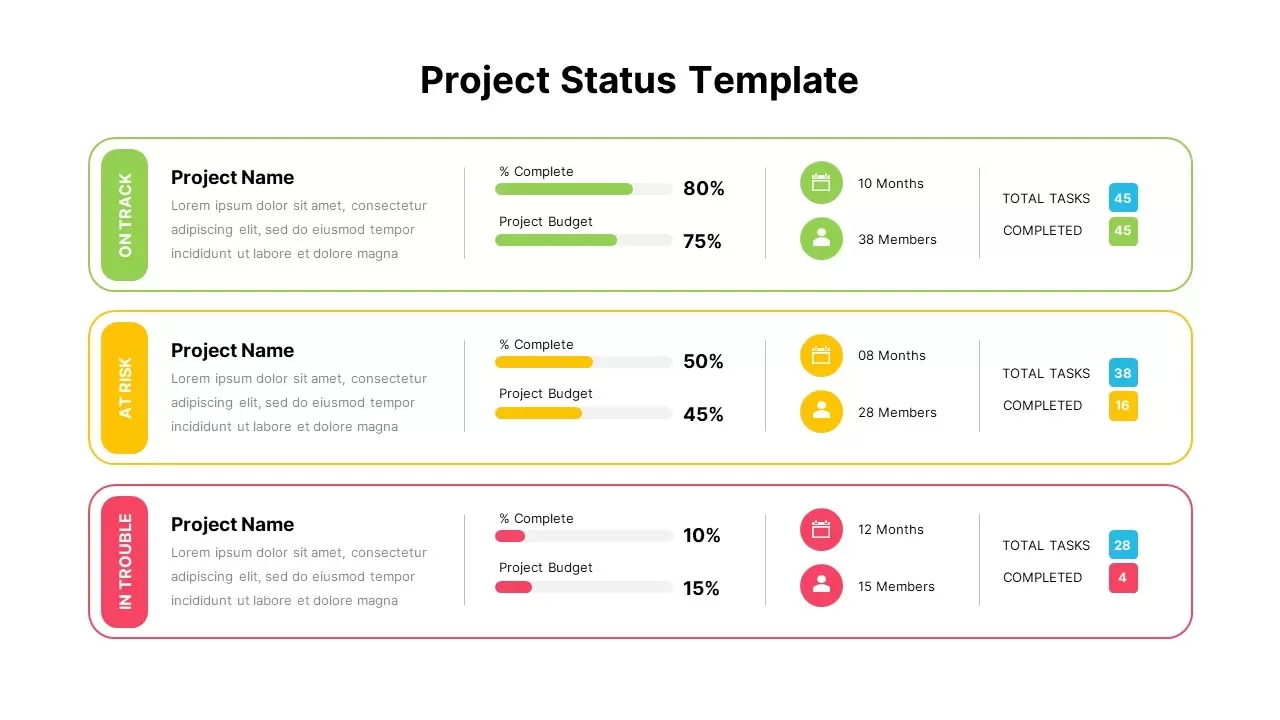
Color-Coded Project Status Template for PowerPoint & Google Slides
Project Status
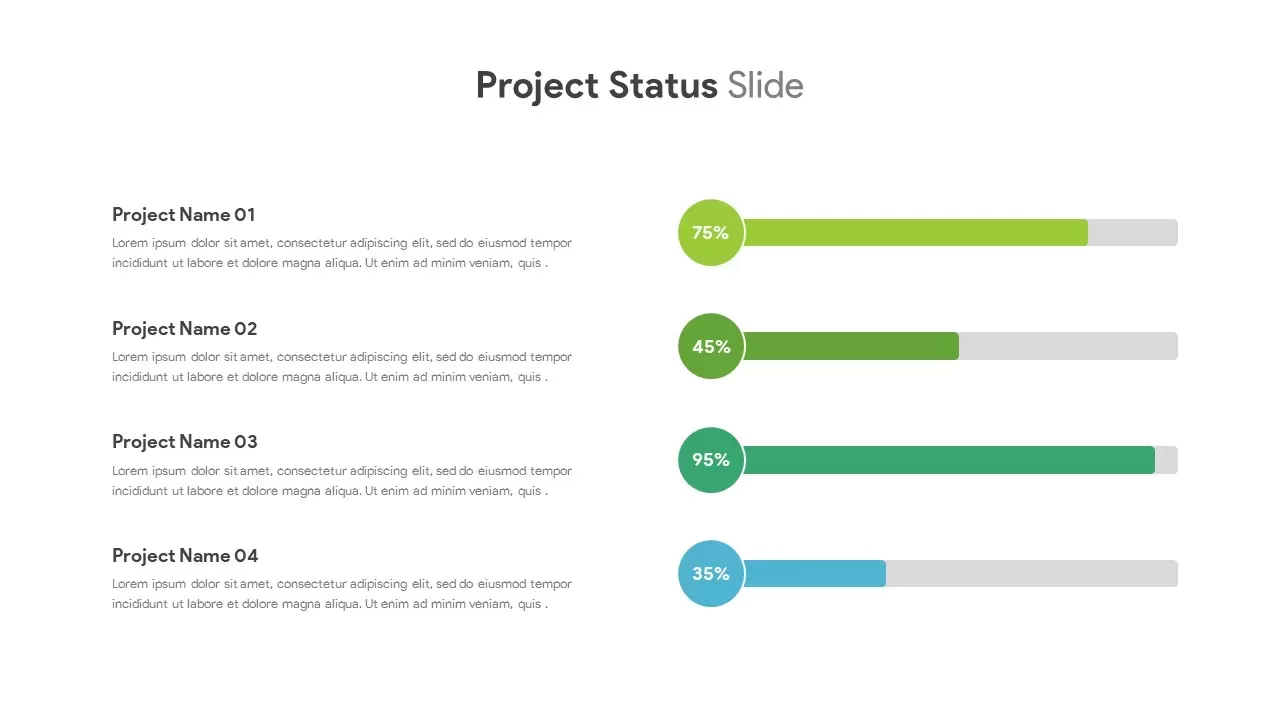
Color-Coded Project Status Slide Template for PowerPoint & Google Slides
Project Status
Purple Color Presentation Template for PowerPoint & Google Slides
Company Profile
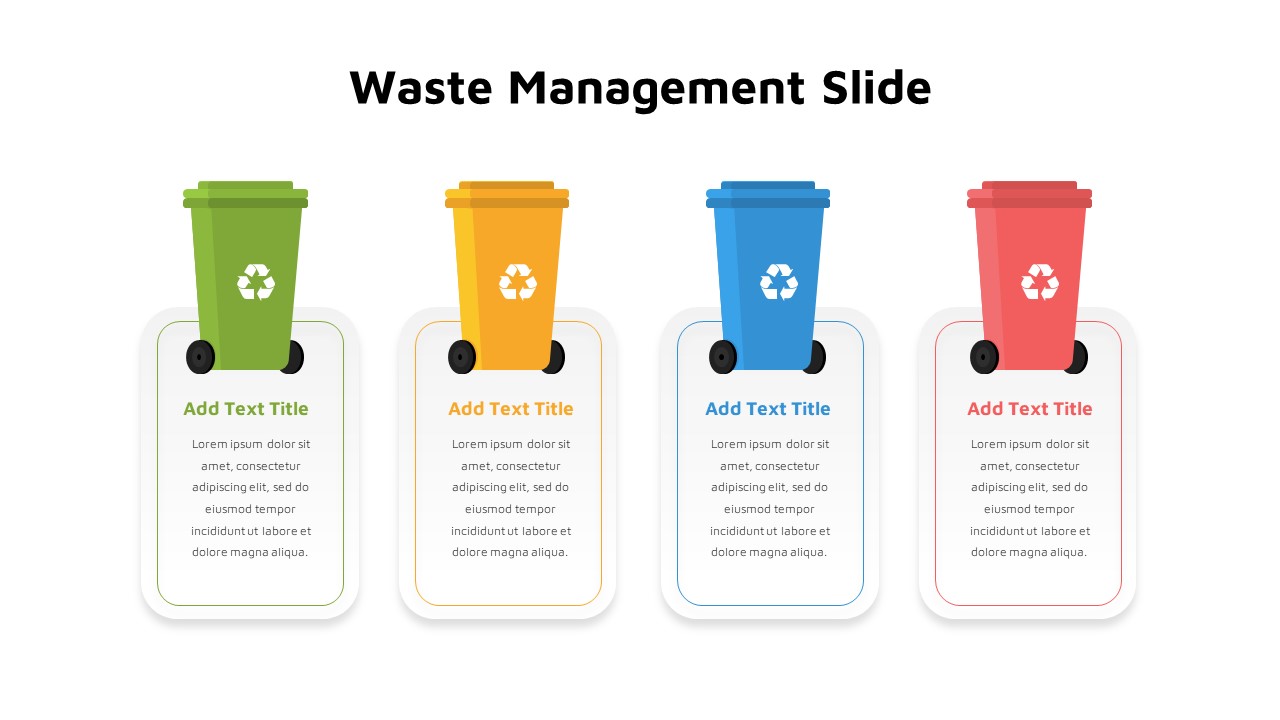
Color-Coded Waste Management Bins Template for PowerPoint & Google Slides
Comparison
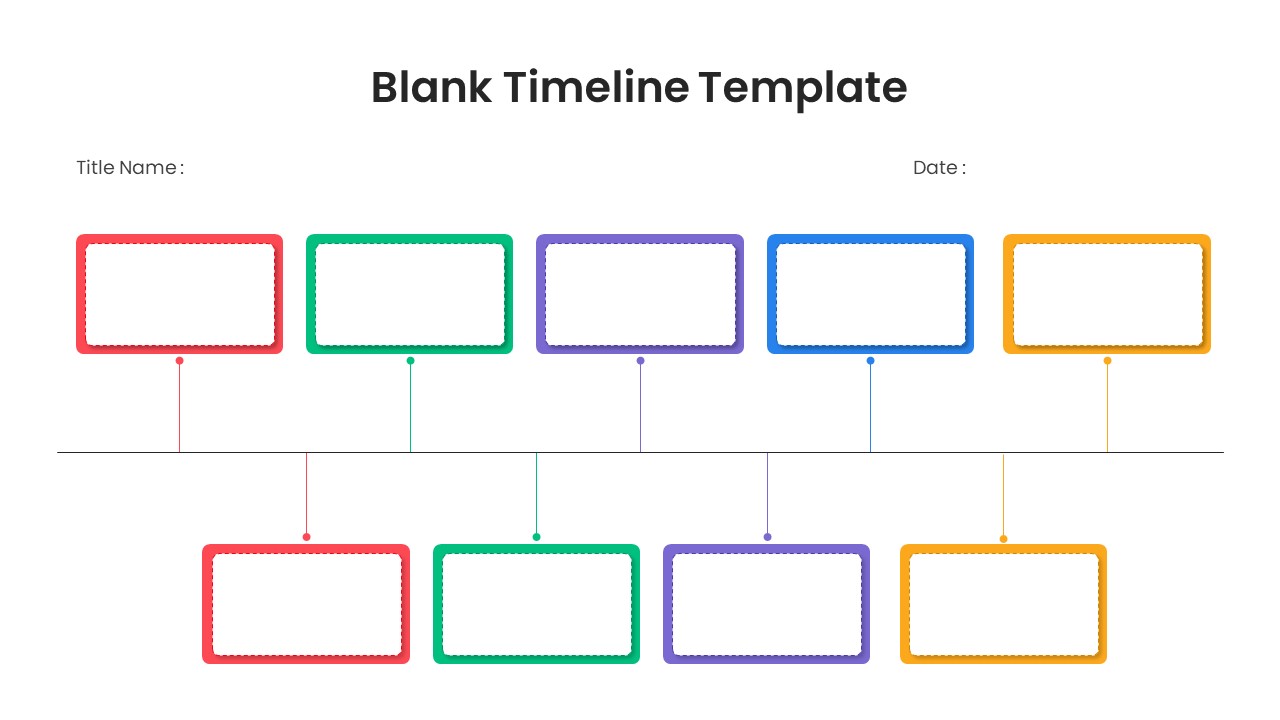
Blank Two-Tier Color-Coded Timeline Template for PowerPoint & Google Slides
Timeline
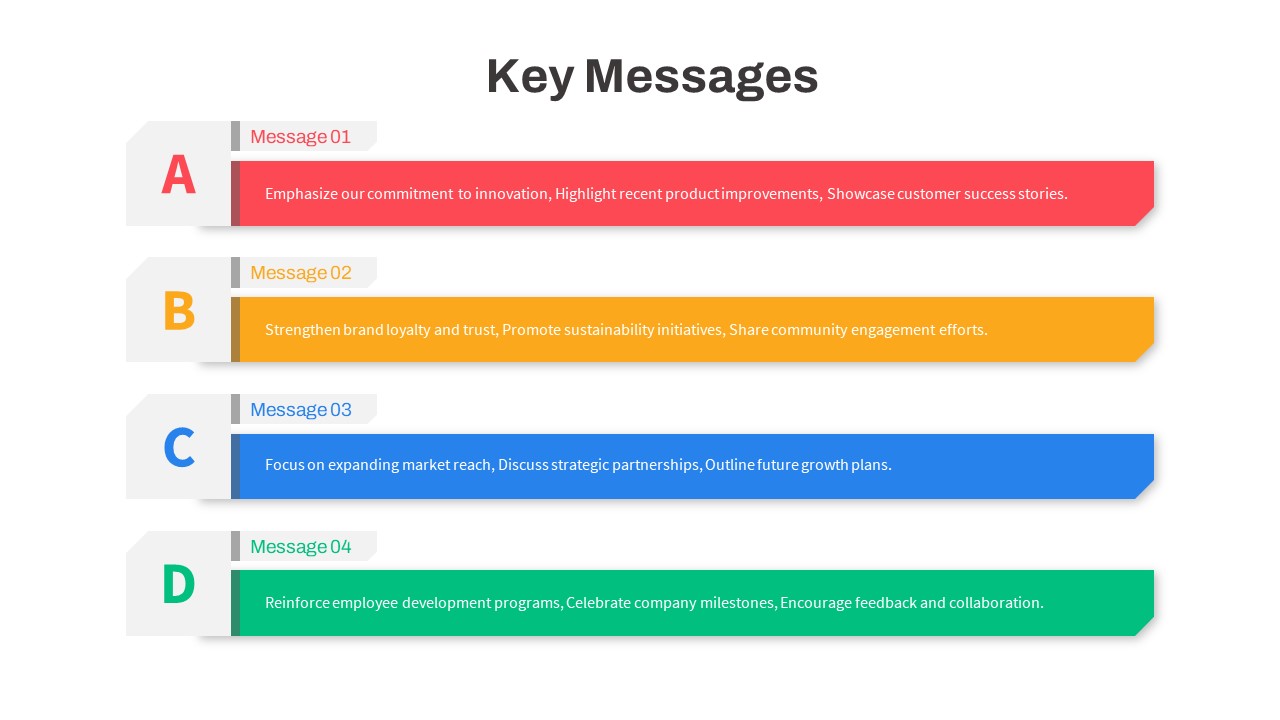
Color-Coded Corporate Key Messages Template for PowerPoint & Google Slides
Process
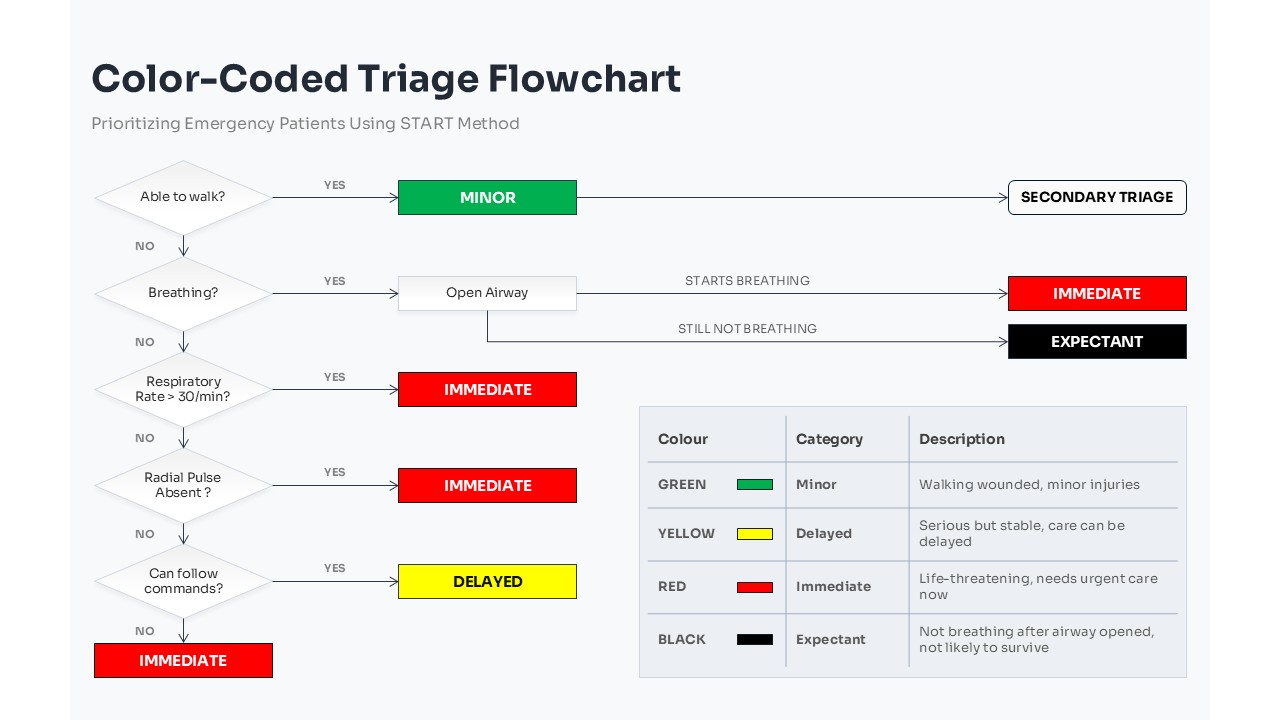
Color-Coded Medical Triage Flowchart Template for PowerPoint & Google Slides
Flow Charts
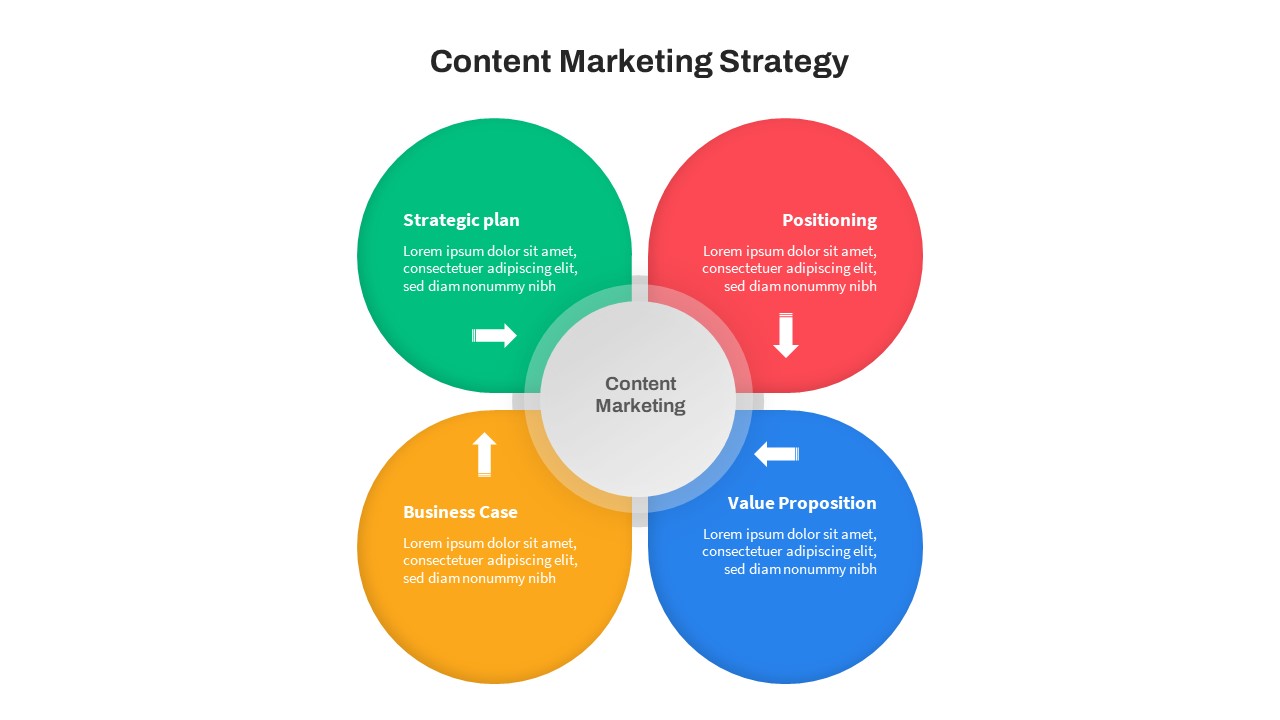
Color-Coded Content Marketing Strategy Slide for PowerPoint & Google Slides
Marketing
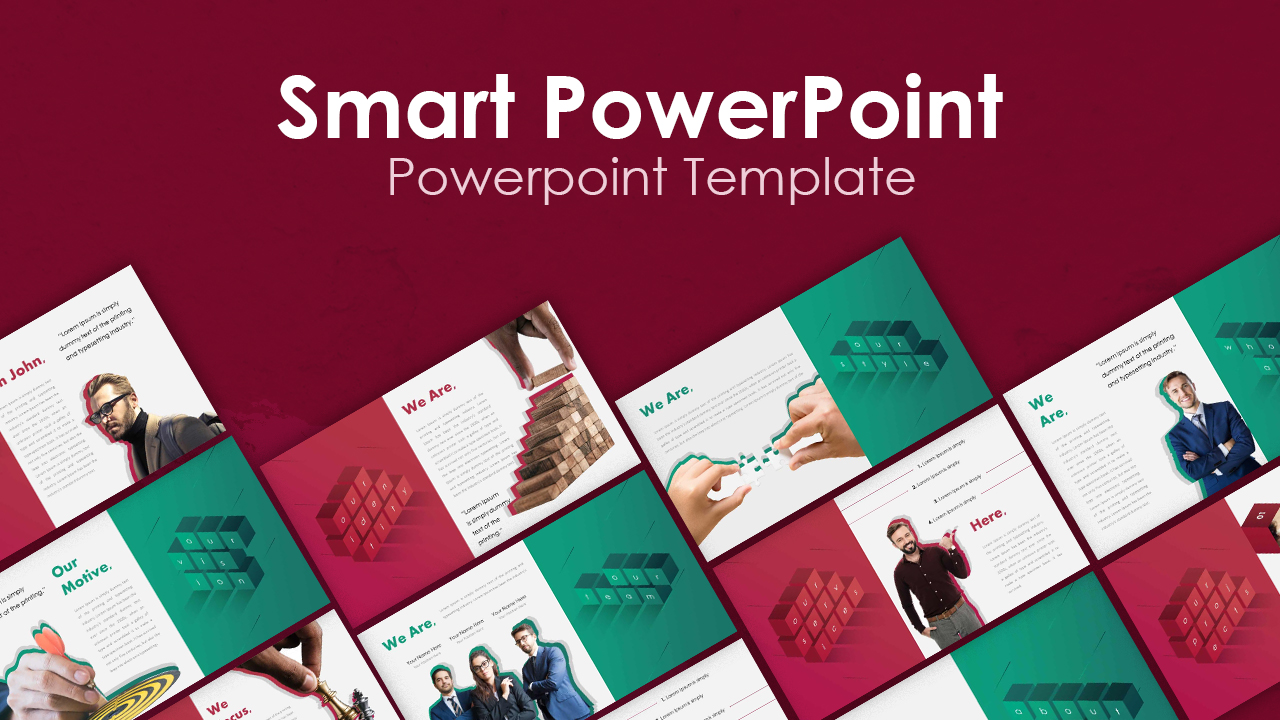
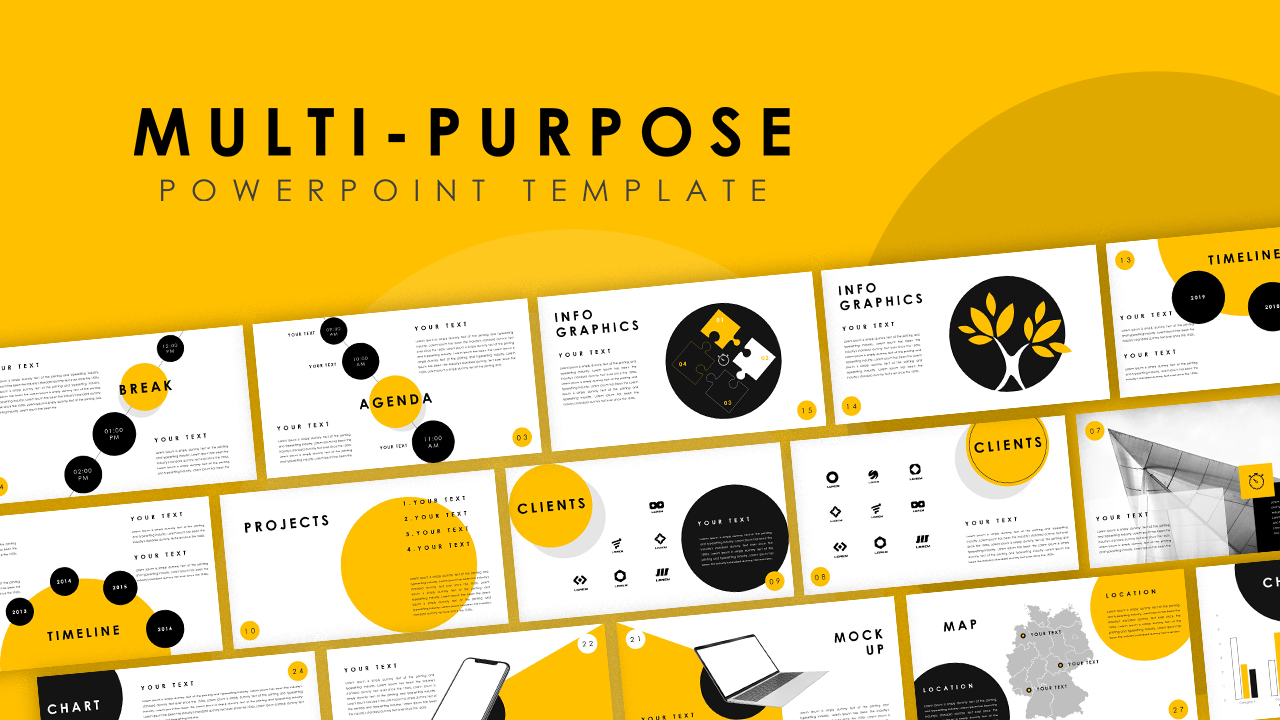
Smart Multi-Purpose PowerPoint Template for PowerPoint & Google Slides
Company Profile
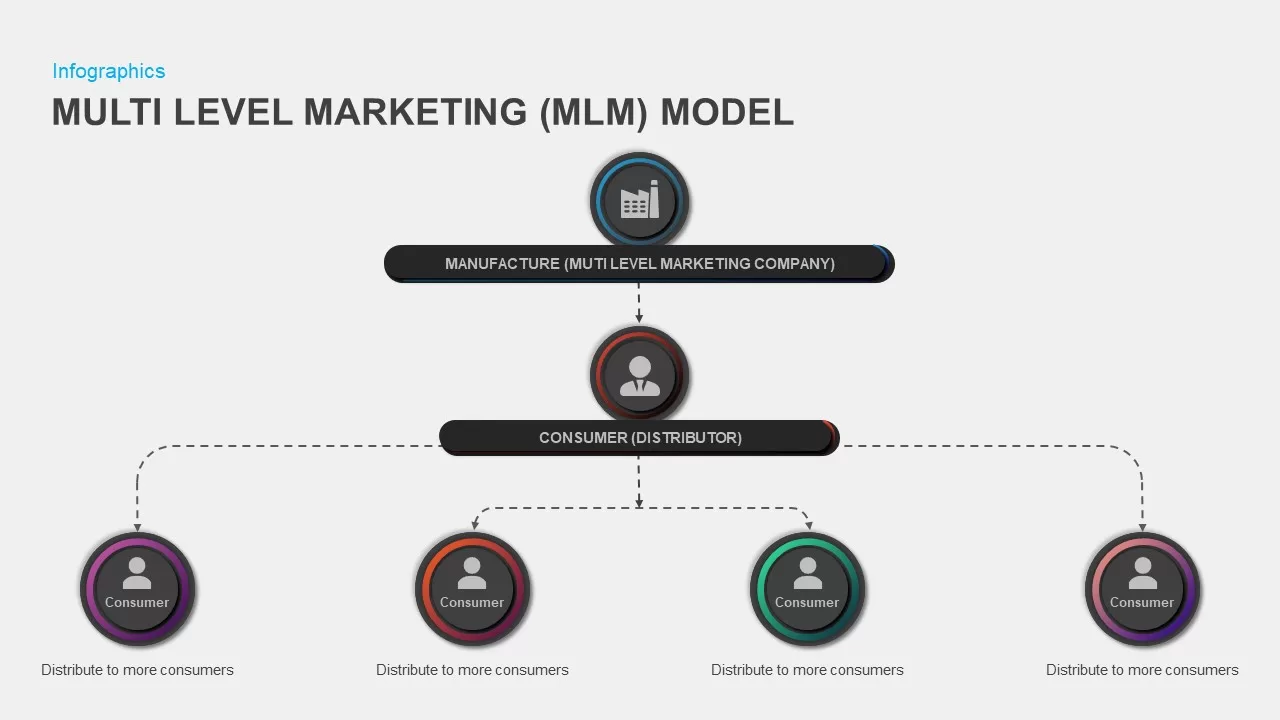
Multi-Level Marketing PowerPoint Template for PowerPoint & Google Slides
Business Models

Modern Ten-Block Section Title Chart template for PowerPoint & Google Slides
Comparison
Modern Colorful Circular Org Chart Template for PowerPoint & Google Slides
Org Chart
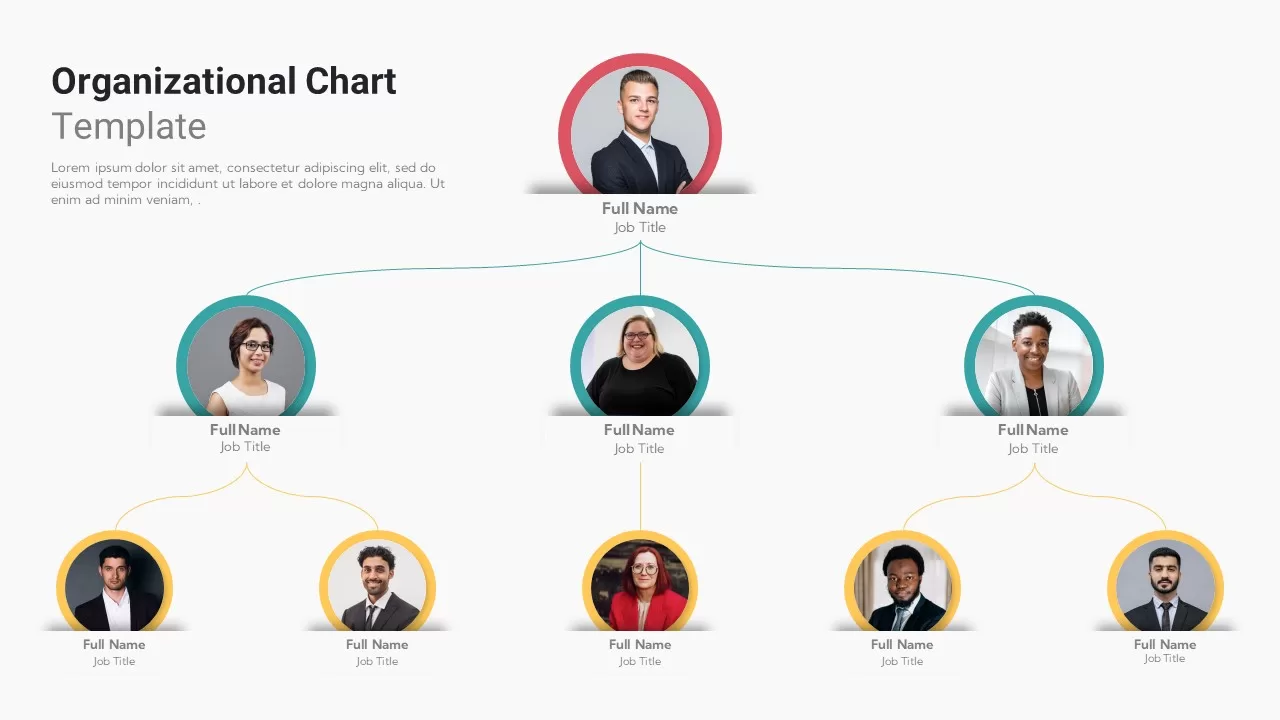
Modern Organizational Chart Hierarchy Template for PowerPoint & Google Slides
Org Chart
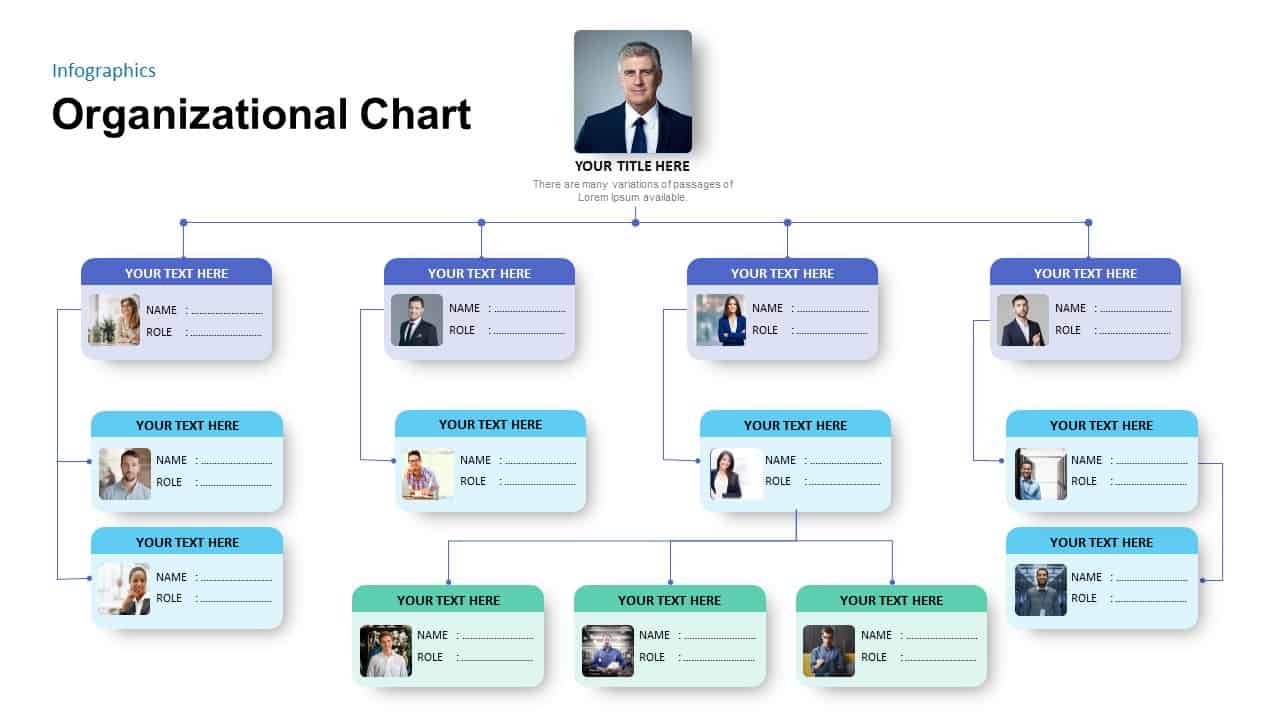
Modern Photo-Based Organizational Chart Template for PowerPoint & Google Slides
Org Chart
Modern Image-Based Organizational Chart Template for PowerPoint & Google Slides
Infographics
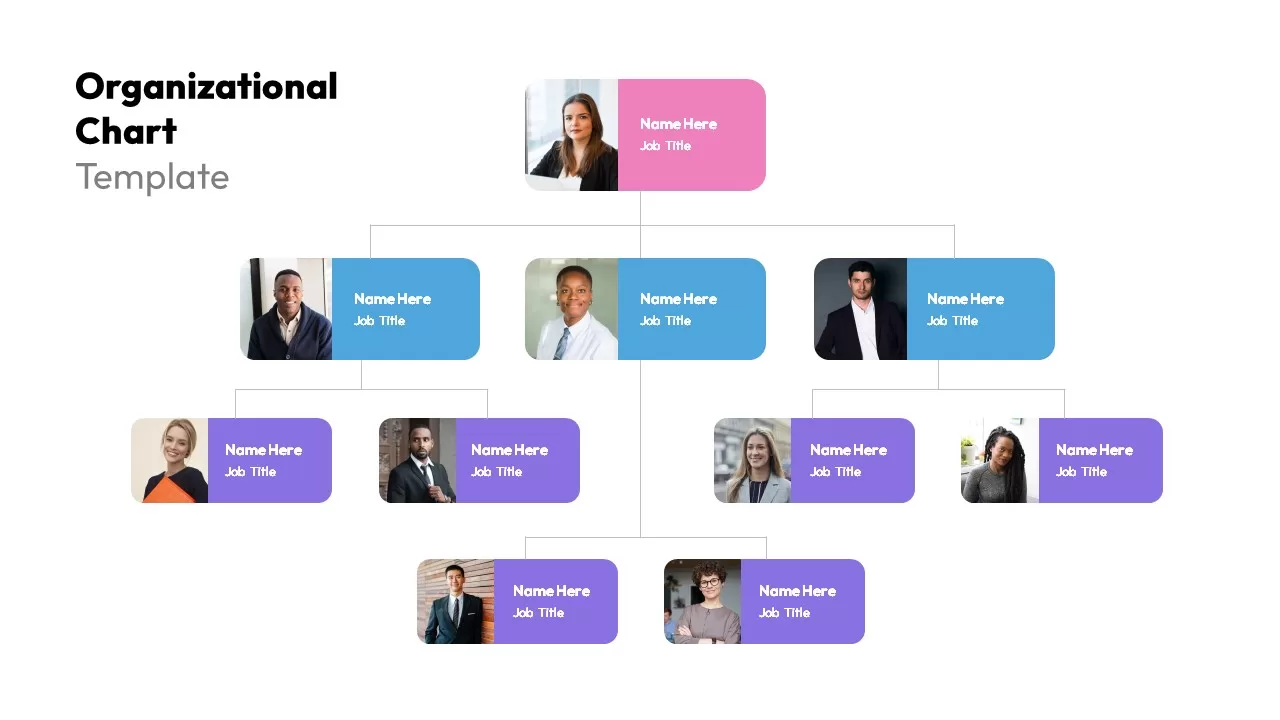
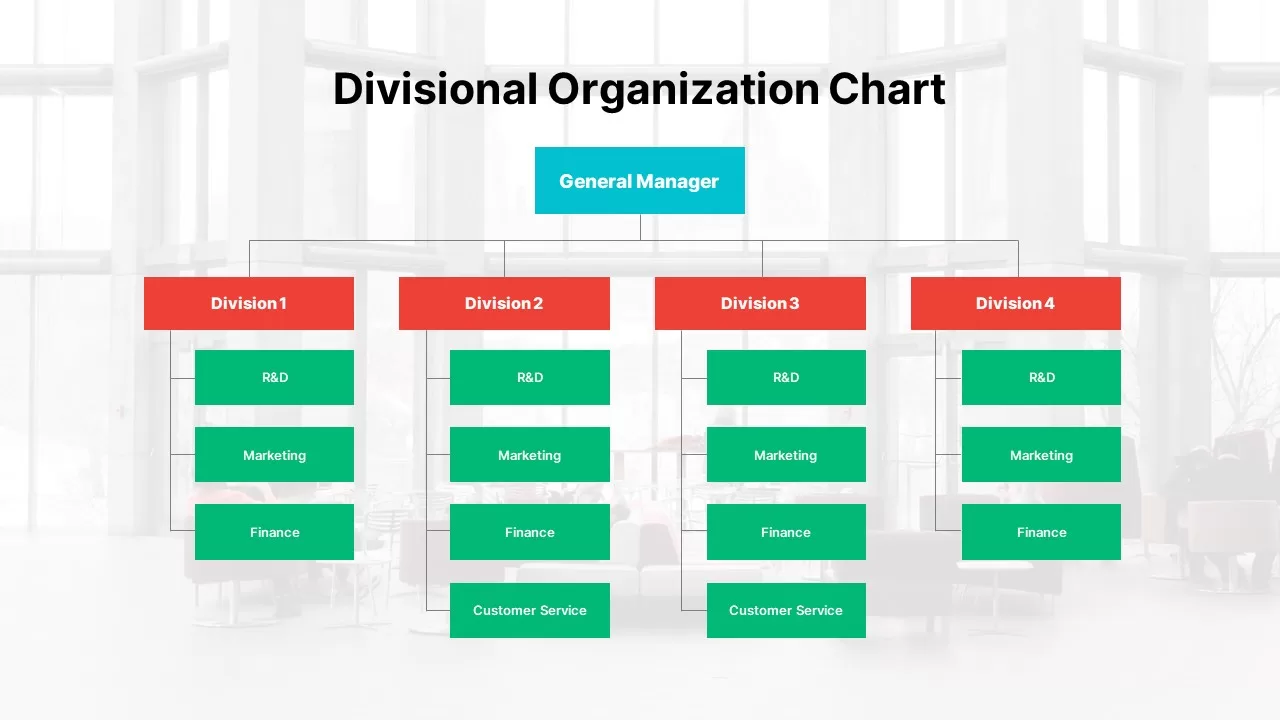
Modern Divisional Organization Chart Template for PowerPoint & Google Slides
Org Chart
Multi-Series Curved Line Graph Analytics Template for PowerPoint & Google Slides
Comparison Chart

Simple Multi-Branch Mind Map Template for PowerPoint & Google Slides
Mind Maps
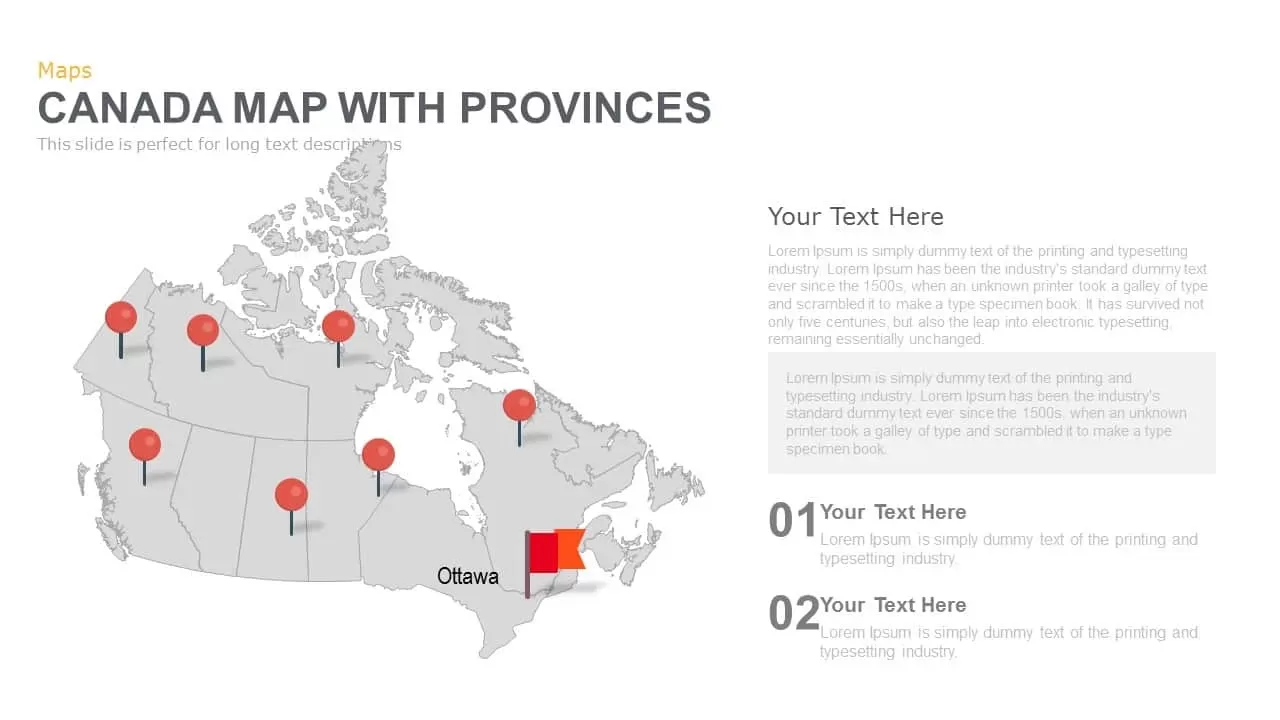
Canada Provinces Map Multi-Layout Template for PowerPoint & Google Slides
World Maps
Multi-Stage Timeline Infographics Template for PowerPoint & Google Slides
Timeline
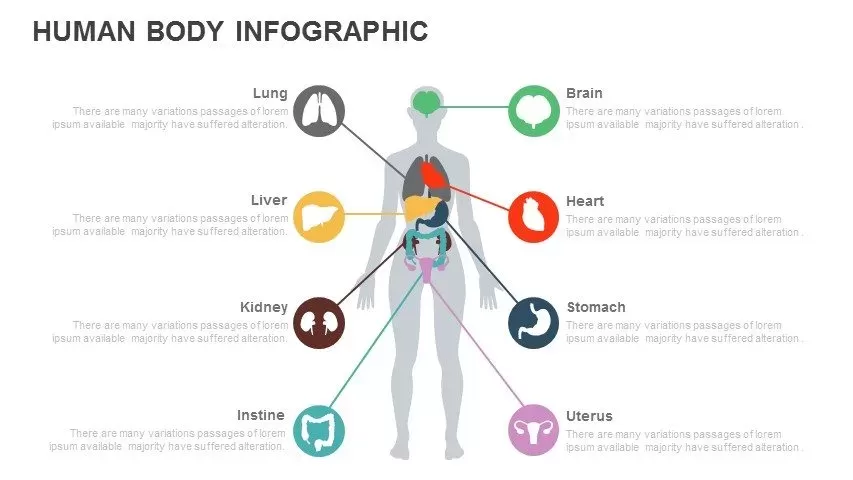
Multi-Organ Human Body Infographic Template for PowerPoint & Google Slides
Comparison
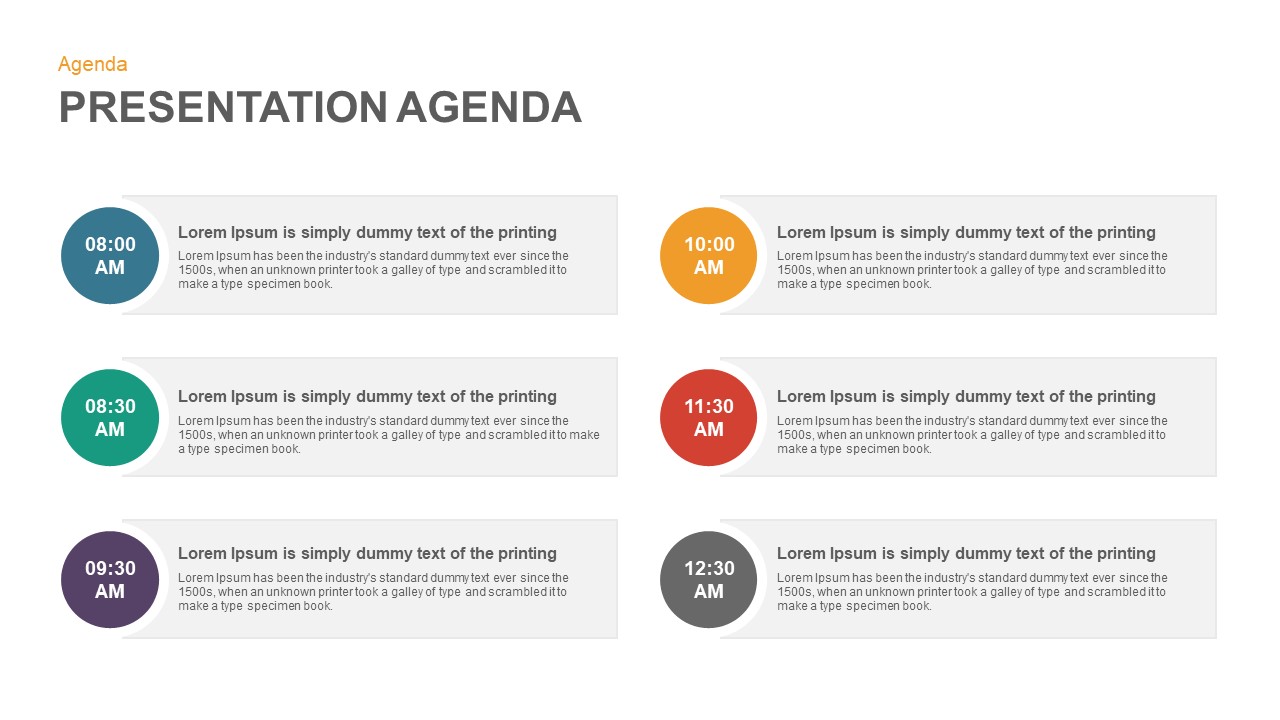
Multi-Style Presentation Agenda Template for PowerPoint & Google Slides
Agenda
Multi-Year Timeline Infographic Template for PowerPoint & Google Slides
Timeline

Multi-Cluster Mind Map Infographic Template for PowerPoint & Google Slides
Mind Maps
Multi-Functional Presentation Template for PowerPoint & Google Slides
Pitch Deck
Multi-Purpose Corporate Infographic Template for PowerPoint & Google Slides
Company Profile
Free
Doodle Multi Presentation Template for PowerPoint & Google Slides
Company Profile

Free Multi-Year Arrow Timeline Infographic Template for PowerPoint & Google Slides
Timeline
Free
Free Multi-Level Roadmap Infographic Template for PowerPoint & Google Slides
Roadmap
Free
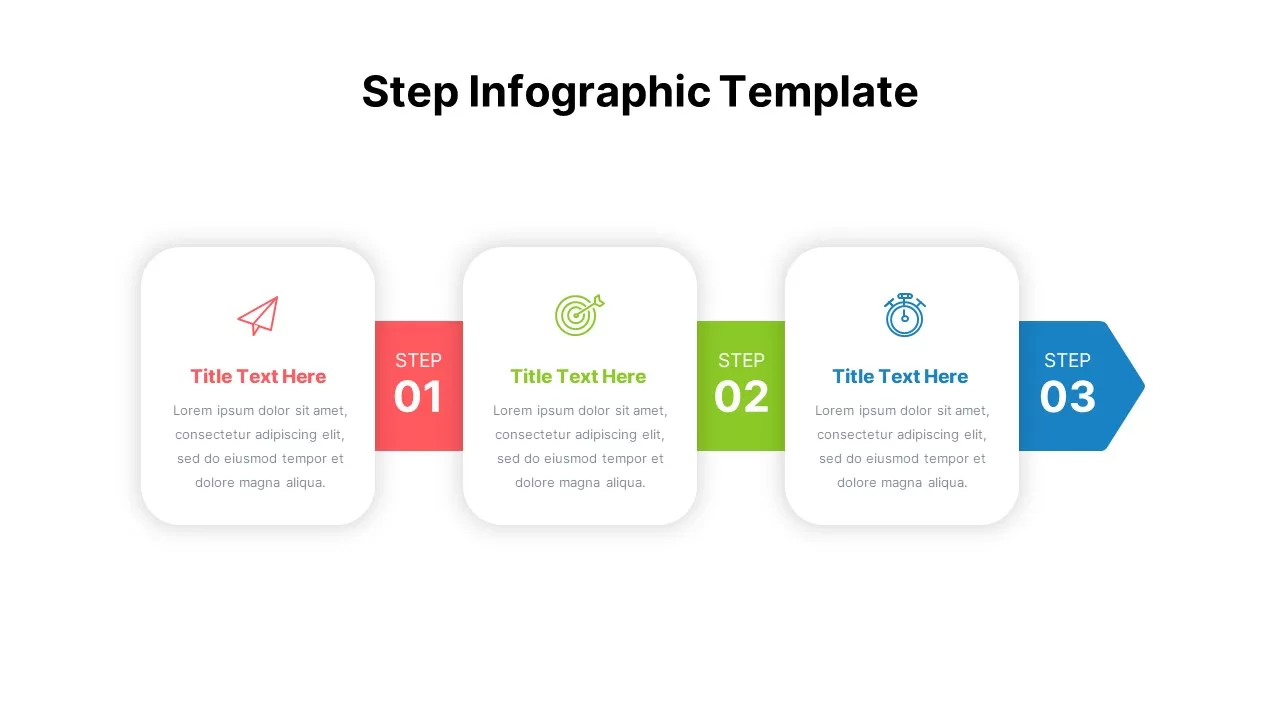
Multi-Step Infographic Process Layout Template for PowerPoint & Google Slides
Process
Multi-Style Flow Infographic Slide template for PowerPoint & Google Slides
Process
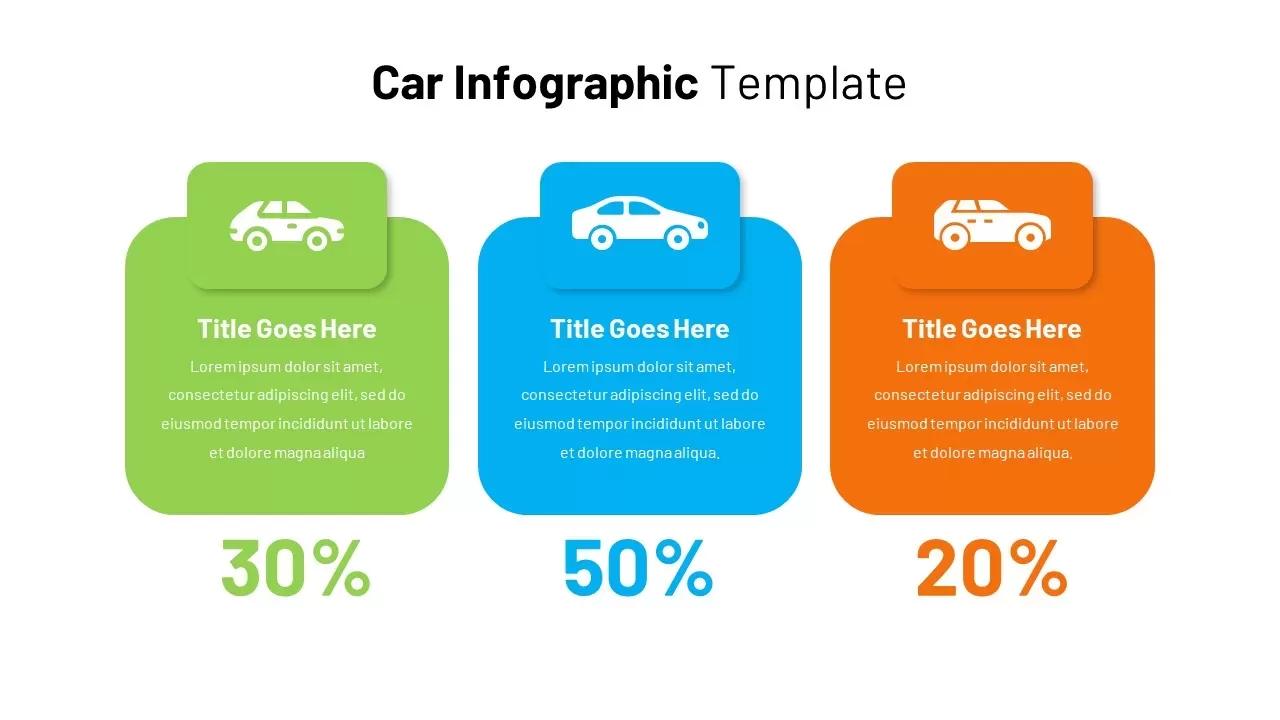
Automotive Infographic Multi-Layout Template for PowerPoint & Google Slides
Comparison
Animated Multi-Gear Cluster Infographic Template for PowerPoint & Google Slides
Process
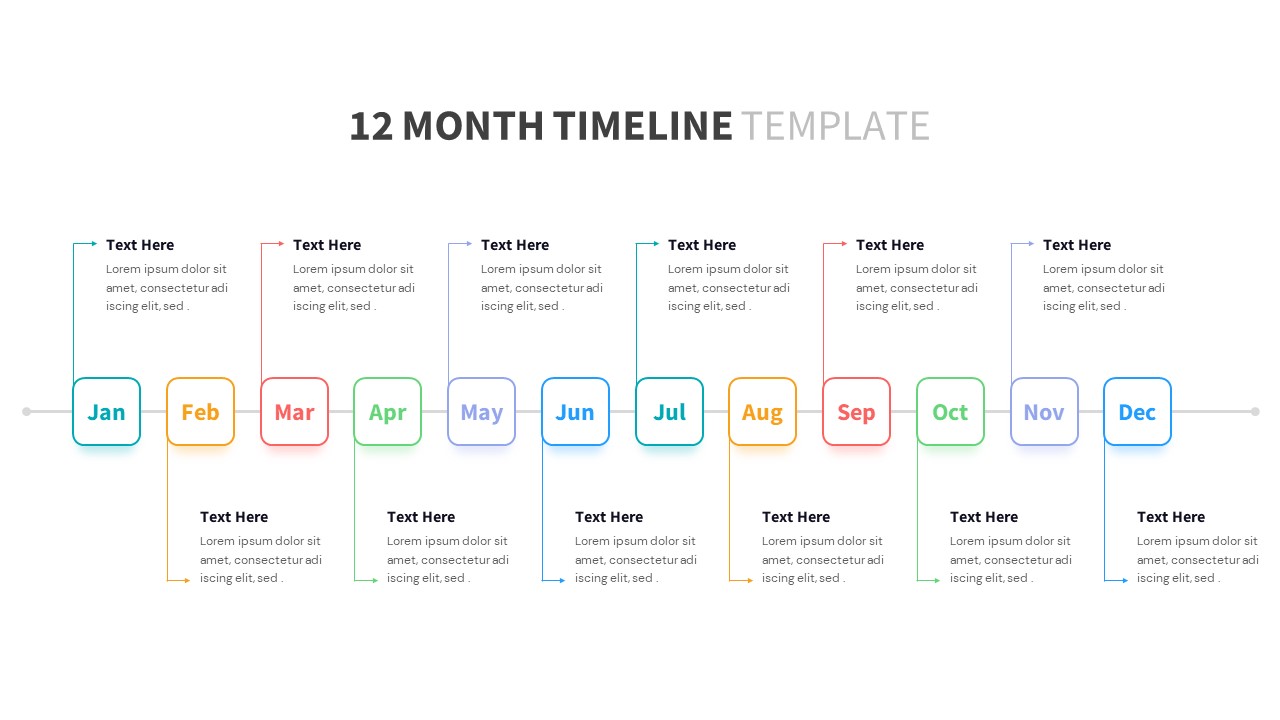
Versatile 12-Month Multi-Style Timeline Template for PowerPoint & Google Slides
Timeline
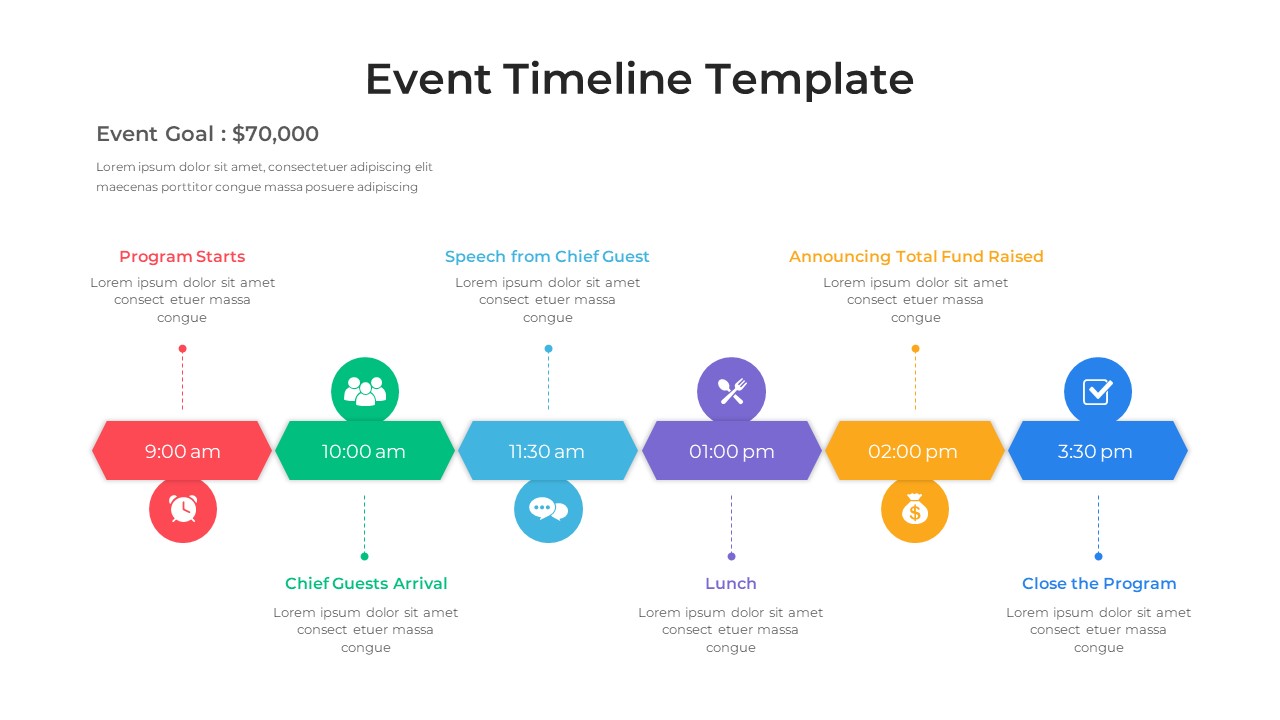
Multi-Style Event Timeline Agenda Template for PowerPoint & Google Slides
Timeline
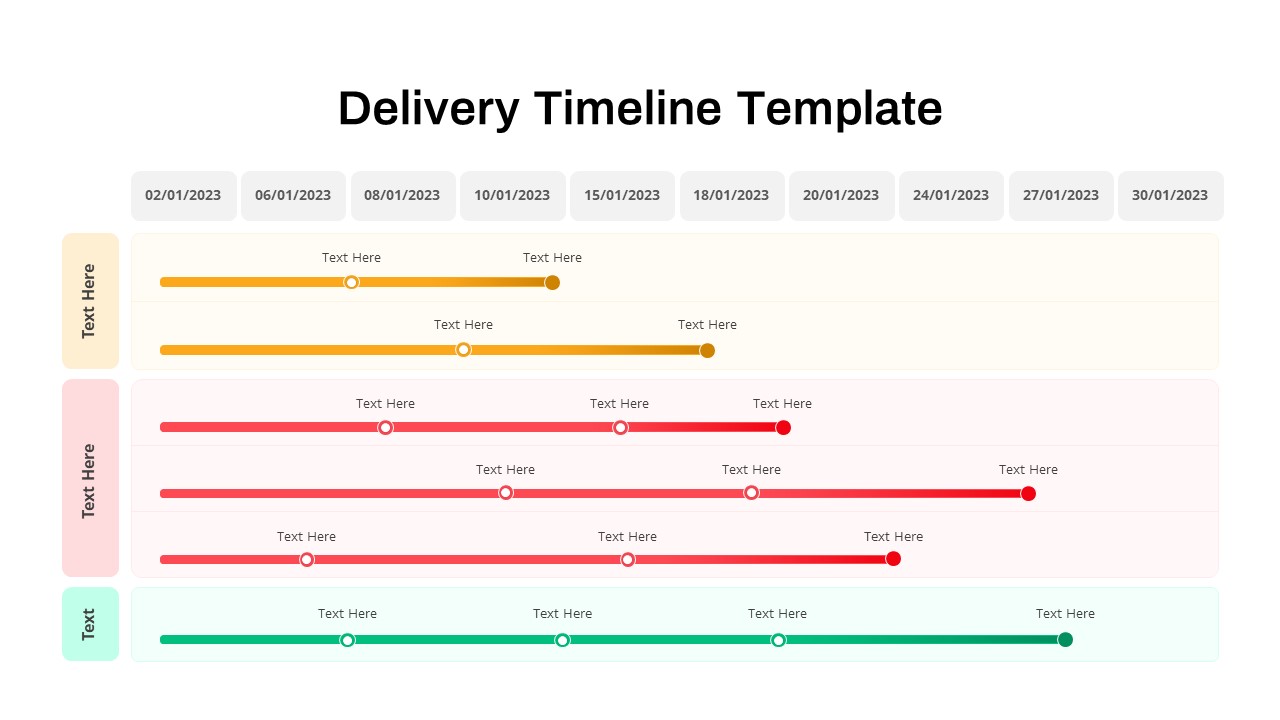
Delivery Timeline Multi-Row Template for PowerPoint & Google Slides
Timeline
Interactive Multi-Use Cost Comparison Template for PowerPoint & Google Slides
Comparison
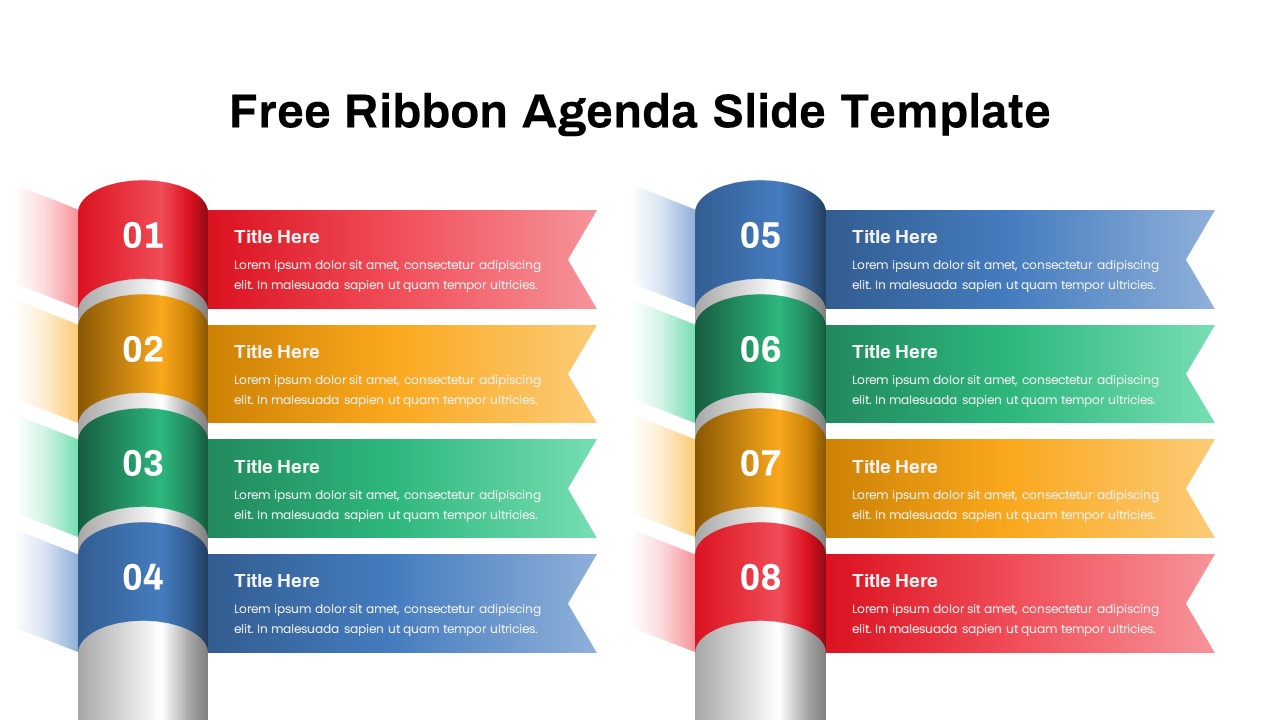
Free Editable Multi-Step Ribbon Agenda Slide Template for PowerPoint & Google Slides
Agenda
Free
Multi-Phase Research Roadmap Infographic Template for PowerPoint & Google Slides
Roadmap
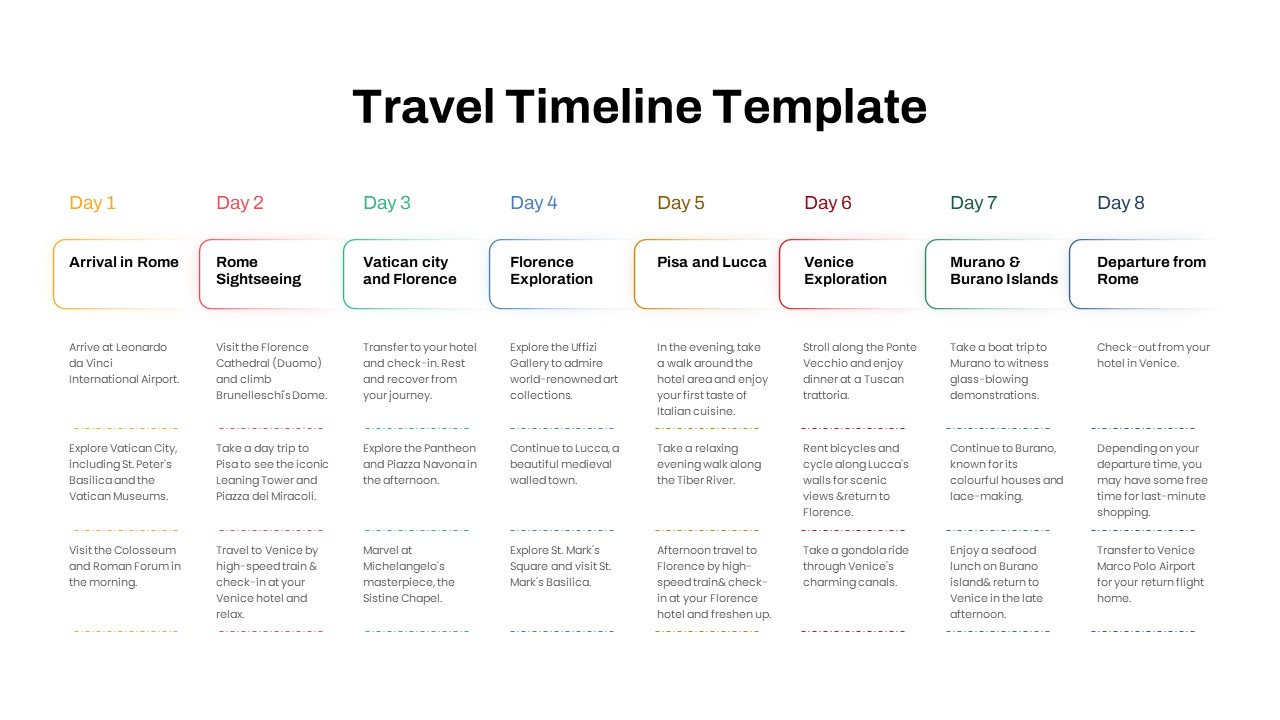
Free Elegant Multi-Day Travel Timeline Template for PowerPoint & Google Slides
Timeline
Free
Free Multi-Step Funnel Infographic Slide Pack Template for PowerPoint & Google Slides
Funnel
Free
Colorful Multi-Branch Mind Map Slide Template for PowerPoint & Google Slides
Mind Maps
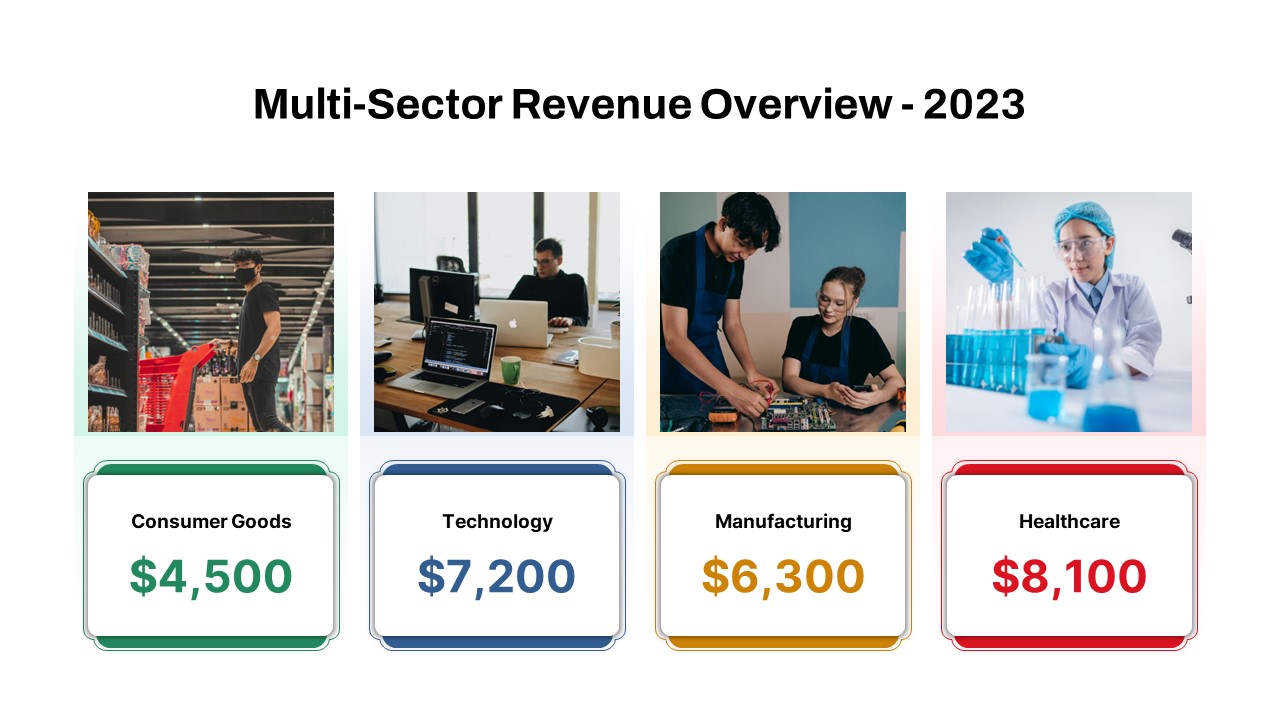
Multi-Sector Revenue Breakdown Cards Template for PowerPoint & Google Slides
Comparison
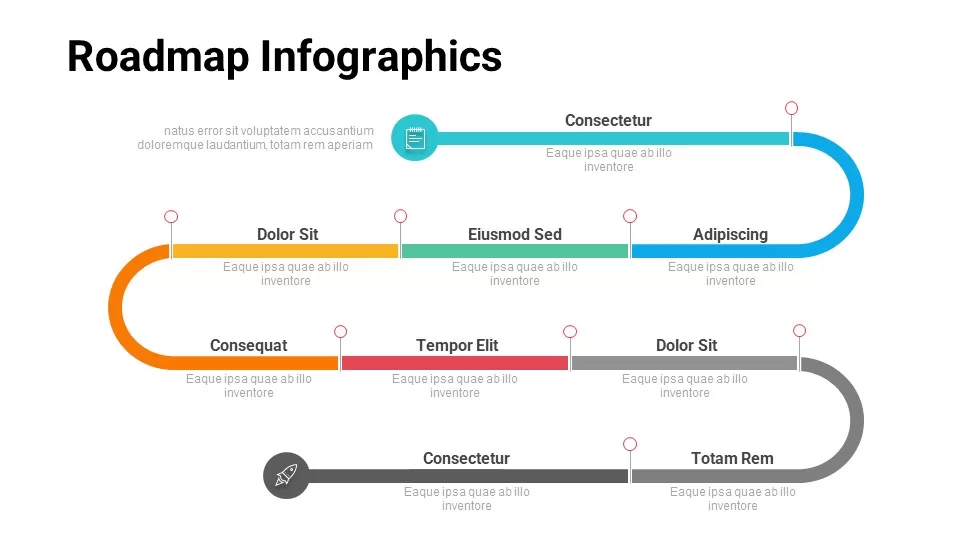
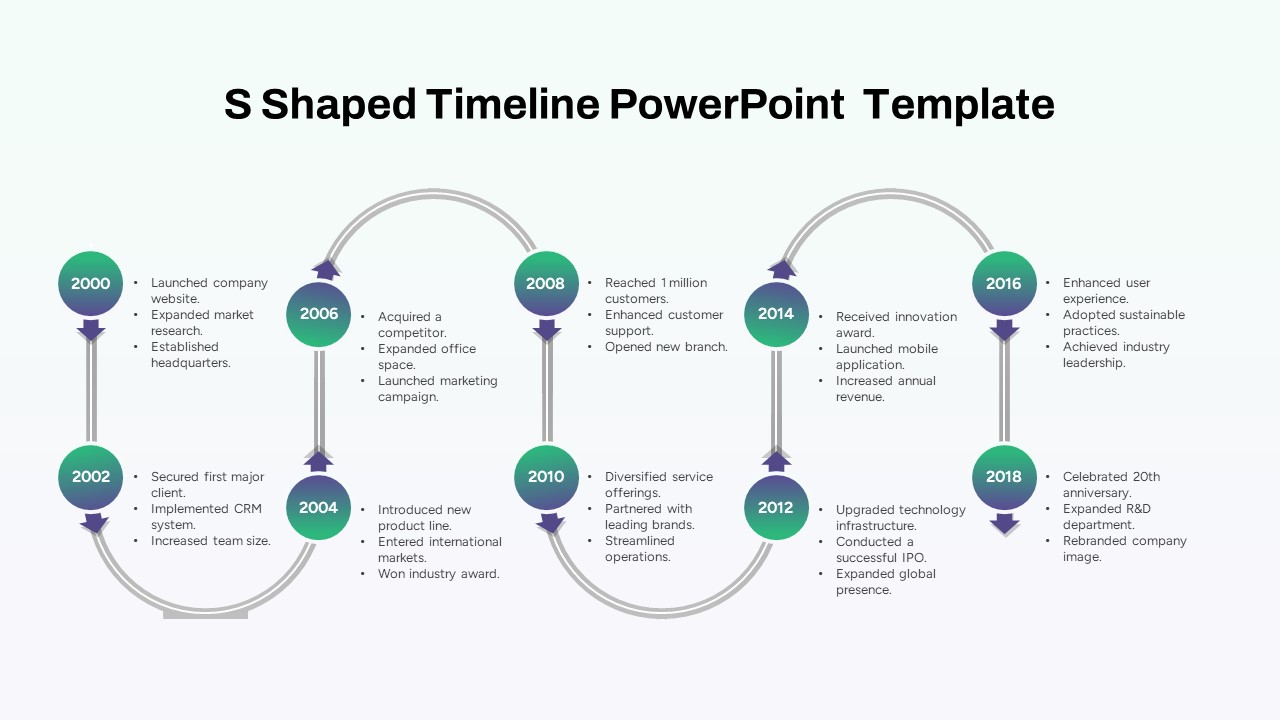
Multi-Year S-Shaped Roadmap Timeline Template for PowerPoint & Google Slides
Timeline
Multi-Style Board of Directors Profile Template for PowerPoint & Google Slides
Our Team
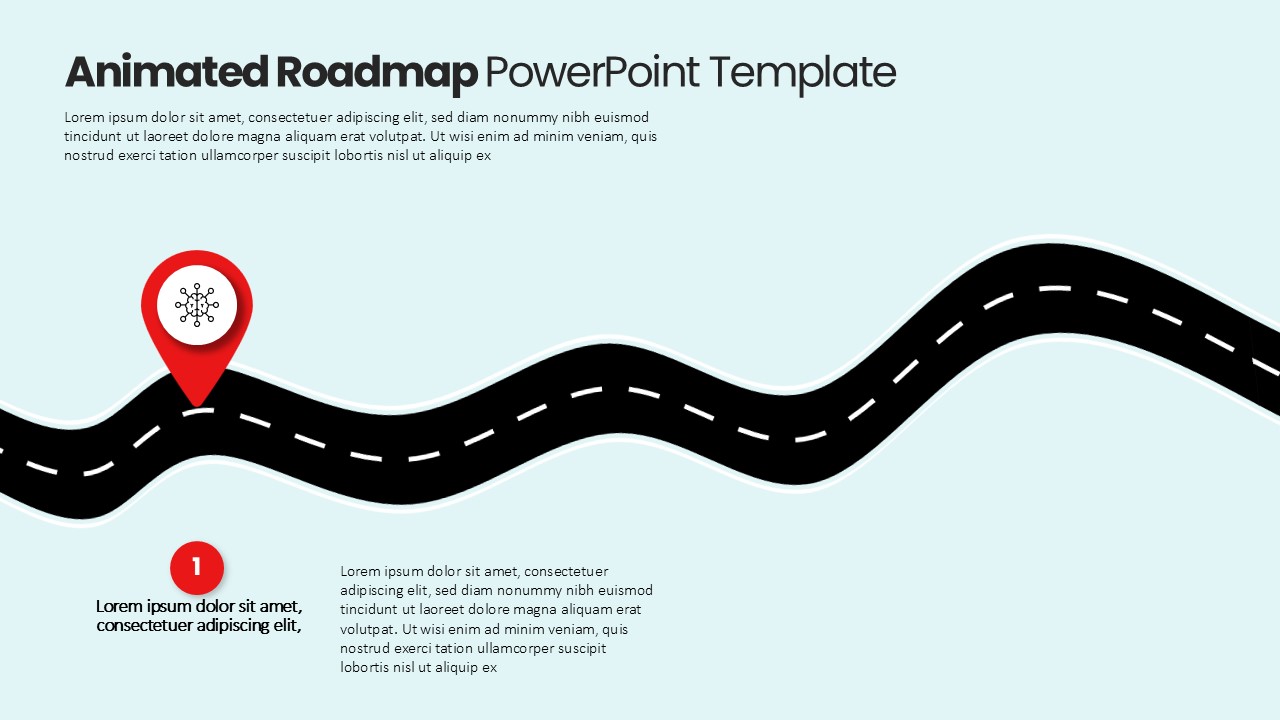
Animated Multi-Milestone Roadmap Template for PowerPoint & Google Slides
Roadmap
Multi-Column Table Presentation Template for PowerPoint & Google Slides
Table
Six-Row Multi-Column Table Presentation Template for PowerPoint & Google Slides
Table
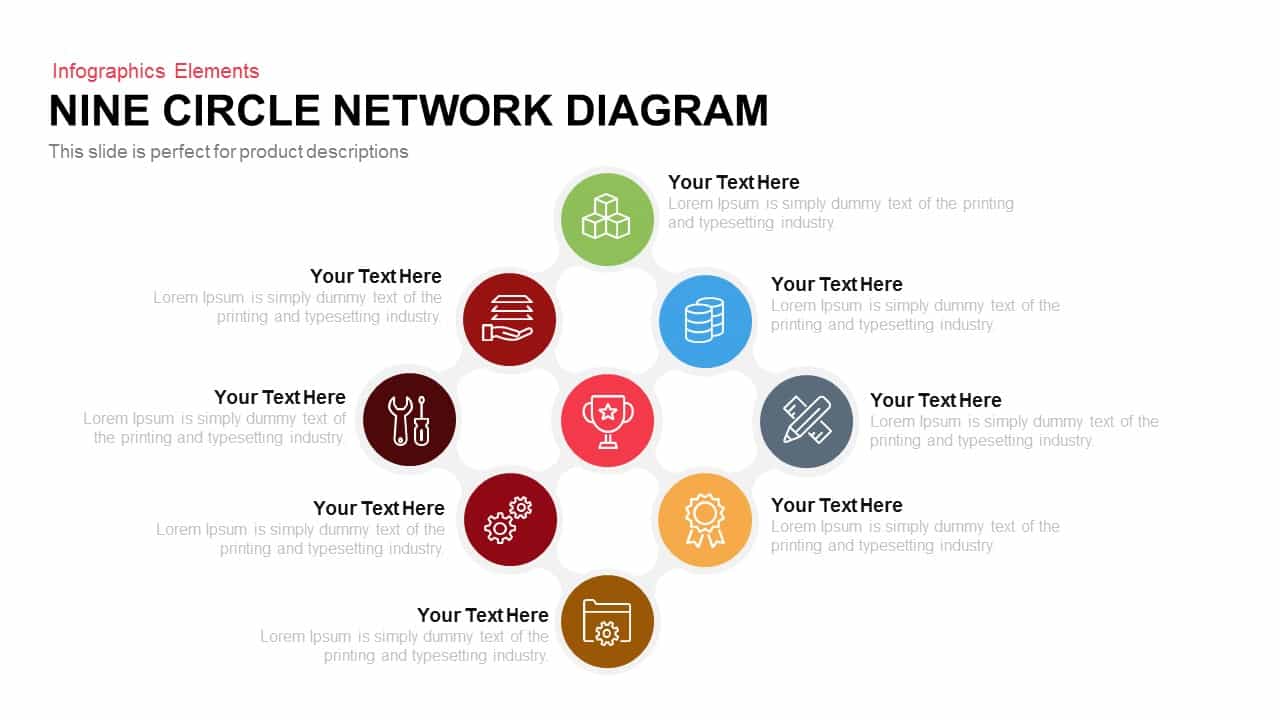
Modern Nine Circle Network Diagram Template for PowerPoint & Google Slides
Circular
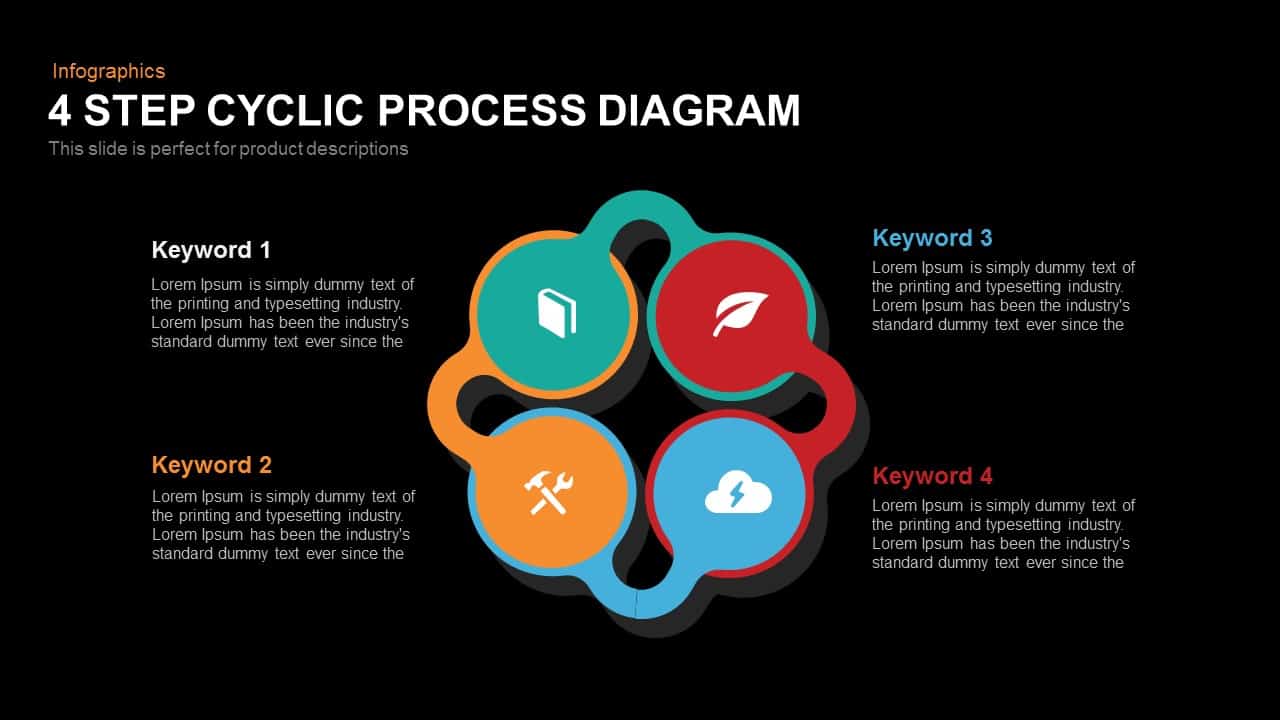
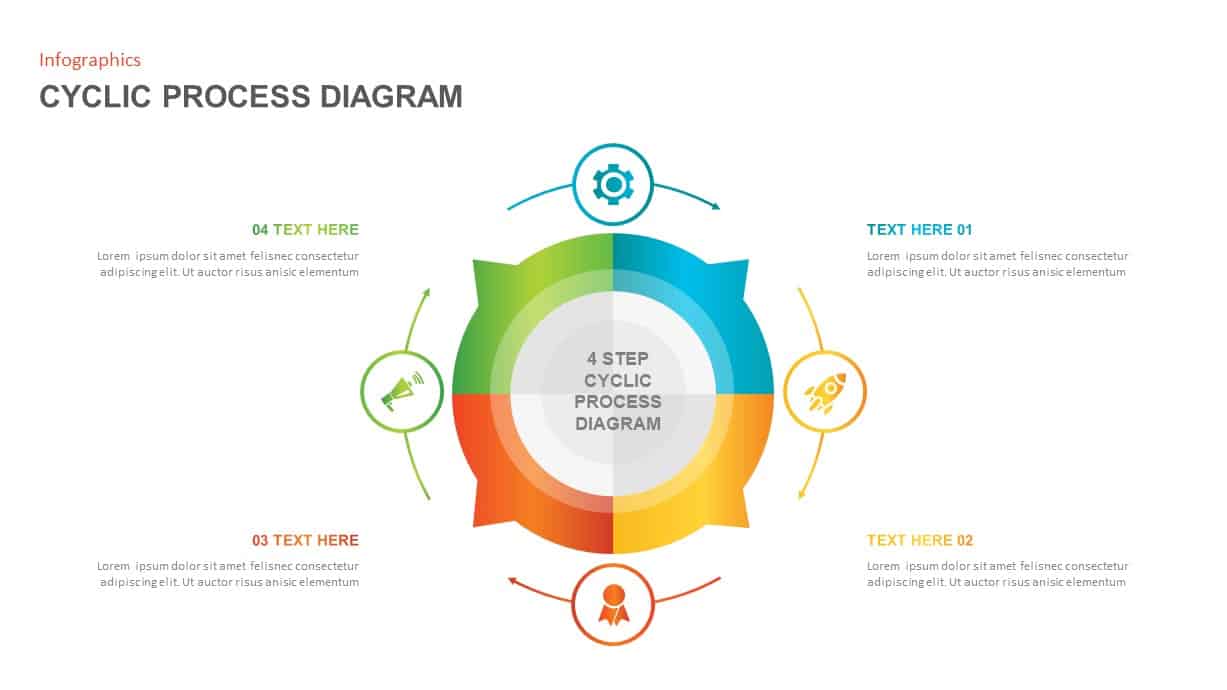
Modern 4-Step Cyclic Process Diagram Template for PowerPoint & Google Slides
Circular
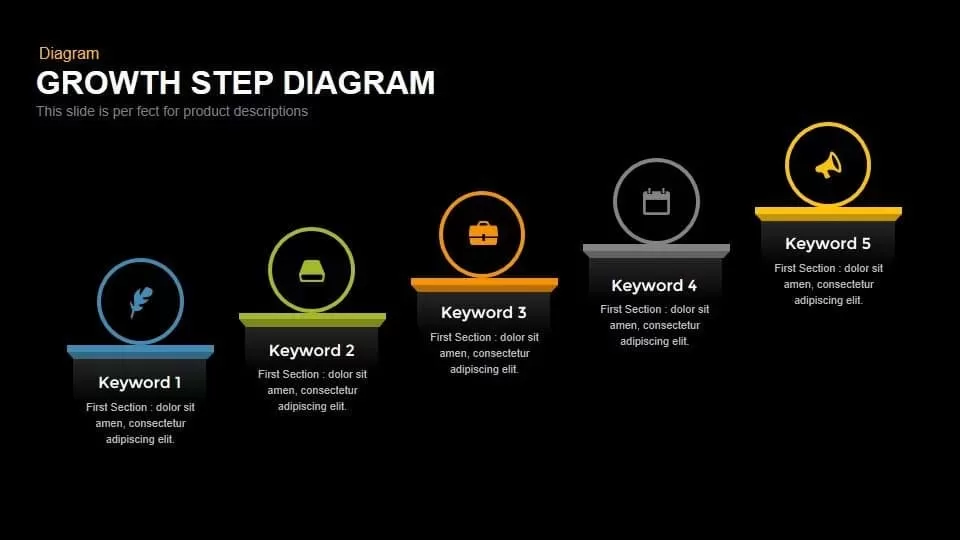
Modern Five-Step Growth Diagram Template for PowerPoint & Google Slides
Process
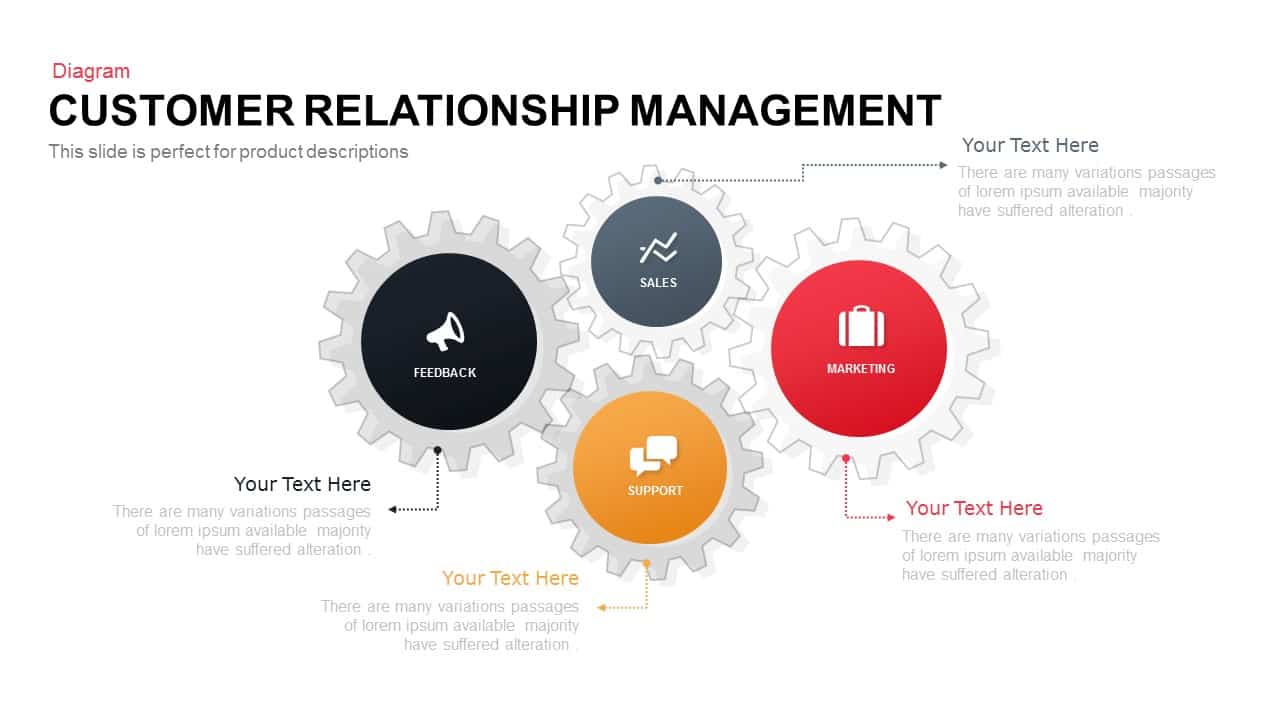
Colorful Modern CRM Gear Diagram Template for PowerPoint & Google Slides
Customer Experience
Modern Five-Stage Cycle Process Diagram Template for PowerPoint & Google Slides
Process
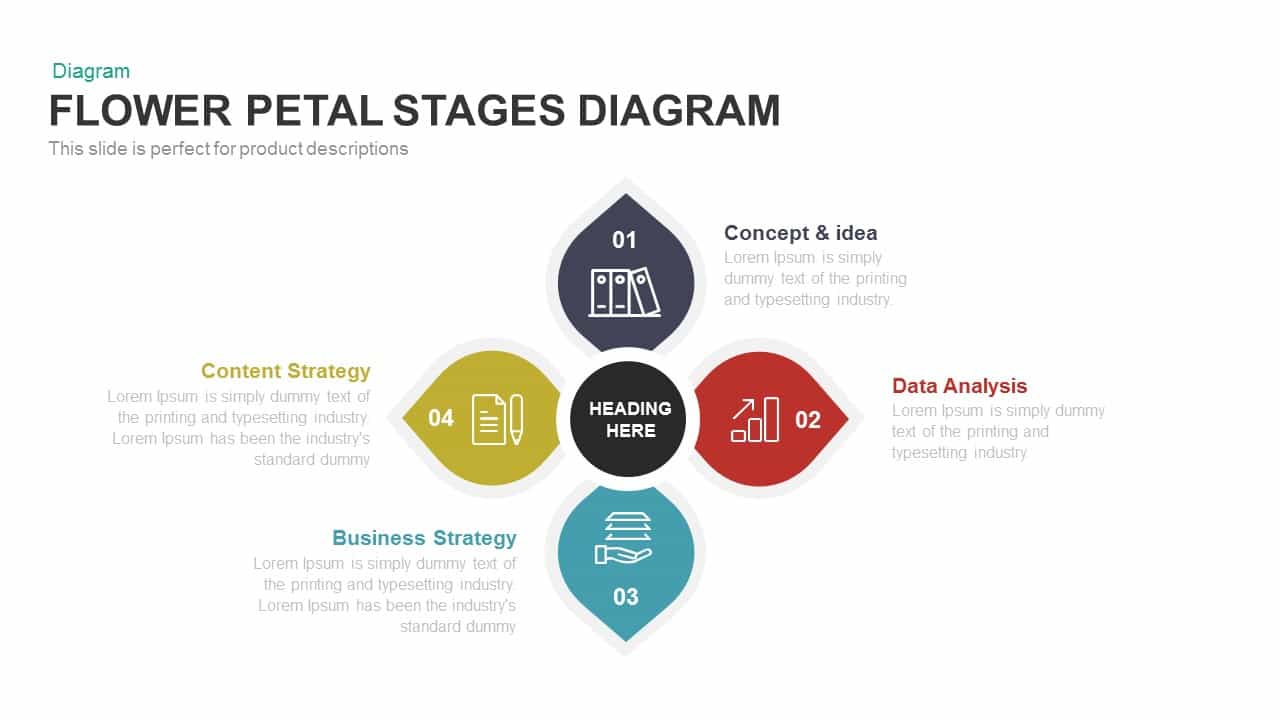
Modern Flower Petal Stages Diagram Template for PowerPoint & Google Slides
Circular

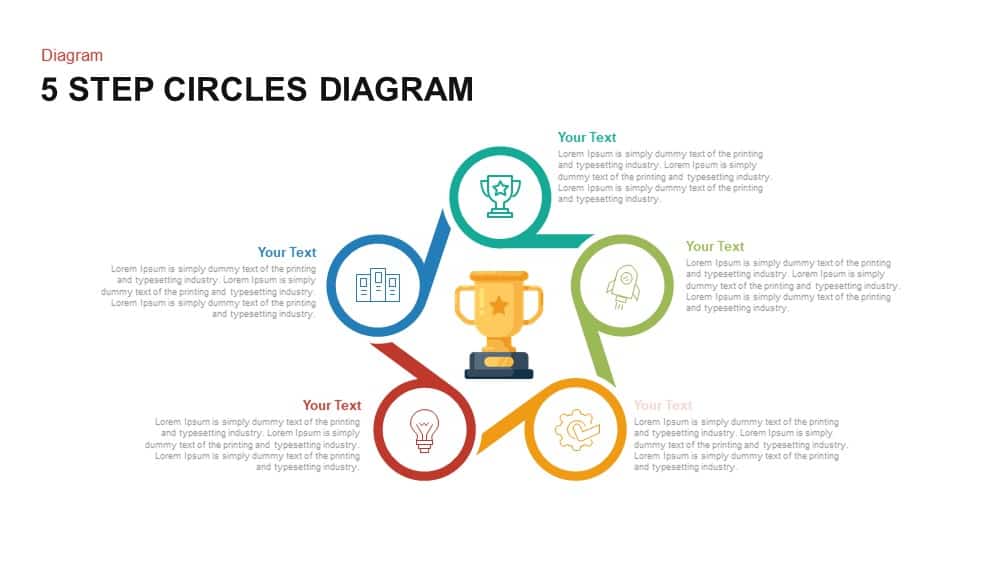
Modern Five-Step Circles Process Diagram Template for PowerPoint & Google Slides
Circular
Modern Gear Venn Diagram Infographic Template for PowerPoint & Google Slides
Comparison
Modern 6-Step Cycle Diagram Slide Deck Template for PowerPoint & Google Slides
Process
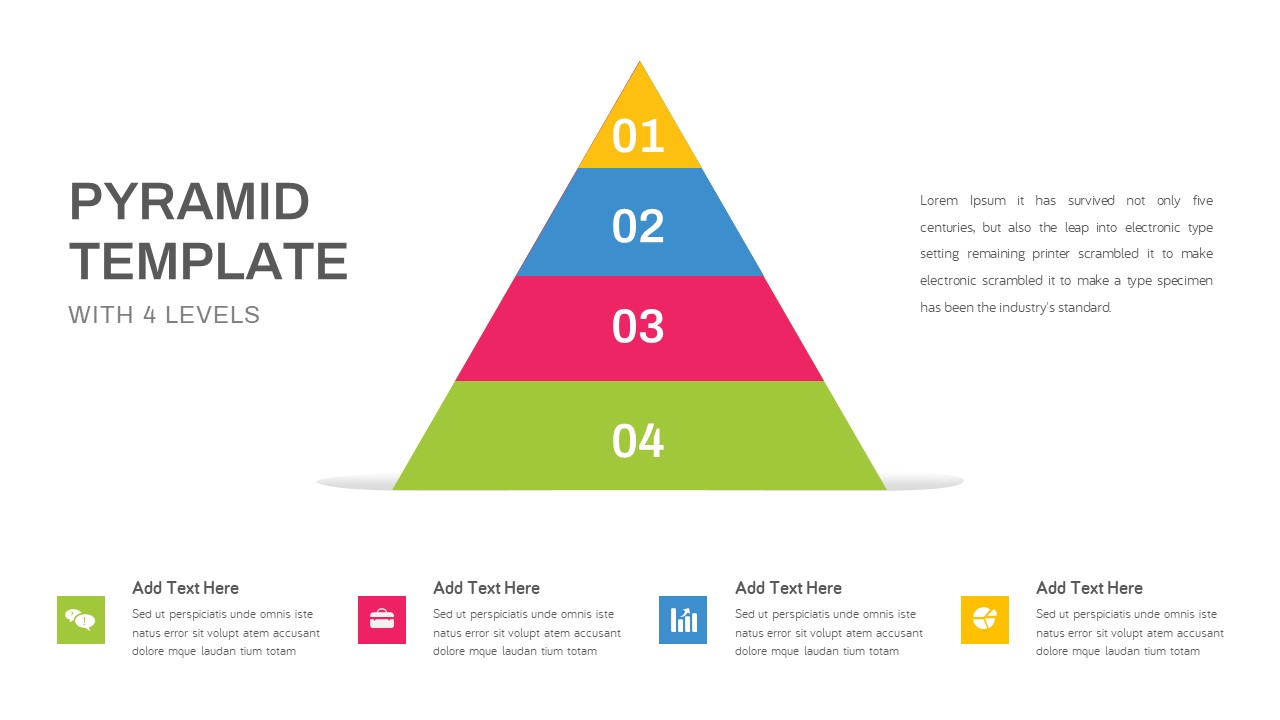
Modern Four-Level Pyramid Diagram Template for PowerPoint & Google Slides
Pyramid
Modern Growth Hacking Venn Diagram Template for PowerPoint & Google Slides
Circular
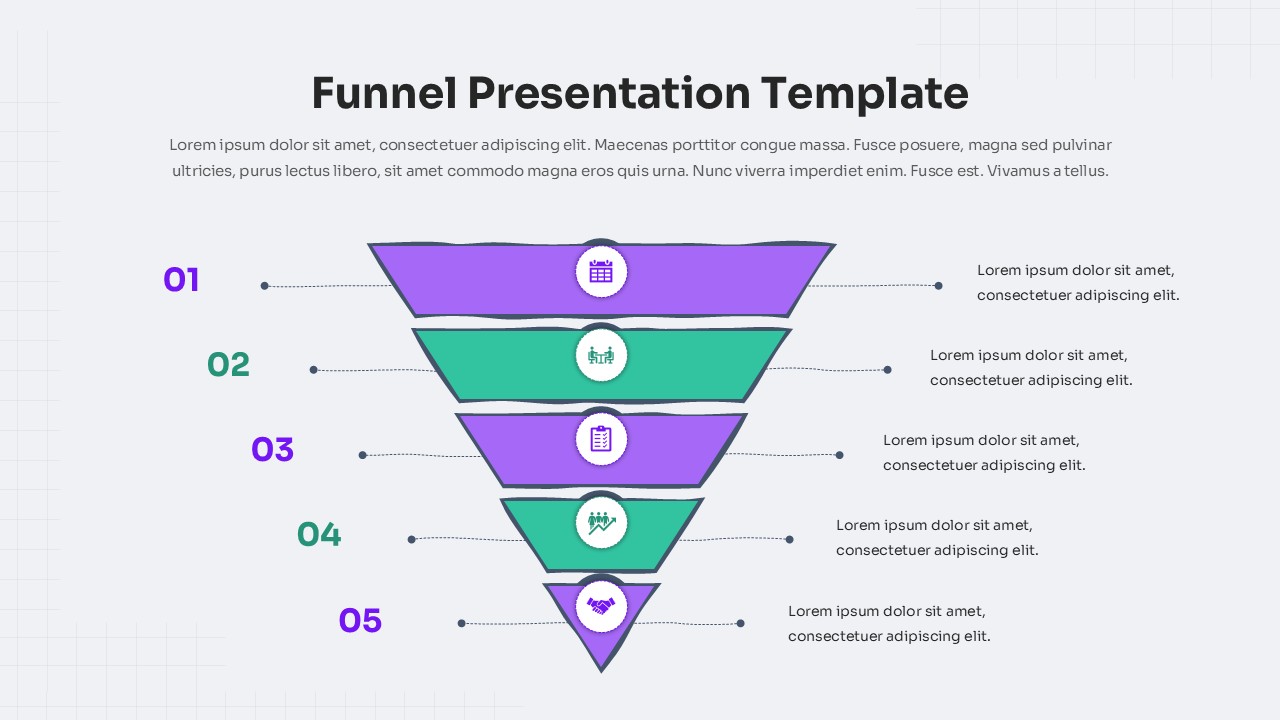
Five-Step Modern Funnel Diagram Template for PowerPoint & Google Slides
Funnel