Dynamic Data Dashboard Infographic Template for PowerPoint & Google Slides


Leverage this dynamic data dashboard infographic slide to present your metrics and insights with precision and visual appeal. This fully editable layout features a central presentation board displaying two gauge charts, a vibrant bar graph overlaid with a trend line, and two donut charts. Each chart element is color-coded to highlight performance levels, comparison data points, and segmentation insights. The clean white background and subtle silhouettes of audience figures reinforce a focus on the data while adding context for presentations, reports, and stakeholder briefings.
Built on master slides with vector-based shapes, this asset allows seamless customization: change icon styles, adjust color palettes, resize charts, or swap out datasets in seconds. Intuitive placeholders guide you through updating headlines, subheadings, and bullet text without disrupting alignment. The slide supports expanded content by adding or duplicating chart elements, ensuring scalability for more complex dashboards. Optimized for both PowerPoint and Google Slides, it maintains consistent formatting across platforms, devices, and resolutions—eliminating version control issues and design bottlenecks.
Use this infographic to track product KPIs, monitor campaign performance, visualize financial outcomes, or compare operational metrics. The versatile chart combination simplifies complex data storytelling and guides audience focus through visual hierarchy. Incorporate hyperlinks for interactive reports or link each gauge and chart to detailed backup slides. Whether you’re leading executive reviews, sales presentations, or training sessions, this dashboard infographic empowers you to communicate trends, findings, and actionable recommendations with maximum clarity.
Enhance engagement by animating chart builds, adjusting accent colors to match corporate branding, or embedding this slide into broader report decks. With its modern flat design, customizable structure, and robust chart set, this slide transforms raw data into compelling visual narratives that resonate with any audience.
Who is it for
Business analysts, project managers, and marketing professionals will benefit from this dashboard infographic slide to present metrics, track KPIs, and communicate analytical insights. Executives, consultants, and data-driven teams can also leverage this layout for stakeholder briefings, performance reviews, and interactive workshops.
Other Uses
Repurpose this slide to visualize financial results, operational performance, risk assessments, or survey findings. Adapt chart colors and iconography to depict progress dashboards, SWOT metrics, or research data flows.
Login to download this file

Item ID
SB00363
Related Templates

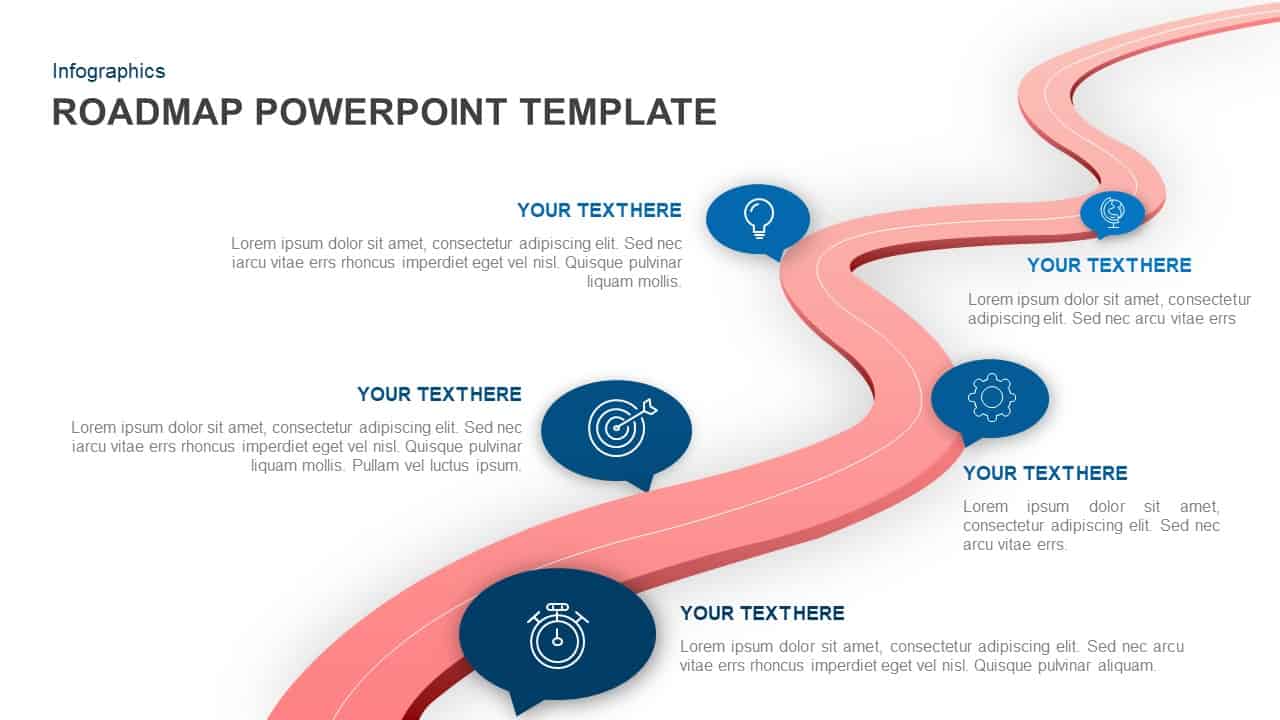
Dynamic Winding Roadmap Infographic Template for PowerPoint & Google Slides
Roadmap
Dynamic AI Applications Infographic Template for PowerPoint & Google Slides
AI
Dynamic Growth Arrow Step Infographic Template for PowerPoint & Google Slides
Process
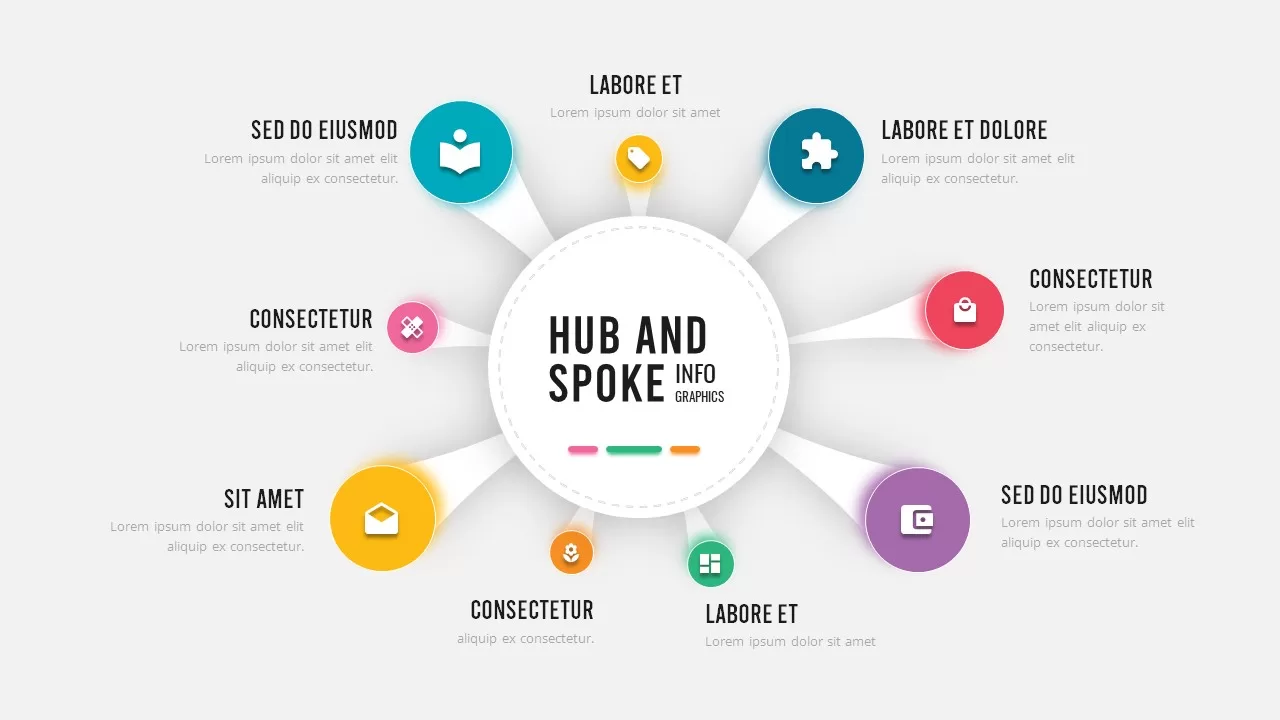
Dynamic Hub-and-Spoke Infographic Diagram Template for PowerPoint & Google Slides
Circular
Dynamic Circular Hub-and-Spoke Infographic Template for PowerPoint & Google Slides
Circular
Dynamic Chevron Timeline Infographic Template for PowerPoint & Google Slides
Timeline
Data Analytics Dashboard Design template for PowerPoint & Google Slides
Bar/Column
Immigration Data Dashboard Template for PowerPoint & Google Slides
Bar/Column
KPI Dashboard Data Visualization Template for PowerPoint & Google Slides
Bar/Column
KPI Dashboard Data Overview Slide Template for PowerPoint & Google Slides
Bar/Column

Free Data Analytics Dashboard Template for PowerPoint
Charts
Free
Creative Dynamic Gantt Chart Timeline Template for PowerPoint & Google Slides
Timeline
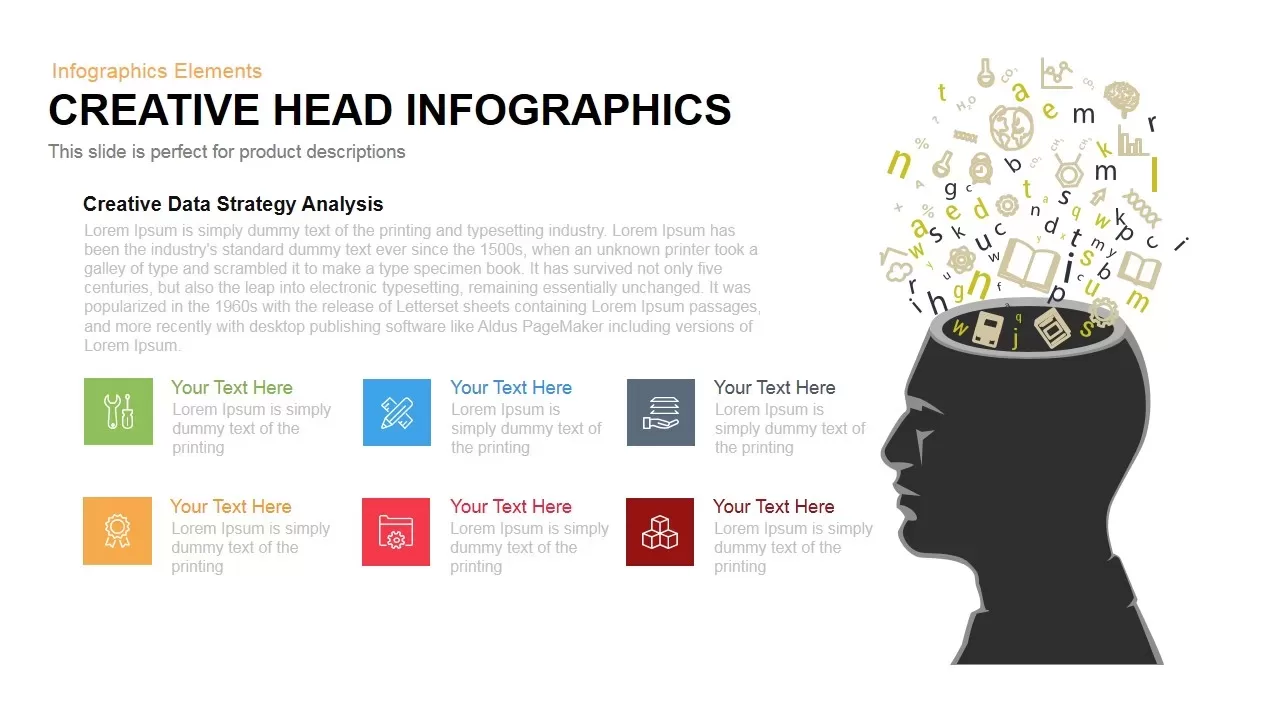
Dynamic Creative Head Infographics Template for PowerPoint & Google Slides
Circular
Dynamic Shield Process Flow Diagram template for PowerPoint & Google Slides
Process

Dynamic Circle Timeline Infographics template for PowerPoint & Google Slides
Timeline
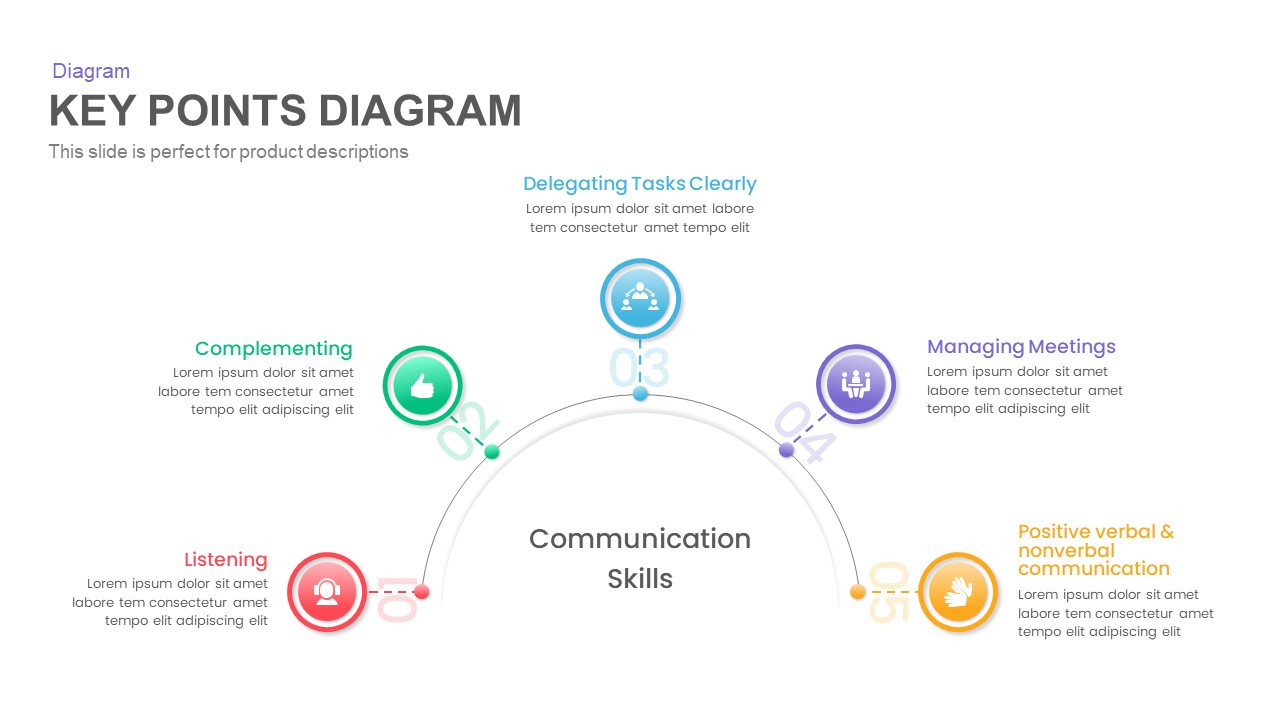
Dynamic Key Points Diagram Template for PowerPoint & Google Slides
Process

Dynamic Arrow Process Template for PowerPoint & Google Slides
Process

Dynamic 4 Gear Process Diagram Template for PowerPoint & Google Slides
Process
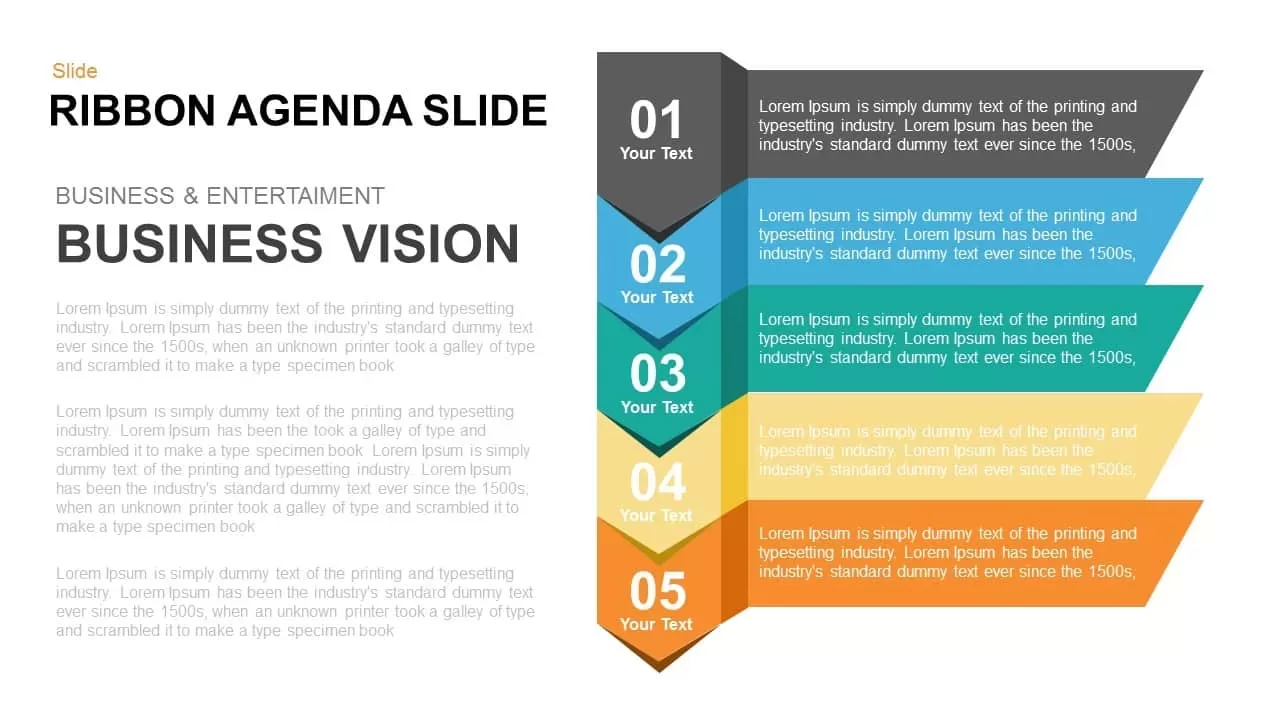
Dynamic Five-Step Ribbon Agenda Layout Template for PowerPoint & Google Slides
Agenda
Dynamic Multicolor Comparison Table Template for PowerPoint & Google Slides
Comparison
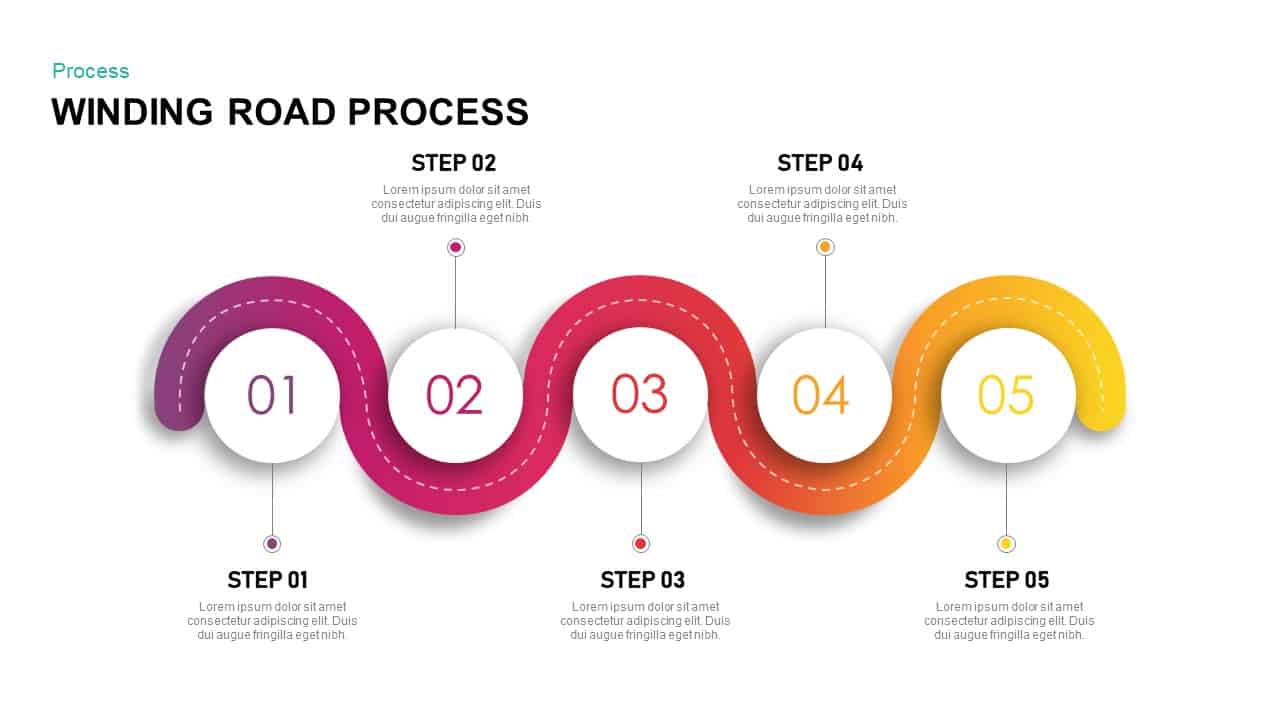
Dynamic Winding Road Process Timeline Template for PowerPoint & Google Slides
Process
Dynamic Online Education Illustration Template for PowerPoint & Google Slides
Business Proposal
Capital Structure Dynamic Split Chart Template for PowerPoint & Google Slides
Comparison Chart

Dynamic Marketing Radar Chart Analytics Template for PowerPoint & Google Slides
Comparison
Dynamic Gear Diagram Infographics Template for PowerPoint & Google Slides
Process
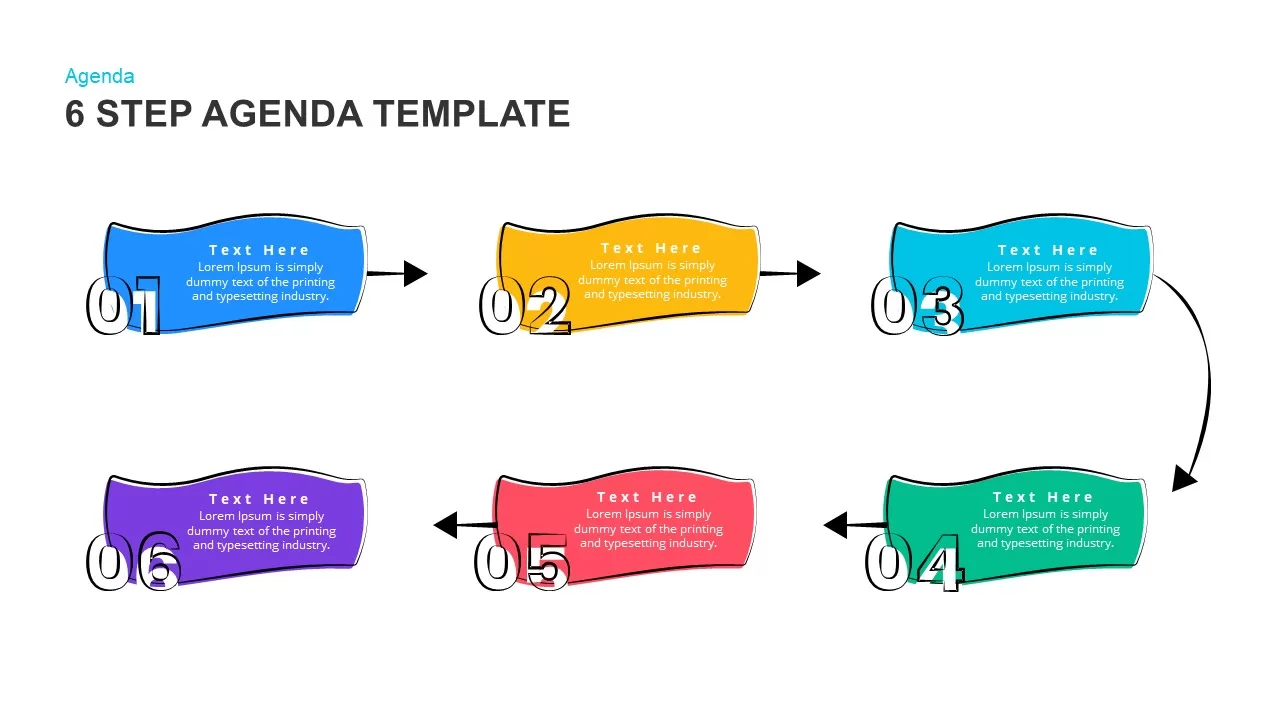
Modern & Dynamic 6-Step Agenda Sequence Template for PowerPoint & Google Slides
Agenda
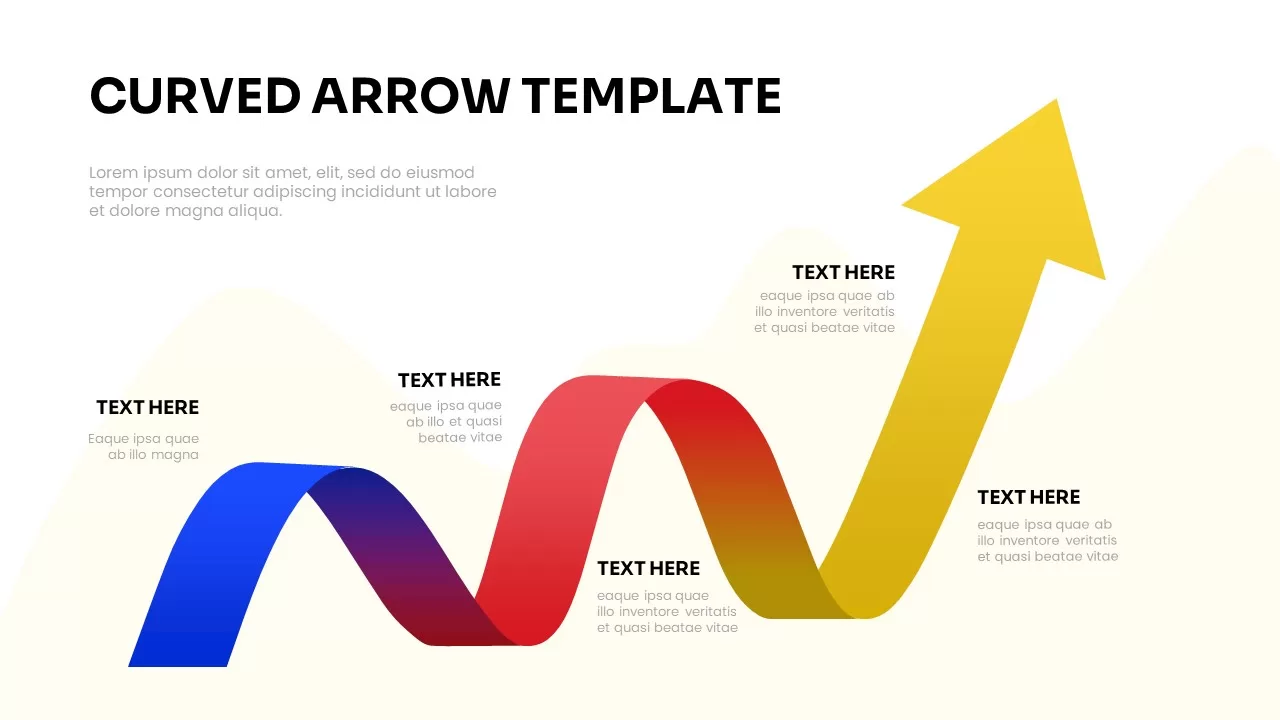
Dynamic Curved Arrow Process Roadmap Template for PowerPoint & Google Slides
Process
Dynamic Benchmarking Comparison Chart Template for PowerPoint & Google Slides
Comparison Chart
Dynamic Conveyor Belt Process Flow Template for PowerPoint & Google Slides
Process
Dynamic Statistics & Progress Charts Template for PowerPoint & Google Slides
Pie/Donut
Dynamic 3D Rubik’s Cube Diagram Pack Template for PowerPoint & Google Slides
Infographics
Dynamic Four-Step Gear Process Template for PowerPoint & Google Slides
Process
Dynamic Basketball Training Promotion Template for PowerPoint & Google Slides
Advertising
Dynamic Hurdle Race Presentation Template for PowerPoint & Google Slides
Advertising
Dynamic Sprint Race Cover Slide Template for PowerPoint & Google Slides
Graphics
Dynamic Soccer Stadium Presentation Template for PowerPoint & Google Slides
Graphics
Dynamic Cycling Presentation Template for PowerPoint & Google Slides
Graphics
Dynamic Boxing Training Cover Slide Template for PowerPoint & Google Slides
Graphics
Dynamic Relay Race Presentation Slide Template for PowerPoint & Google Slides
Graphics
Dynamic Animated Question Mark Template for PowerPoint & Google Slides
Graphics
Dynamic Three-Series Stacked Area Chart Template for PowerPoint & Google Slides
Comparison Chart
Dynamic Sunburst Chart Visualization Template for PowerPoint & Google Slides
Charts
Dynamic Abstract Corporate Theme Template for PowerPoint & Google Slides
Decks
Dynamic Investment & Finance Growth Template for PowerPoint & Google Slides
Finance
Dynamic Bar-of-Pie Chart Comparison Template for PowerPoint & Google Slides
Pie/Donut
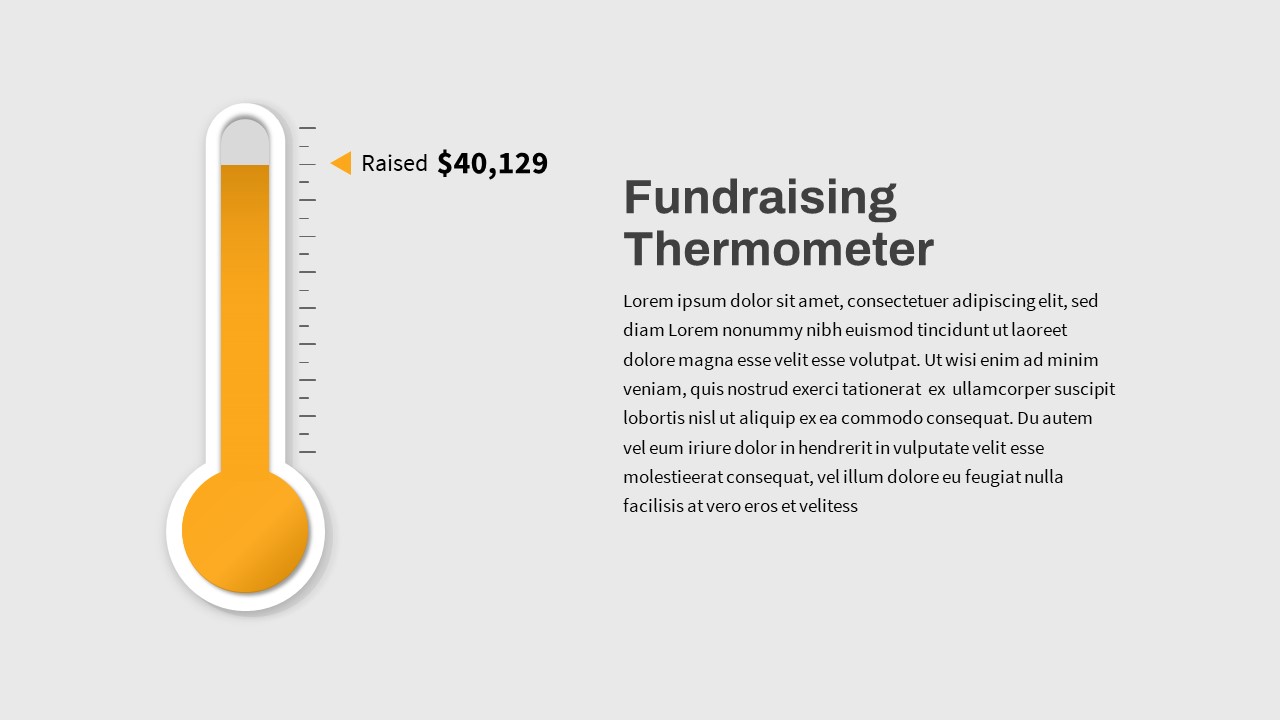
Dynamic Fundraising Thermometer Slide Template for PowerPoint & Google Slides
Revenue

Dynamic Green Field Sports Presentation Template for PowerPoint & Google Slides
Decks
Dynamic Financial Analysis Line Chart Template for PowerPoint & Google Slides
Finance
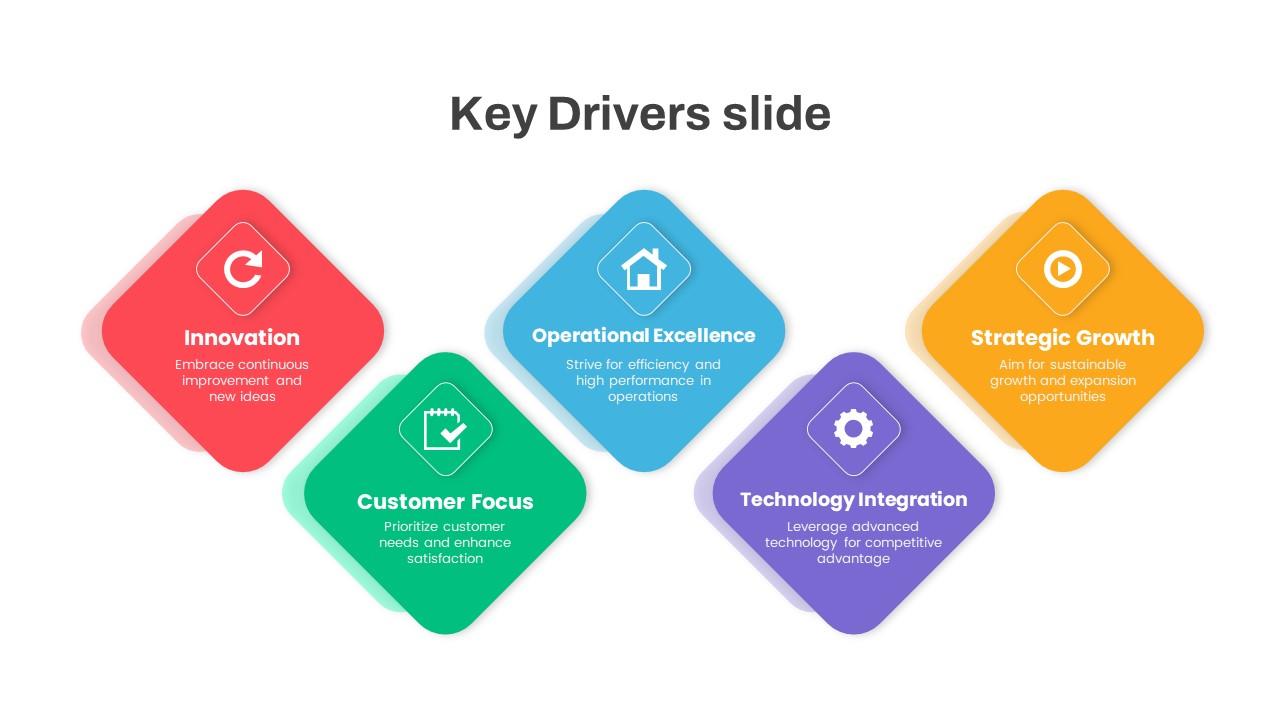
Dynamic Business Key Drivers Slide Template for PowerPoint & Google Slides
Process

Free Dynamic Global Warming Presentation Template for PowerPoint & Google Slides
Pitch Deck
Free
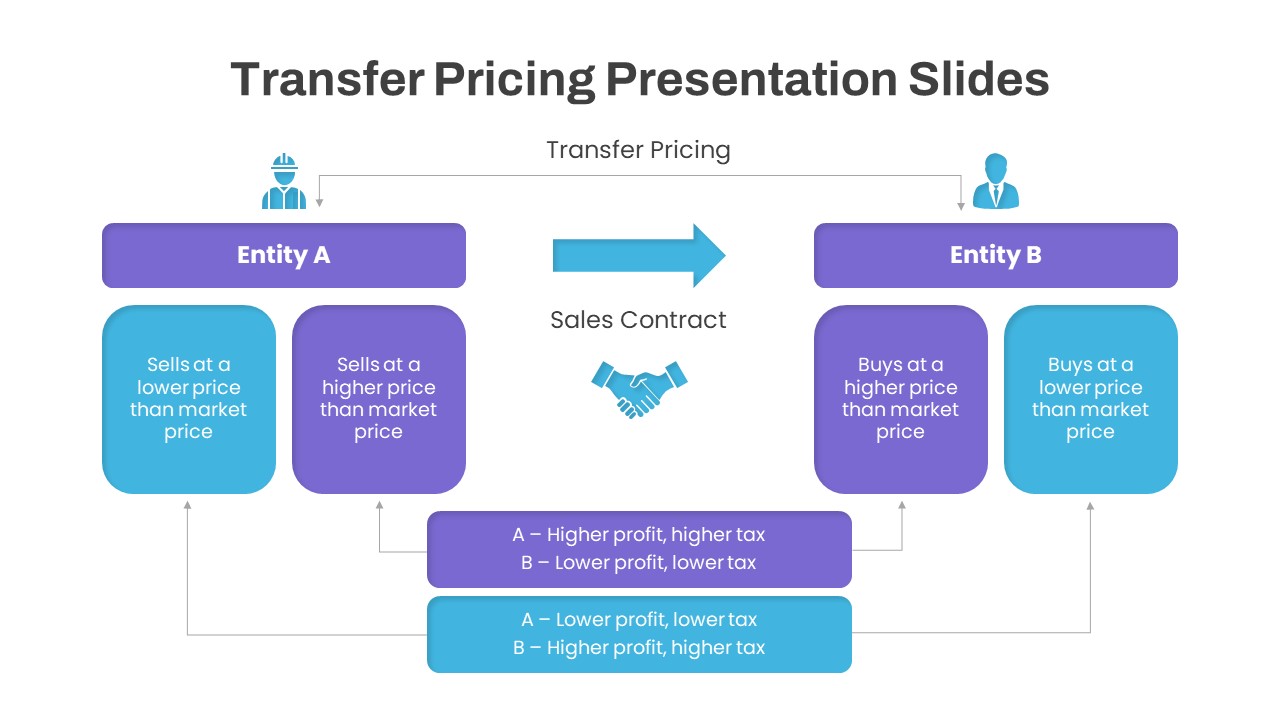
Dynamic Transfer Pricing Flow Diagram Template for PowerPoint & Google Slides
Finance
Dynamic Carousel Icon Hub Diagram Template for PowerPoint & Google Slides
Circular
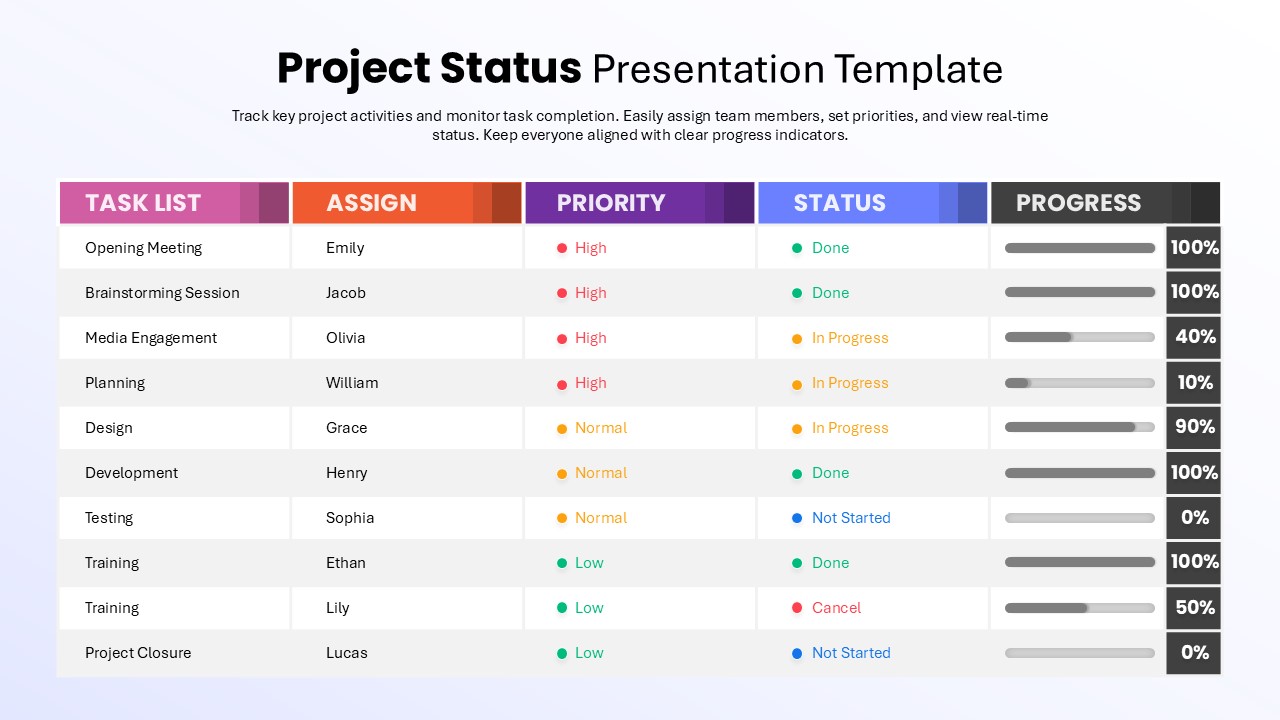
Dynamic Project Status Tracking Table Template for PowerPoint & Google Slides
Project Status
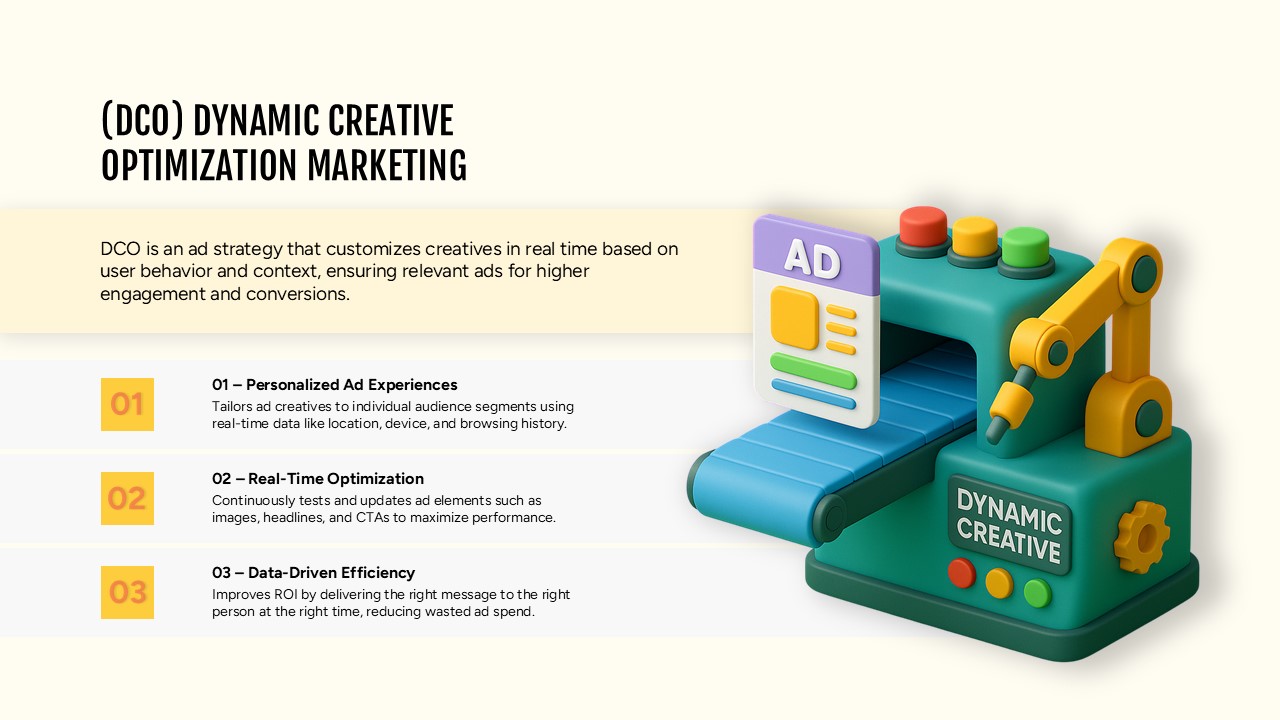
Dynamic Creative Optimization Marketing Template for PowerPoint & Google Slides
Digital Marketing
Dynamic Tennis Sports Theme Slide for PowerPoint & Google Slides
Graphics
Professional Nurse Infographic Dashboard Template for PowerPoint & Google Slides
Nursing
Free Metro UI Dashboard Infographic Template for PowerPoint & Google Slides
Business Report
Free
Mastodon Metrics Infographic Dashboard Template for PowerPoint & Google Slides
Business Report
Freight Logistics Dashboard Infographic Template for PowerPoint & Google Slides
Comparison Chart
Free Infographic Statistics Dashboard Slide for PowerPoint & Google Slides
Bar/Column
Free
3D Stacked Infographic Layers Data Template for PowerPoint & Google Slides
Pyramid
Creative Lab Beakers Data Infographic template for PowerPoint & Google Slides
Infographics
Bottle Data Percentage Infographic Template for PowerPoint & Google Slides
Infographics
Leaf Infographic Data Visualization Template for PowerPoint & Google Slides
Infographics
Data-driven GDP Growth Infographic Pack Template for PowerPoint & Google Slides
Infographics
Modern Big Data Infographic Deck Template for PowerPoint & Google Slides
Decks
Editable Africa Map Infographic Data Template for PowerPoint & Google Slides
World Maps
Syria Regional Data Map Infographic Template for PowerPoint & Google Slides
World Maps
Data-Driven AI in Insurance Infographic Template for PowerPoint & Google Slides
Circular
Mobile User Data Analysis Infographic for PowerPoint & Google Slides
Process
Free KPI Dashboard PowerPoint Template for PowerPoint & Google Slides
Charts
Free
Product Usage Analytics Dashboard Chart Template for PowerPoint & Google Slides
Bar/Column

Efficiency KPI Dashboard Metaphor Template for PowerPoint & Google Slides
Infographics
Business Dashboard Analytics & KPIs Template for PowerPoint & Google Slides
Bar/Column
Project Management Dashboard Template for PowerPoint & Google Slides
Project
Sales Growth Dashboard: KPI Gauge & Line Template for PowerPoint & Google Slides
Revenue
Social Media Performance Dashboard Template for PowerPoint & Google Slides
Bar/Column
KPI Dashboard template for PowerPoint & Google Slides
Business Report
KPI Dashboard Overview template for PowerPoint & Google Slides
Finance
Interactive Benchmarking Gauge Dashboard Template for PowerPoint & Google Slides
Pie/Donut
Weekly Update Schedule Dashboard Template for PowerPoint & Google Slides
Agenda
Project Status Dashboard Template for PowerPoint & Google Slides
Project Status
Weekly Status Report Dashboard Template for PowerPoint & Google Slides
HR
Website Performance Monitoring Dashboard Template for PowerPoint & Google Slides
Business Report
One Pager Annual Report Dashboard Template for PowerPoint & Google Slides
Business Report
Soccer Match Stats Dashboard Slide Template for PowerPoint & Google Slides
Graphics
Employee Satisfaction Survey Dashboard Template for PowerPoint & Google Slides
Employee Performance
Customer Satisfaction KPI Dashboard Template for PowerPoint & Google Slides
Customer Experience
Weekly Project Status Dashboard Template for PowerPoint & Google Slides
Project Status
Free Quarterly Business Review Dashboard Template for PowerPoint & Google Slides
Business
Free
Cost Cutting Savings Dashboard Template for PowerPoint & Google Slides
Pie/Donut
Macroeconomic Indicators Dashboard Template for PowerPoint & Google Slides
PEST
Banking Financial Overview Dashboard Template for PowerPoint & Google Slides
Finance
Digital Marketing KPIs Dashboard Dark Template for PowerPoint & Google Slides
Business Report
Turnover Analysis Dashboard Template for PowerPoint & Google Slides
Employee Performance
Project Status Update Dashboard Table Template for PowerPoint & Google Slides
Project Status
Cohort Analysis Retention Dashboard Template for PowerPoint & Google Slides
Comparison Chart
Project Status Dashboard Template for PowerPoint & Google Slides
Project Status
End of Year Review Dashboard Template for PowerPoint & Google Slides
Business Report
Construction Project Dashboard Template for PowerPoint & Google Slides
Project