Free Quarterly Business Review PowerPoint Template & Google Slides


Download Free QBR Presentation Template
Business leaders, corporate managers, and consultants constantly need reliable business performance review slides to present performance data. To meet this demand, we have designed a free quarterly business review PowerPoint template engineered to convey critical metrics in a highly professional, engaging tone.
What is a QBR Template
A QBR Template (Quarterly Business Review) is a structured presentation document used by organizations to evaluate key aspects of a company’s performance every three months. Every quarter, management teams, stakeholders, and clients gather to sit around the data and review historical milestones.
A comprehensive quarterly presentation template covers high-level metrics, including financial metrics, team accomplishments, and critical KPIs. It provides an immediate, transparent glimpse of organizational progress and challenges during the quarter. In corporate settings, these business review presentation slides facilitate vital strategic discussions between account management teams and clients, reinforcing the ongoing health and success of your corporate partnerships.
What You’ll Find in this Quarterly Business Review PowerPoint Template
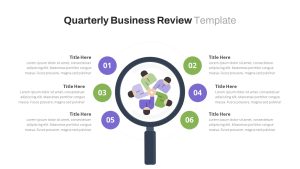
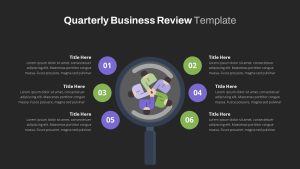
- Slide 1: Six-Point Executive Summary Overview – Features a modern magnifier layout design in the center with six numbered circles (01–06) arranged in an engaging hub-and-spoke pattern. This slide serves as your high-level executive summary. It allows presenters to clearly map out the meeting agenda or outline the six core pillars, business reports, or operational goals being analyzed during the review session.
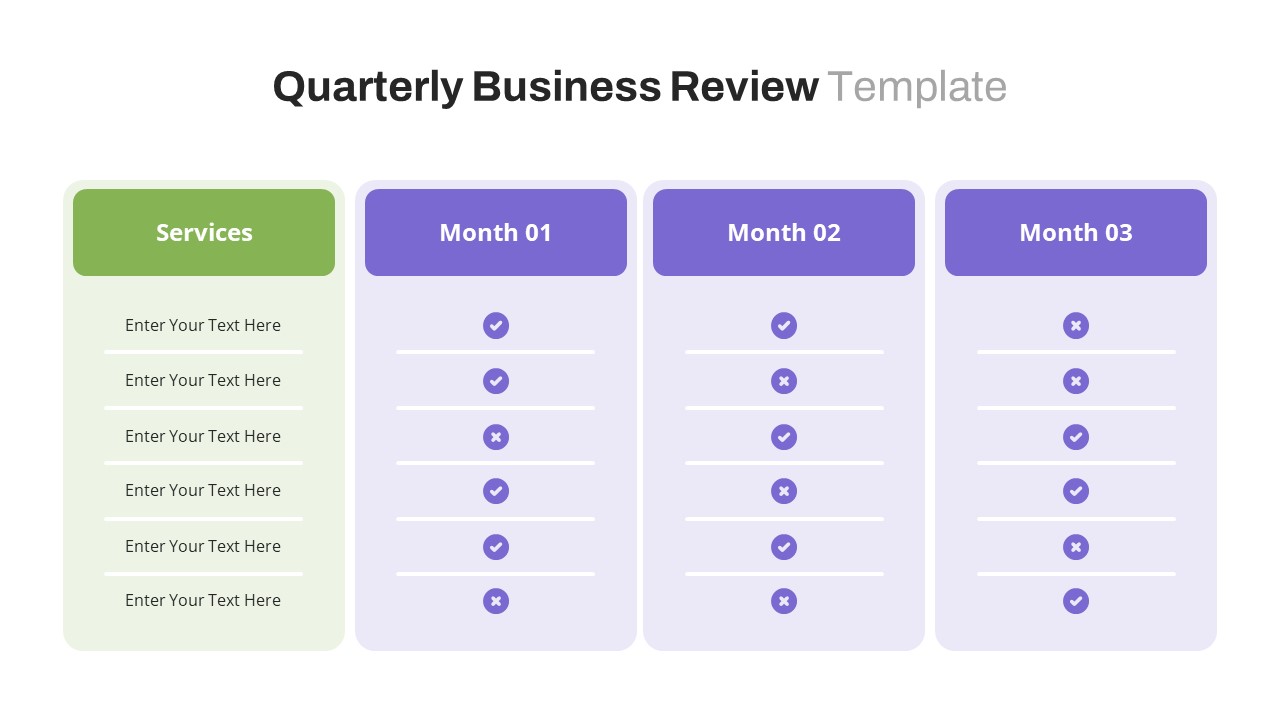
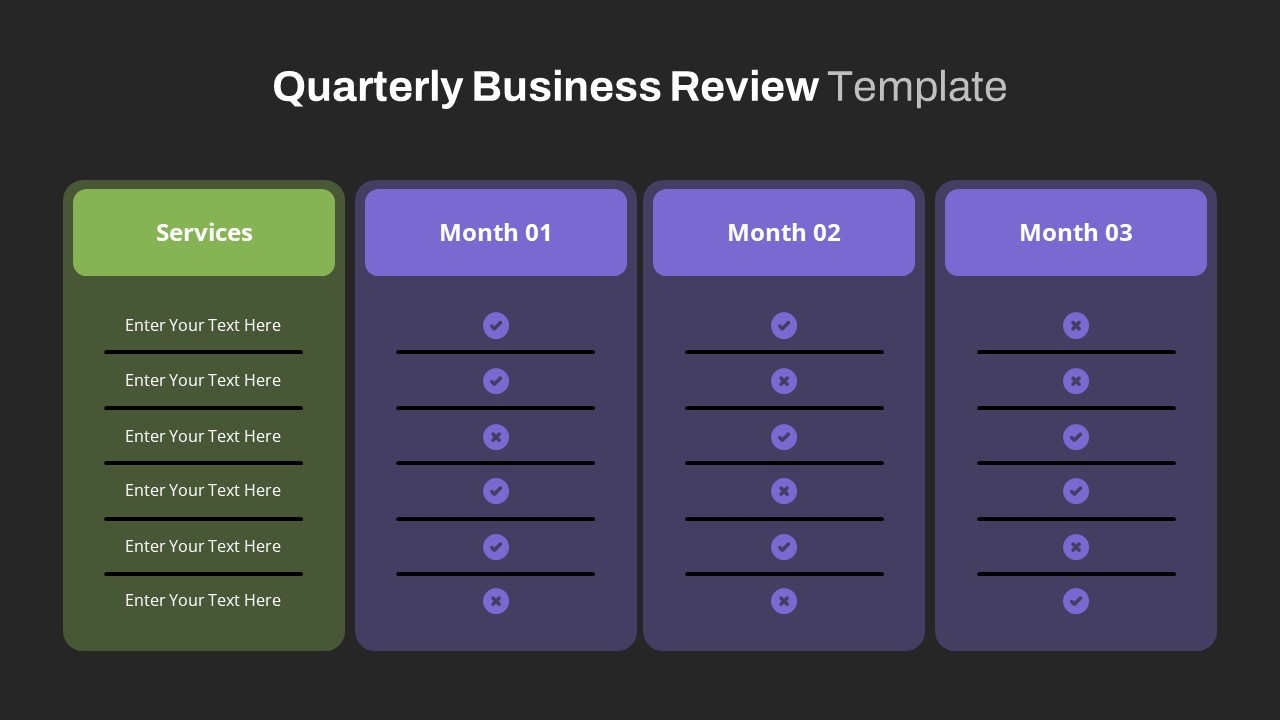
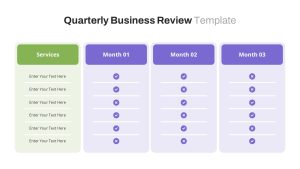
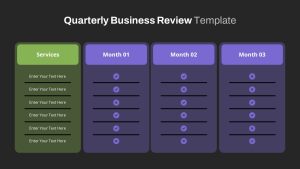
- Slide 2: Service Delivery Tracker & Performance Table – A clean, four-column performance analysis table matrix layout. The first column details your specific core deliverables or client services, while the next three columns segment tracking by Month 01, Month 02, and Month 03 of the quarter. Completed with visual checkmark (completed) or cross (not done) status icons per row, this table design allows operations leads to display metric consistencies at a glance, highlighting exact calendar trends where services succeeded or lagged.
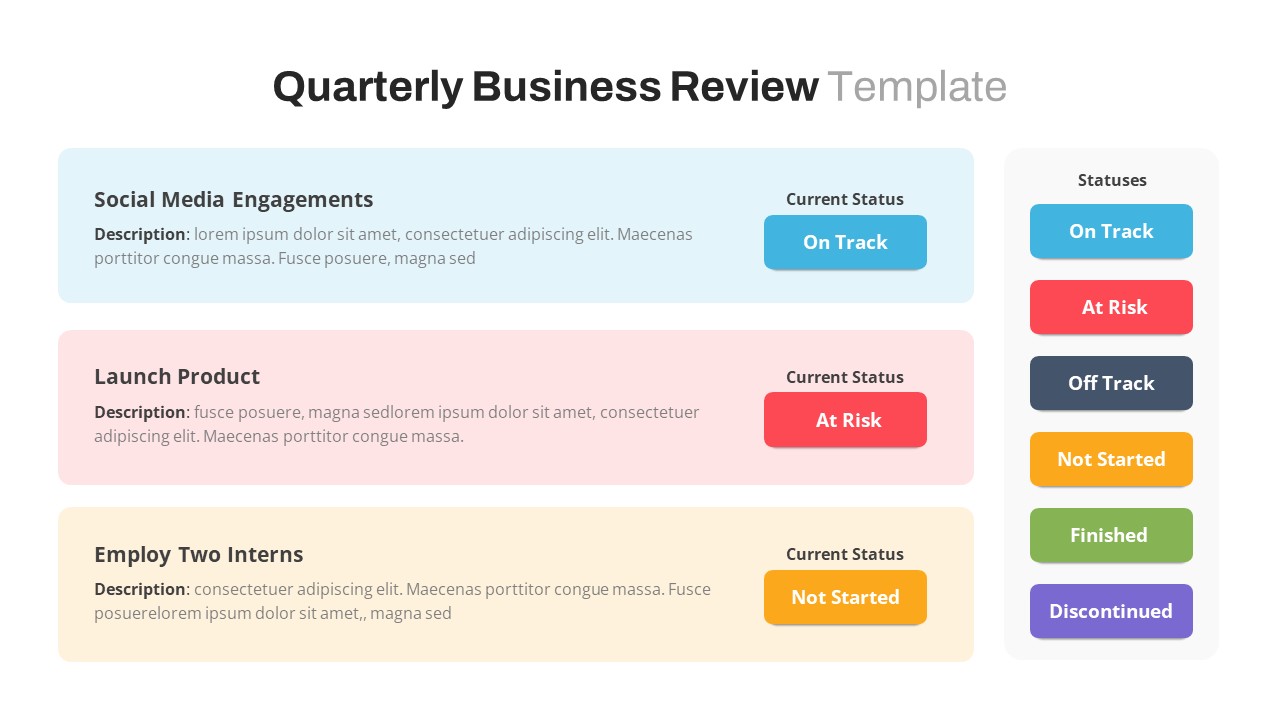
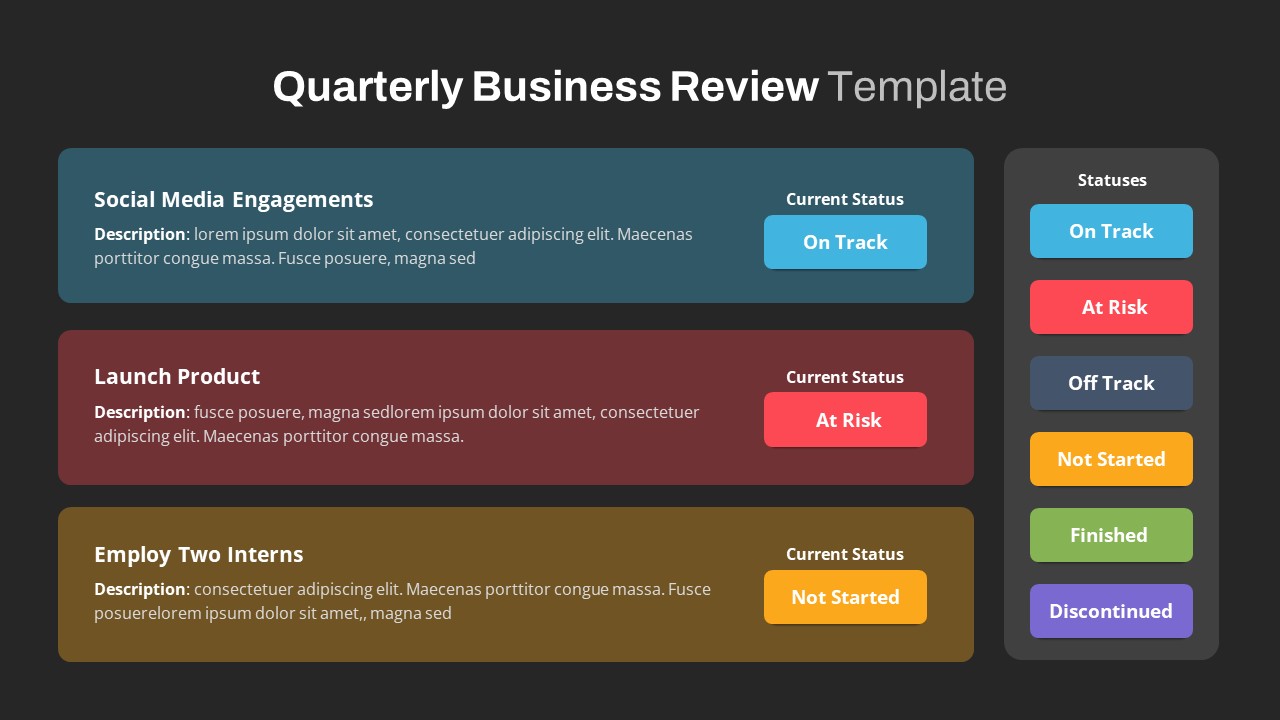
- Slide 3: Project Initiative Status Board – Three horizontal project initiative timeline cards stacked vertically, complete with clear text placeholders for descriptions and a comprehensive color-coded tracking key. While most basic status layouts only offer three standard alerts, this slide utilizes an advanced 6-state tracking system: On Track, At Risk, Off Track, Not Started, Finished, and Discontinued. This allows project managers to report the precise status of complex marketing trends, digital models, and active campaigns without needing to verbally justify edge cases.
Why waste internal design resources building executive slides from scratch? Click below to download our free QBR template and foster a serious, productive discussion at your next stakeholder evaluation meeting.
Login to download this file

Item ID
SB03914
Related Templates

Quarterly Business Review Dashboard Template for PowerPoint & Google Slides
Pitch Deck
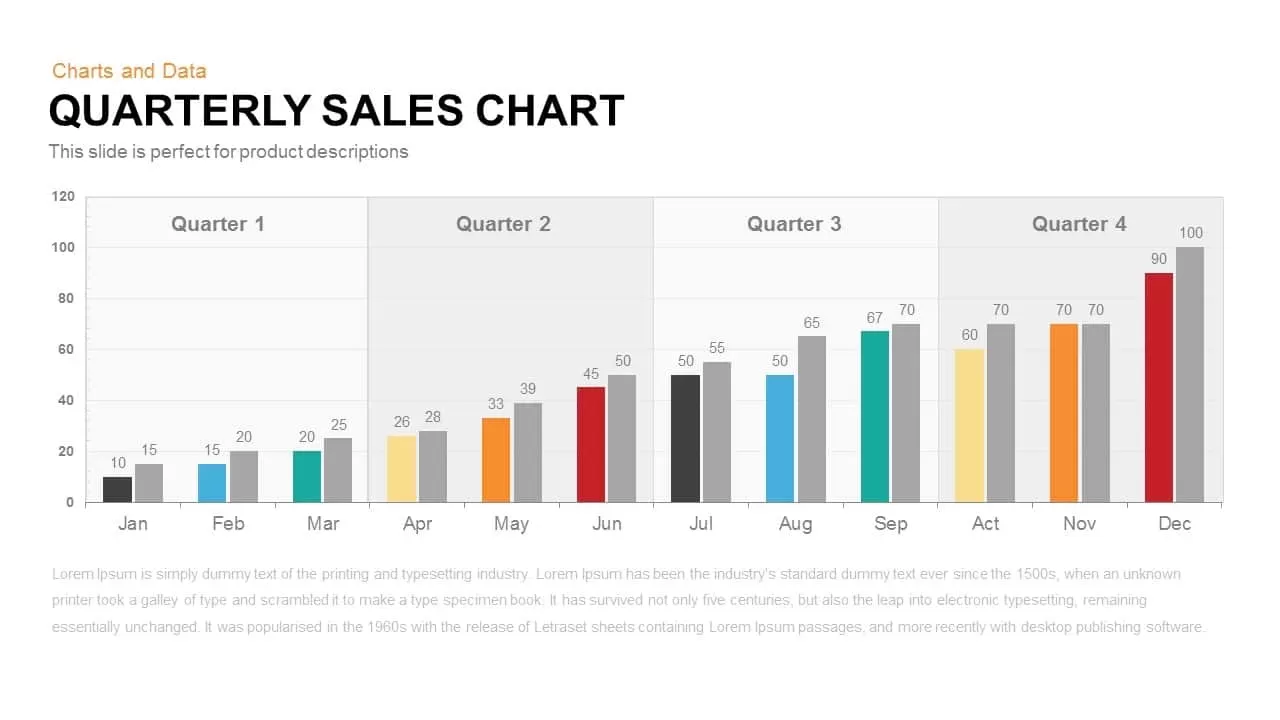
Quarterly Sales Review Bar Chart Template for PowerPoint & Google Slides
Bar/Column
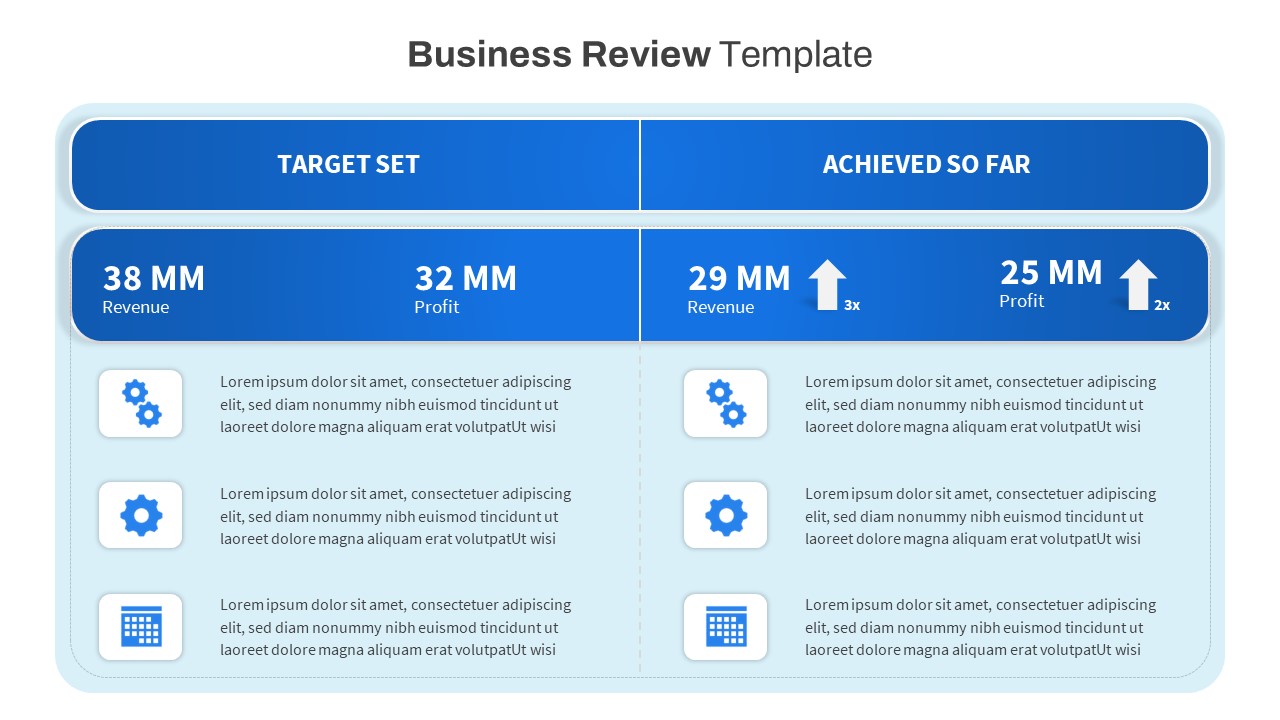
Free Business Review PowerPoint Template
Business Report
Free
Business Review Deck with Market Updates Template for PowerPoint & Google Slides
Company Profile
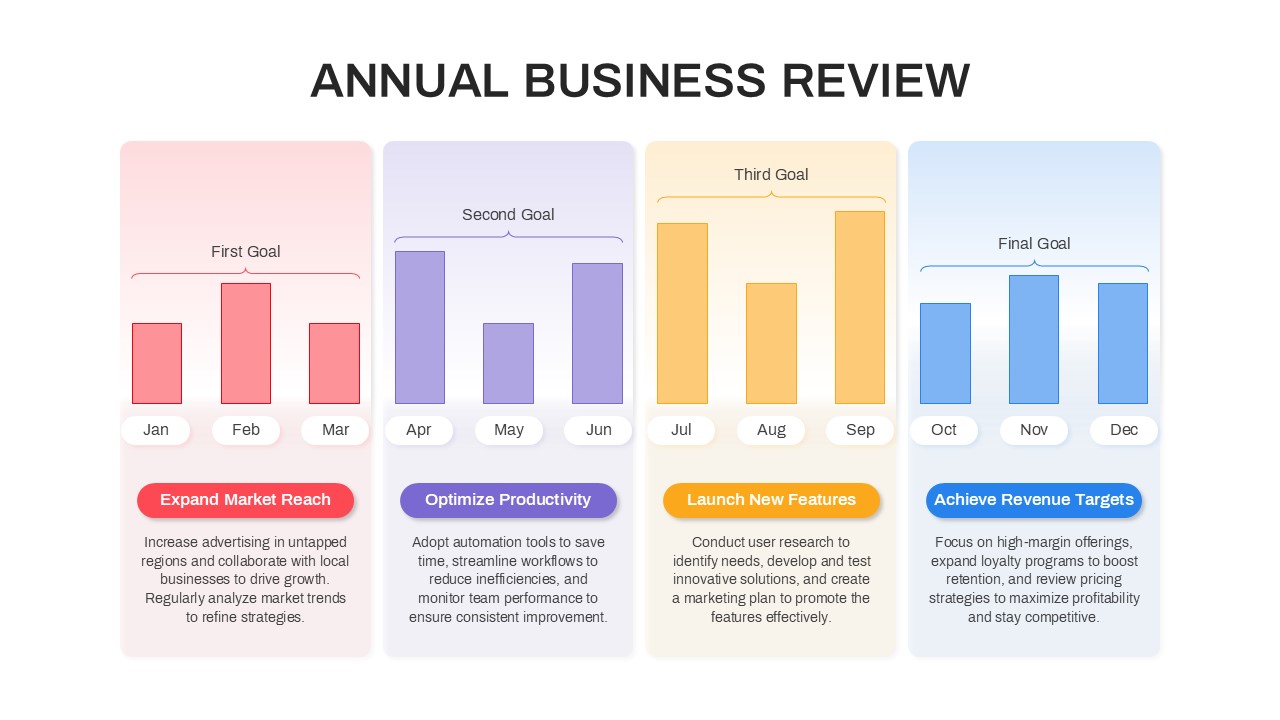
Annual Business Review Timeline Template for PowerPoint & Google Slides
Timeline
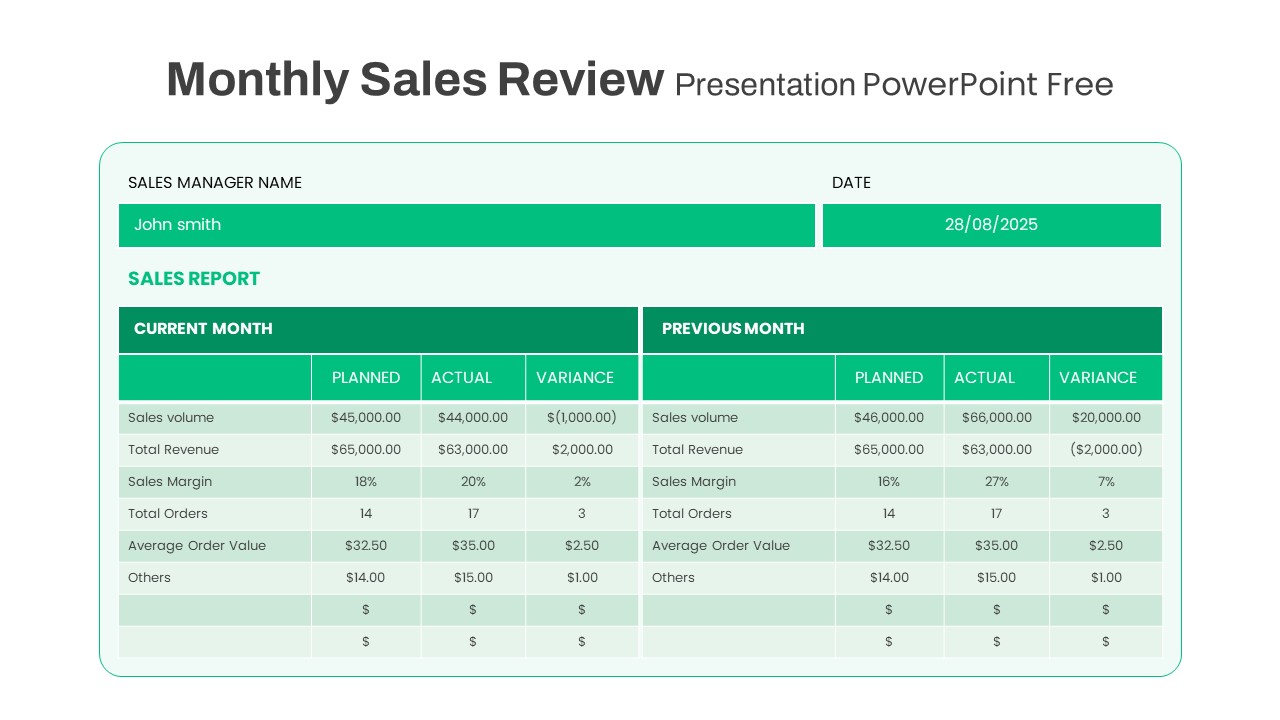
Free Monthly Sales Review template for PowerPoint & Google Slides
Business Report
Free
Quarterly Sales template for PowerPoint & Google Slides
Bar/Column
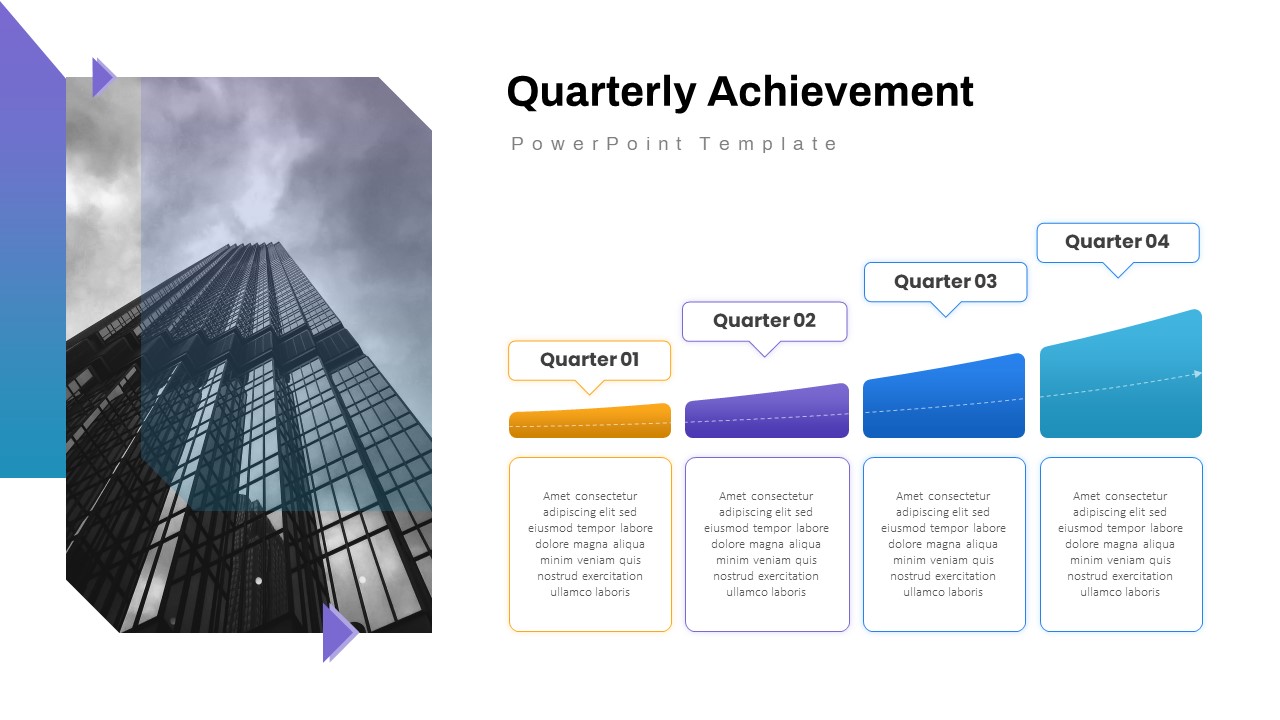
Quarterly Achievement Progress Template for PowerPoint & Google Slides
Accomplishment
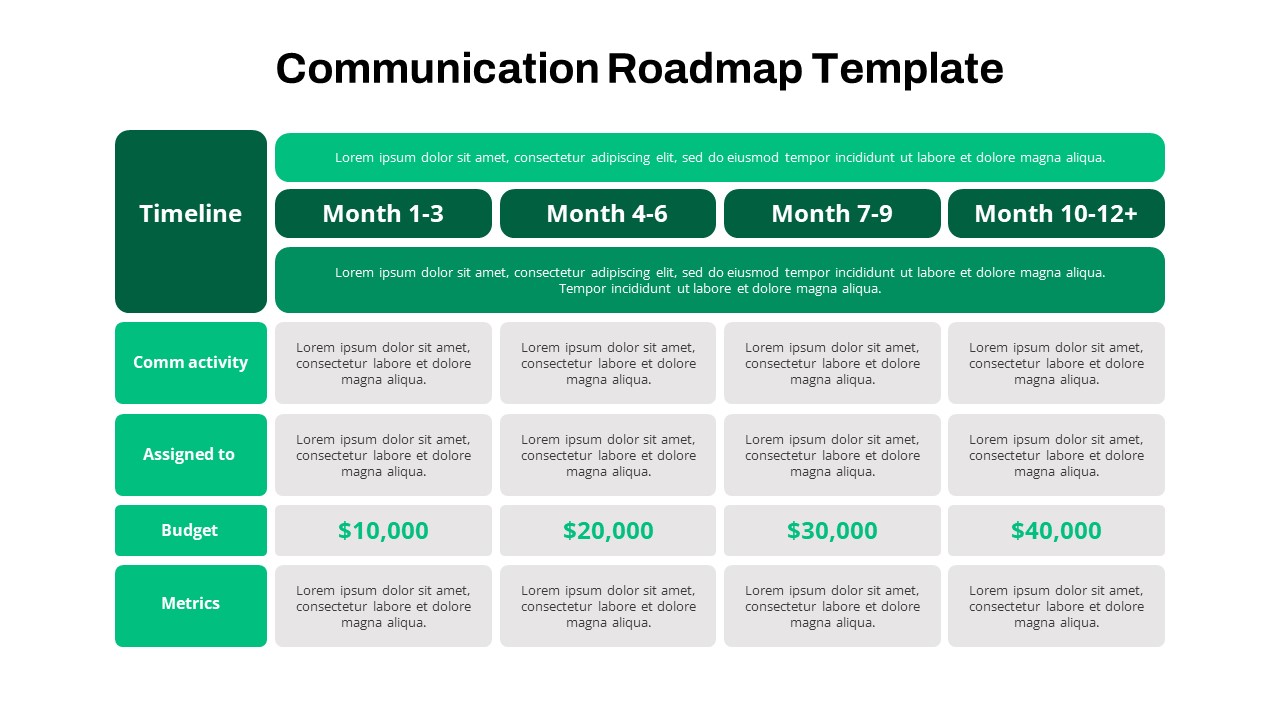
Quarterly Communication Roadmap Grid Template for PowerPoint & Google Slides
Marketing
Quarterly Credit Loss Provisions Chart Template for PowerPoint & Google Slides
Bar/Column
Quarterly Financial Summary Dashboard Template for PowerPoint & Google Slides
Business Report
Quarterly Gross Profit Rate Chart Template for PowerPoint & Google Slides
Revenue
Quarterly Network Volume Analysis Template for PowerPoint & Google Slides
Business Report

Quarterly Net Interest Income Growth Template for PowerPoint & Google Slides
Bar/Column
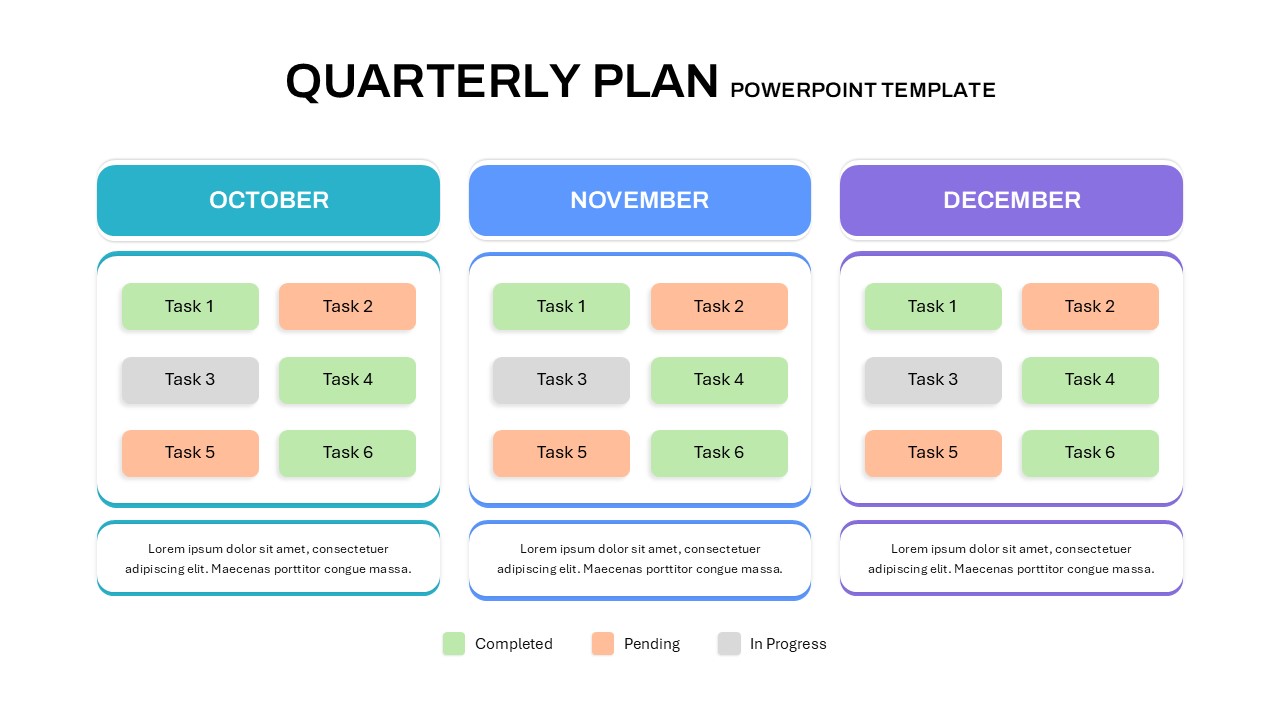
Quarterly Plan Template for PowerPoint & Google Slides
Project Status

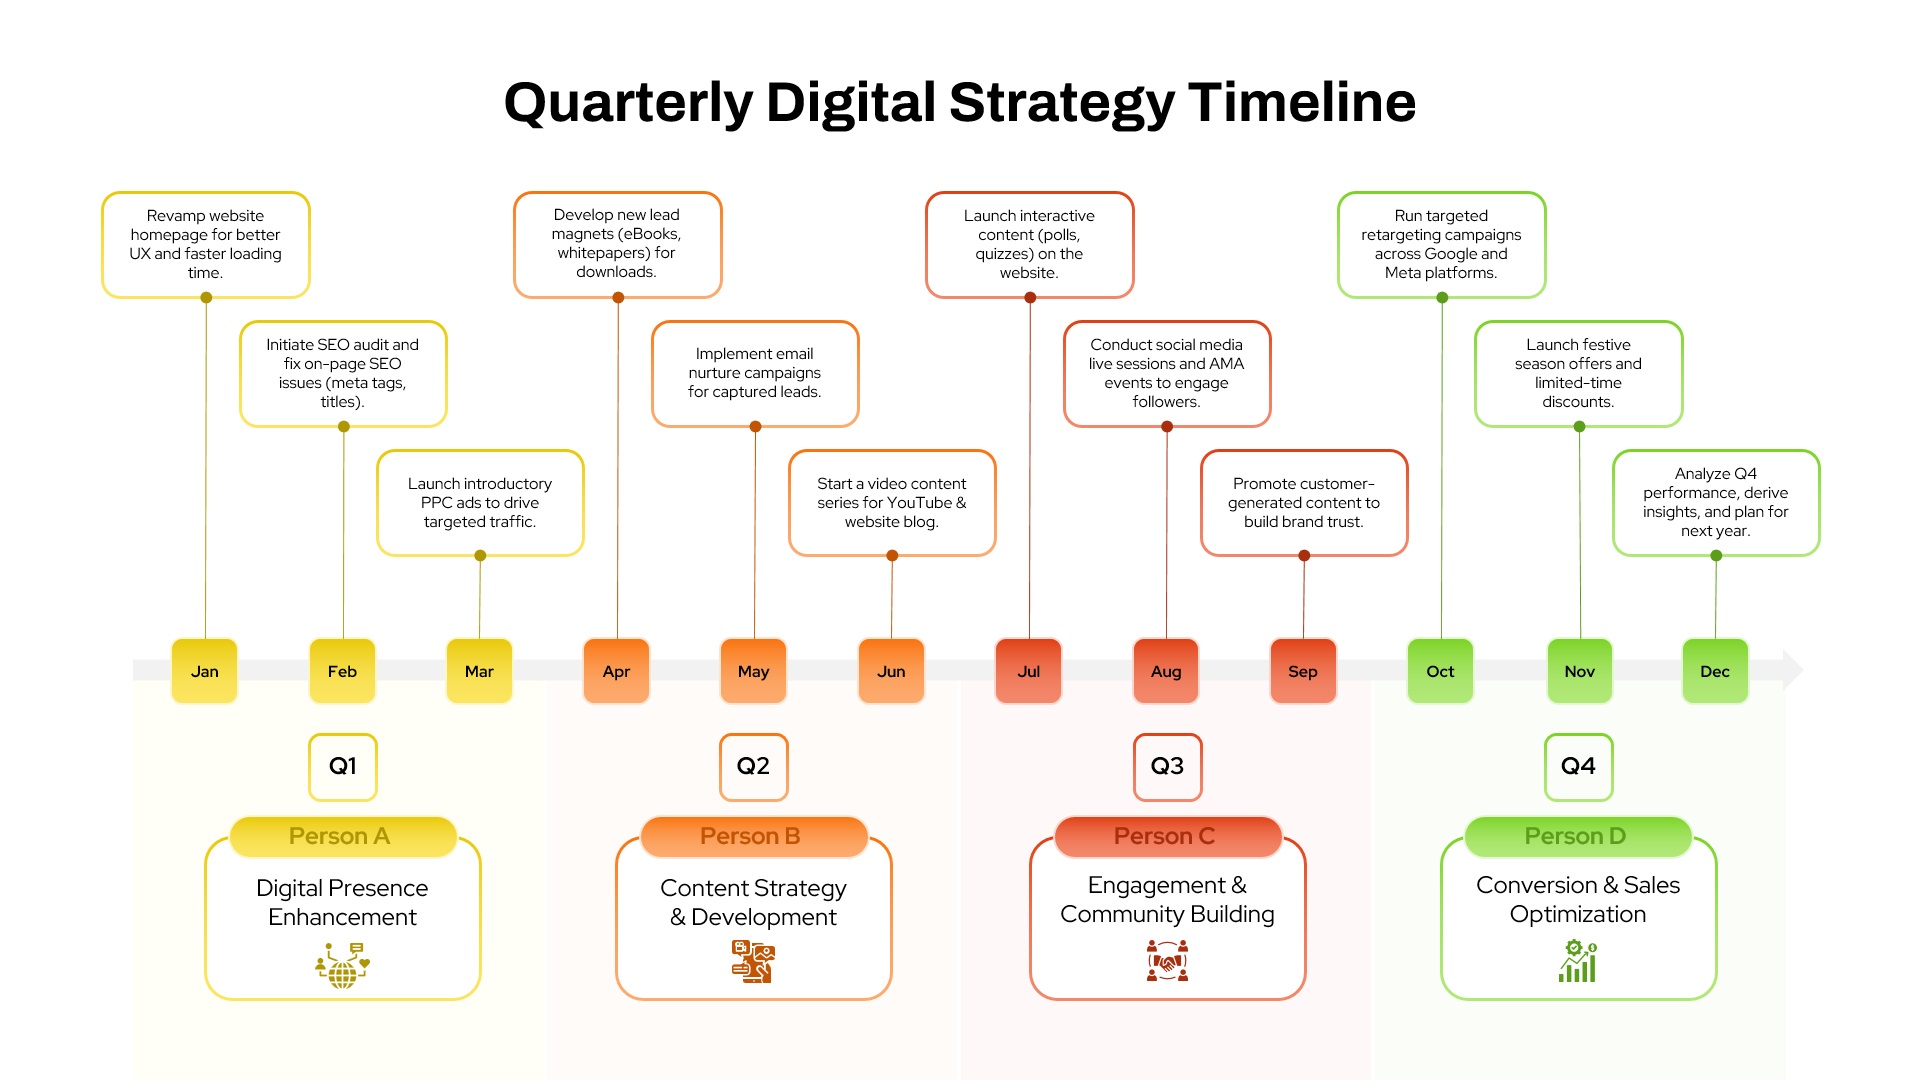
Quarterly Digital Strategy Timeline template for PowerPoint & Google Slides
Digital Marketing
Quarterly Gantt Chart with Today Marker Template for PowerPoint & Google Slides
Gantt Chart
Quarterly Comparison Pie Chart Template for PowerPoint & Google Slides
Pie/Donut
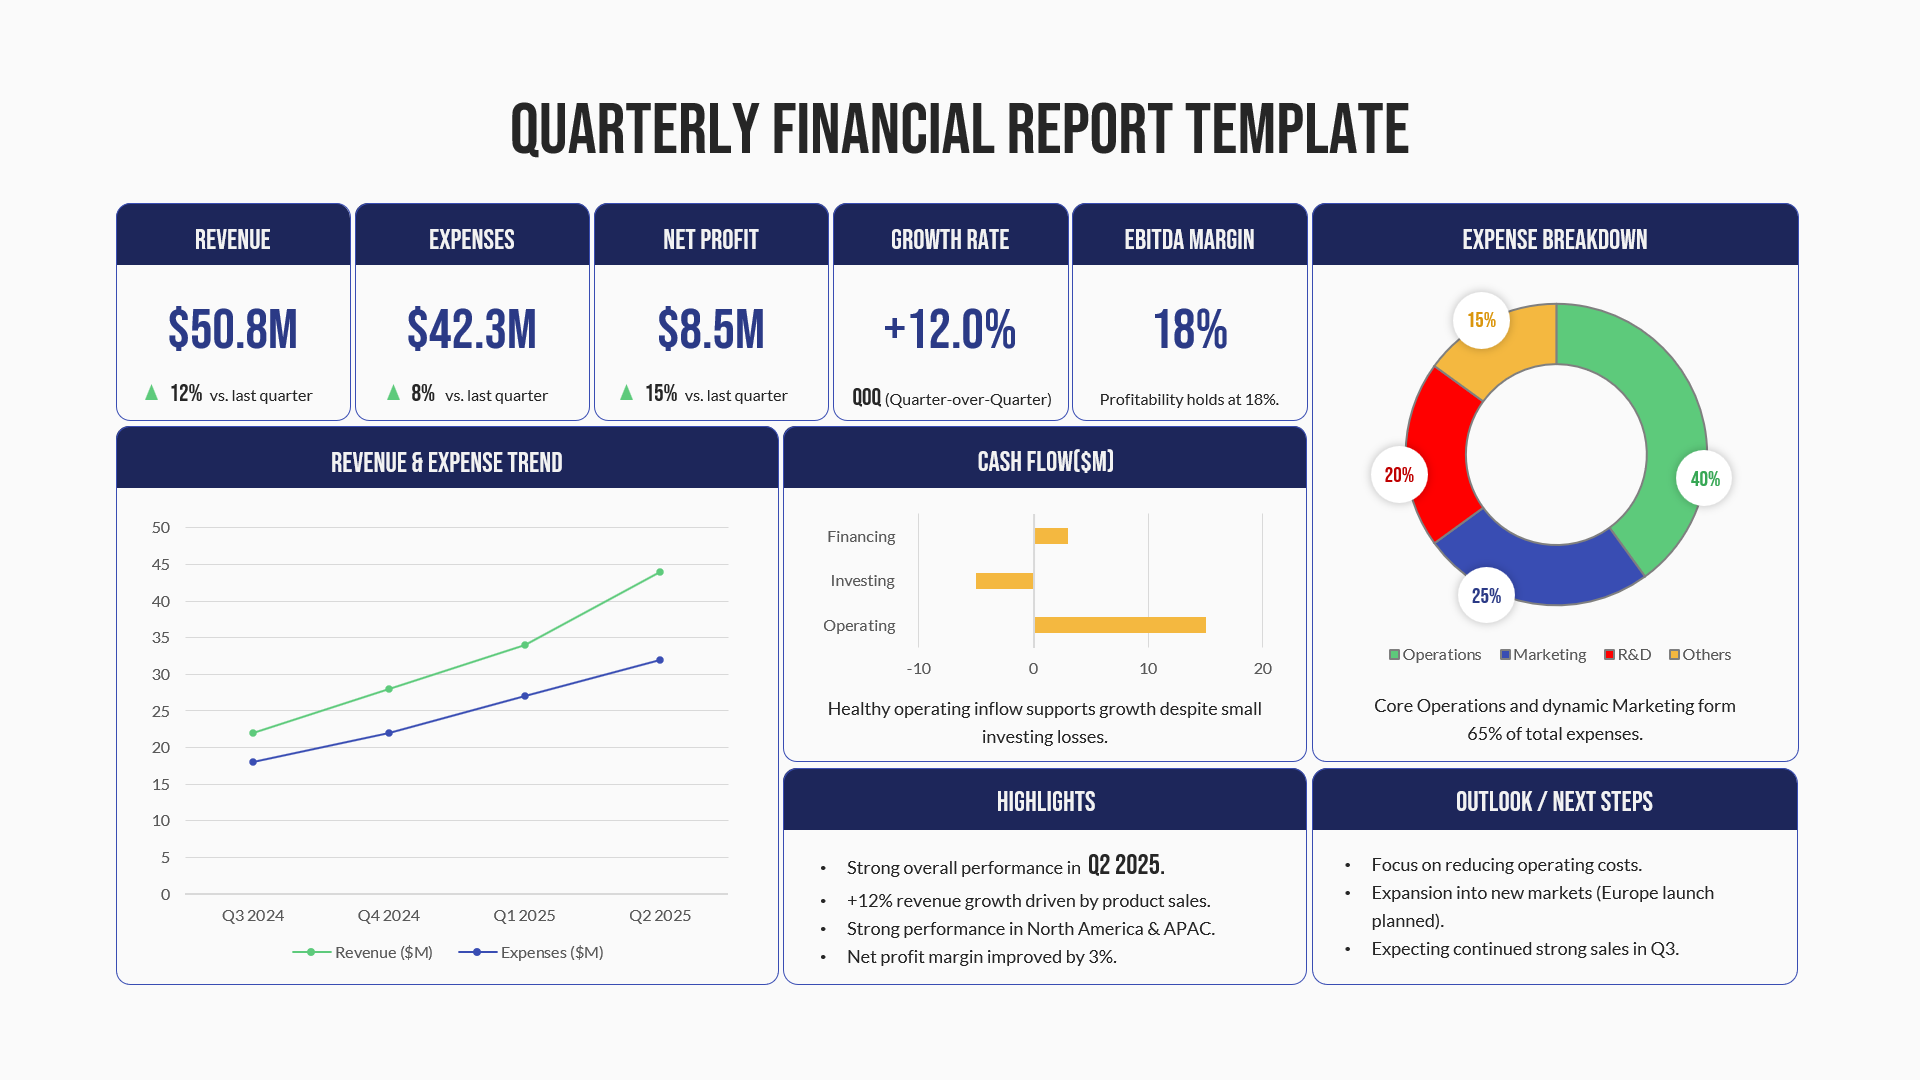
Quarterly Financial Report Dashboard Template for PowerPoint & Google Slides
Finance
Monthly Business Review PowerPoint Template
Business Report