3D Pyramid Column Chart Infographic Template for PowerPoint & Google Slides


Description
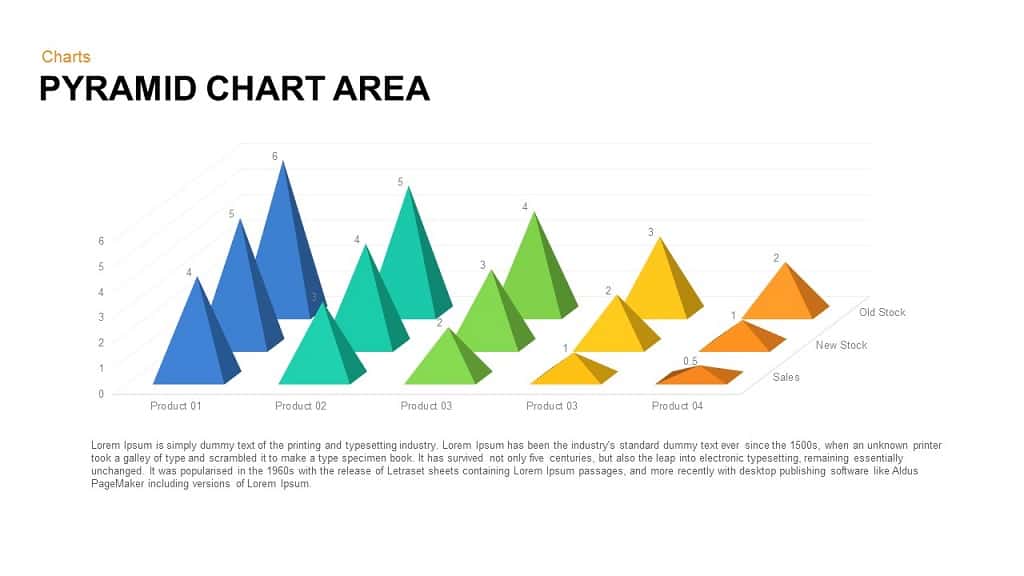
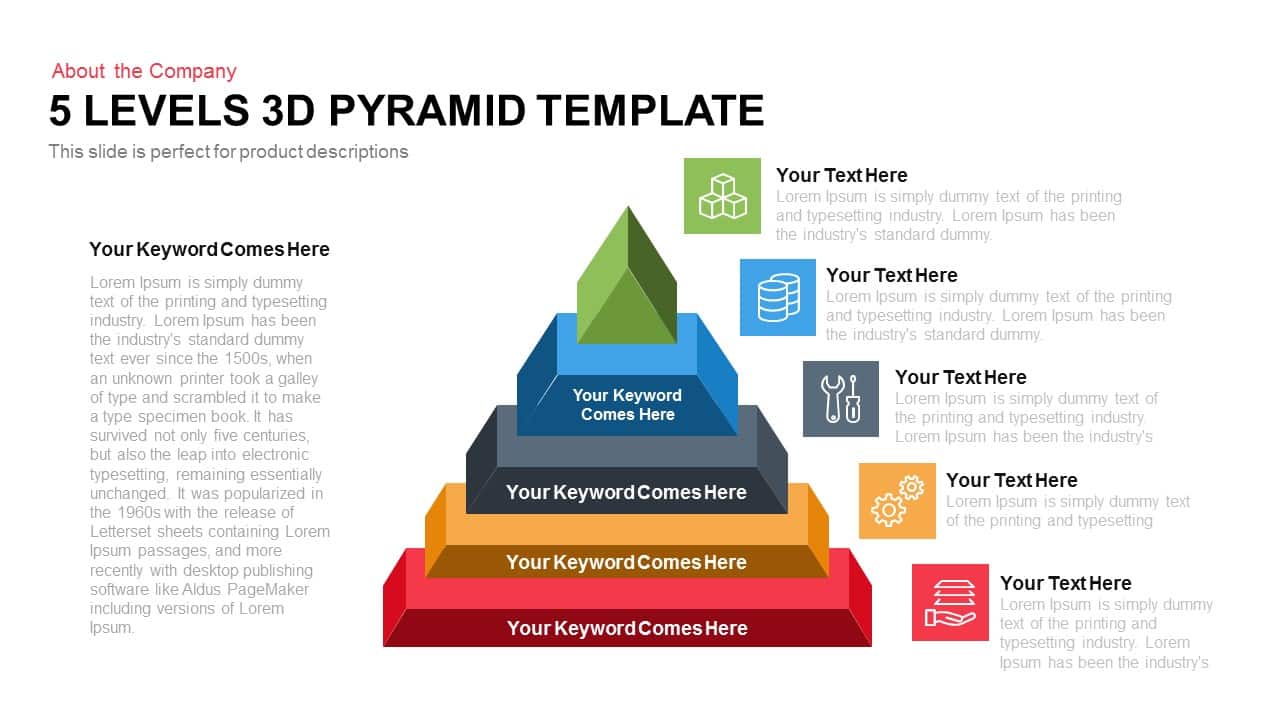
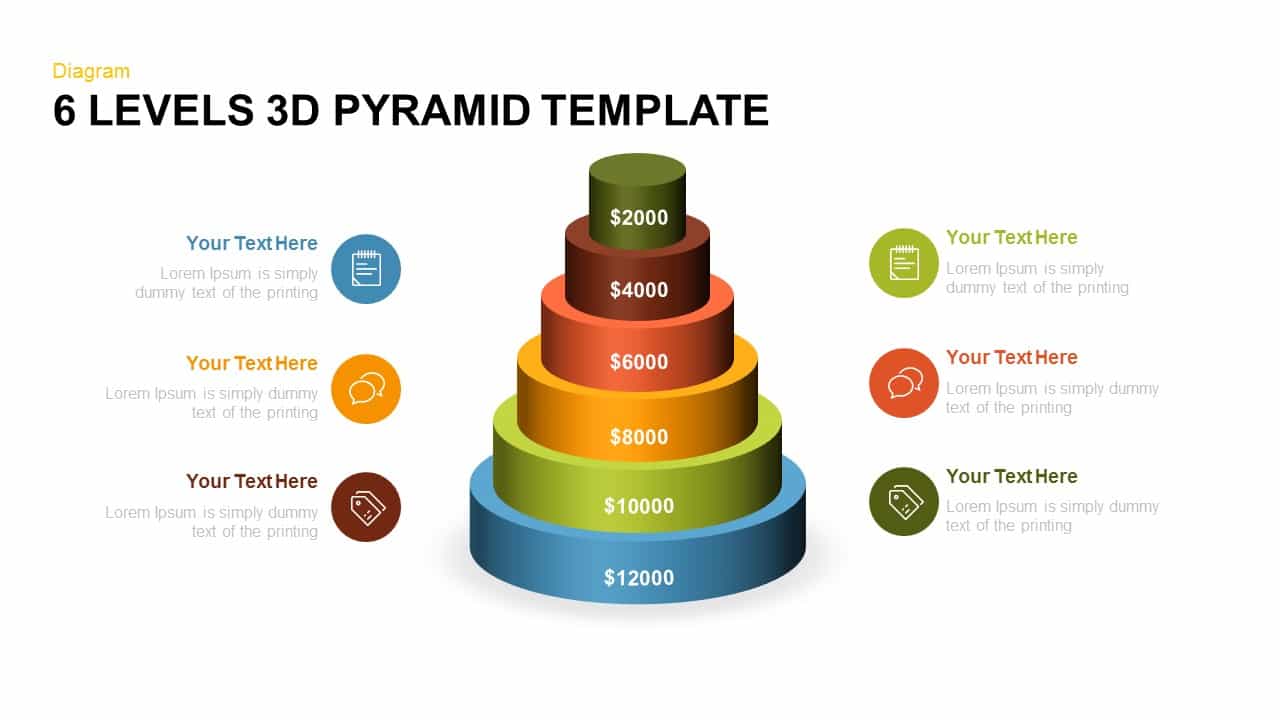
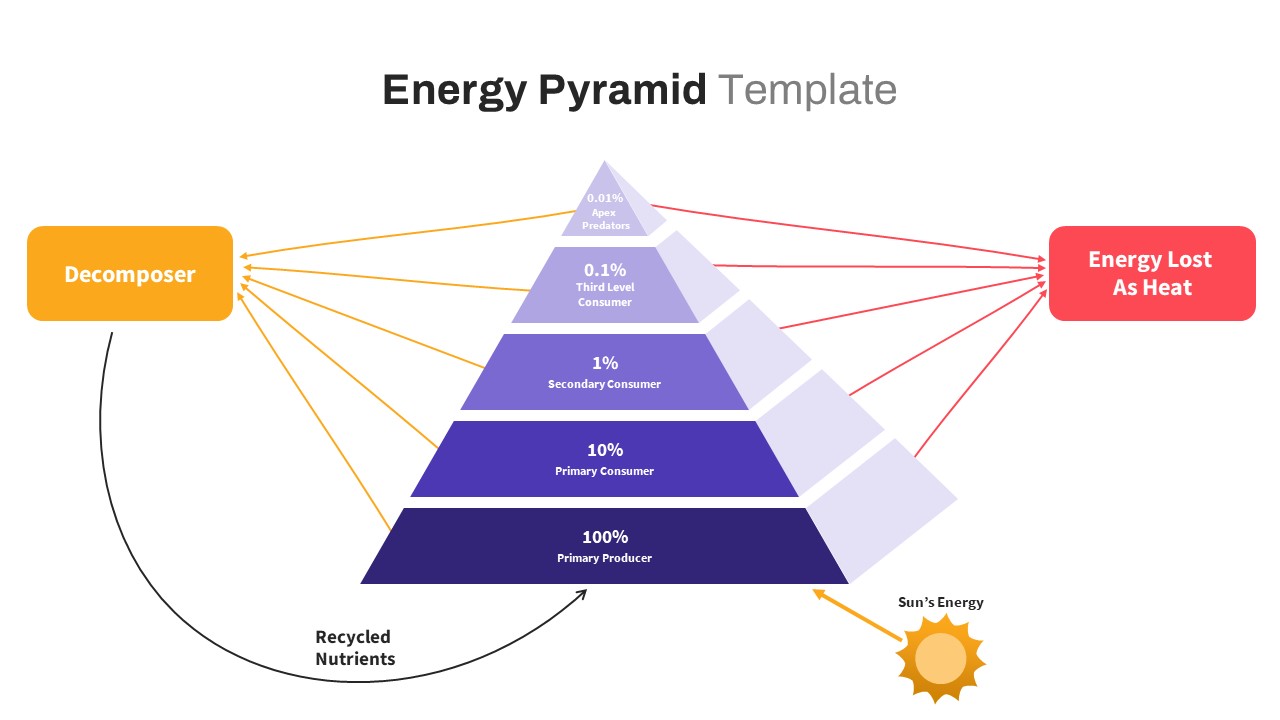
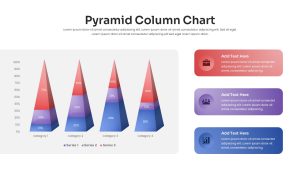
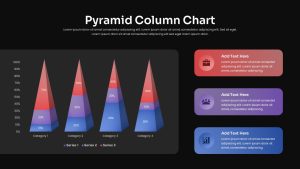
Integrate this 3D pyramid column chart slide to visualize layered data distributions across four categorical segments with striking dimensional effects and contextual callouts. The main chart area showcases four isometric pyramid columns—each segmented into three gradient-filled tiers of blue (Series 1), purple (Series 2), and red (Series 3)—with percentage overlays clearly indicating values such as 10 percent, 20 percent, and 70 percent. A vertical axis with graduated tick marks and category labels grounds the chart on a subtle gray rounded-corner panel, ensuring legibility and focus on comparative proportions. Complementing the chart, three rounded-gradient callout panels on the right invite you to elaborate on key insights, metrics, or action points; each panel holds an icon placeholder and editable text area for concise messaging.
Built on master slide layouts for PowerPoint and Google Slides, this template delivers centralized control over fonts, gradient stops, and color themes, enabling bulk updates to match any corporate branding or presentation style. All elements are created as editable vector shapes—pyramids, connectors, and callout panels—for lossless scaling and precise repositioning. Grouped objects streamline the addition of entrance animations, such as sequential column fades, segment highlights, and sliding callouts, so you can guide audiences through data narratives with ease. The slide also supports duplication or deletion of callout panels to accommodate additional or fewer insights without manual realignment.
Engineered for optimal performance on high-resolution displays and print media, this asset maintains crisp lines and vibrant hues across devices. Detailed slide notes walk you through customizing percentage values, swapping icons, and adjusting panel opacity. Whether you’re reporting sales breakdowns, market-share analyses, or campaign results, this 3D pyramid column chart accelerates deck development and ensures visual coherence from start to finish.
Use this infographic to compare quarterly revenue tiers, segment customer demographics, or illustrate resource allocations in board meetings and sales kickoffs. The versatile design also adapts to product feature comparisons, departmental performance dashboards, or educational metrics, making it a multi-purpose asset for marketing, finance, or academic presentations. By eliminating manual chart creation and version-control headaches, this pyramid column template empowers presenters to focus on storytelling and strategic insights.
Who is it for
Financial analysts, marketing managers, and business consultants will leverage this slide to present sales breakdowns, market-share comparisons, and KPI progress reports in boardroom briefings and client pitches.
Other Uses
Repurpose this layout for performance dashboards, customer segmentation analyses, or product feature breakdowns by relabeling tiers, swapping callout icons, and adjusting gradient hues to suit any professional or educational context.
Login to download this file

Item ID
SB05389
Related Templates

Free Stacked Column Chart Data Visualization Template for PowerPoint & Google Slides
Bar/Column
Free
Free Editable Simple Column Chart Slide Template for PowerPoint & Google Slides
Bar/Column
Free
Minimal Multi-Year Column Chart Template for PowerPoint & Google Slides
Bar/Column
Waterfall Column Chart Analysis Template for PowerPoint & Google Slides
Bar/Column
Professional Clustered Column Chart Template for PowerPoint & Google Slides
Bar/Column
Professional 100% Stacked Column Chart Template for PowerPoint & Google Slides
Bar/Column
Grouped Column Chart Comparison Template for PowerPoint & Google Slides
Bar/Column

3D Column Chart with Data Table for PowerPoint & Google Slides
Bar/Column
Two-Column Comparison Infographic Slide Template for PowerPoint & Google Slides
Comparison
1 to 5 Column infographic pack for PowerPoint & Google Slides
Business

Clustered Column Chart Data Analysis Template for PowerPoint
Bar/Column

Pyramid Chart Area template for PowerPoint & Google Slides
Pyramid
Population Pyramid Chart Analysis Template for PowerPoint & Google Slides
Bar/Column
Population Age Distribution Pyramid Chart Template for PowerPoint & Google Slides
Pyramid
Free Learning Retention Pyramid Chart Template for PowerPoint & Google Slides
Pyramid
Free
Multi-Level Colorful Pyramid Chart Template for PowerPoint & Google Slides
Pyramid
Pyramid infographic template for PowerPoint & Google Slides
Pyramid
7-Level 3D Pyramid Infographic Diagram Template for PowerPoint & Google Slides
Pyramid
Four-Level 3D Pyramid Infographic Template for PowerPoint & Google Slides
Pyramid
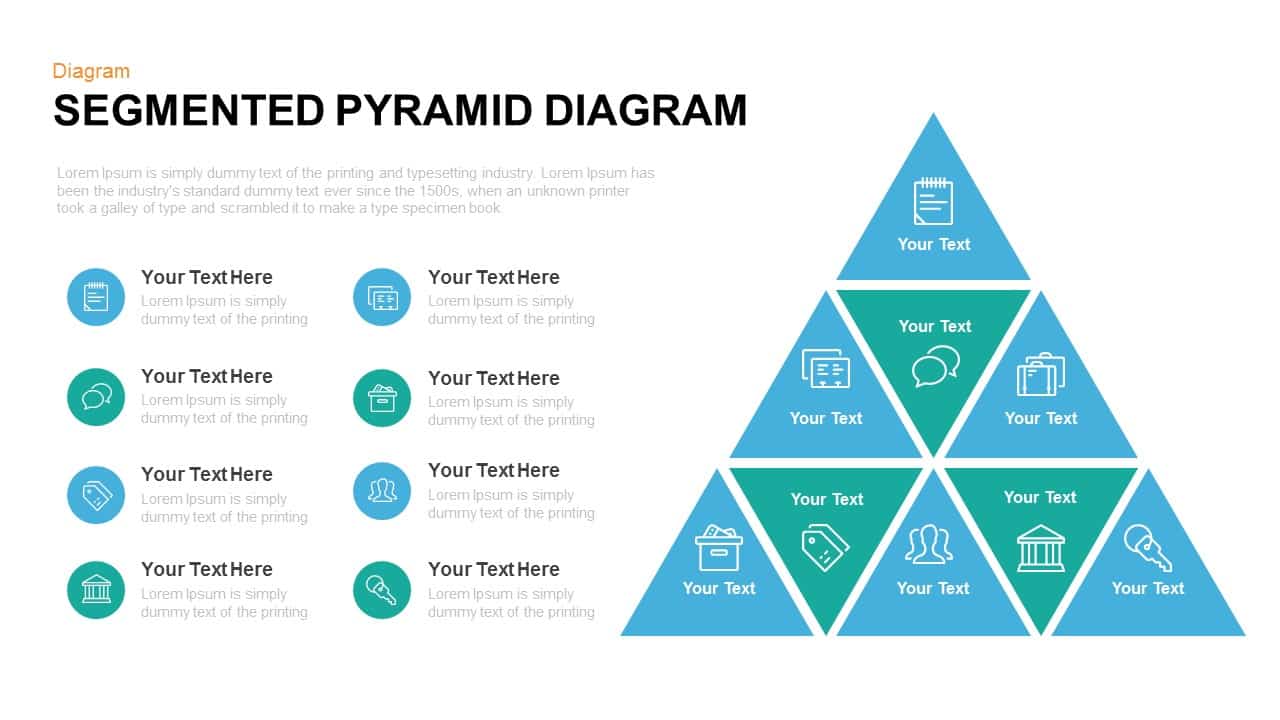
Segmented Pyramid Diagram Infographic Template for PowerPoint & Google Slides
Pyramid
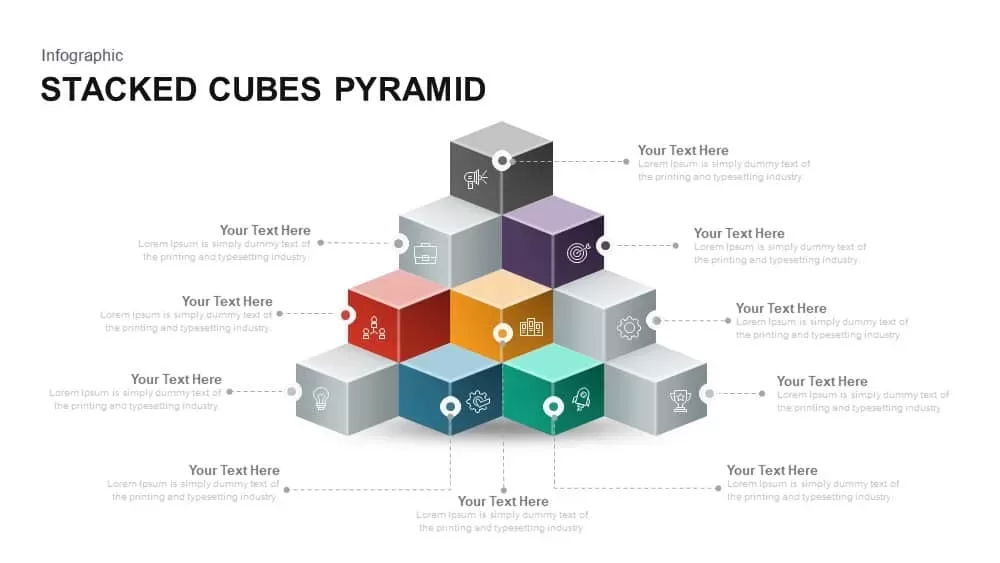
Stacked Cubes Pyramid Infographic Template for PowerPoint & Google Slides
Pyramid
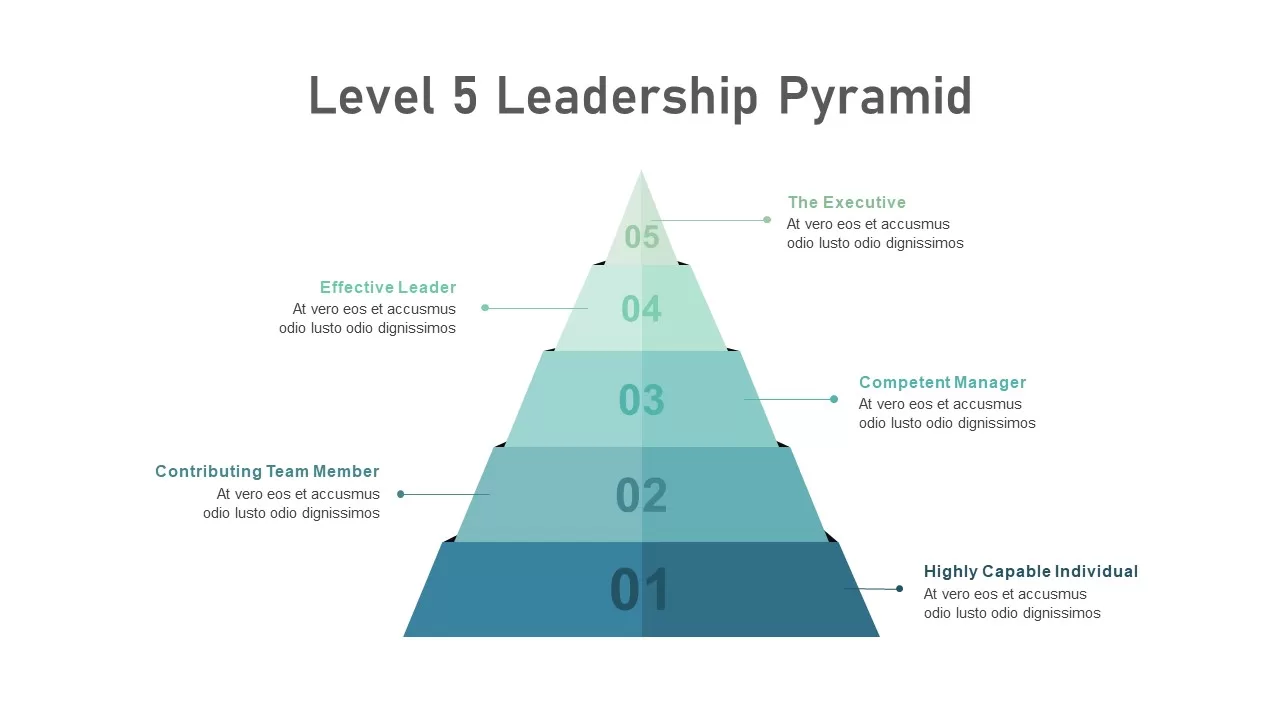
Level 5 Leadership Pyramid Infographic Template for PowerPoint & Google Slides
Pyramid
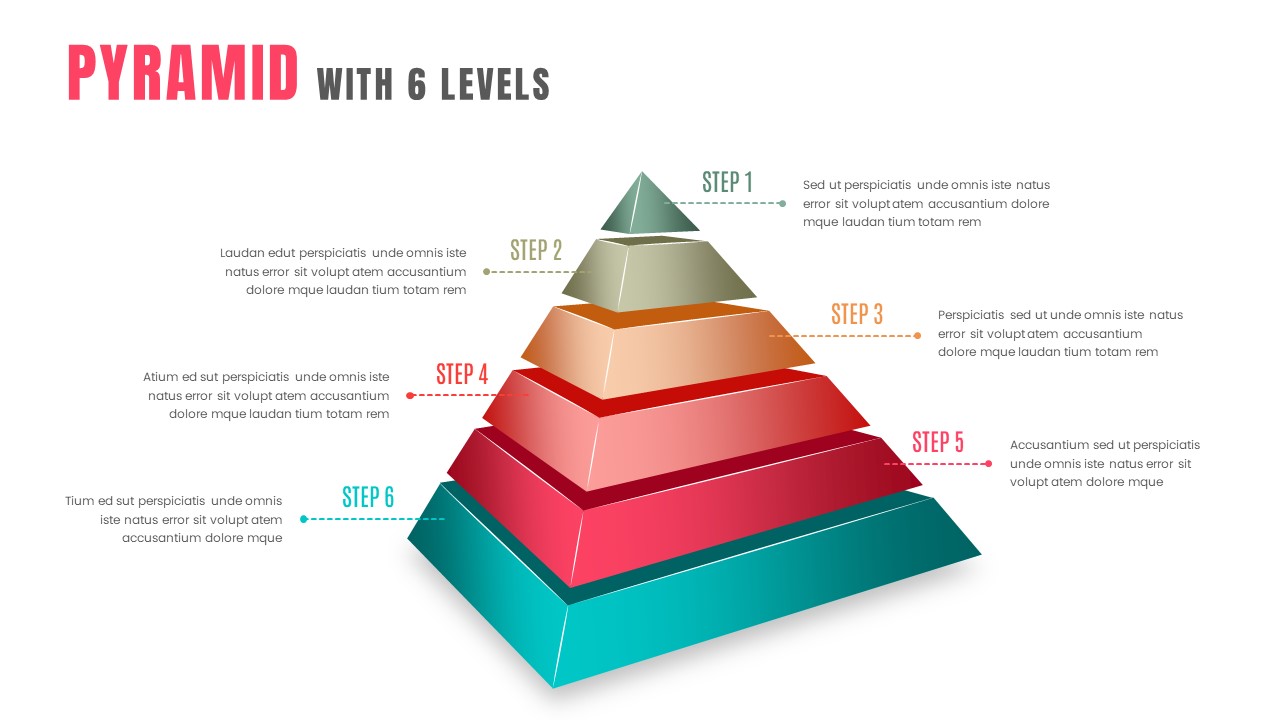
3D Six-Level Pyramid Diagram Infographic Template for PowerPoint & Google Slides
Pyramid
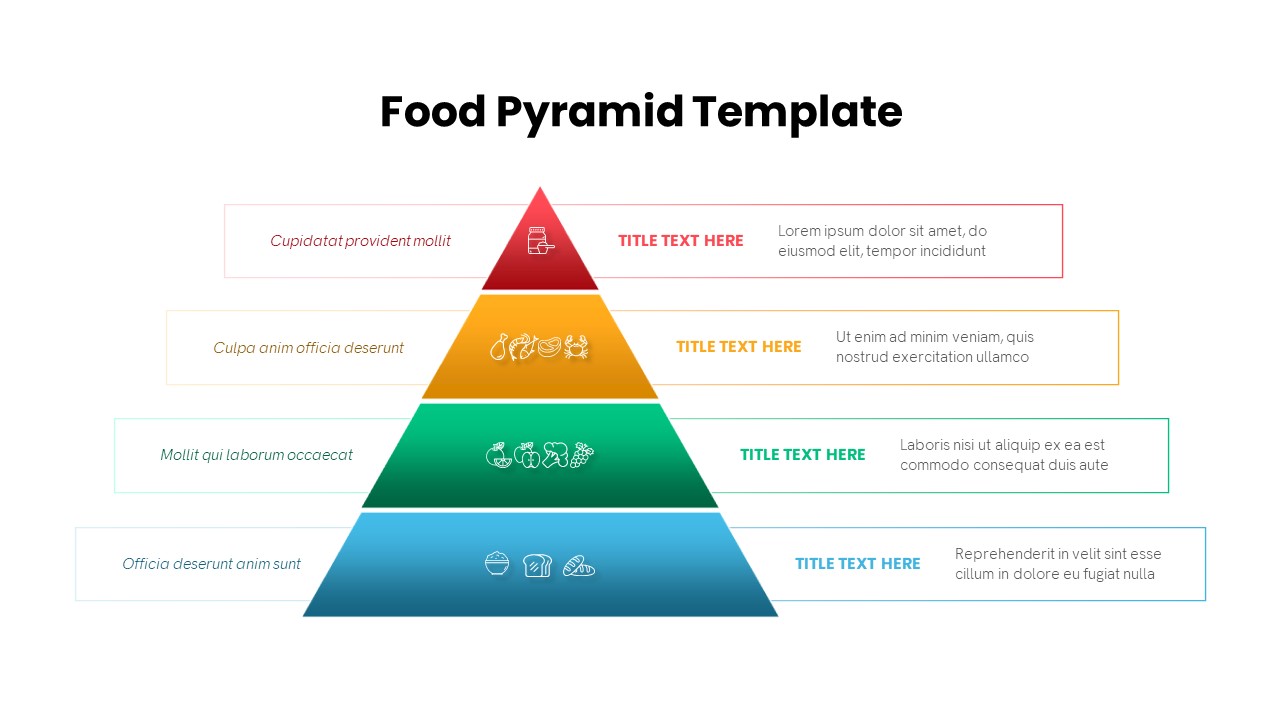
Four-Level Food Pyramid Infographic Template for PowerPoint & Google Slides
Pyramid
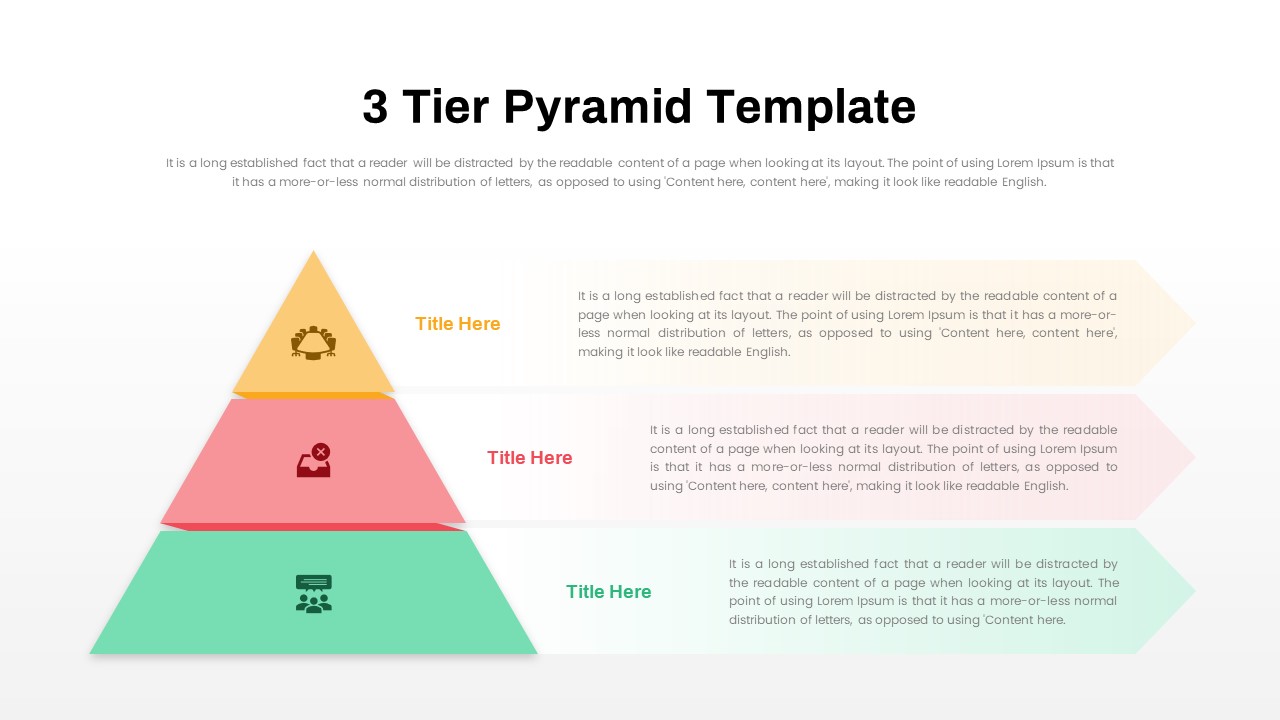
Three-Tier Pyramid Infographic Template for PowerPoint & Google Slides
Pyramid
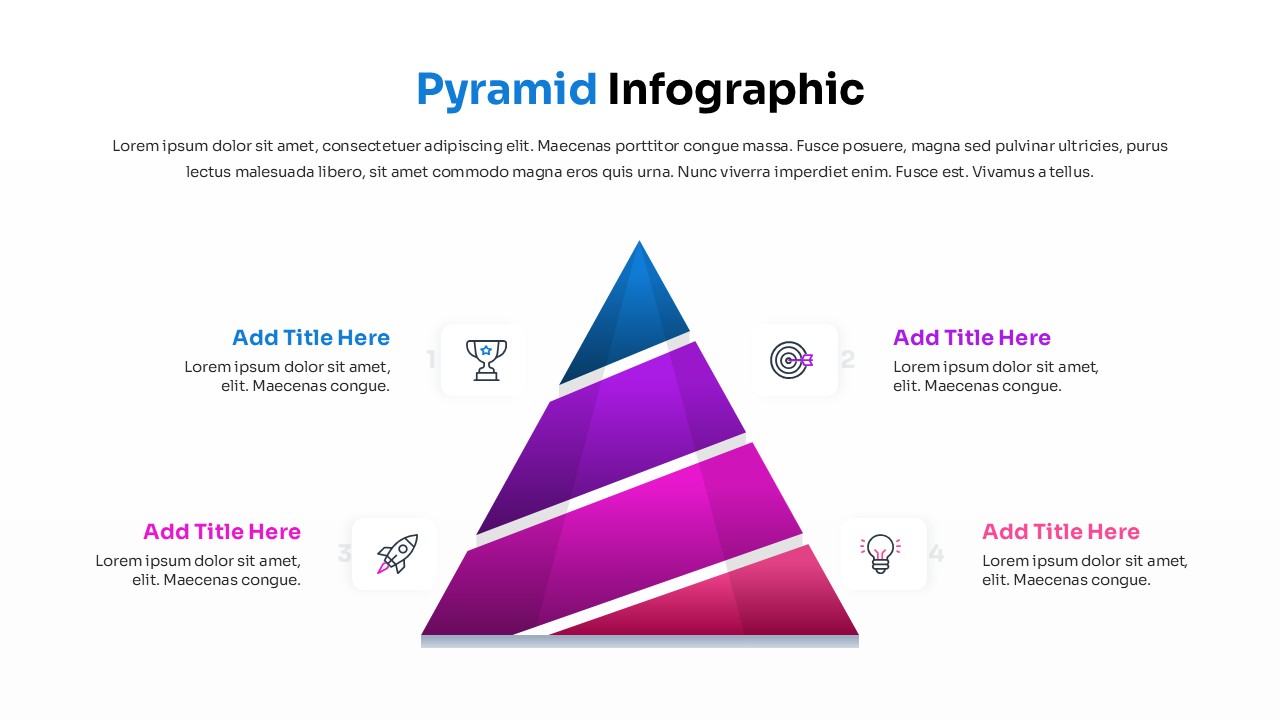
Four Level Pyramid Infographic Template for PowerPoint & Google Slides
Pyramid
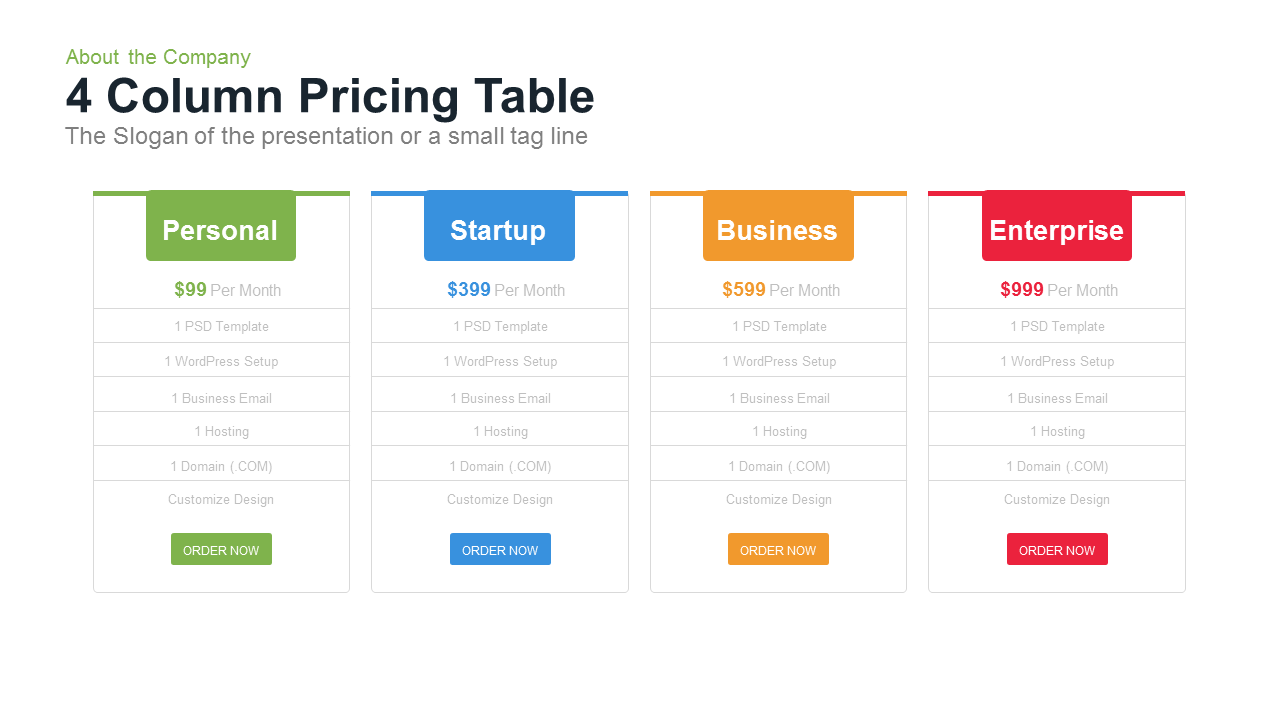
4 Column Pricing template for PowerPoint & Google Slides
Comparison
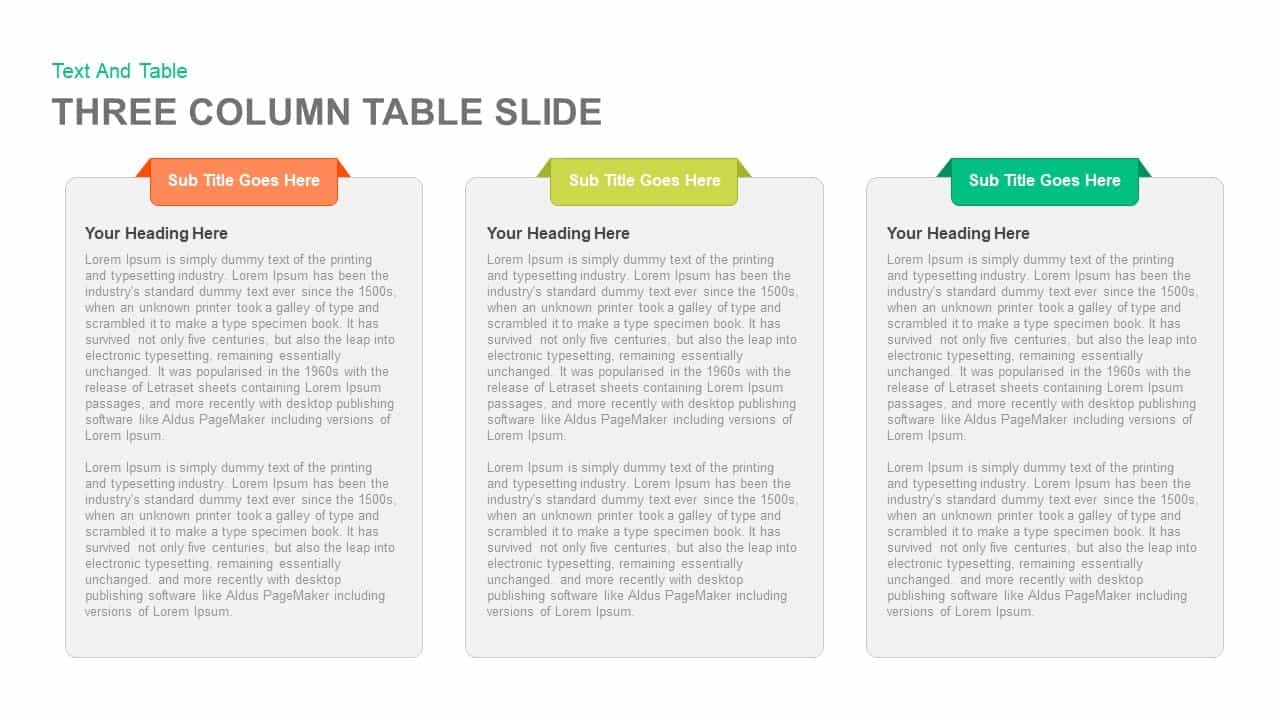
3-Column Comparison template for PowerPoint & Google Slides
Comparison
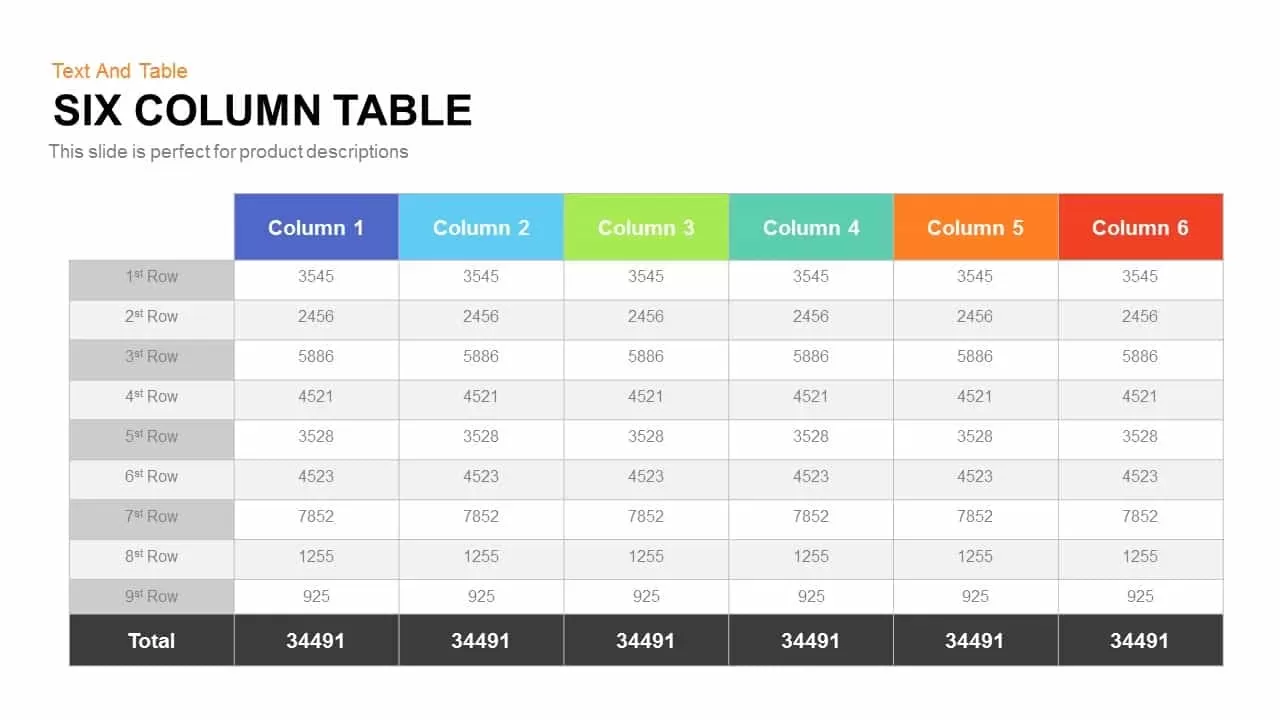
Six Column Table template for PowerPoint & Google Slides
Table
Clean Three-Four Column Table Slide Template for PowerPoint & Google Slides
Business Report
Three and Four-Column Card Layout Template for PowerPoint & Google Slides
Infographics
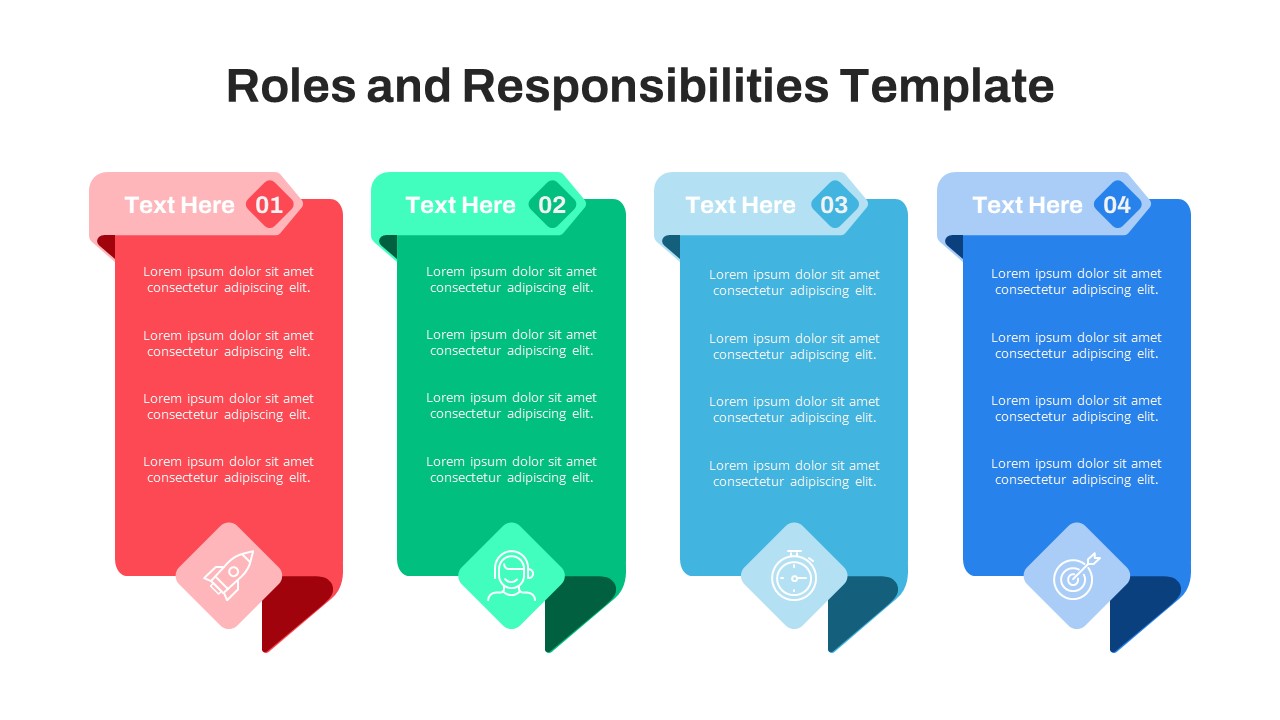
Free Four-Column Roles and Responsibilities Template for PowerPoint & Google Slides
Our Team
Free
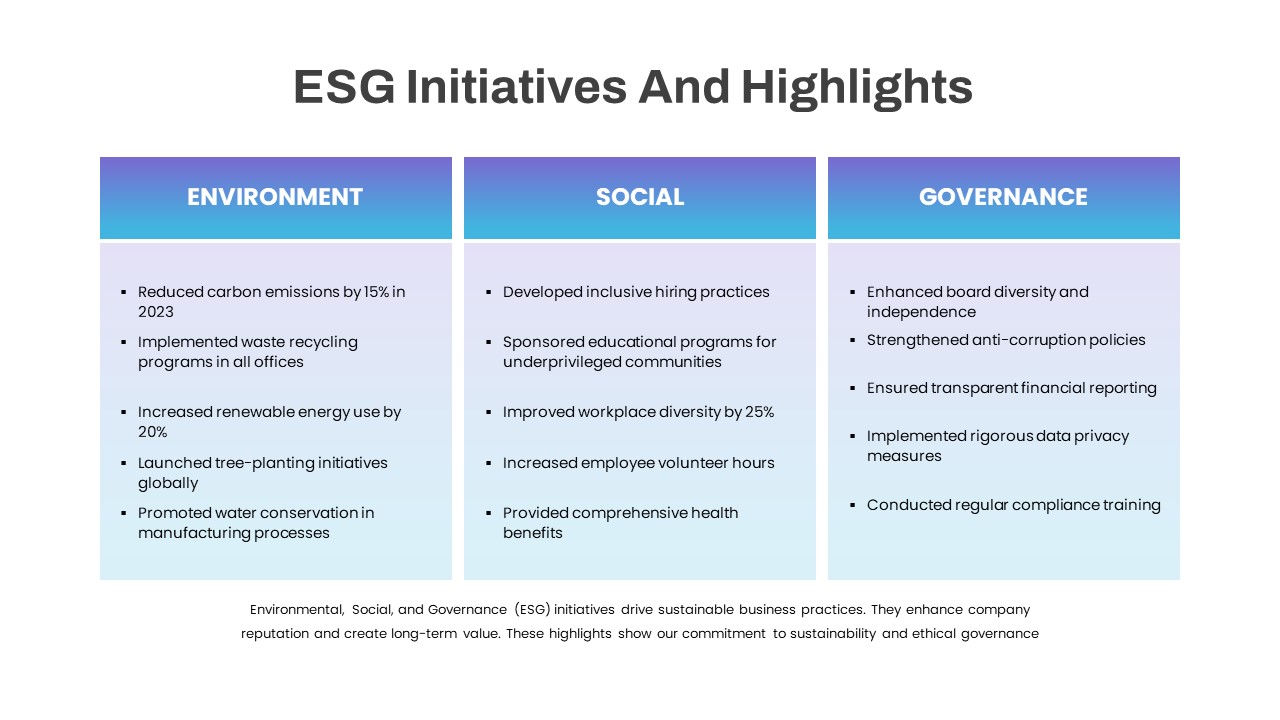
ESG Initiatives Three-Column Template for PowerPoint & Google Slides
Comparison
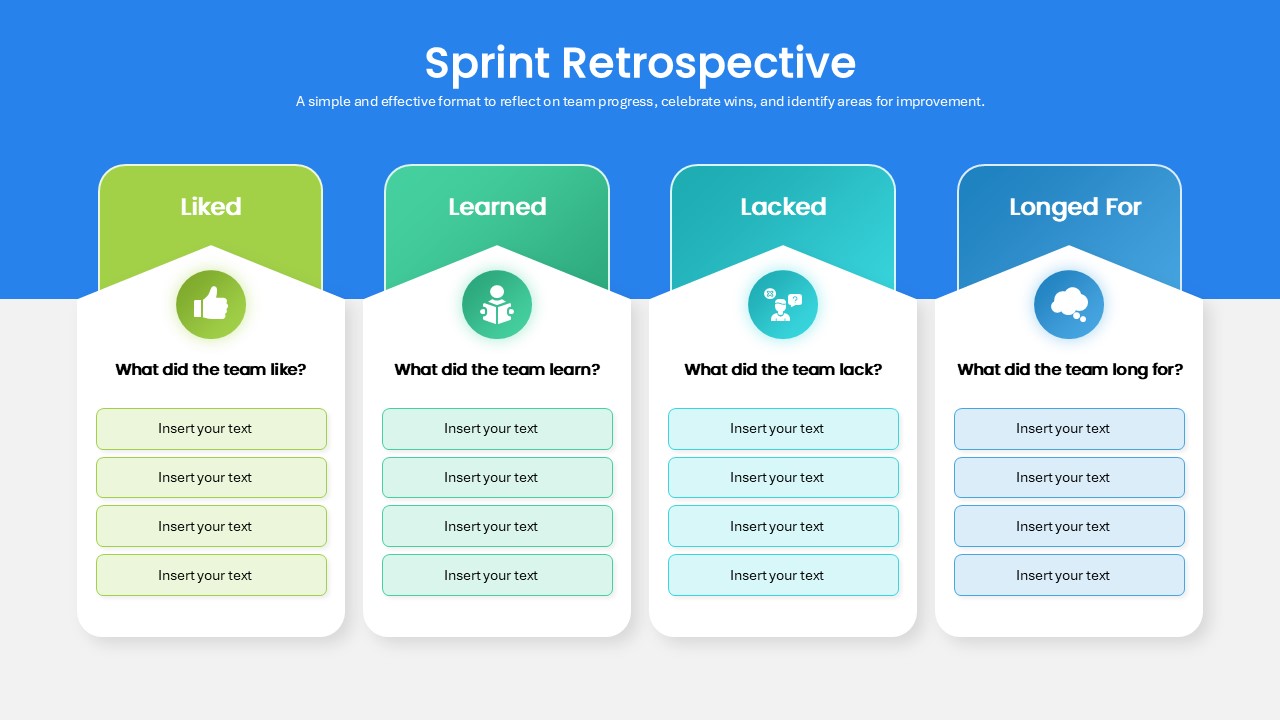
Sprint Retrospective Four-Column Template for PowerPoint & Google Slides
Process
Multi-Column Table Presentation Template for PowerPoint & Google Slides
Table
Six-Row Multi-Column Table Presentation Template for PowerPoint & Google Slides
Table
Colorful Four-Column Table Layout Template for PowerPoint & Google Slides
Table
Five Column Comparison Table Layout Template for PowerPoint & Google Slides
Comparison
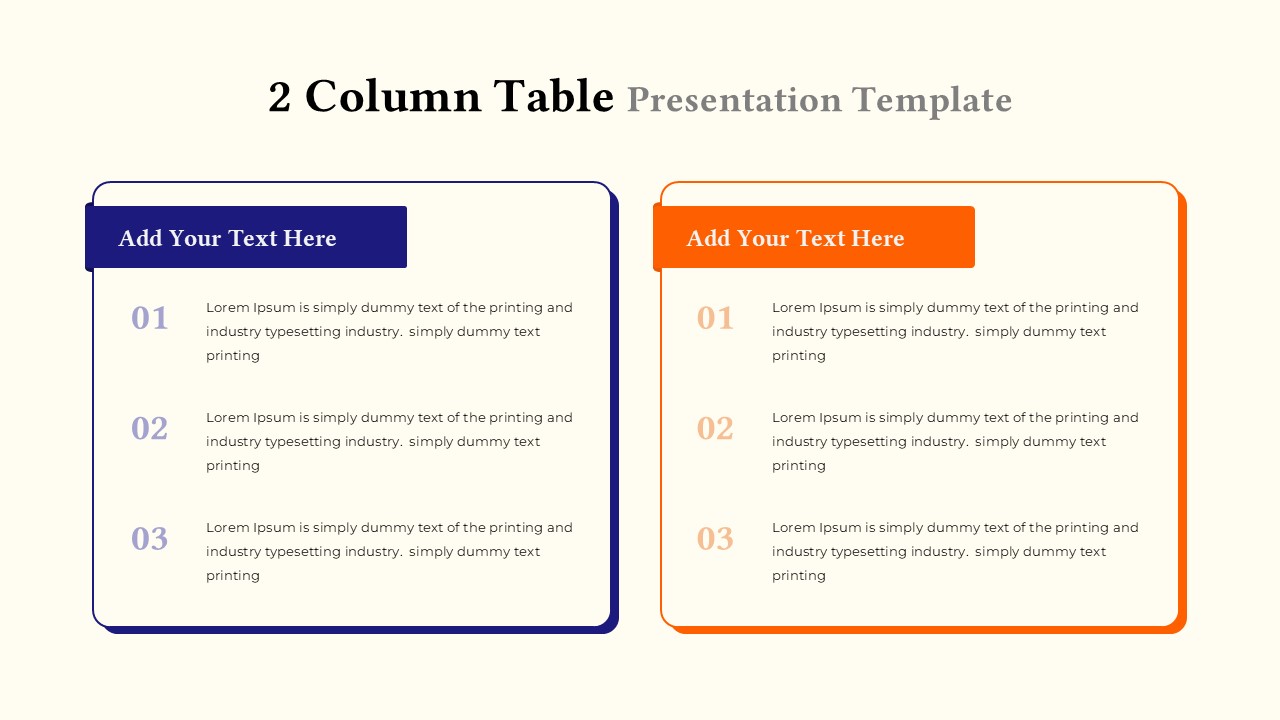
Two-Column Table Presentation Template for PowerPoint & Google Slides
Table
Six Column Data Table Template for PowerPoint & Google Slides
Table
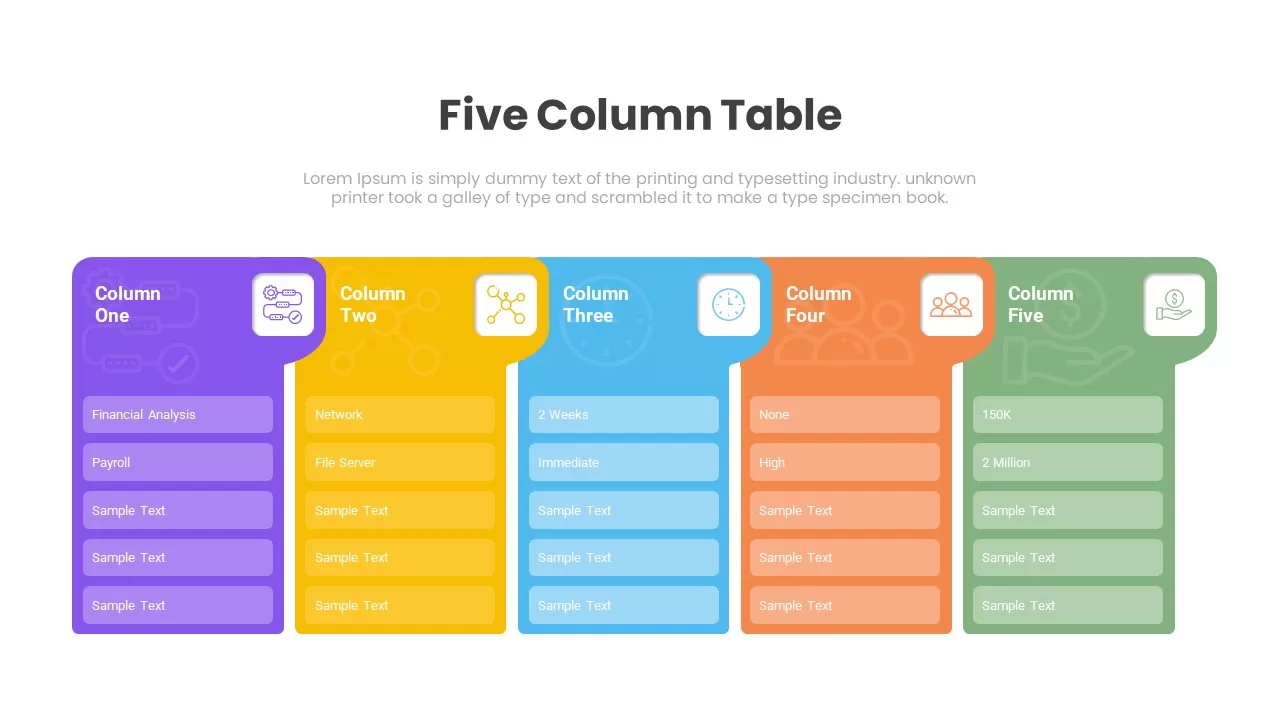
Five Column Table Infographics for PowerPoint & Google Slides
Business
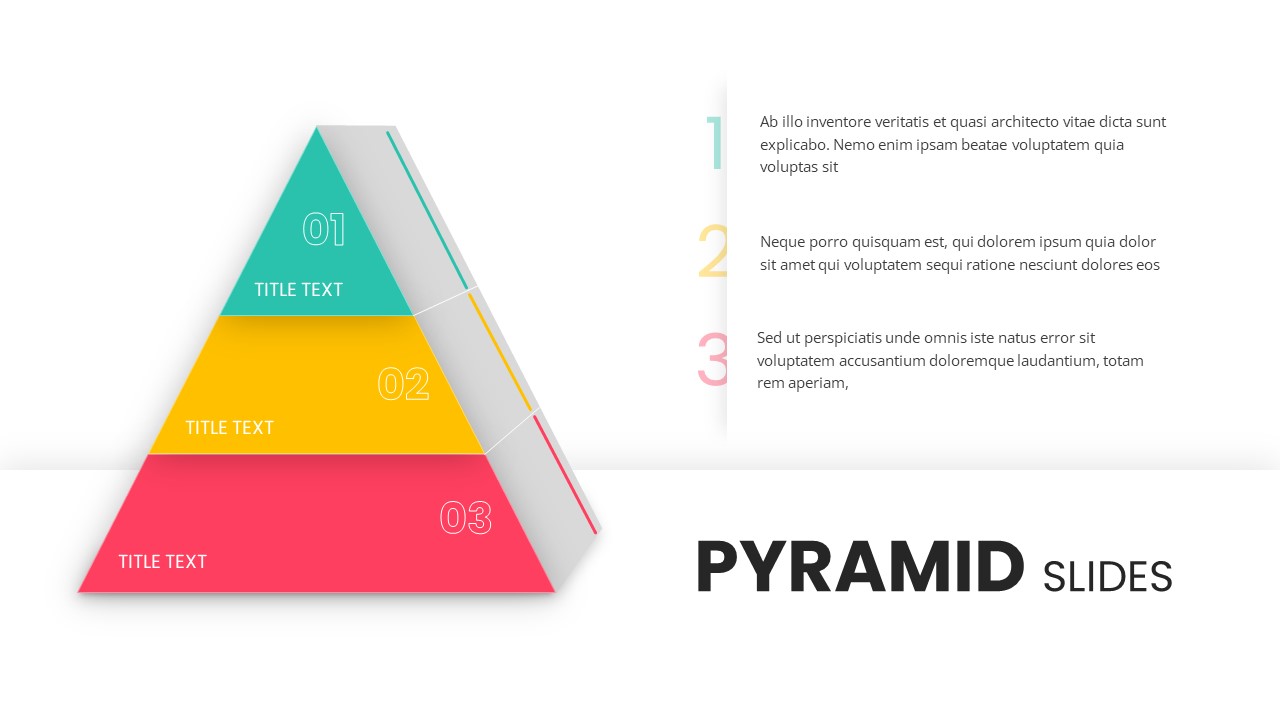
3 Stage Pyramid Slides for PowerPoint & Google Slides
Pyramid
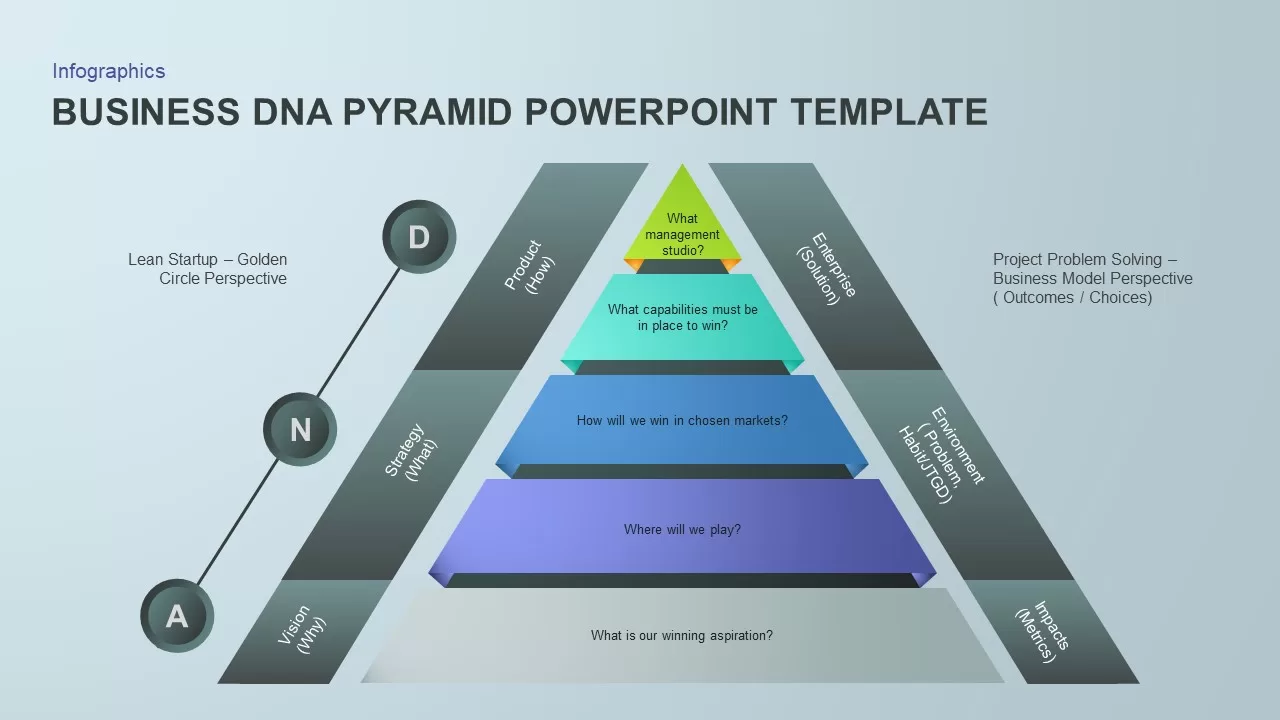
Business DNA Pyramid PowerPoint Template for PowerPoint & Google Slides
Pyramid
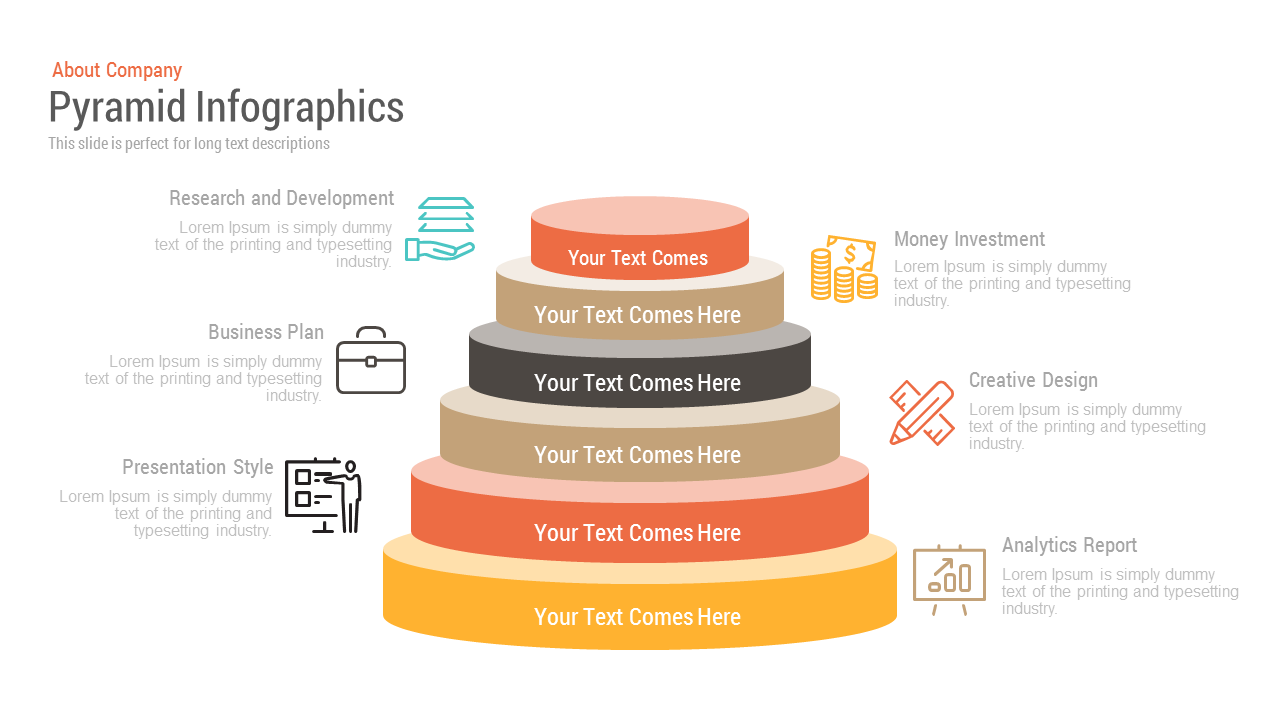
Free Pyramid Infographics template for PowerPoint & Google Slides
Pyramid
Free
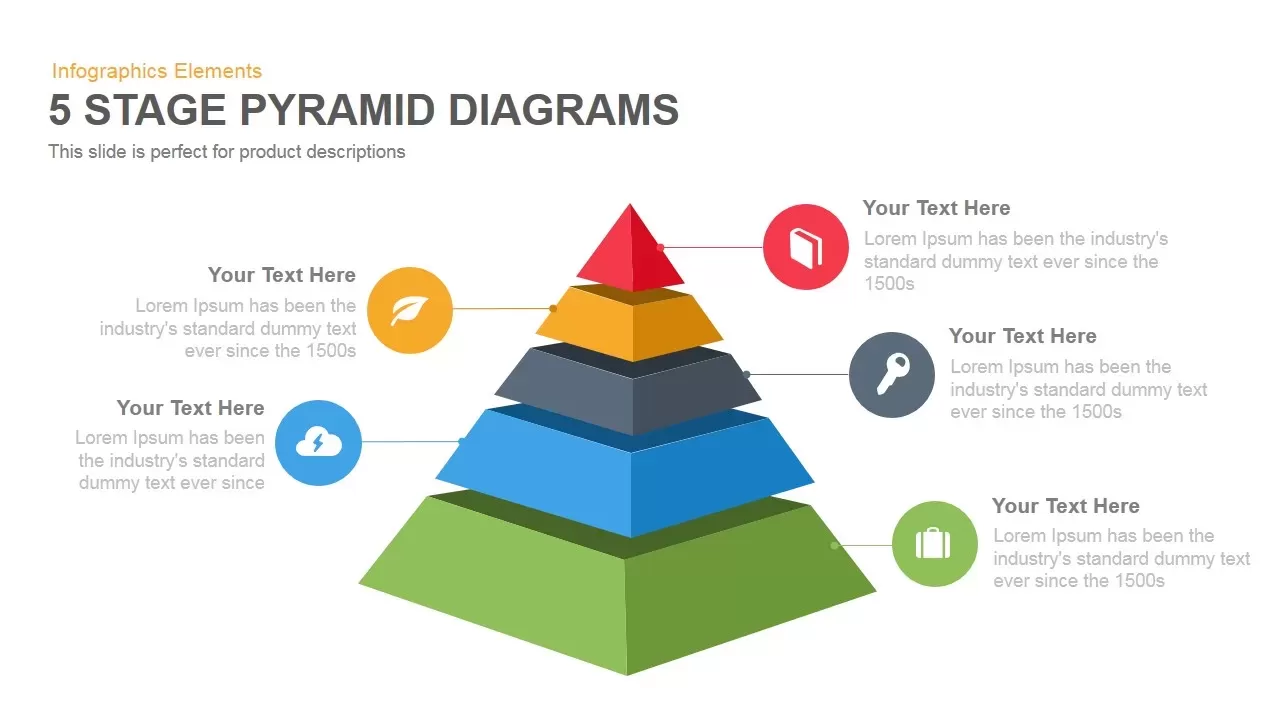
5 Stage Pyramid template for PowerPoint & Google Slides
Pyramid
Five-Level 3D Pyramid Hierarchy Template for PowerPoint & Google Slides
Pyramid
4-Step 3D Pyramid Diagram with Callouts template for PowerPoint & Google Slides
Pyramid
Professional 5-Stage Pyramid Diagram Template for PowerPoint & Google Slides
Pyramid
Professional 4-Piece 3D Pyramid Diagram Template for PowerPoint & Google Slides
Pyramid
Five-Stage Pyramid Infographics Diagram Template for PowerPoint & Google Slides
Pyramid
Editable Six-Level 3D Pyramid Diagram Template for PowerPoint & Google Slides
Pyramid
Four-Level Business Pyramid Diagram Template for PowerPoint & Google Slides
Pyramid
Five-Level Staged Pyramid Diagram Template for PowerPoint & Google Slides
Pyramid
Five Stages Pyramid with Ribbons Diagram Template for PowerPoint & Google Slides
Pyramid
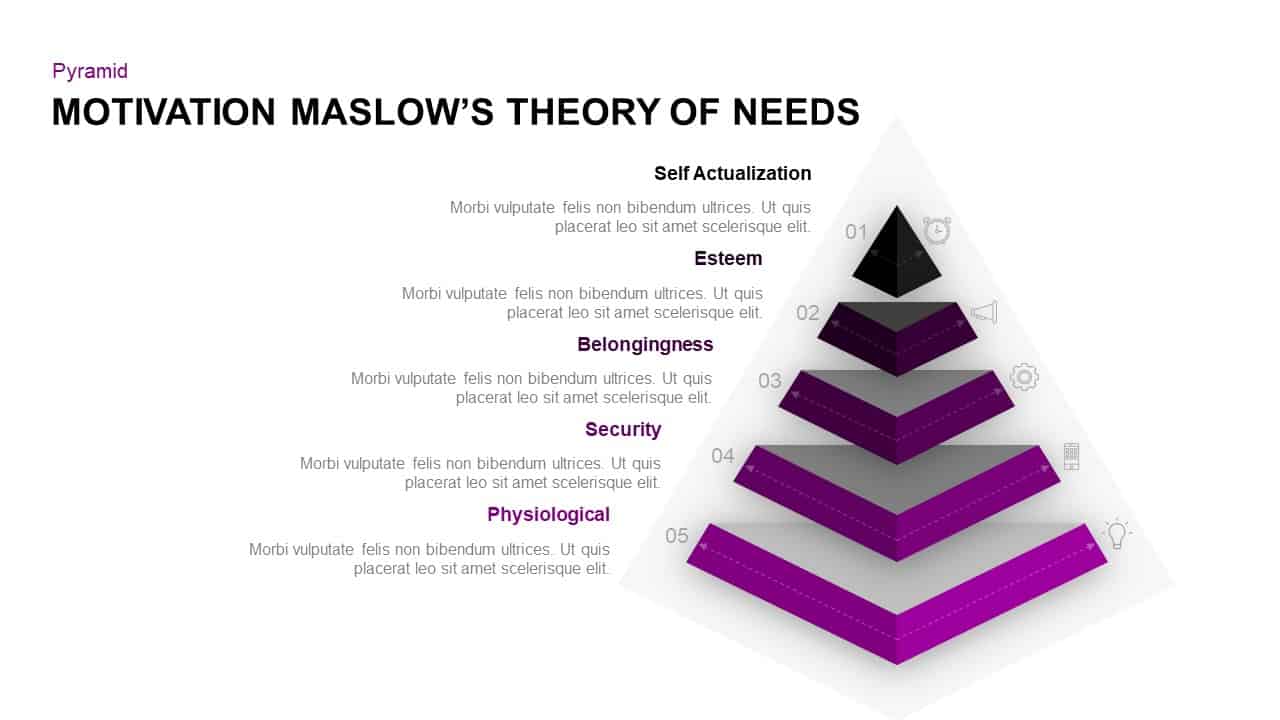
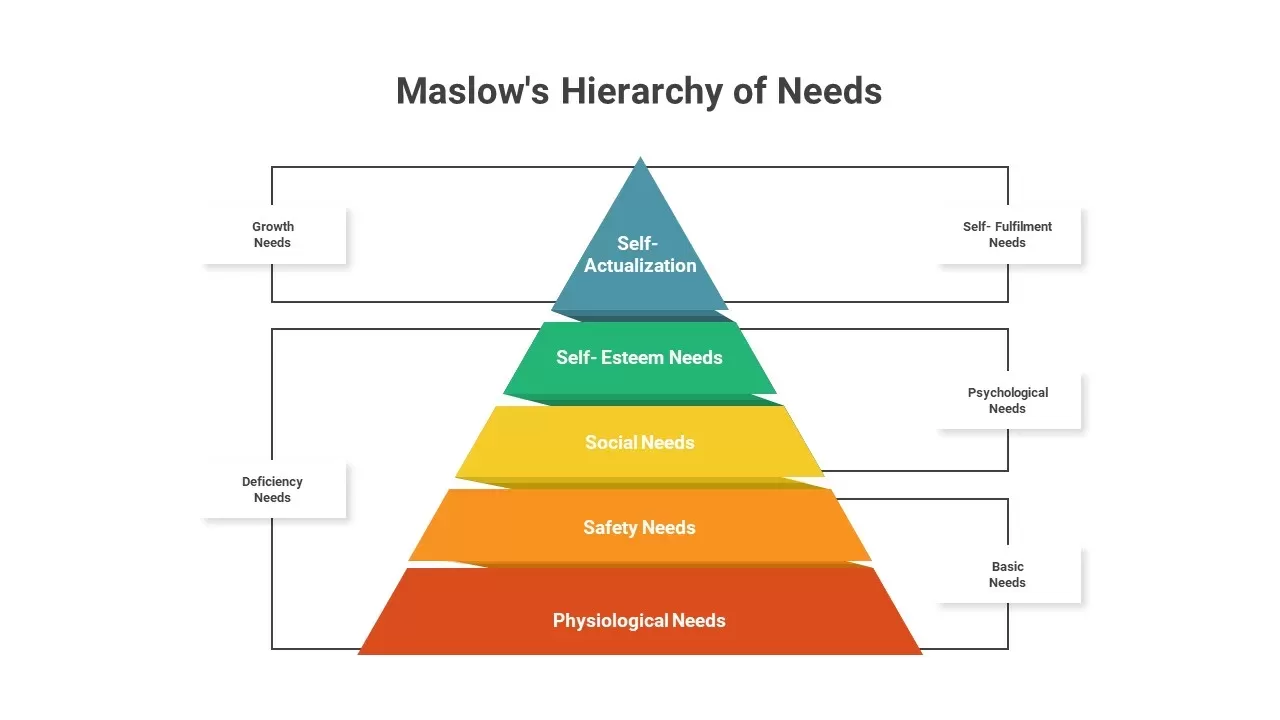
Maslow’s Hierarchy of Needs Pyramid Template for PowerPoint & Google Slides
Pyramid
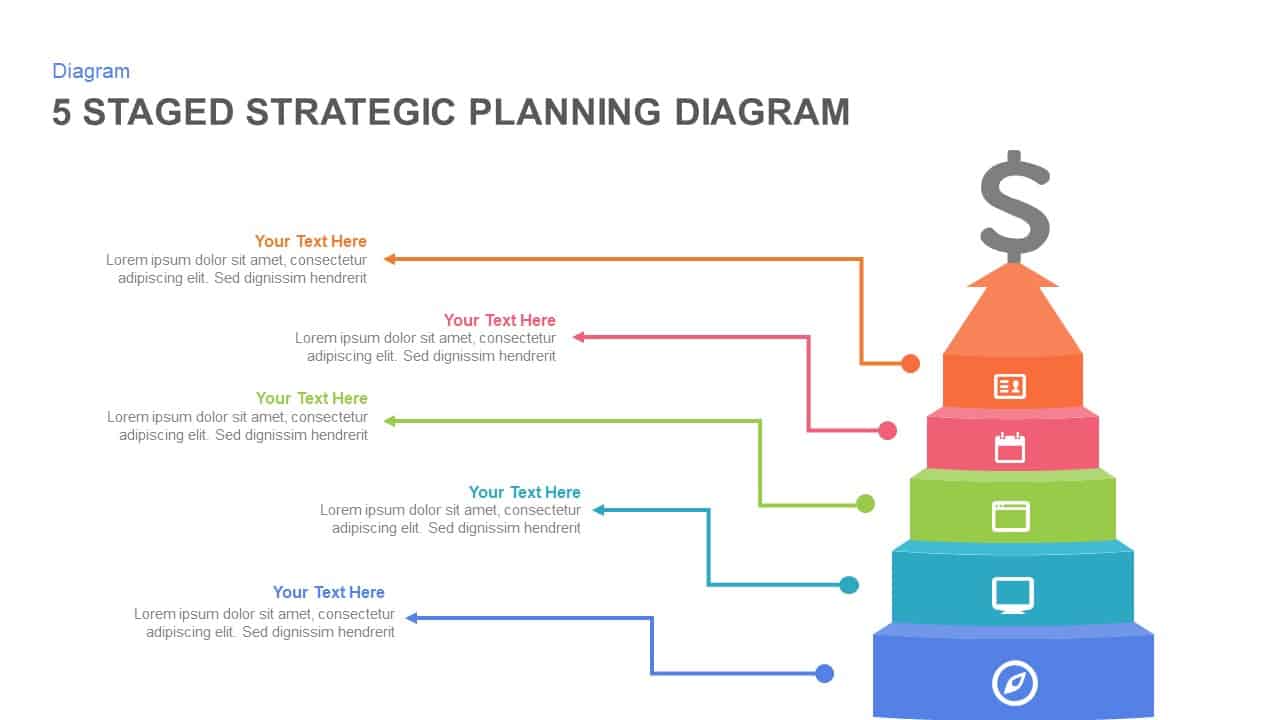
5-Stage Strategic Planning Pyramid Template for PowerPoint & Google Slides
Business Strategy
Five-Stage Pyramid Infographics Process Template for PowerPoint & Google Slides
Pyramid
Maslow’s Hierarchy of Needs Pyramid template for PowerPoint & Google Slides
Pyramid
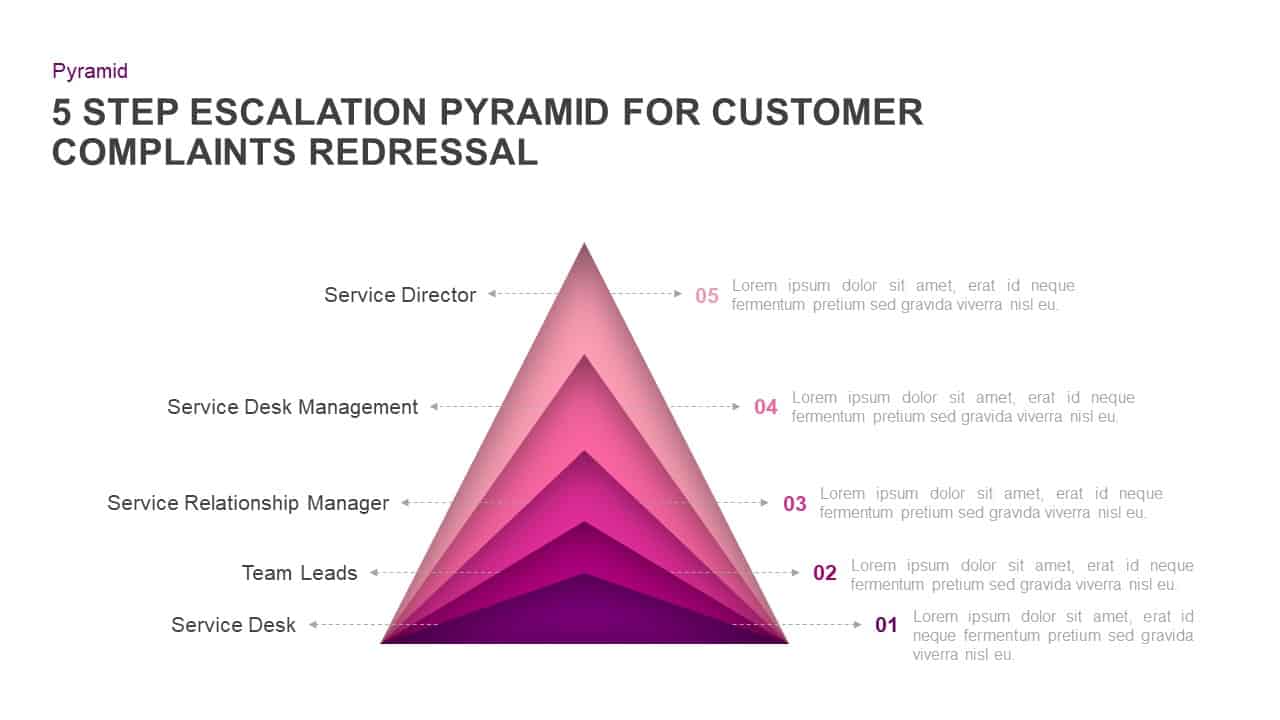
Customer Complaints Escalation Pyramid Template for PowerPoint & Google Slides
Infographics
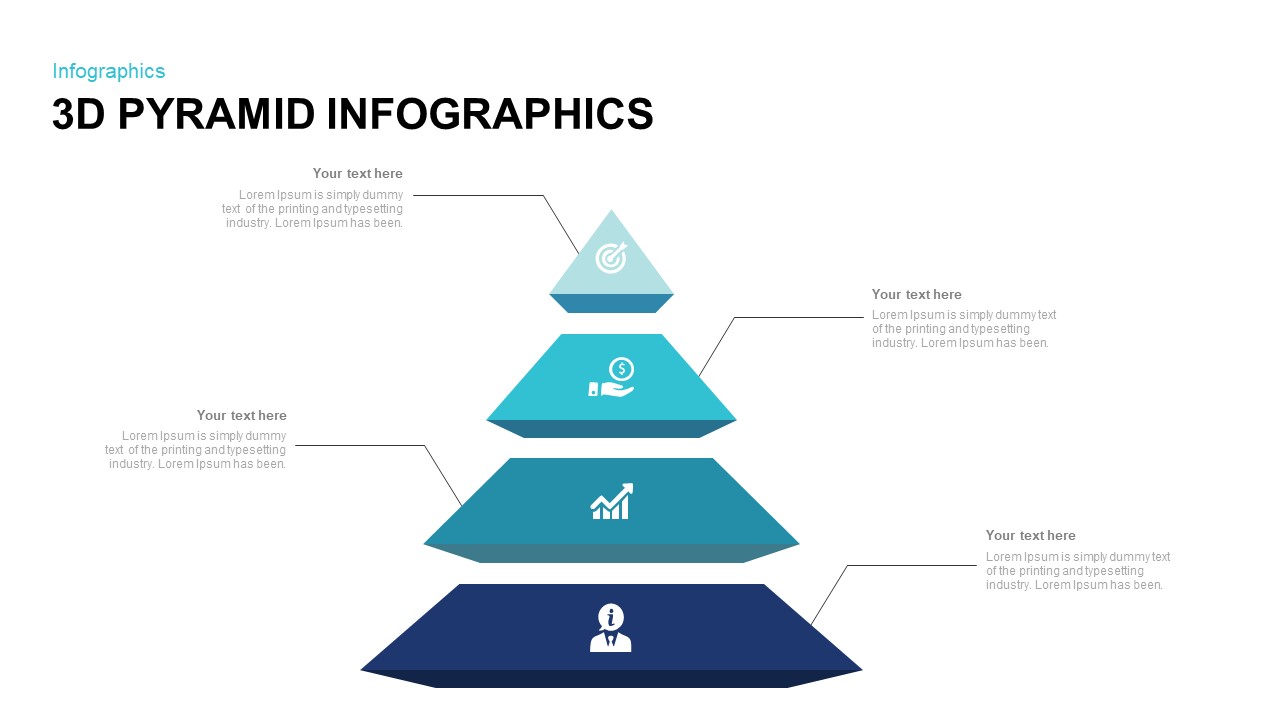
3D Pyramid Infographics Slide Template for PowerPoint & Google Slides
Pyramid
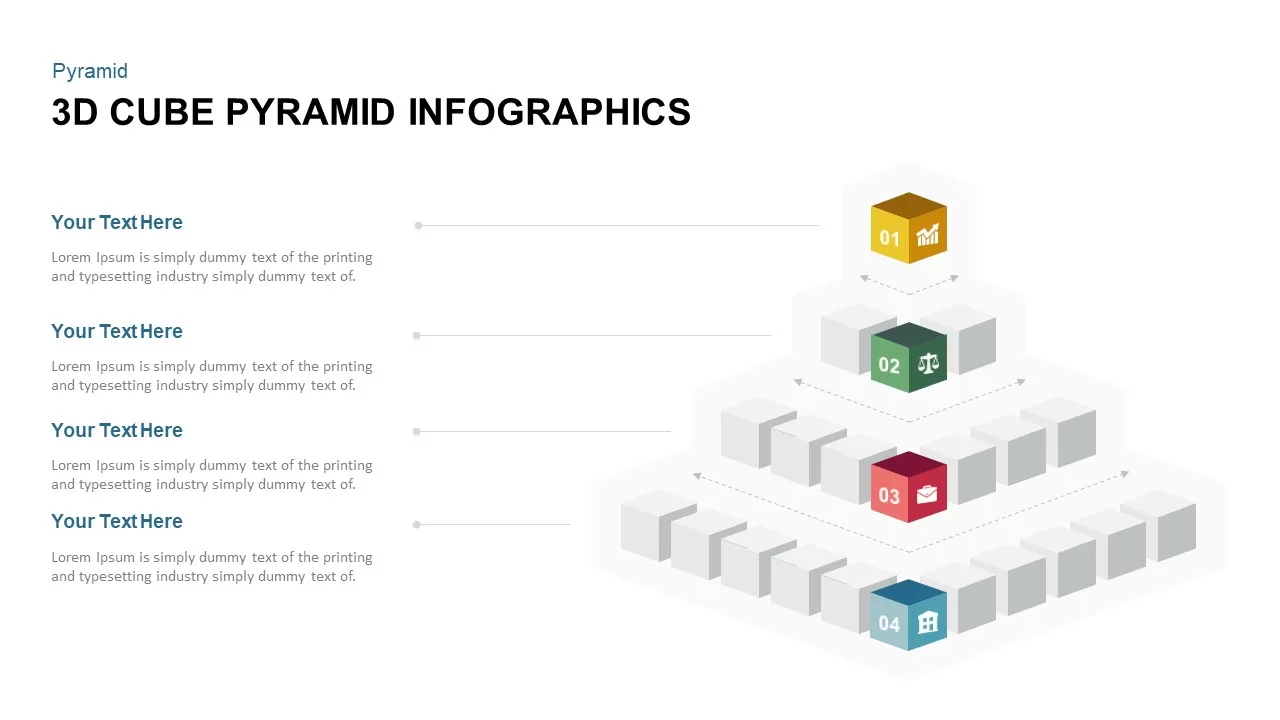
3D Cube Pyramid Infographics Slide Template for PowerPoint & Google Slides
Pyramid
Stacked Cubes Pyramid Six-Option Diagram Template for PowerPoint & Google Slides
Pyramid
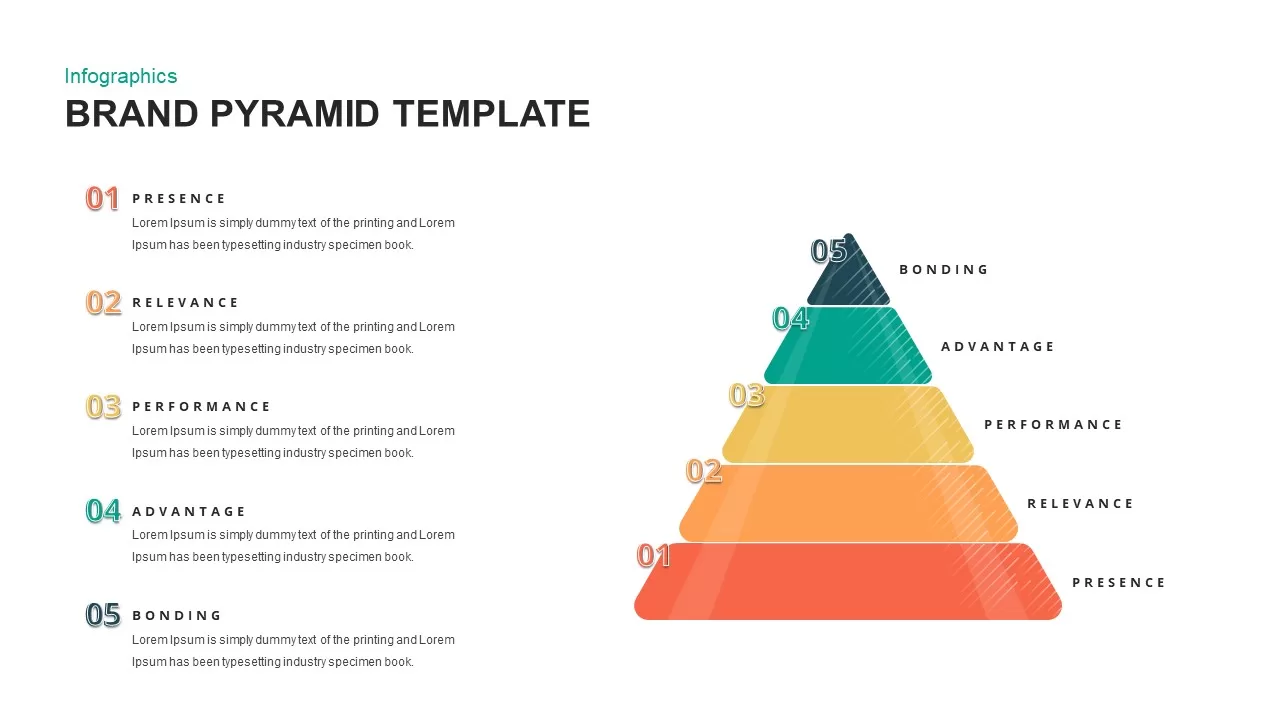
Brand Pyramid Framework template for PowerPoint & Google Slides
Pyramid
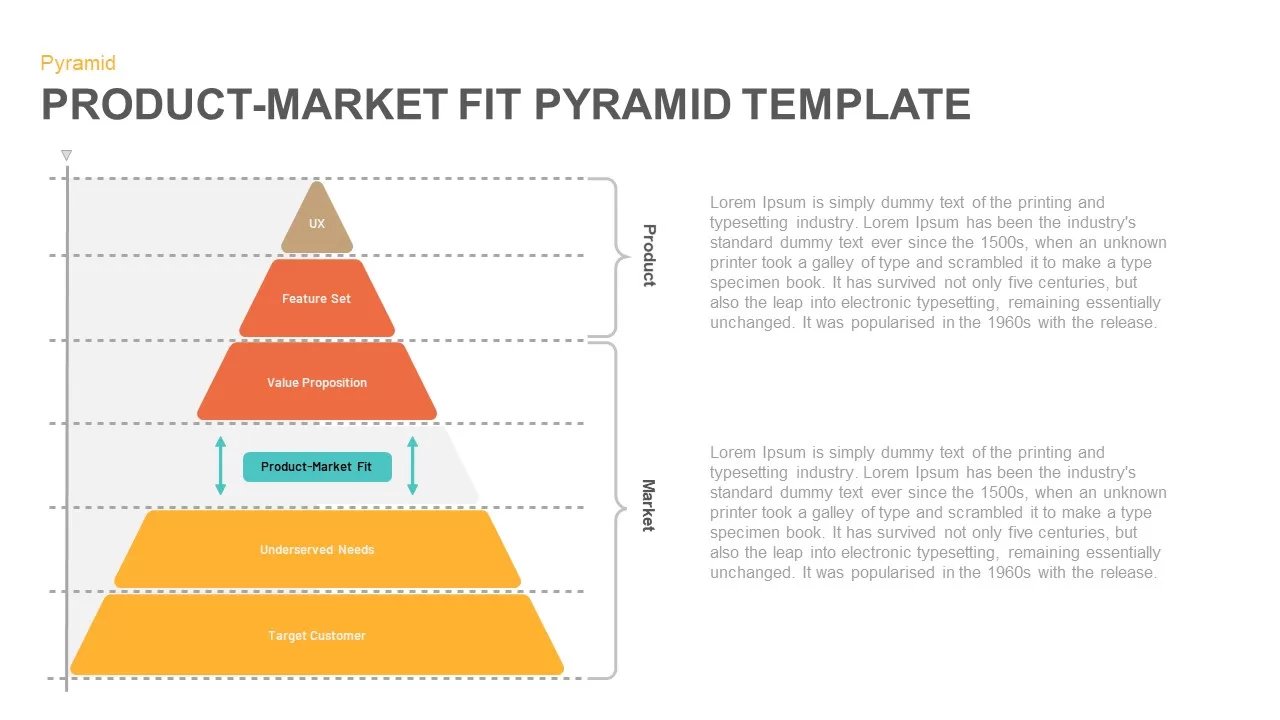
Product-Market Fit Pyramid template for PowerPoint & Google Slides
Pyramid
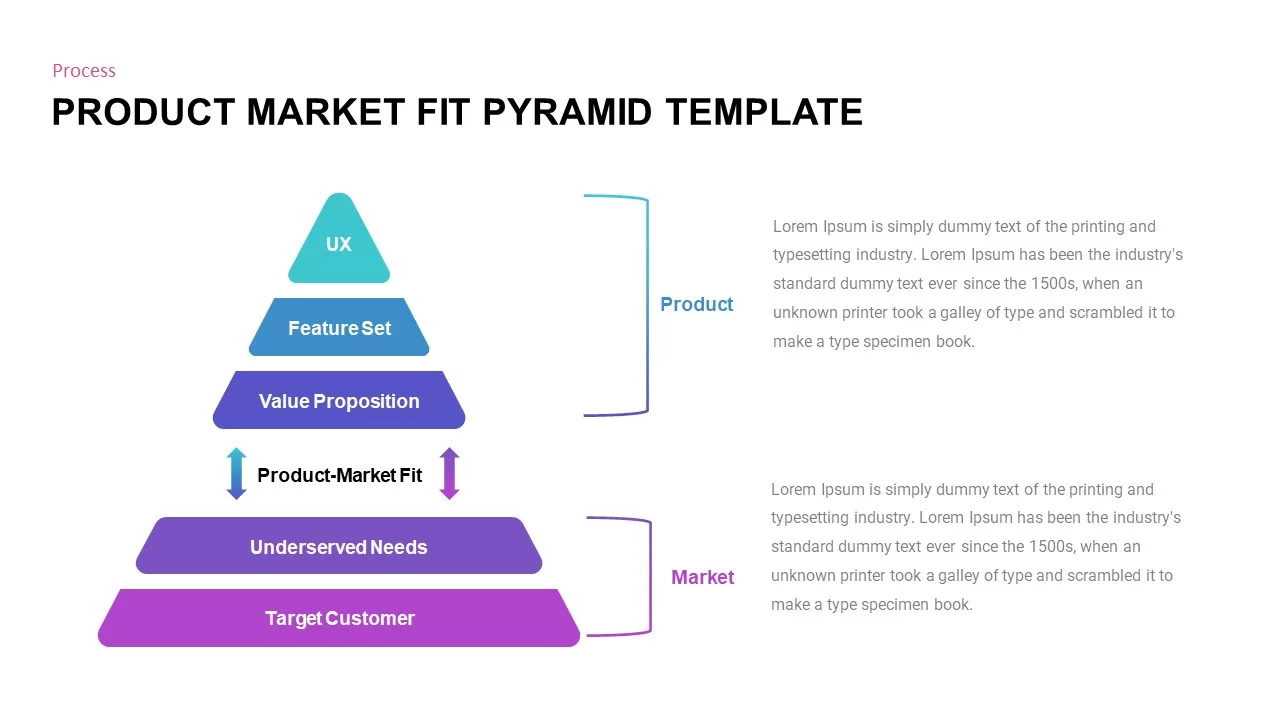
Professional Product Market Fit Pyramid Template for PowerPoint & Google Slides
Pyramid
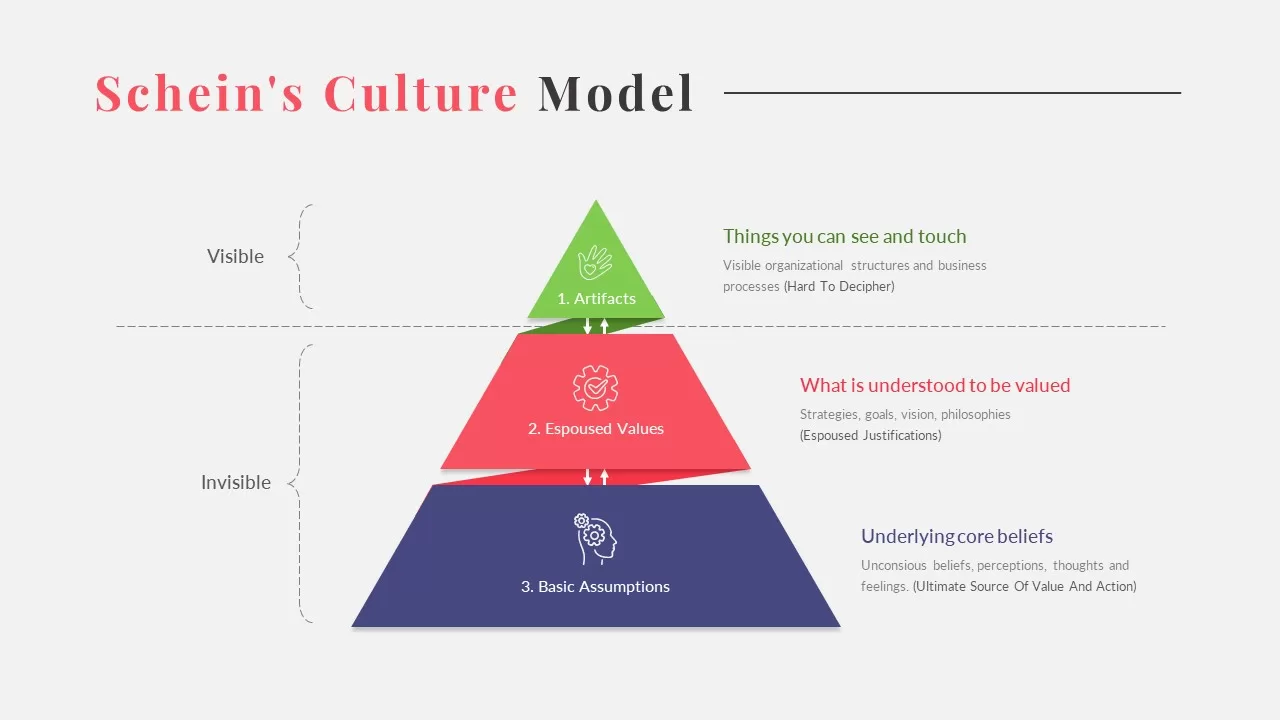
Schein’s Culture Pyramid Model Template for PowerPoint & Google Slides
Pyramid
DIKW Data to Wisdom Pyramid Model Template for PowerPoint & Google Slides
Pyramid
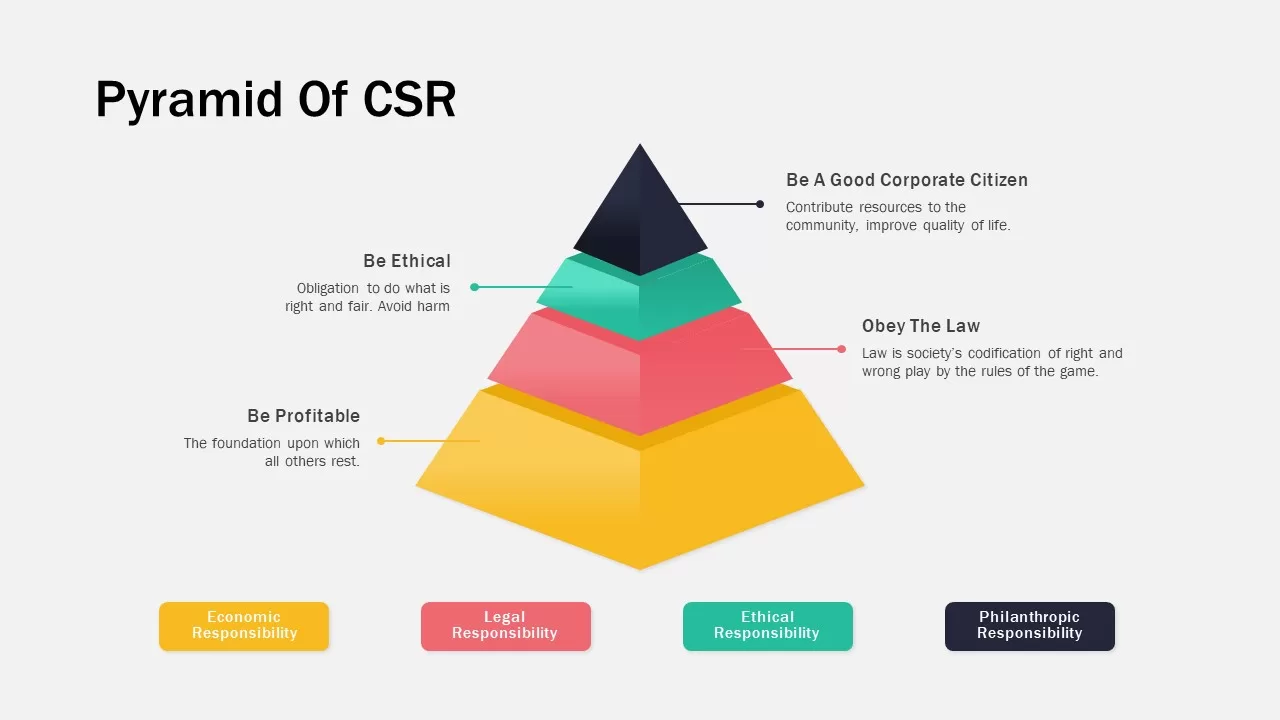
Corporate Social Responsibility Pyramid Template for PowerPoint & Google Slides
Pyramid
Maslow’s Colorful Pyramid of Needs Template for PowerPoint & Google Slides
Pyramid
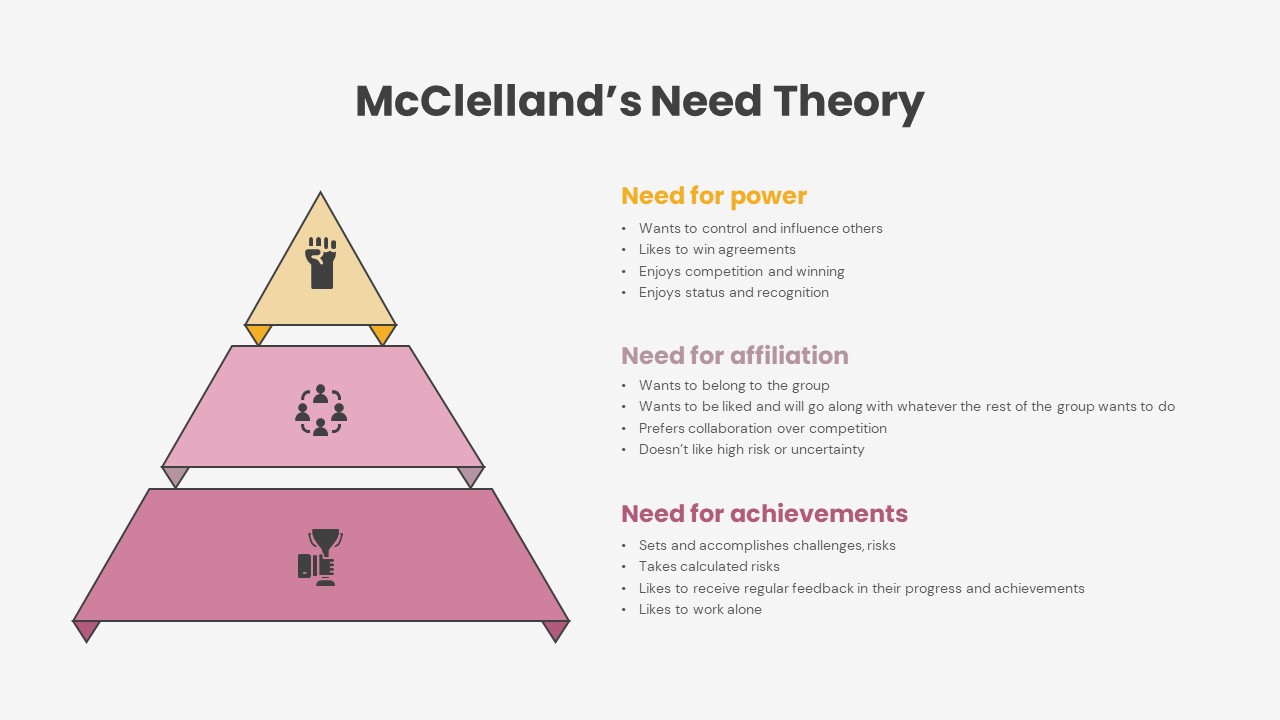
McClelland’s Need Theory Pyramid Template for PowerPoint & Google Slides
Pyramid
Five-Stage Pyramid Process Slide Template for PowerPoint & Google Slides
Pyramid
Six-Stage Pyramid Process Slide Template for PowerPoint & Google Slides
Pyramid
3D Four-Stage Pyramid Diagram Template for PowerPoint & Google Slides
Pyramid
Four-Level Colorful Pyramid Diagram Template for PowerPoint & Google Slides
Pyramid
3D Five-Stage Pyramid Diagram Slide Template for PowerPoint & Google Slides
Pyramid
Modern Four-Level Pyramid Diagram Template for PowerPoint & Google Slides
Pyramid
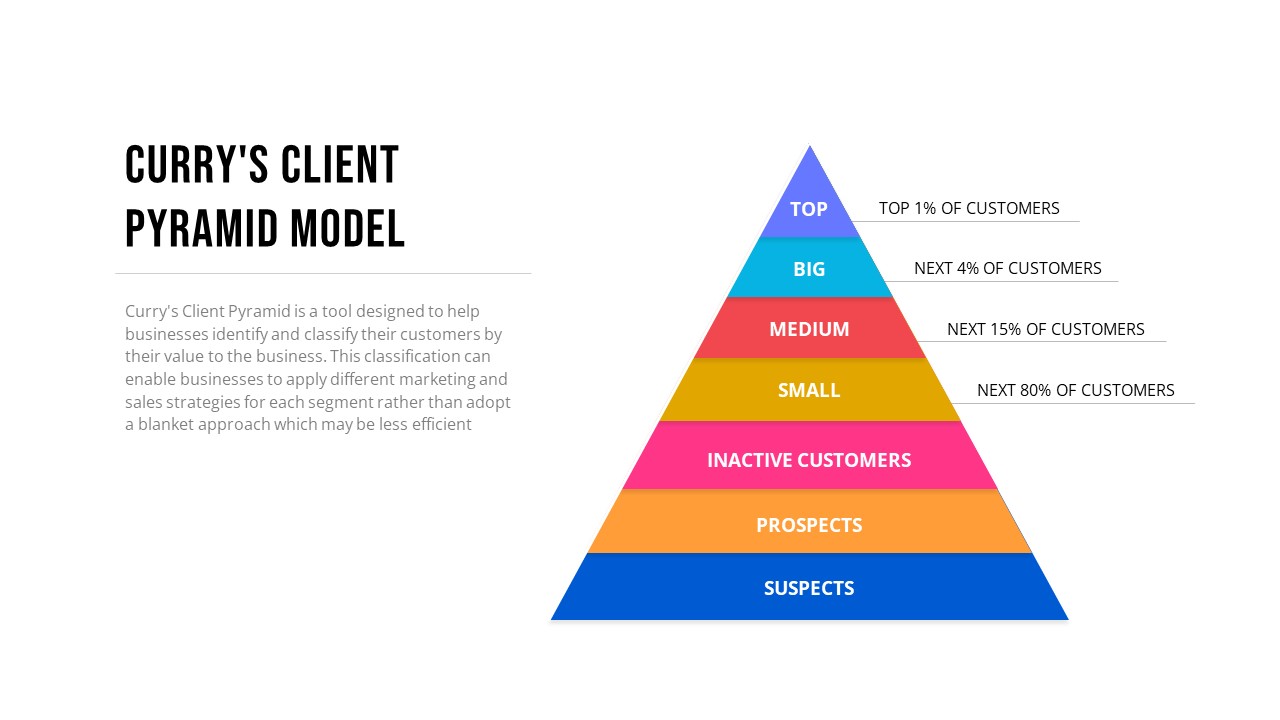
Curry’s Client Segmentation Pyramid Model Template for PowerPoint & Google Slides
Pyramid
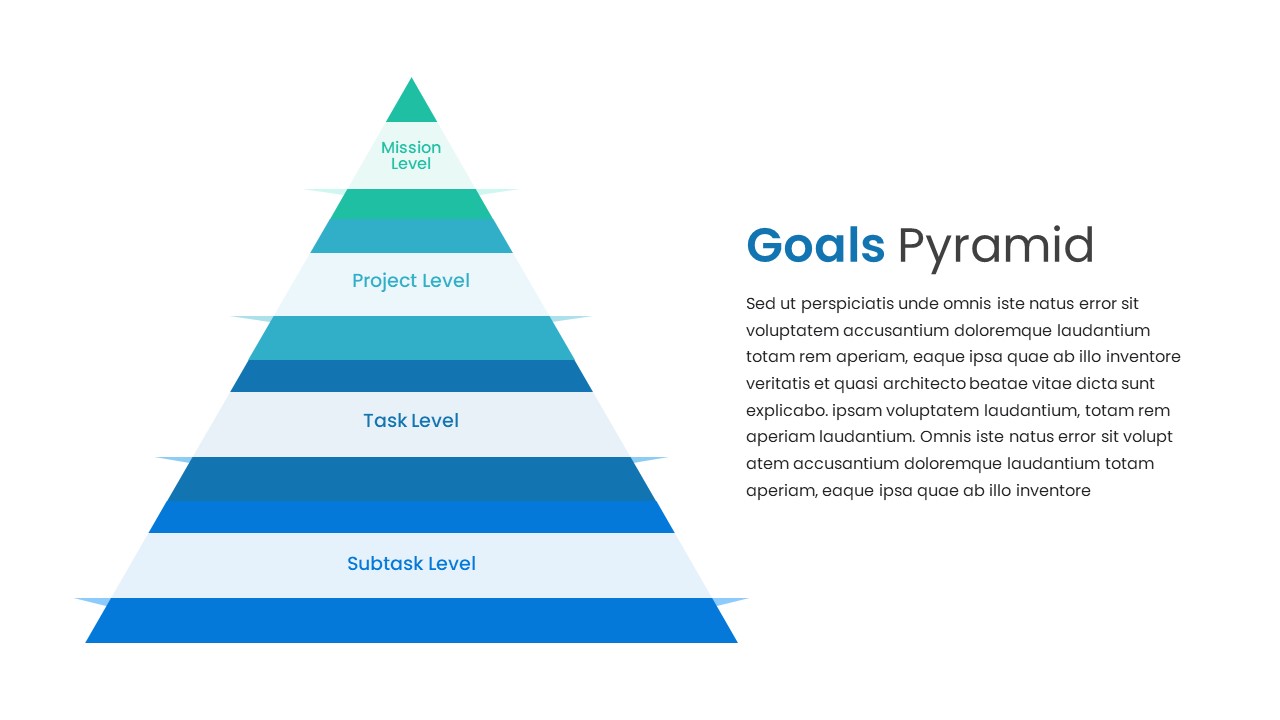
Goals Pyramid Hierarchy Slide Design Template for PowerPoint & Google Slides
Pyramid
Risk Pyramid Hierarchy Analysis Template for PowerPoint & Google Slides
Pyramid
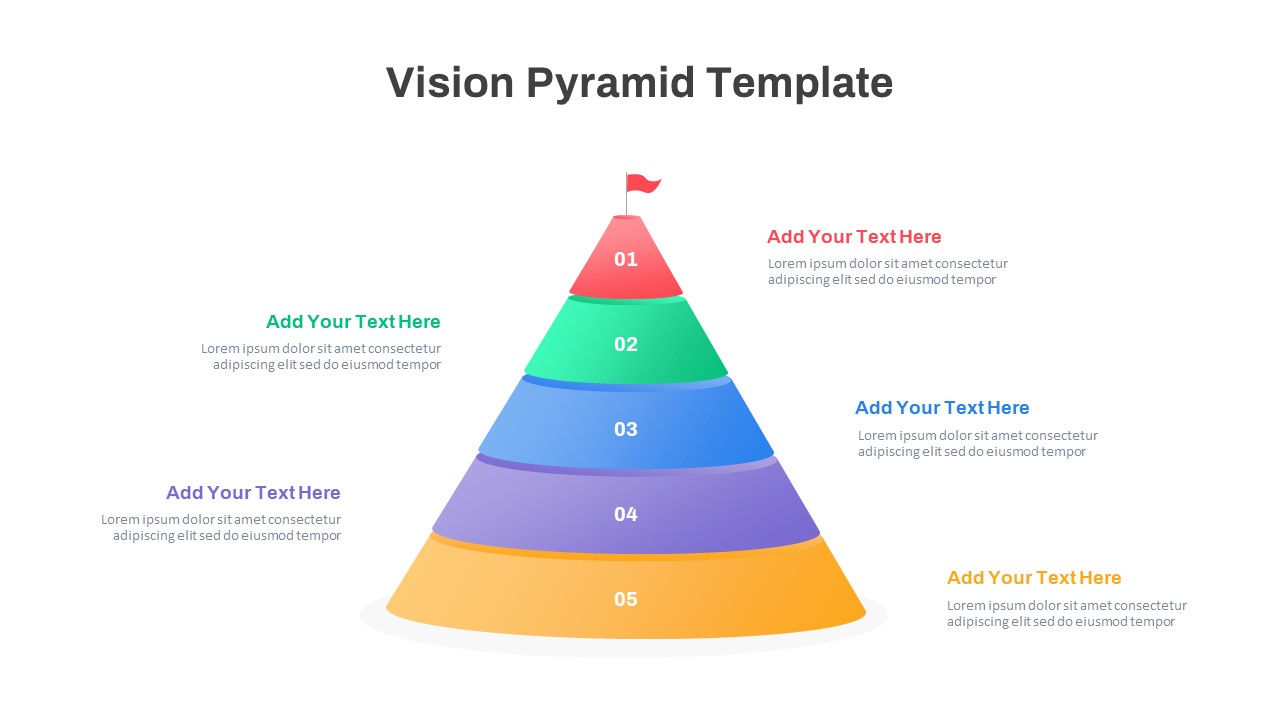
Five-Level Vision Pyramid Diagram Template for PowerPoint & Google Slides
Pyramid
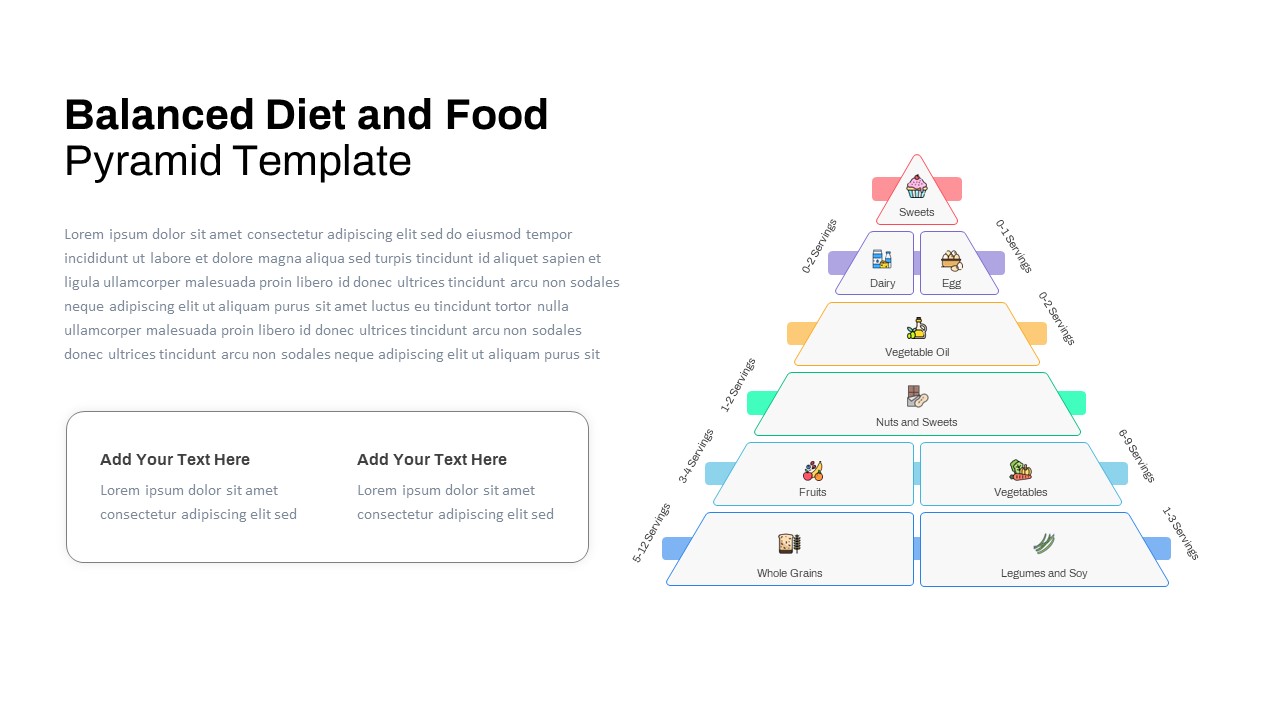
Free Balanced Diet and Food Pyramid Template for PowerPoint & Google Slides
Pyramid
Free
Free Ecological Energy Flow Pyramid Template for PowerPoint & Google Slides
Pyramid
Free
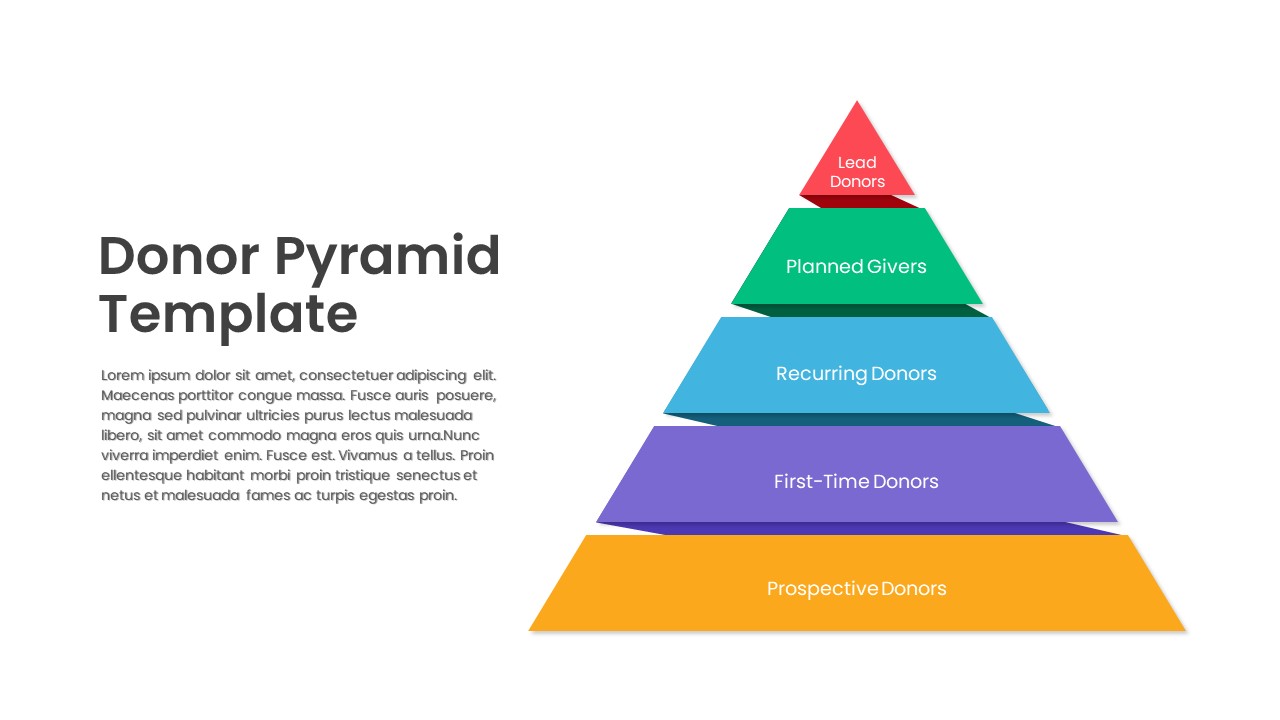
Five-Level Donor Pyramid Philanthropy Template for PowerPoint & Google Slides
Pyramid
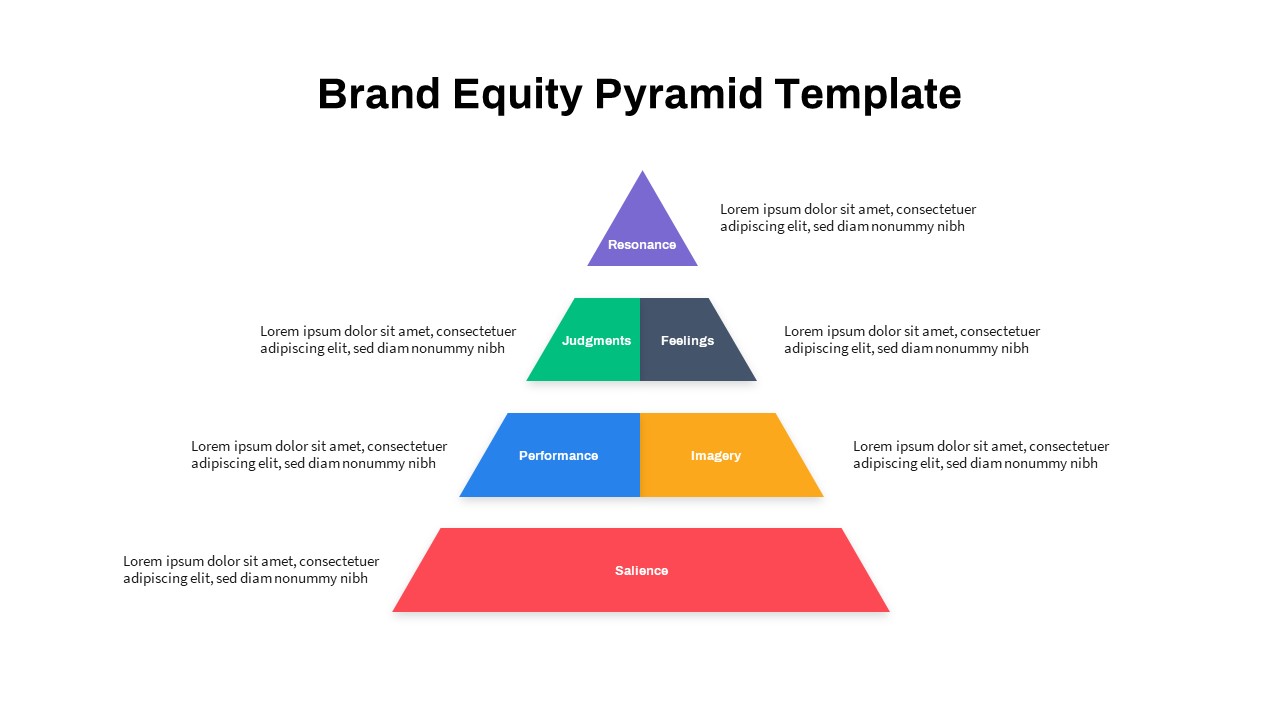
Strategic Brand Equity Pyramid Diagram Template for PowerPoint & Google Slides
Pyramid
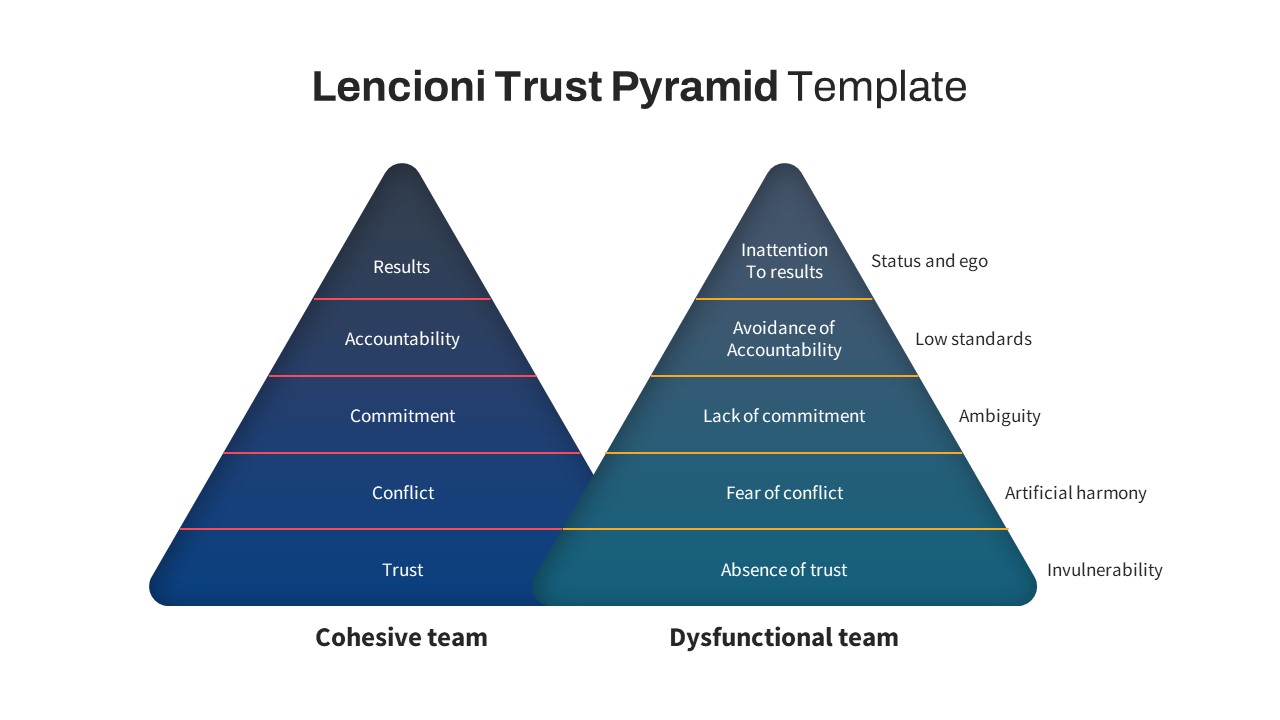
Lencioni Trust Pyramid Diagram Template for PowerPoint & Google Slides
Pyramid
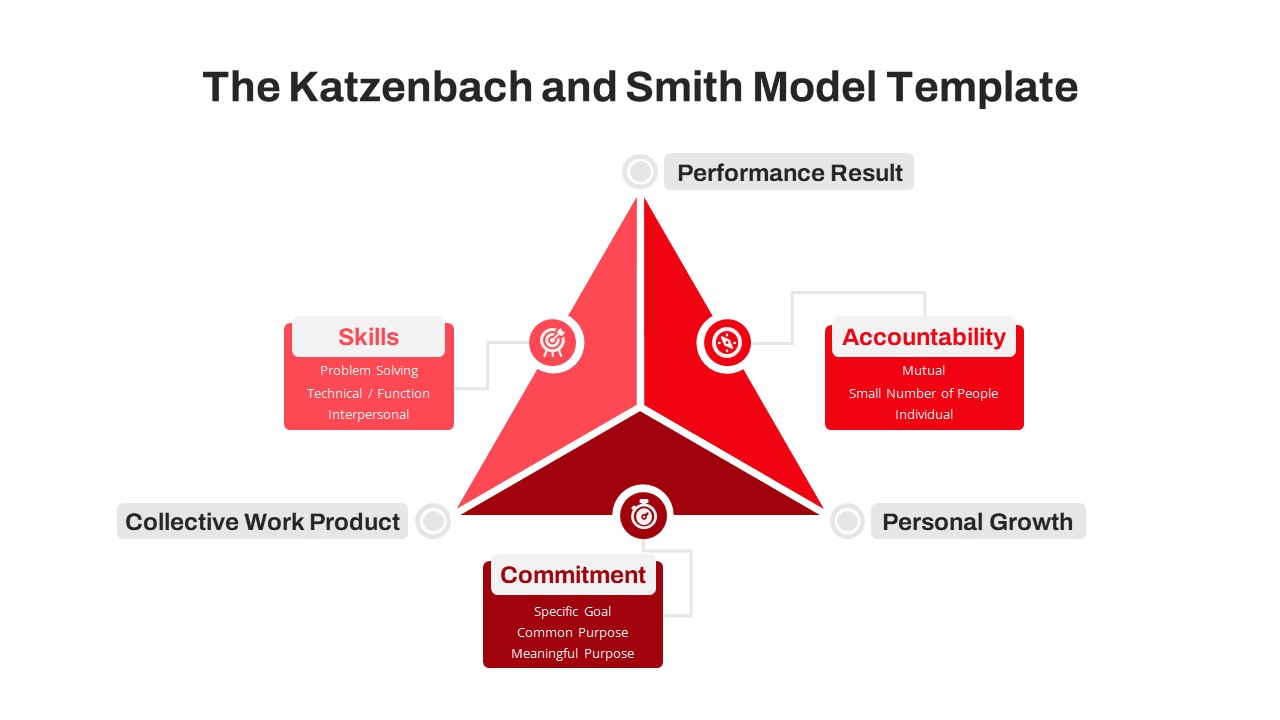
Katzenbach & Smith Model Pyramid Template for PowerPoint & Google Slides
Pyramid
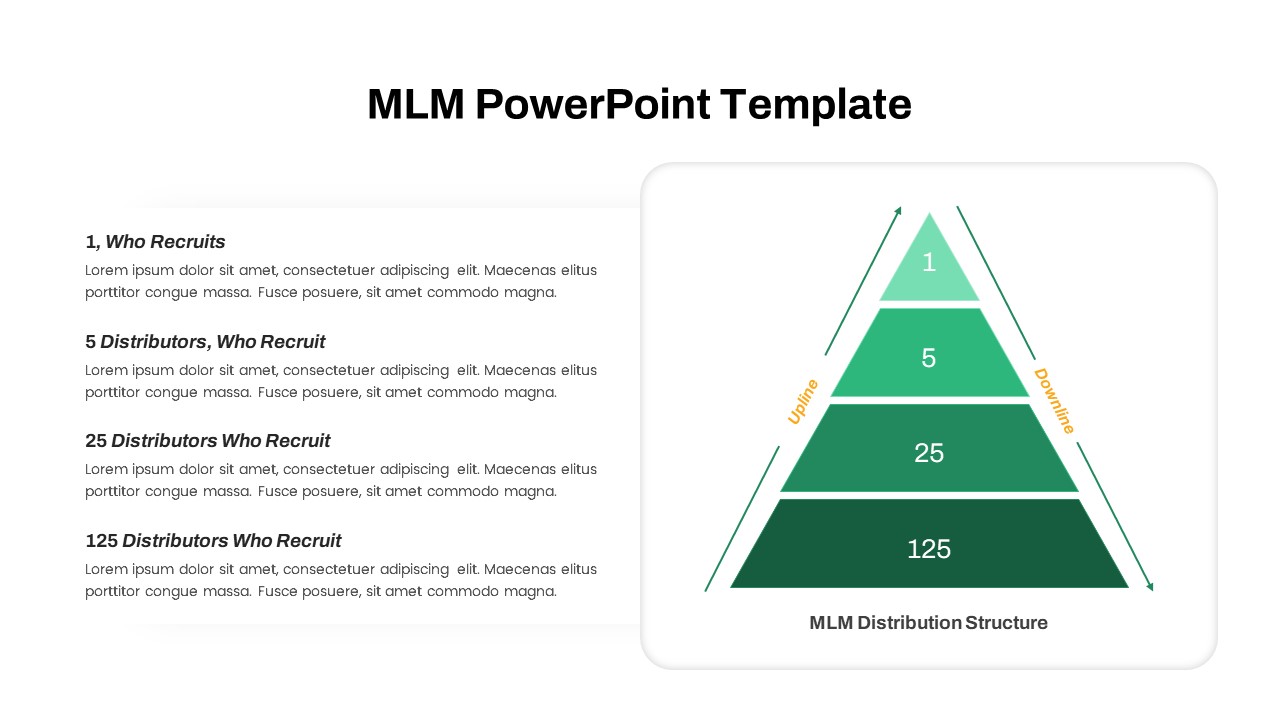
MLM Distribution Pyramid Diagram Template for PowerPoint & Google Slides
Business Models
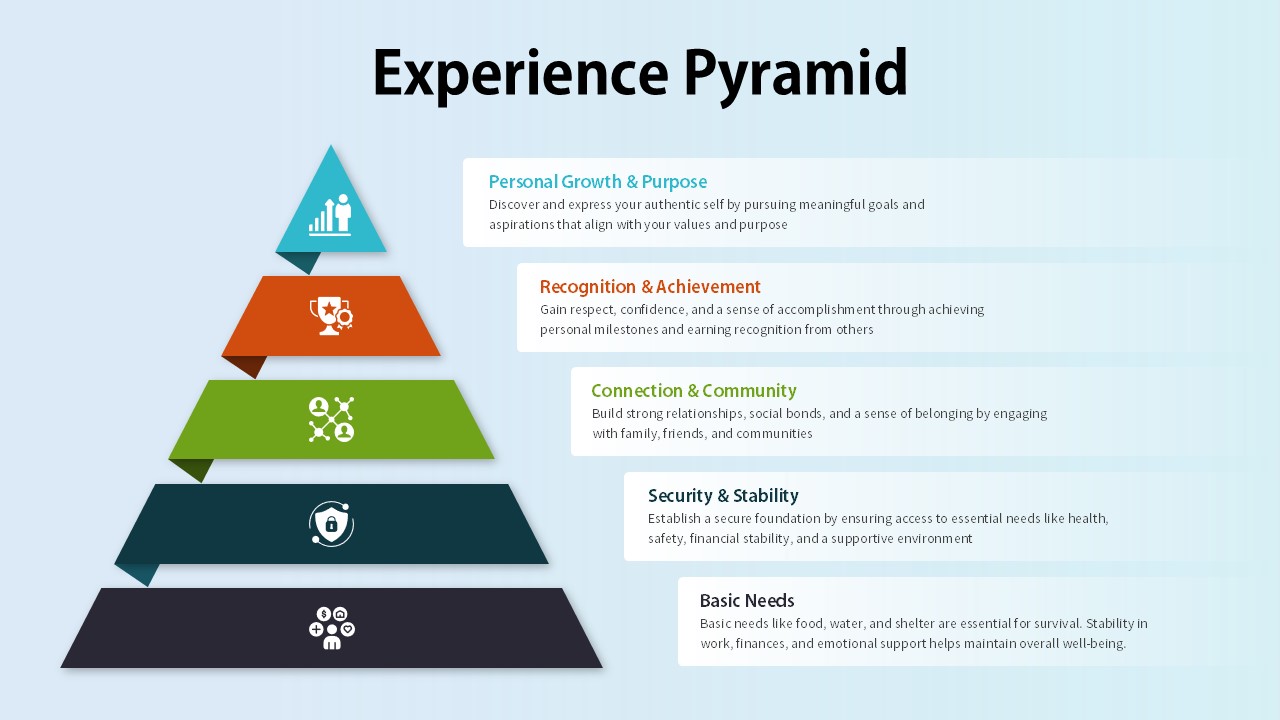
Experience Pyramid Hierarchy Diagram Template for PowerPoint & Google Slides
Pyramid
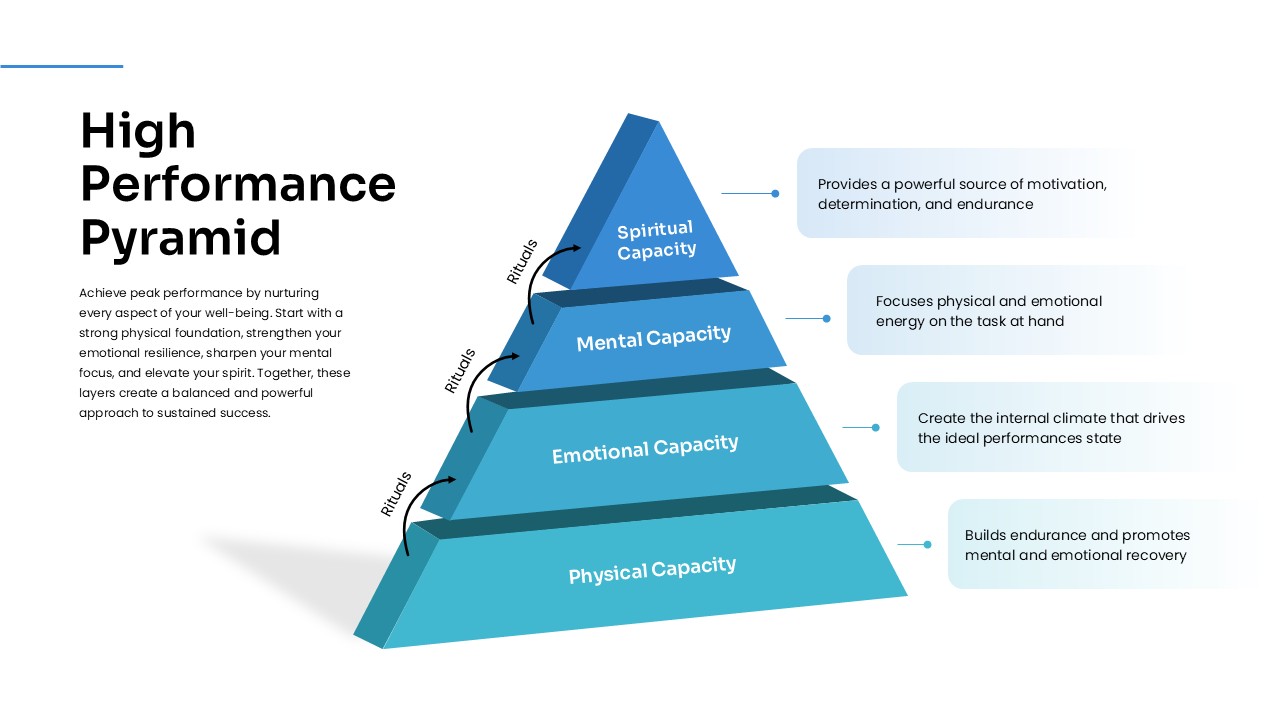
High Performance Pyramid Diagram Template for PowerPoint & Google Slides
Pyramid
Risk Management Framework Pyramid Template for PowerPoint & Google Slides
Risk Management
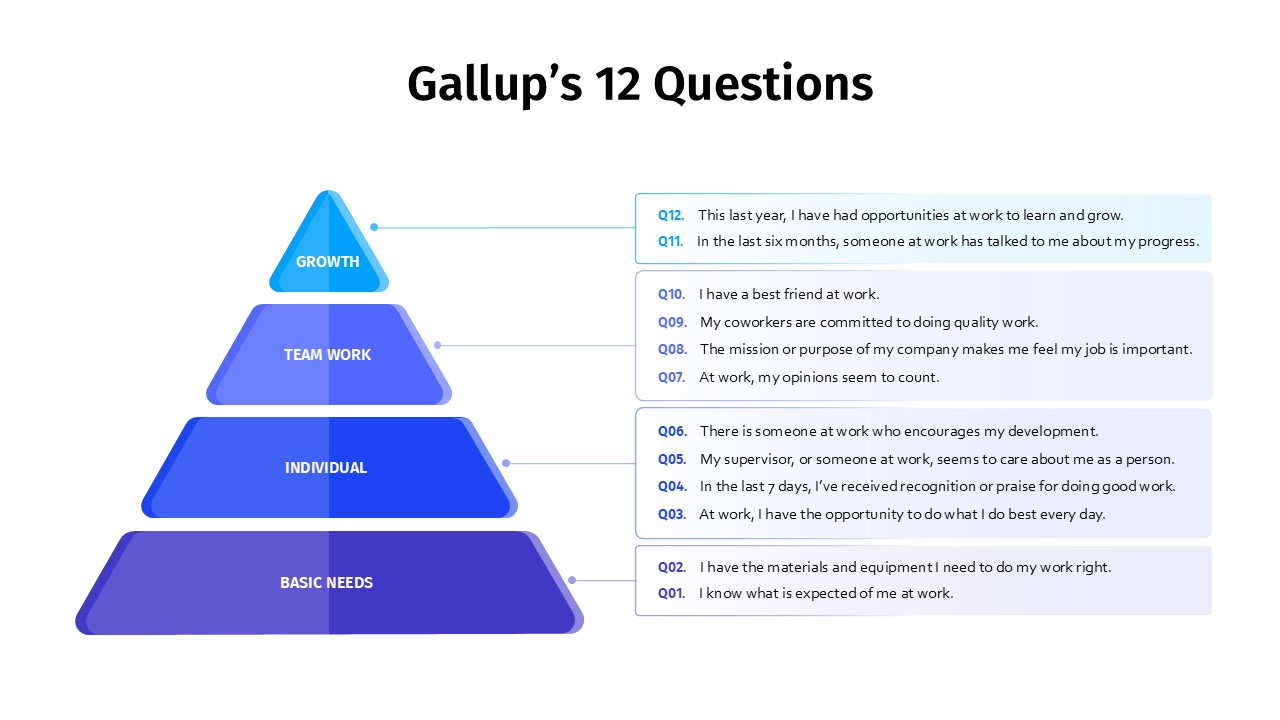
Gallup’s 12 Questions Engagement Pyramid Template for PowerPoint & Google Slides
Pyramid
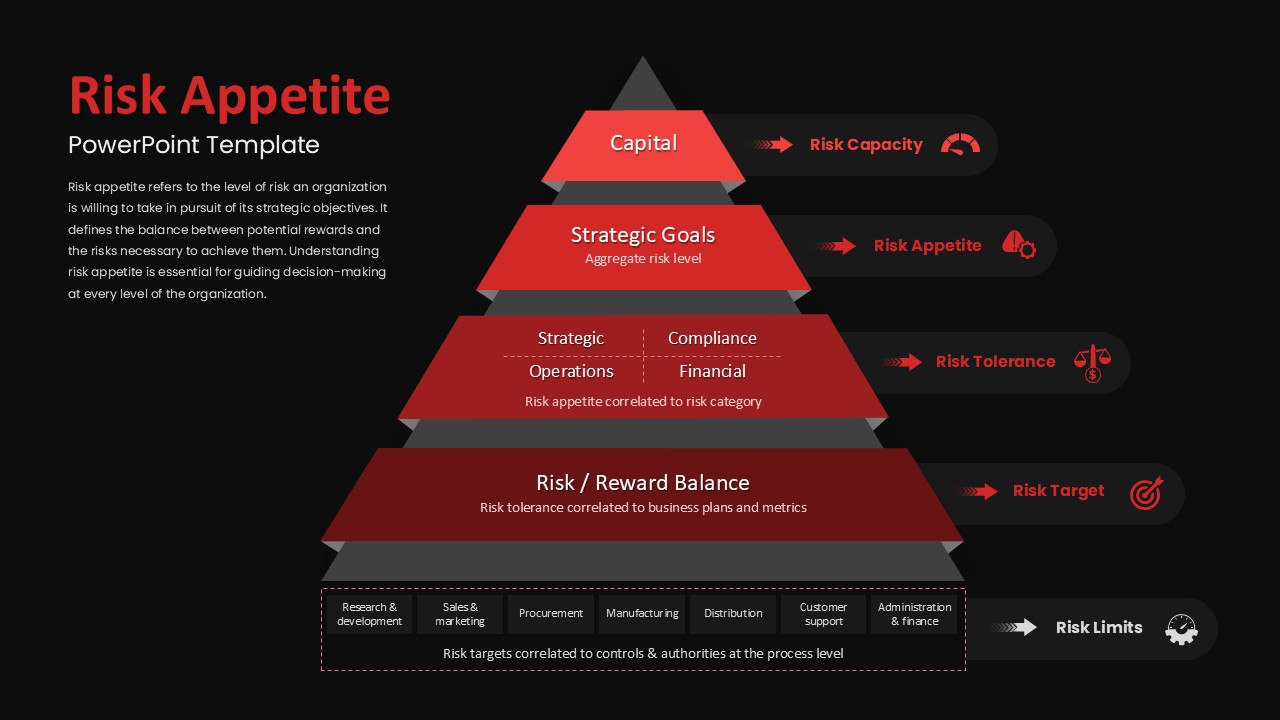
Risk Appetite Pyramid Framework Template for PowerPoint & Google Slides
Pyramid
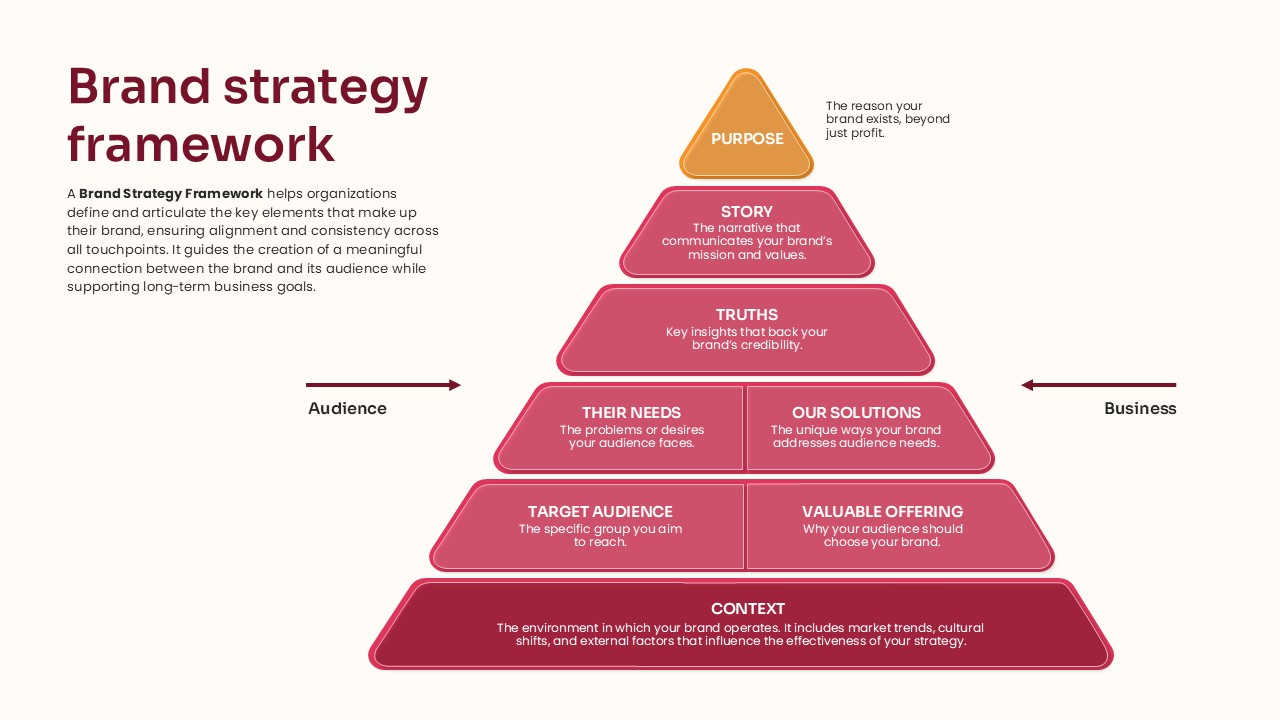
Pyramid Brand Strategy Framework Template for PowerPoint & Google Slides
Business Strategy
Data Governance Roles Pyramid Diagram Template for PowerPoint & Google Slides
Pyramid
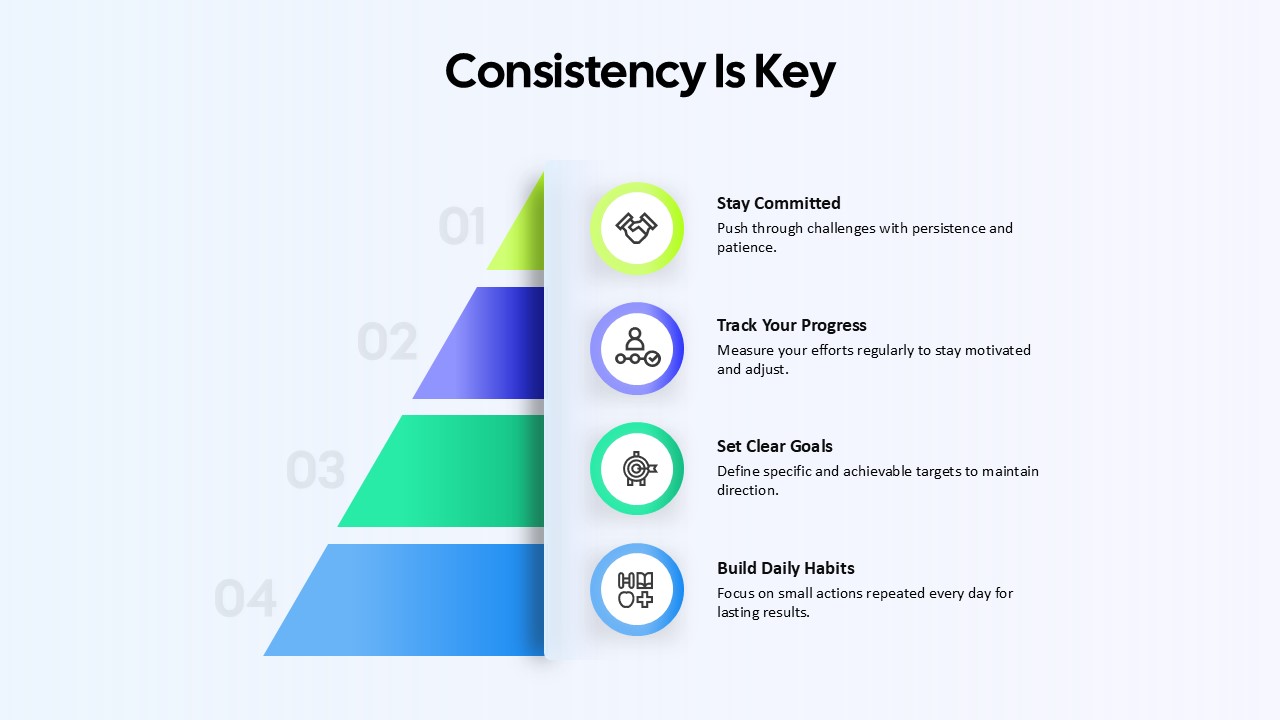
Consistency Is Key Four-Step Pyramid Template for PowerPoint & Google Slides
Process
Five-Stage Pyramid Template for PowerPoint & Google Slides
Pyramid
Freytag’s Pyramid Template for PowerPoint & Google Slides
Process
Four-Level Colorful Pyramid Diagram Template for PowerPoint & Google Slides
Pyramid
5 Level Hierarchy Pyramid Template for PowerPoint & Google Slides
Pyramid
Quad Chart Infographic Pack of 8 Slides Template for PowerPoint & Google Slides
Comparison Chart