Horizontal Bar Chart Slide with Icons Template for PowerPoint & Google Slides


Description
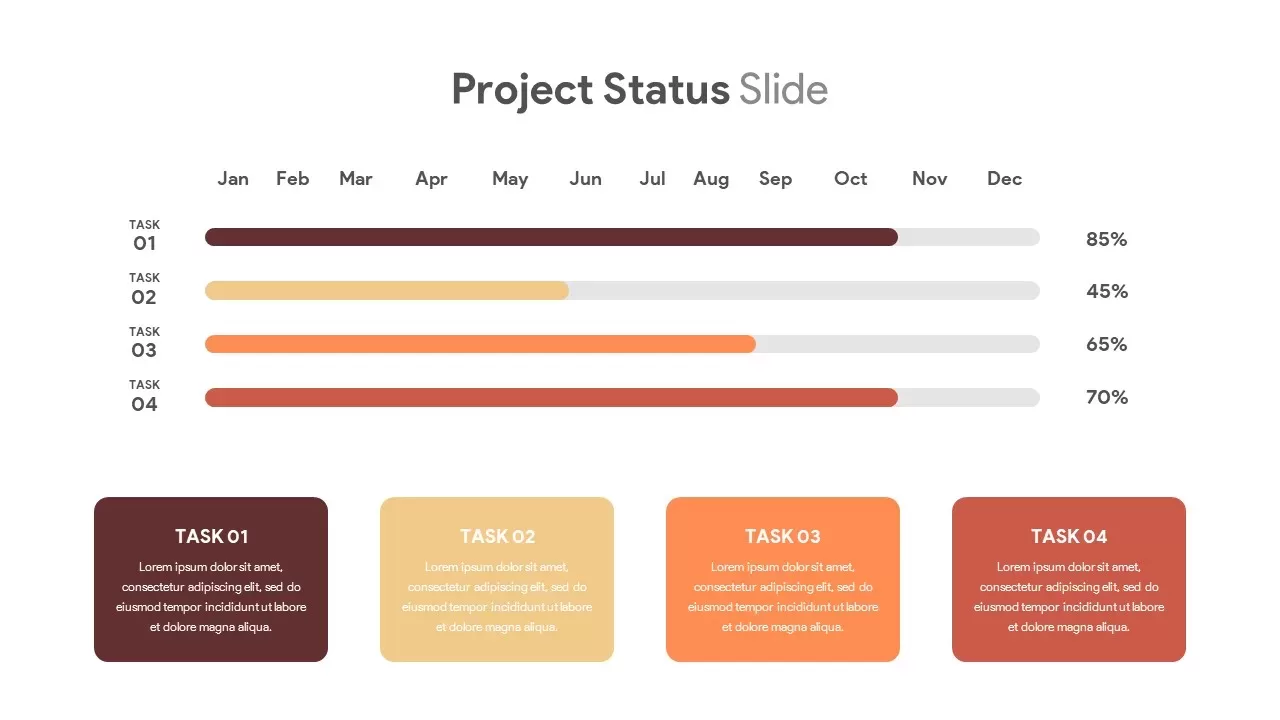
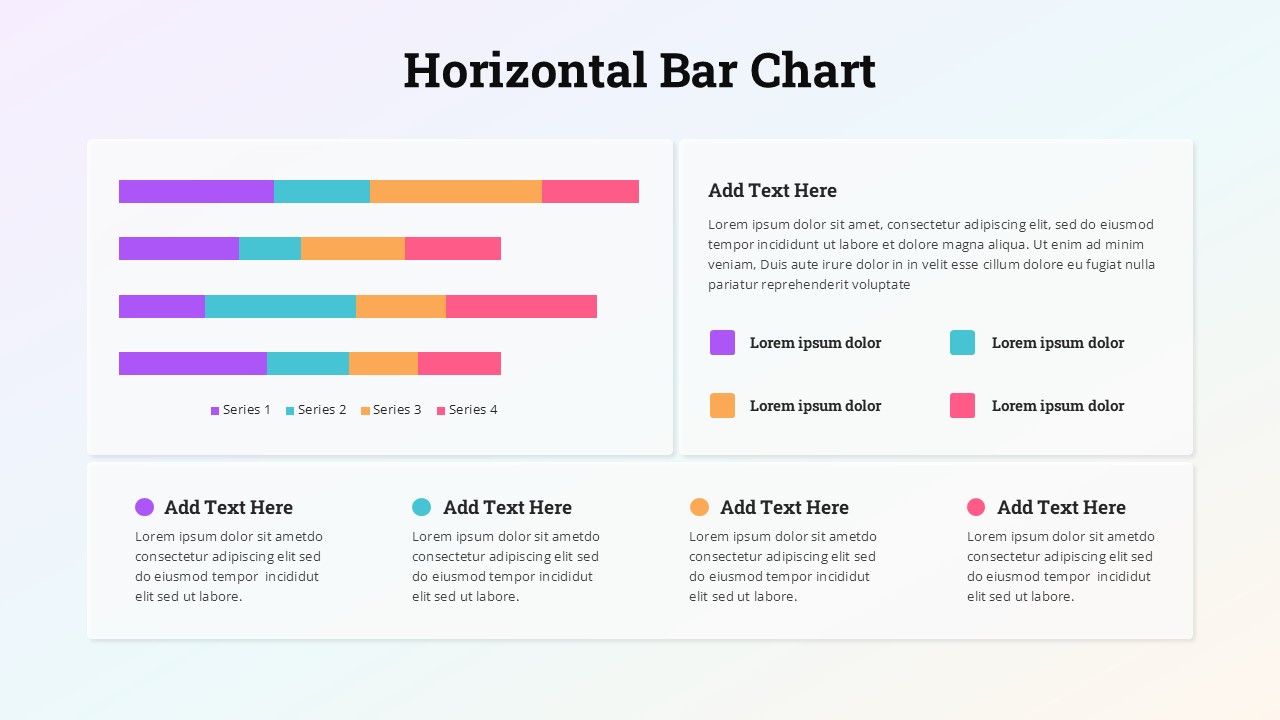
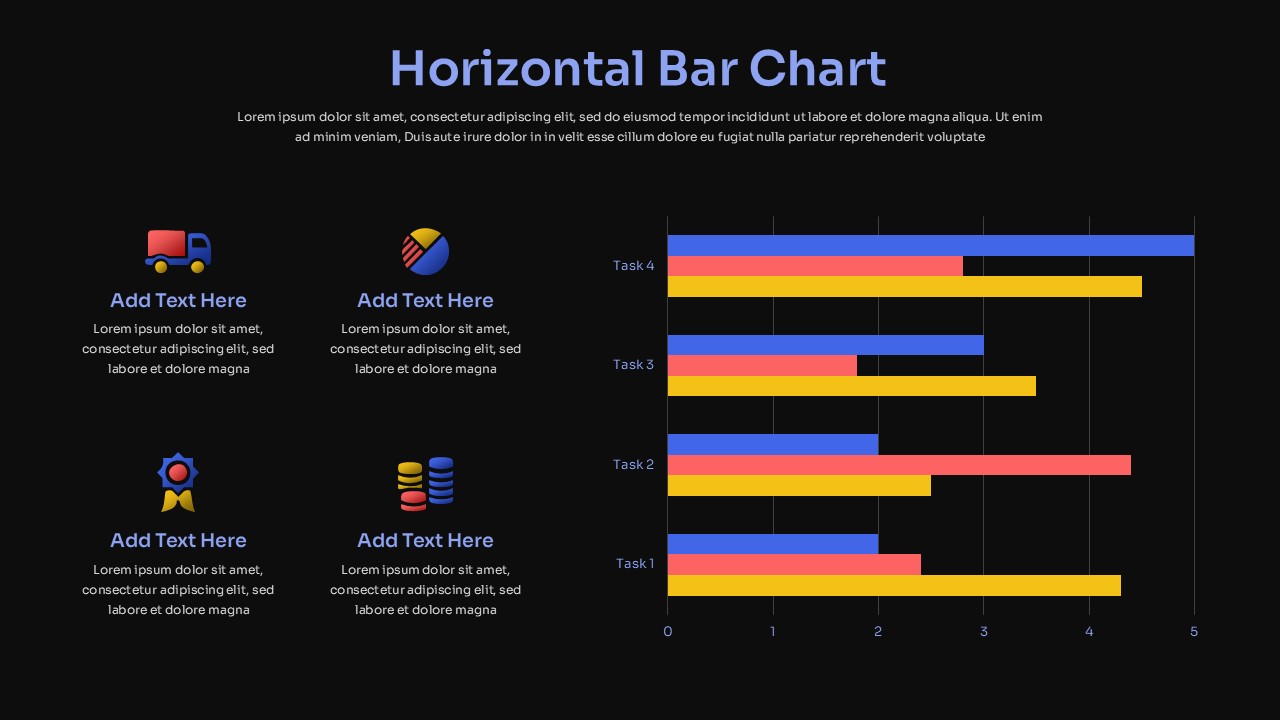
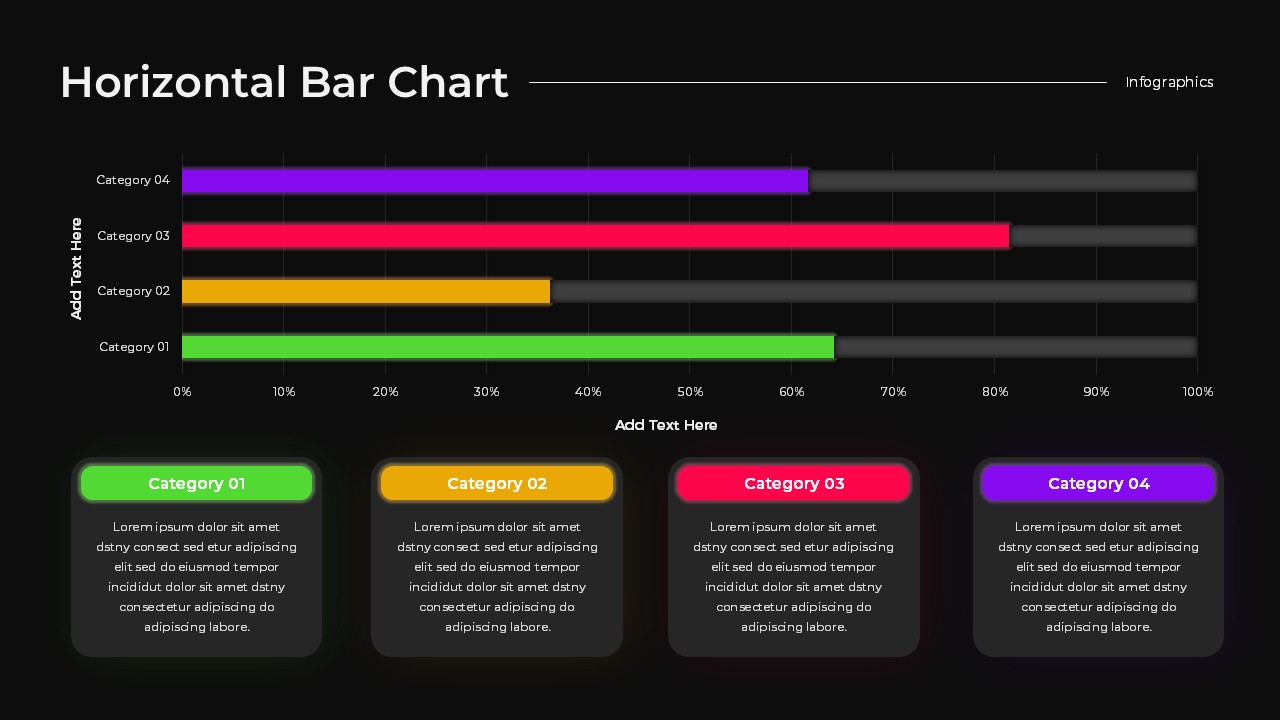
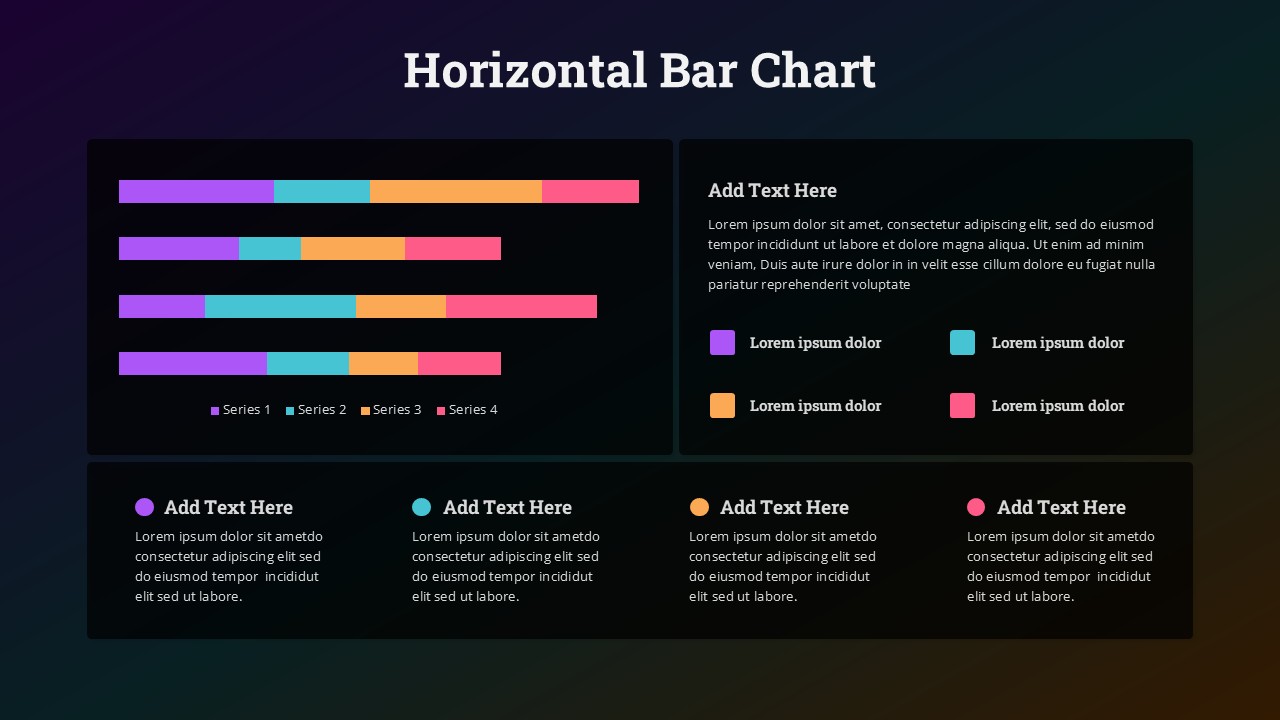
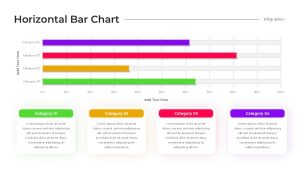
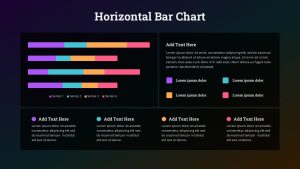
Leverage this versatile horizontal bar chart slide to visualize comparative metrics across multiple tasks with clear icon-coded segments and descriptive text placeholders. This template features a large chart area with three color-coded series bars for each of four tasks, enabling swift side-by-side performance analysis. On the left, four editable icons align with customizable labels and text blocks to highlight key categories or process steps. The clean, white background and crisp typography ensure high readability, while vector-based graphics and master slide integration allow you to adjust colors, swap icons, or modify data ranges in seconds. The chart includes customizable gridlines, axis labels, and percentage markers, giving you full control over scale, units, and visual emphasis. Optimized for both PowerPoint and Google Slides, this design maintains full resolution across devices and supports seamless branding alignment.
Whether you’re presenting project timelines, resource allocations, or survey results, the structured layout guides your audience’s focus toward critical insights. Simply replace placeholder text, update chart values, and insert your company logo to match brand guidelines. This slide’s intuitive design eliminates juggling multiple assets, reducing preparation time and formatting issues. This slide also provides integrated slide masters for rapid theme swaps, consistent typography, and color palette adjustments across your entire presentation. Leverage built-in infographic animations to reveal bars sequentially and maintain audience engagement. Use built-in data placeholders to animate bars or add trend callouts for dynamic storytelling. With straightforward customization controls, you can scale elements, adjust gridlines, or apply theme color variations without compromising visual harmony.
Engineered for business professionals seeking clarity and impact, this chart slide enhances stakeholder discussions, performance reviews, and strategic workshops. The combination of graphical data representation and icon-driven callouts drives engagement and reinforces your message.
Who is it for
Business analysts, project managers, and marketing teams will find this slide essential for presenting performance metrics, resource planning, and stakeholder updates. C-level executives and consultants can leverage it during board meetings or strategic workshops to illustrate data-driven insights effectively.
Other Uses
Beyond performance reviews, repurpose this slide for training modules, survey result presentations, sales pipeline overviews, or budget allocation breakdowns. Adapt icons and labels to showcase competitive analysis, educational outcomes, or departmental KPIs, making it a versatile asset across industries.
Login to download this file

Item ID
SB04720
Related Templates

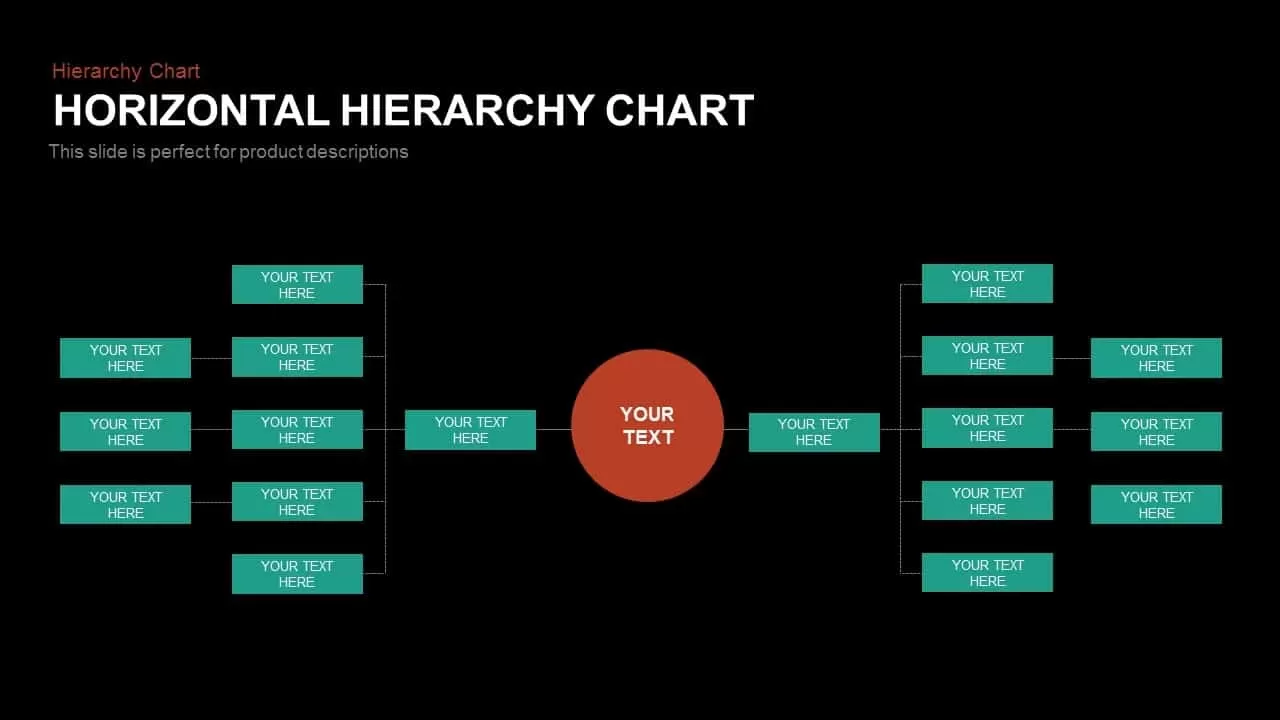
Horizontal Org Chart template for PowerPoint & Google Slides
Org Chart
Horizontal Multi-Level Hierarchy Chart template for PowerPoint & Google Slides
Org Chart
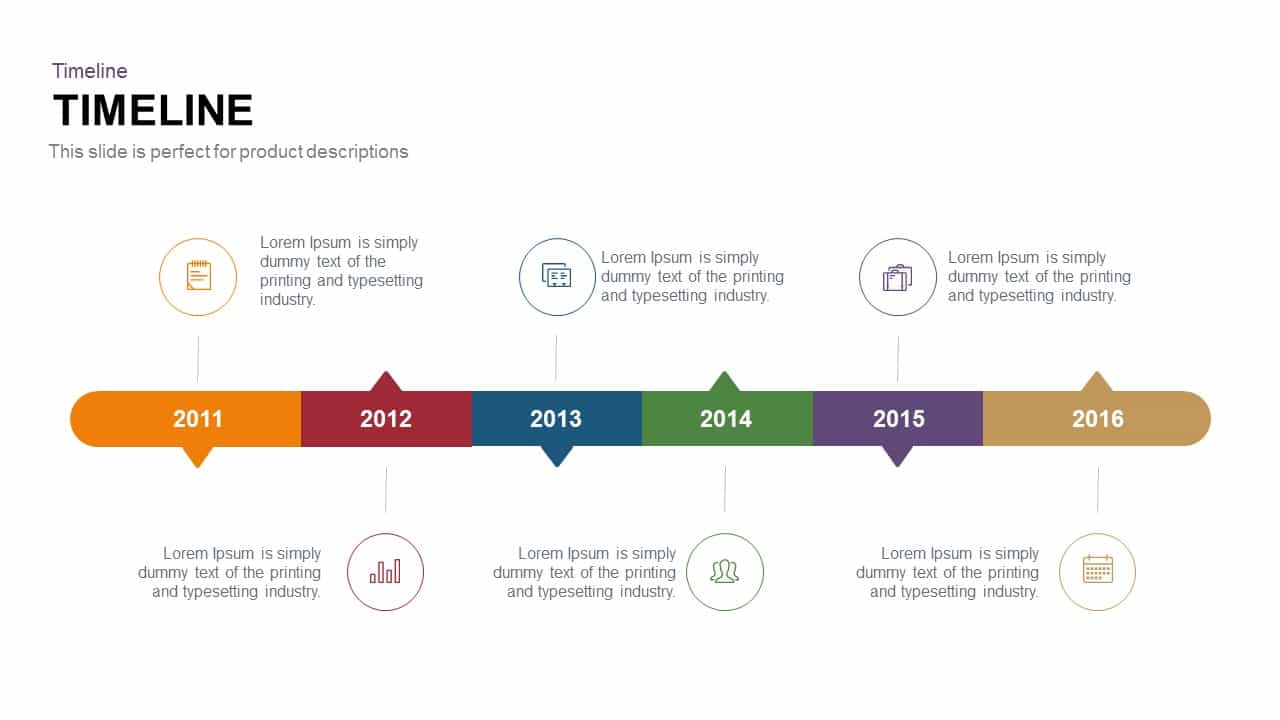
Five-Phase Horizontal Timeline Chart Template for PowerPoint & Google Slides
Timeline
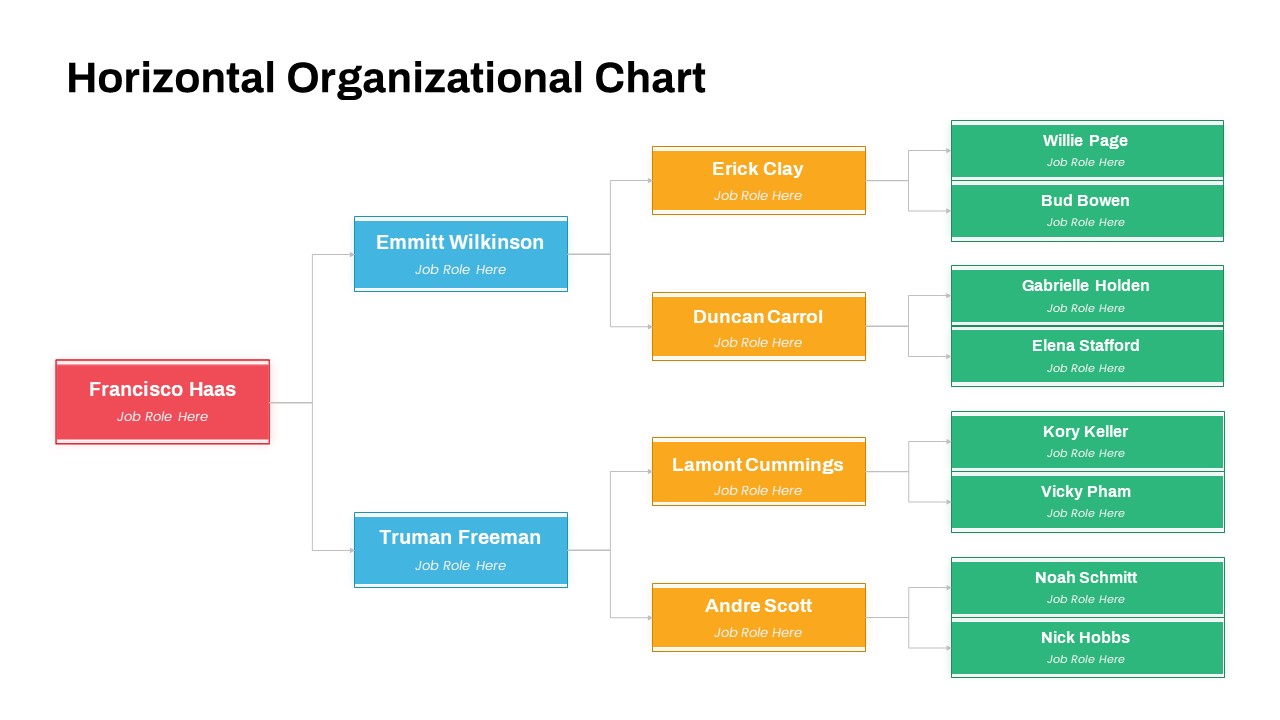
Horizontal Organizational Chart Template for PowerPoint & Google Slides
Org Chart
Horizontal Organizational Chart Template for PowerPoint & Google Slides
Org Chart
Multi-Series Line Chart with Icons Template for PowerPoint & Google Slides
Comparison Chart
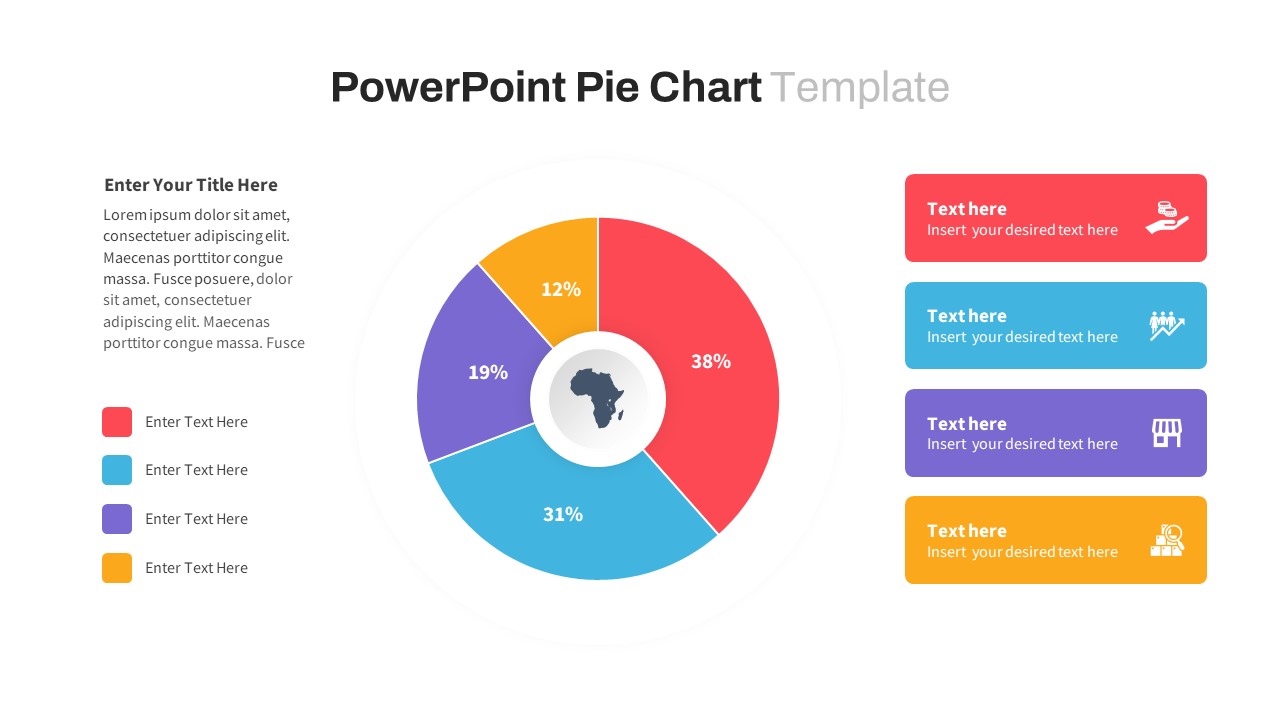
Segmented Pie Chart Infographic with Icons for PowerPoint & Google Slides
Pie/Donut
Bar Data Chart Slide for PowerPoint & Google Slides
Bar/Column
Bar Chart Sample template for PowerPoint & Google Slides
Bar/Column
Creative Data Analysis Bar Chart template for PowerPoint & Google Slides
Bar/Column
3D Bar Chart Data Infographics Template for PowerPoint & Google Slides
Bar/Column
Creative Bar Chart template for PowerPoint & Google Slides
Charts
Comparison Bar Chart template for PowerPoint & Google Slides
Comparison Chart
Three-Year Bar Chart template for PowerPoint & Google Slides
Charts
3D Cylinder Bar Chart Template for PowerPoint & Google Slides
Bar/Column
Pencil Bar Chart Data Analysis Template for PowerPoint & Google Slides
Bar/Column

Monthly Reports Bar Chart template for PowerPoint & Google Slides
Bar/Column

Colorful Radial Bar Chart Template for PowerPoint & Google Slides
Bar/Column
Interactive Product Comparison Bar Chart Template for PowerPoint & Google Slides
Bar/Column
For and Against Vote Count Bar Chart Template for PowerPoint & Google Slides
Bar/Column
Entertainment Industry Revenue Bar Chart Template for PowerPoint & Google Slides
Bar/Column
Distracting Factors at Work Bar Chart Template for PowerPoint & Google Slides
Bar/Column
Statistics Infographic & KPI Bar Chart Template for PowerPoint & Google Slides
Bar/Column
Multi-Series Stacked Bar Chart Template for PowerPoint & Google Slides
Bar/Column
Monthly Recurring Revenue KPI Bar Chart Template for PowerPoint & Google Slides
Bar/Column
Combination Bar and Line Chart Template for PowerPoint & Google Slides
Bar/Column
Animated Clustered Bar Chart Template for PowerPoint & Google Slides
Bar/Column
Animated Stacked Bar Chart Template for PowerPoint & Google Slides
Bar/Column
Simple Bar Chart Data Visualization Template for PowerPoint & Google Slides
Bar/Column
Clustered Bar Chart Comparison Template for PowerPoint & Google Slides
Bar/Column
Waterfall Bar Chart Analysis Template for PowerPoint & Google Slides
Bar/Column
Business Timeline Comparison Bar Chart Template for PowerPoint & Google Slides
Comparison Chart
Year-over-Year Stacked Gender Bar Chart Template for PowerPoint & Google Slides
Bar/Column
Mirror Bar Chart Comparison Template for PowerPoint & Google Slides
Bar/Column
Dynamic Bar-of-Pie Chart Comparison Template for PowerPoint & Google Slides
Pie/Donut
Expanding Margins Analysis Bar Chart Template for PowerPoint & Google Slides
Charts
Quarterly Revenue Comparison Bar Chart Template for PowerPoint & Google Slides
Bar/Column
Quarterly Sales Review Bar Chart Template for PowerPoint & Google Slides
Bar/Column
Data Analysis Bar Chart with Insights Template for PowerPoint & Google Slides
Bar/Column
Free
Two-Option Bar Chart Comparison Table Template for PowerPoint & Google Slides
Comparison
Bar Gantt Chart Template for PowerPoint & Google Slides
Gantt Chart
USA Map with Bar Chart Template for PowerPoint & Google Slides
World Maps
Sales Bar Chart for PowerPoint & Google Slides
Bar/Column

Radial Bar Chart Diagram for PowerPoint & Google Slides
Bar/Column
Stacked Bar Chart for PowerPoint & Google Slides
Bar/Column
100% Stacked Bar Chart for PowerPoint & Google Slides
Bar/Column
Horizontal Timeline Infographic Template for PowerPoint & Google Slides
Timeline
Horizontal Timeline Project Status Template for PowerPoint & Google Slides
Project Status
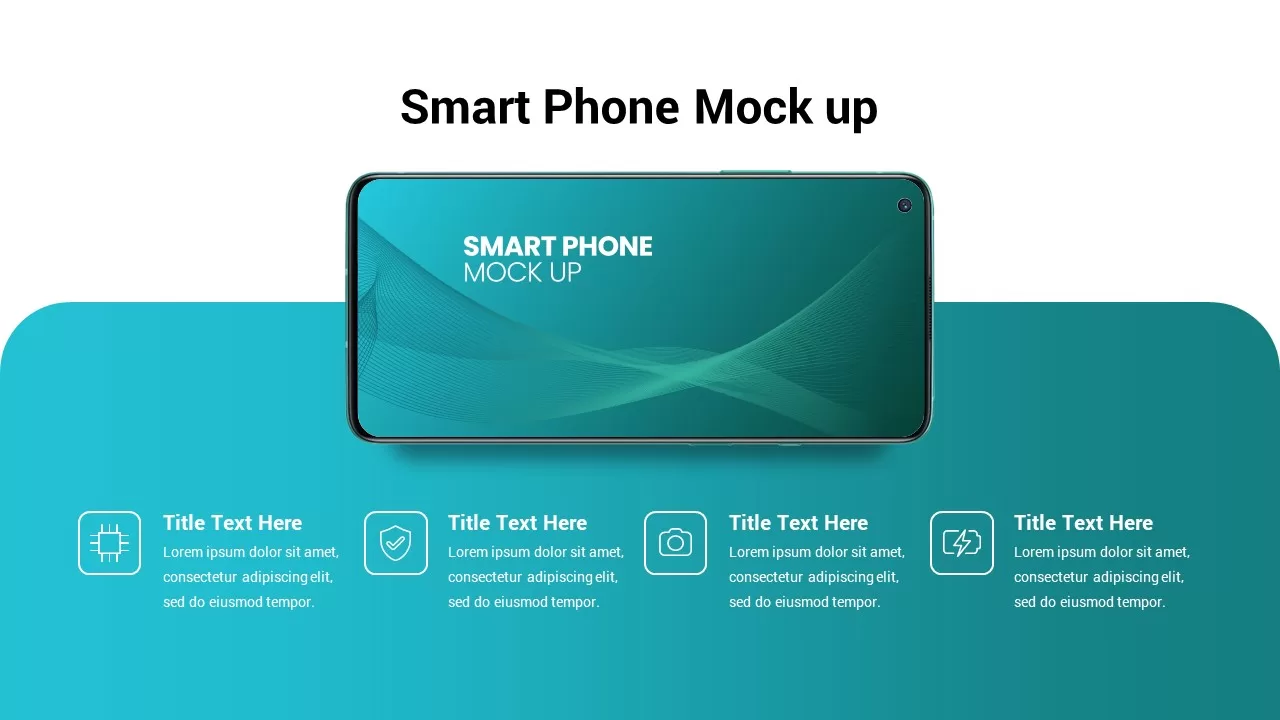
Horizontal Smartphone Feature Highlights Template for PowerPoint & Google Slides
Graphics
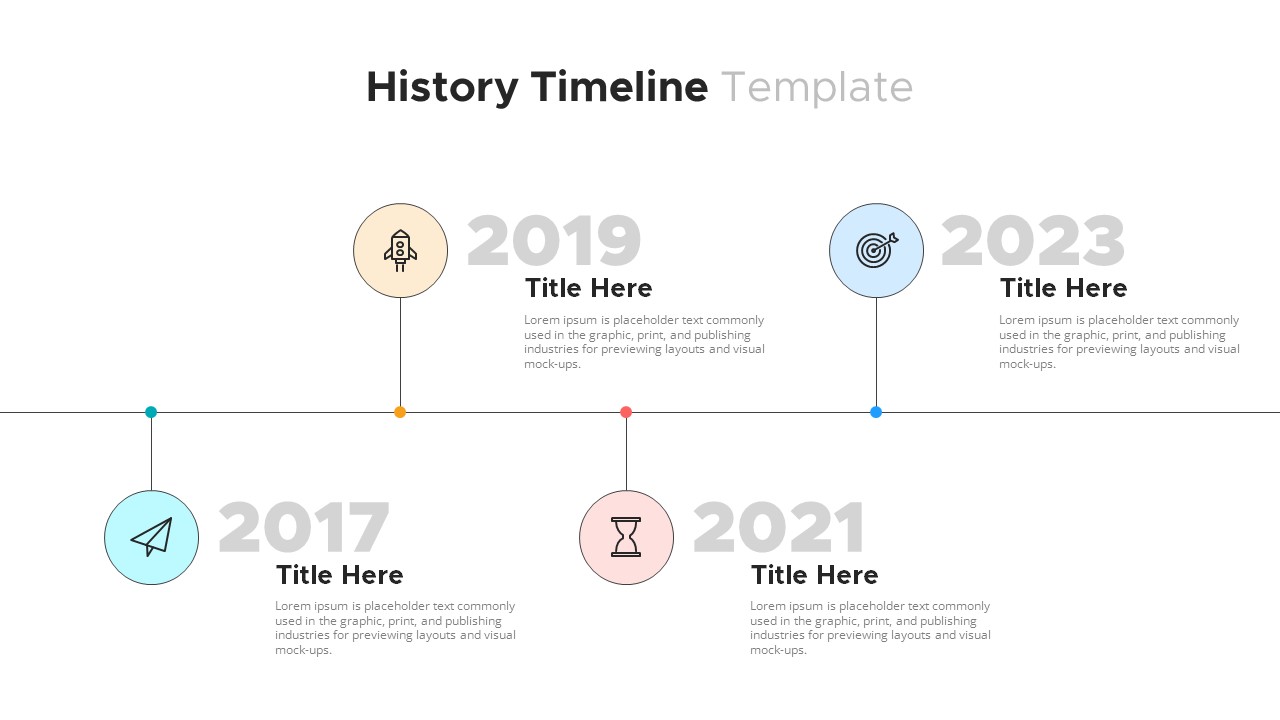
Modern Horizontal History Timeline Template for PowerPoint & Google Slides
Timeline
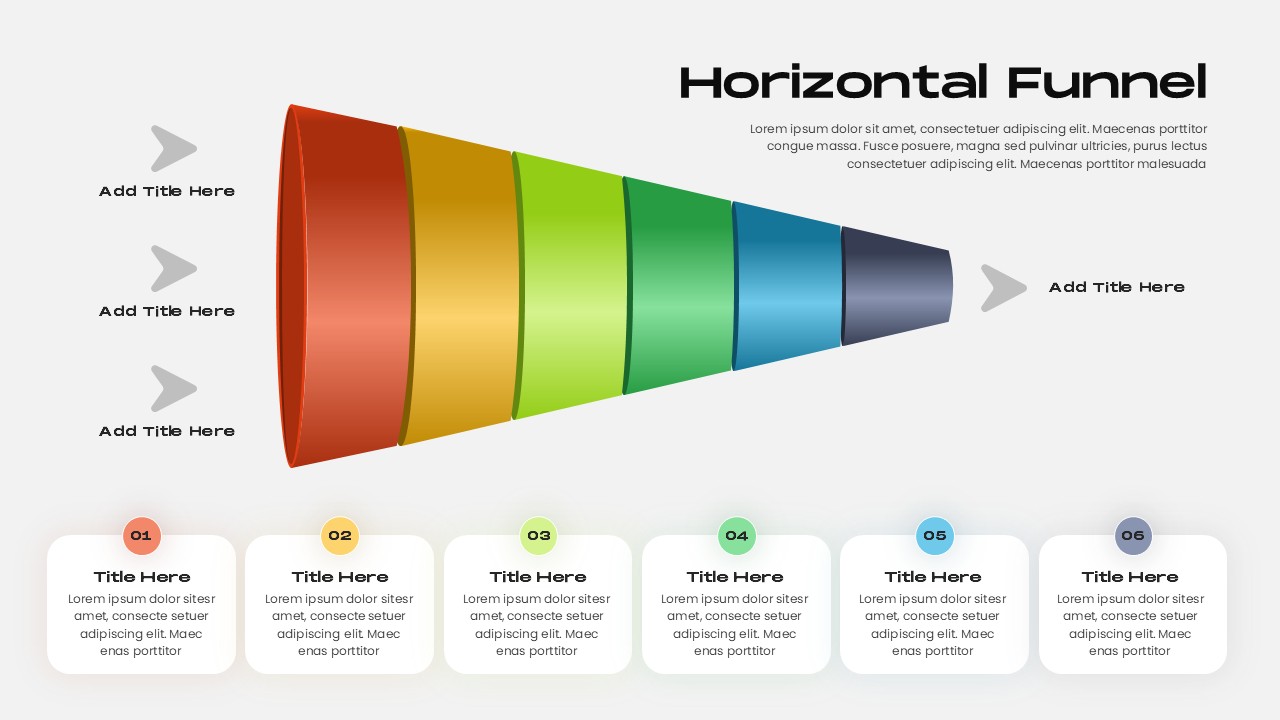
Horizontal Funnel Diagram Process Template for PowerPoint & Google Slides
Funnel
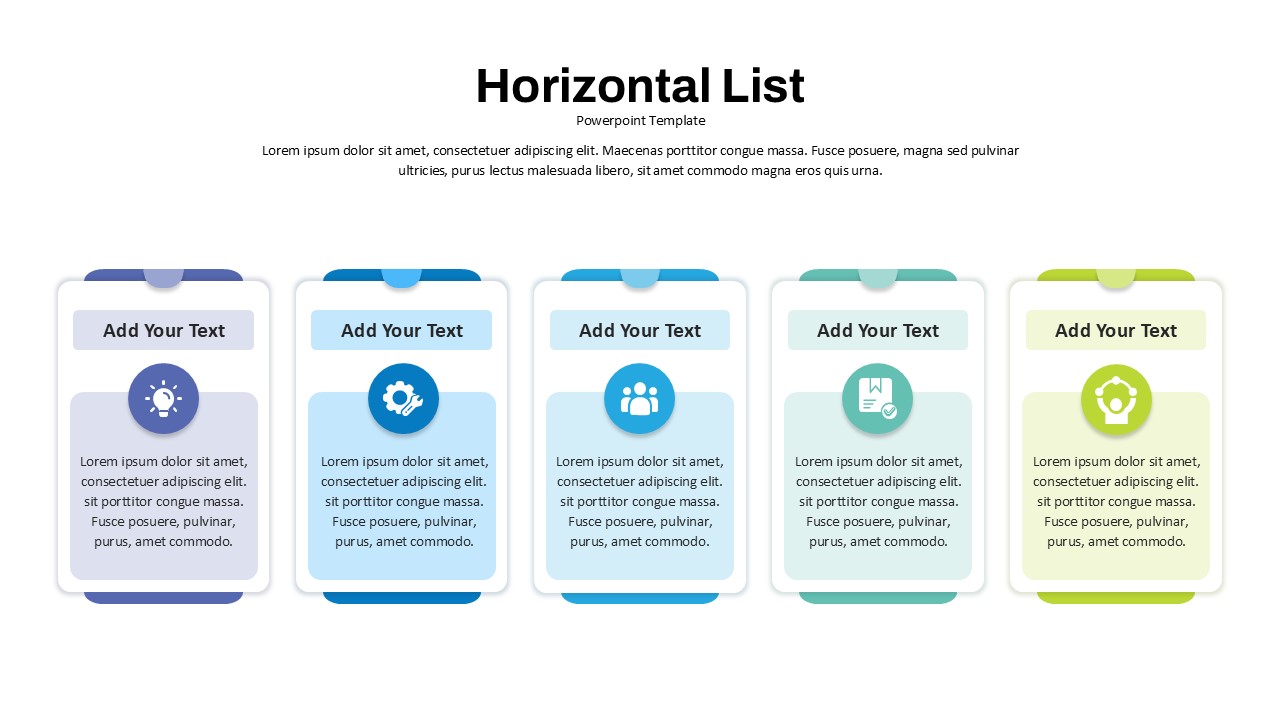
Modern Four-Step Horizontal List Template for PowerPoint & Google Slides
Process
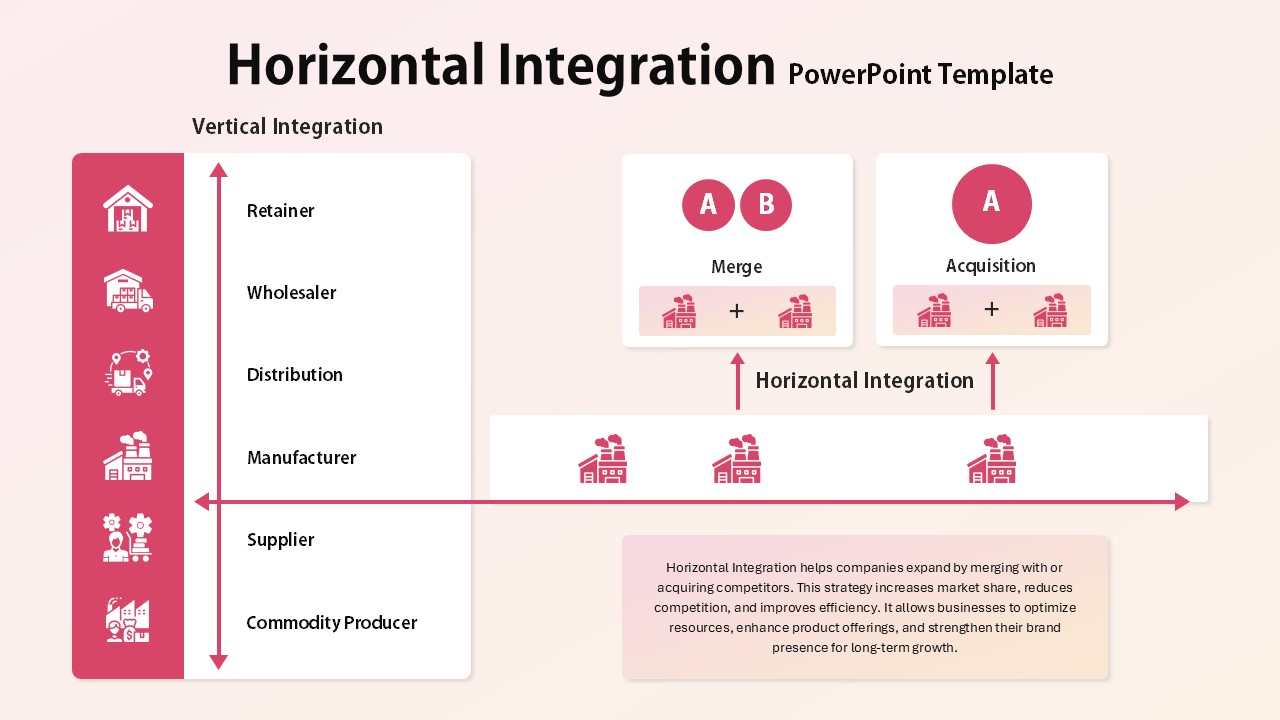
Horizontal Integration Strategy Template for PowerPoint & Google Slides
Competitor Analysis
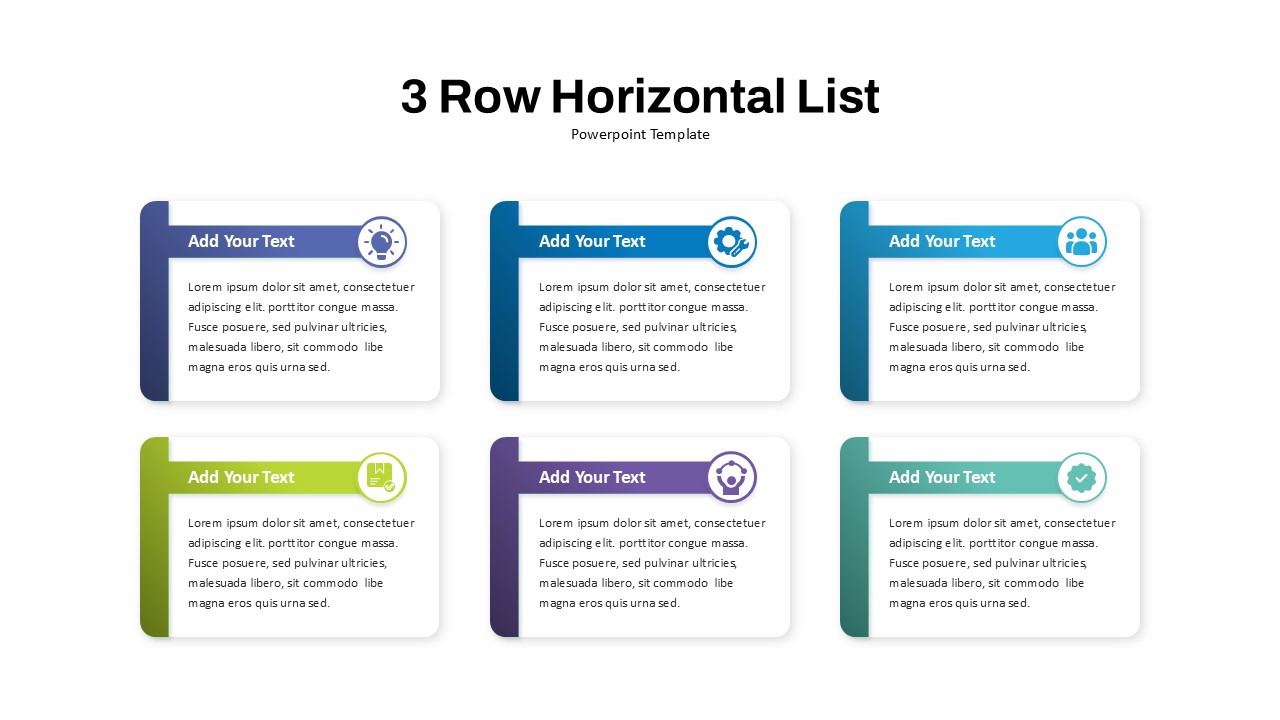
Six-Item Horizontal List Infographic Template for PowerPoint & Google Slides
Process
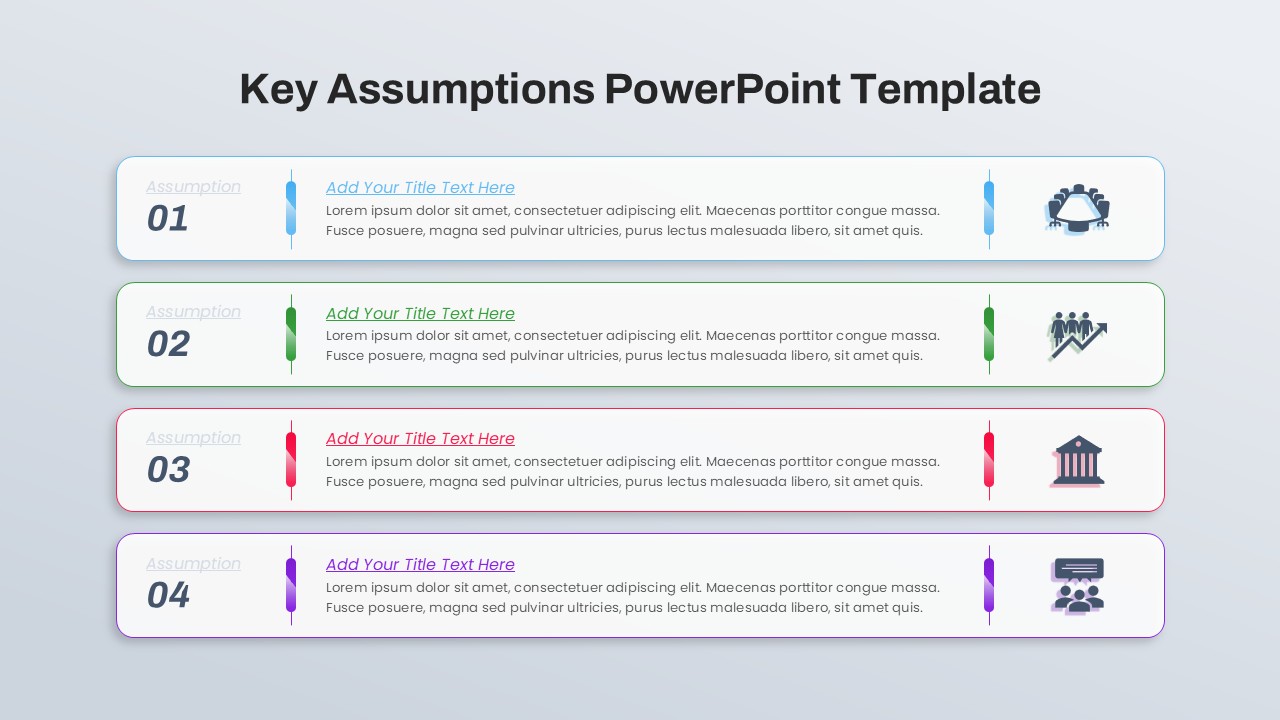
Key Assumptions Horizontal List Diagram Template for PowerPoint & Google Slides
Business Plan
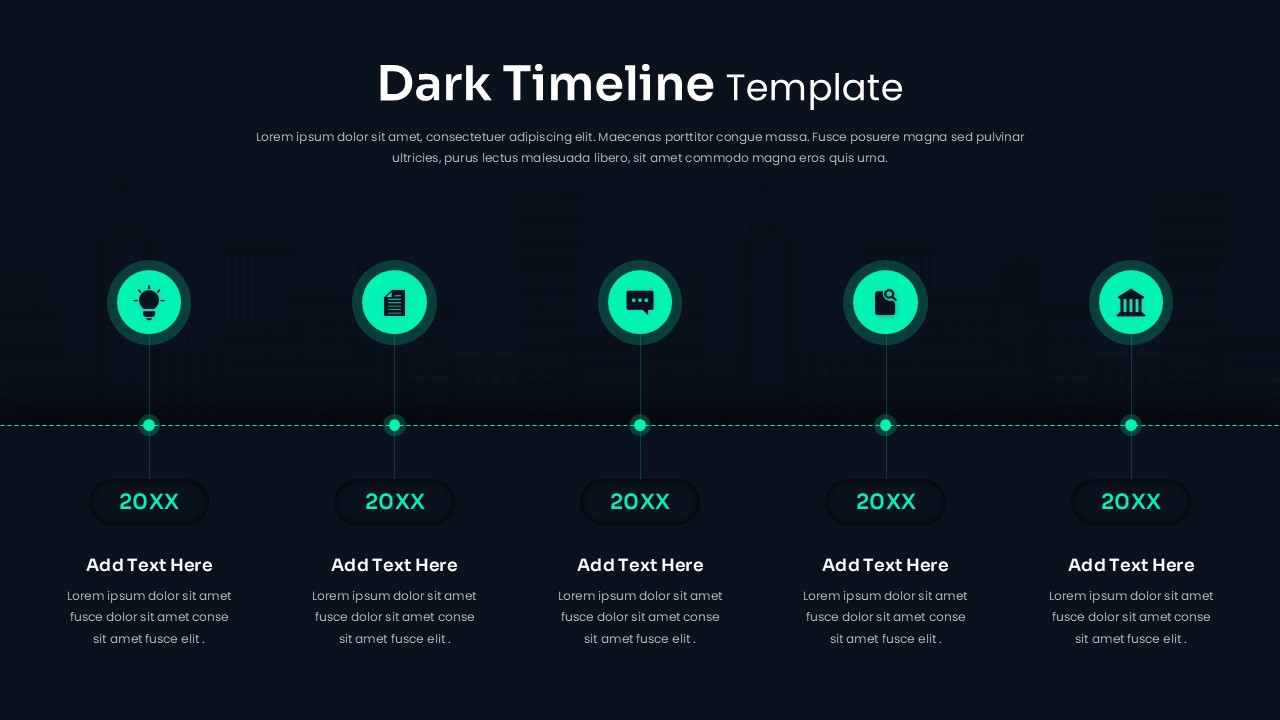
Dark Horizontal Timeline Infographic Template for PowerPoint & Google Slides
Timeline
Horizontal Chevron Timeline Template for PowerPoint & Google Slides
Timeline
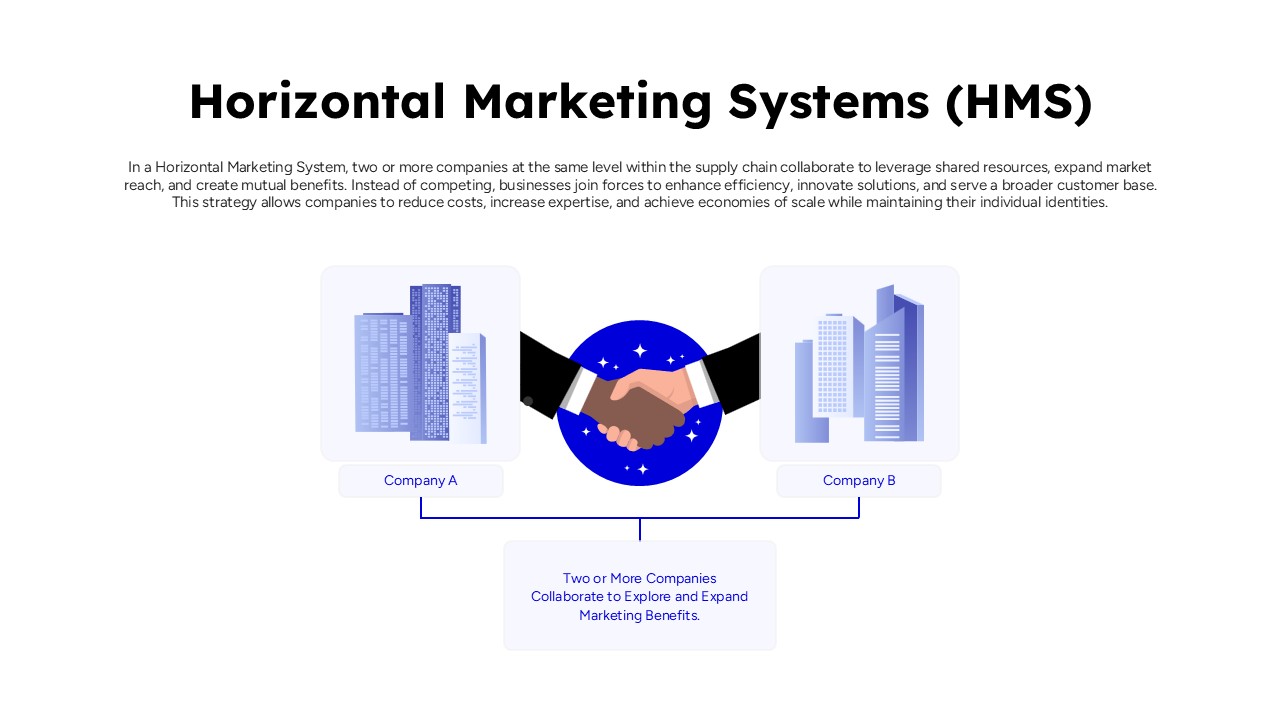
Horizontal Marketing Systems Template for PowerPoint & Google Slides
Business Strategy
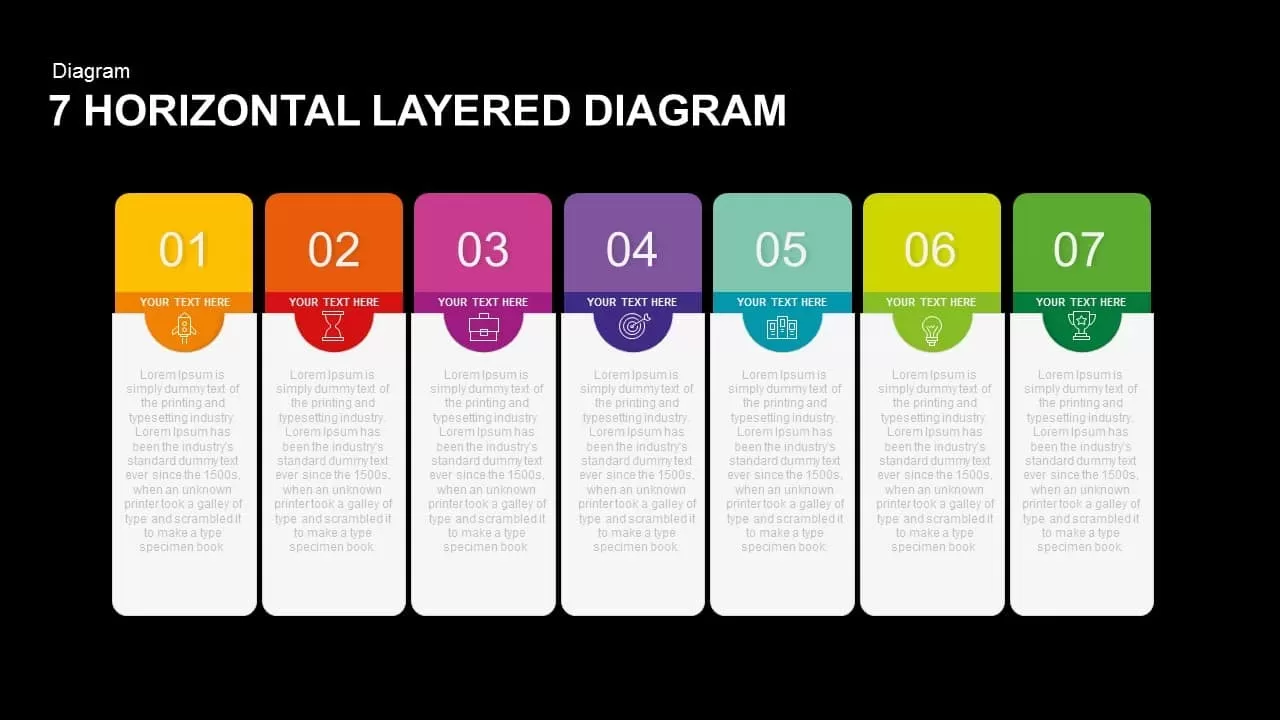
7 Horizontal Layered Diagram for PowerPoint & Google Slides
Process
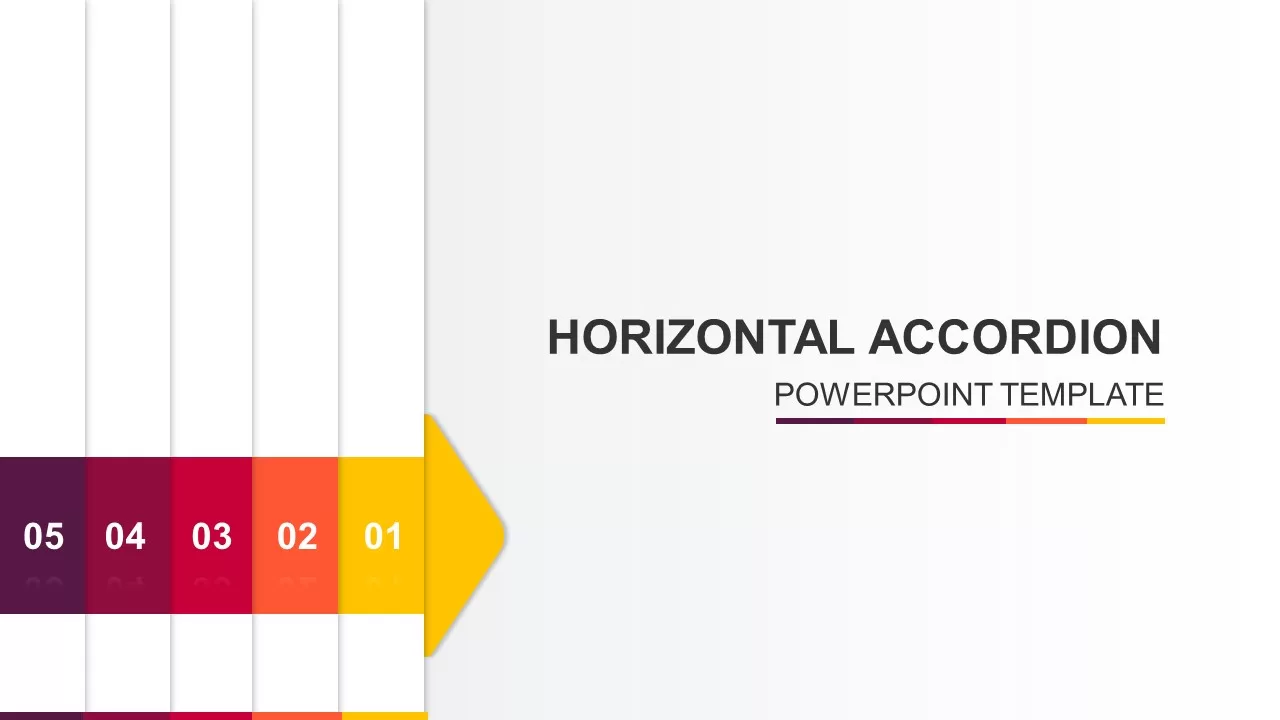
Horizontal Accordion Animated for PowerPoint & Google Slides
Business
Comprehensive Social Media Icons Slide Template for PowerPoint & Google Slides
Advertising
Developer Icons Metaphor Slide Template for PowerPoint & Google Slides
Software Development
Modern Accomplishment Slide with Icons Template for PowerPoint & Google Slides
Business
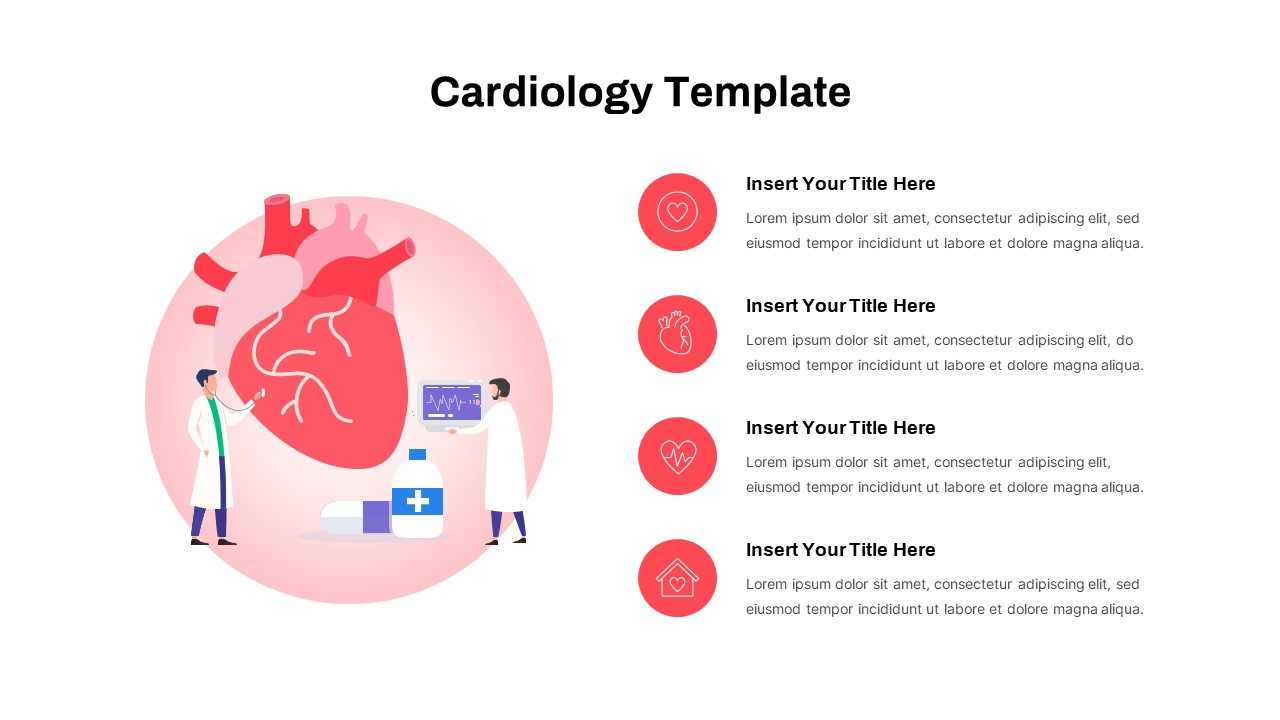
Cardiology Icons & Illustration Slide Template for PowerPoint & Google Slides
Health
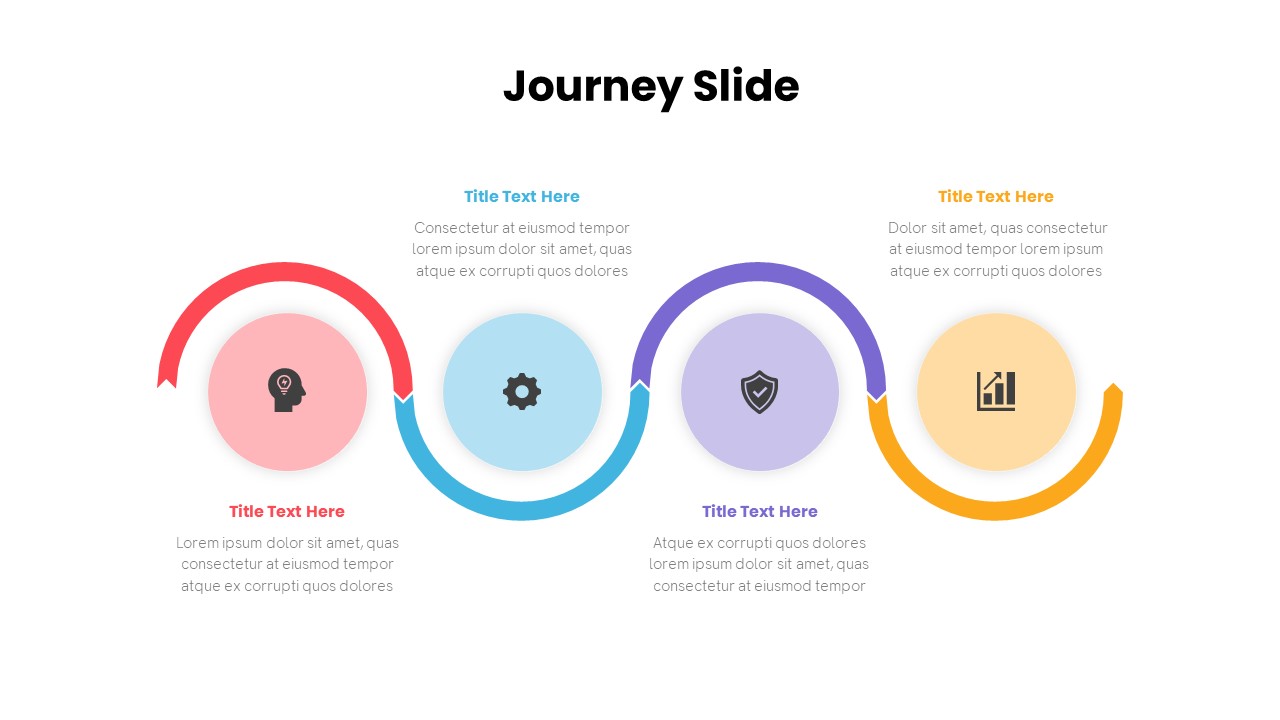
Free Journey Slide with Four Icons Diagram Template for PowerPoint & Google Slides
Process
Free
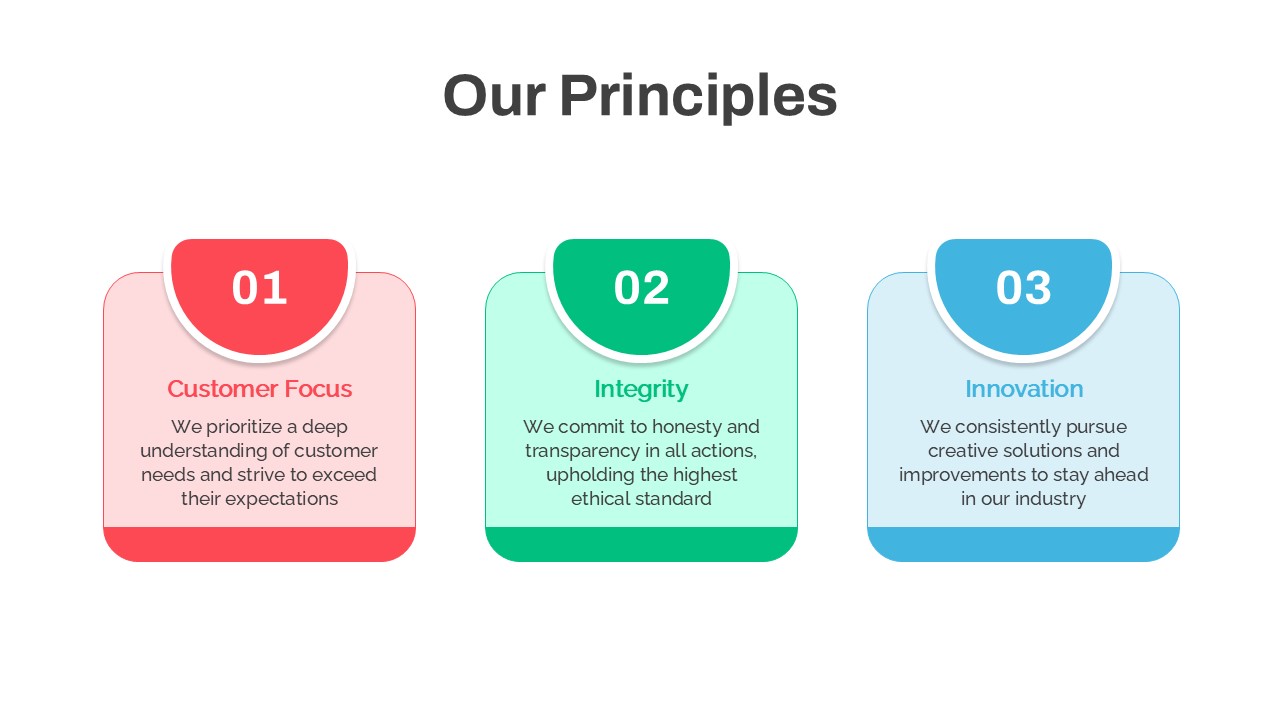
Our Principles Slide with Icons Layout Template for PowerPoint & Google Slides
Vision and Mission
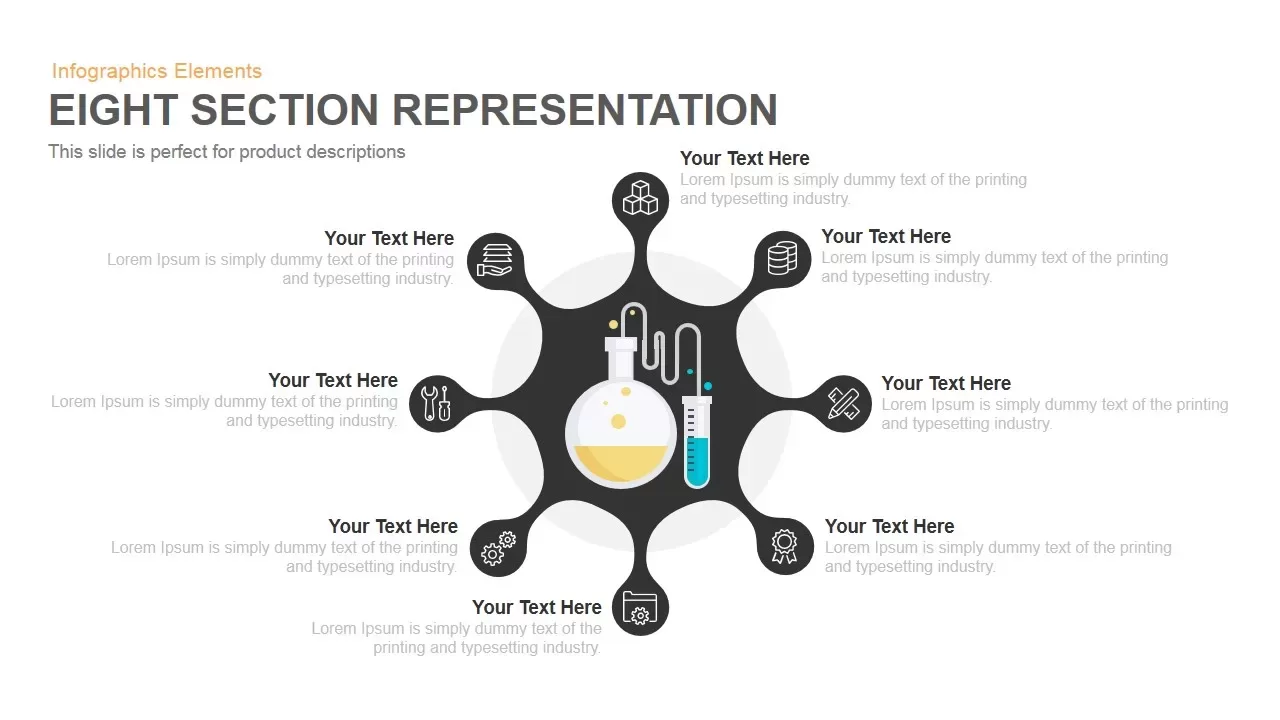
Eight Section Lab Infographic with Icons Template for PowerPoint & Google Slides
Circular

Strategy Arrow and Gear Icons Template for PowerPoint & Google Slides
Infographics
Six-Stage Semi-Circle Diagram with Icons Template for PowerPoint & Google Slides
Circular

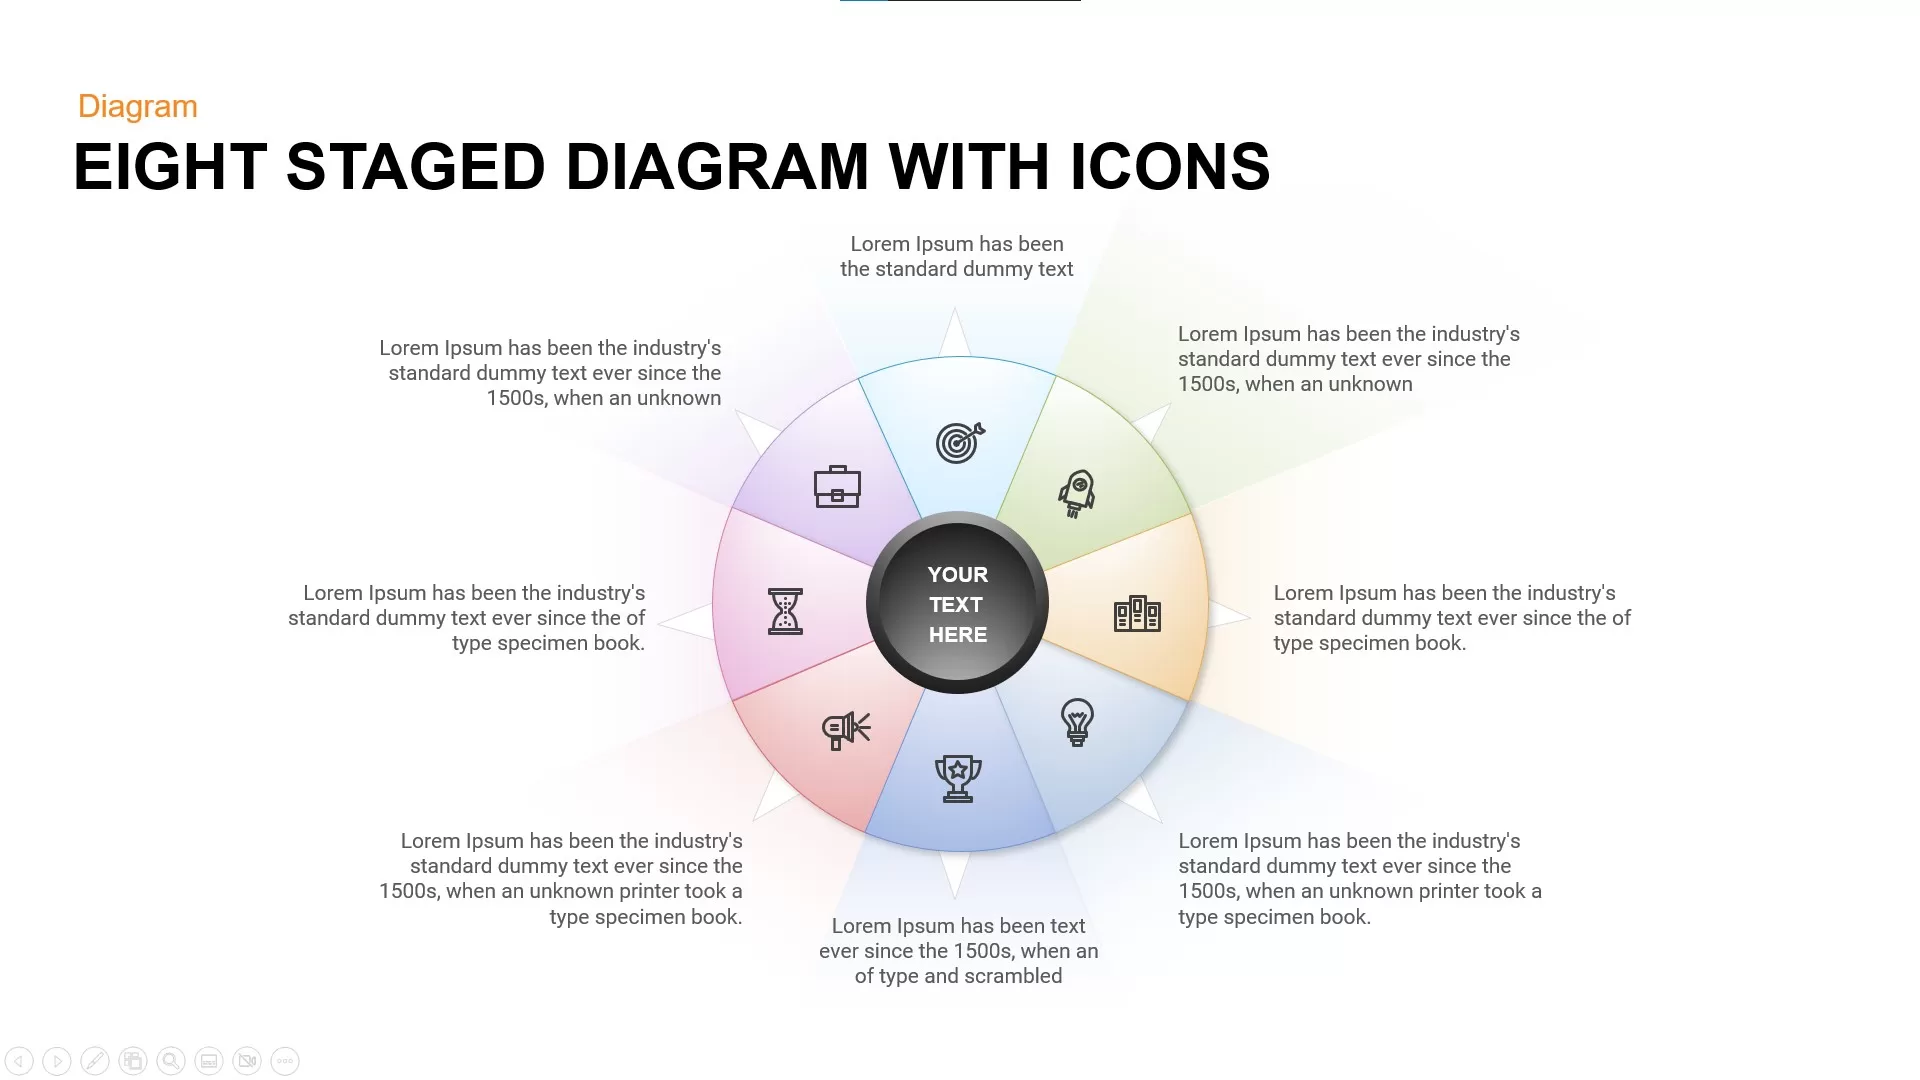
Eight Staged Diagram with Icons template for PowerPoint & Google Slides
Process
Free

Six Stage Circular Diagram with Icons Template for PowerPoint & Google Slides
Circular
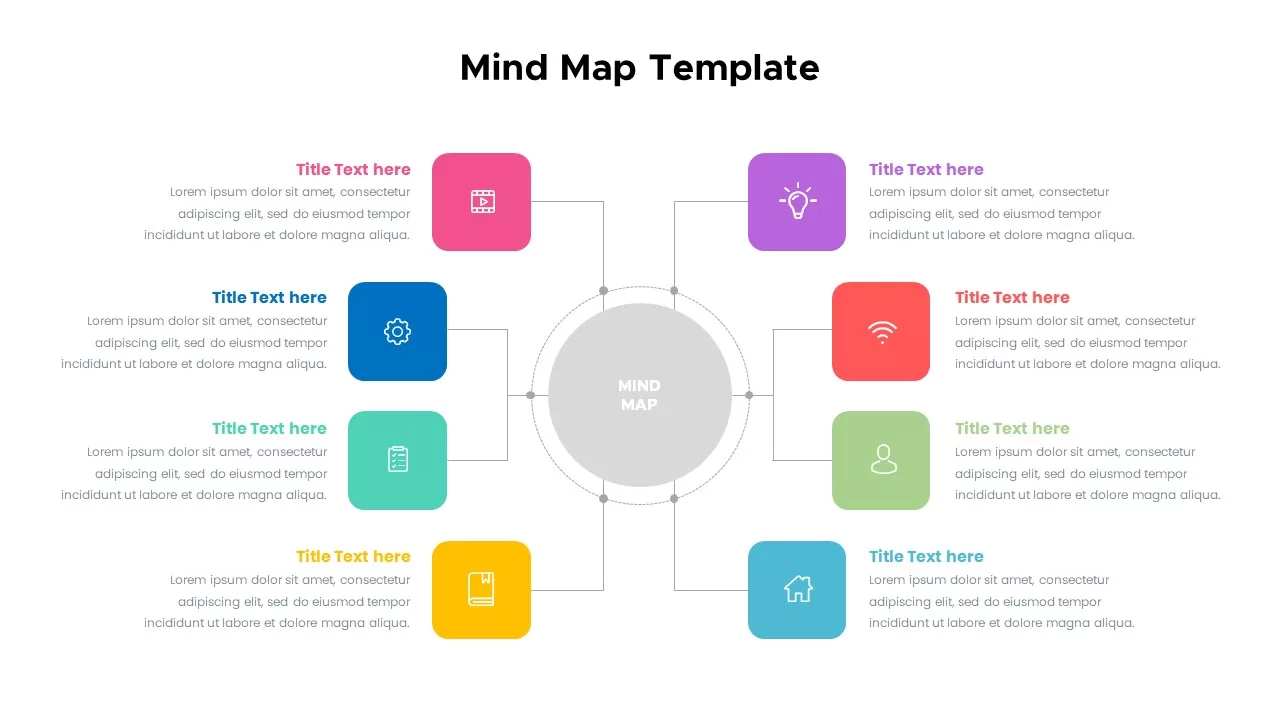
Colorful Mind Map Infographic Template with Icons for PowerPoint & Google Slides
Mind Maps
Umbrella & Rain Icons Infographic Template for PowerPoint & Google Slides
Goals
Internet Marketing Megaphone with Icons Template for PowerPoint & Google Slides
Process
30-60-90 Day Plan with Hexagon Icons Template for PowerPoint & Google Slides
Timeline
Creative Mind Mapping Diagram with Icons Template for PowerPoint & Google Slides
Mind Maps
Free 3D Social Media Icons template for PowerPoint & Google Slides
Digital Marketing
Free
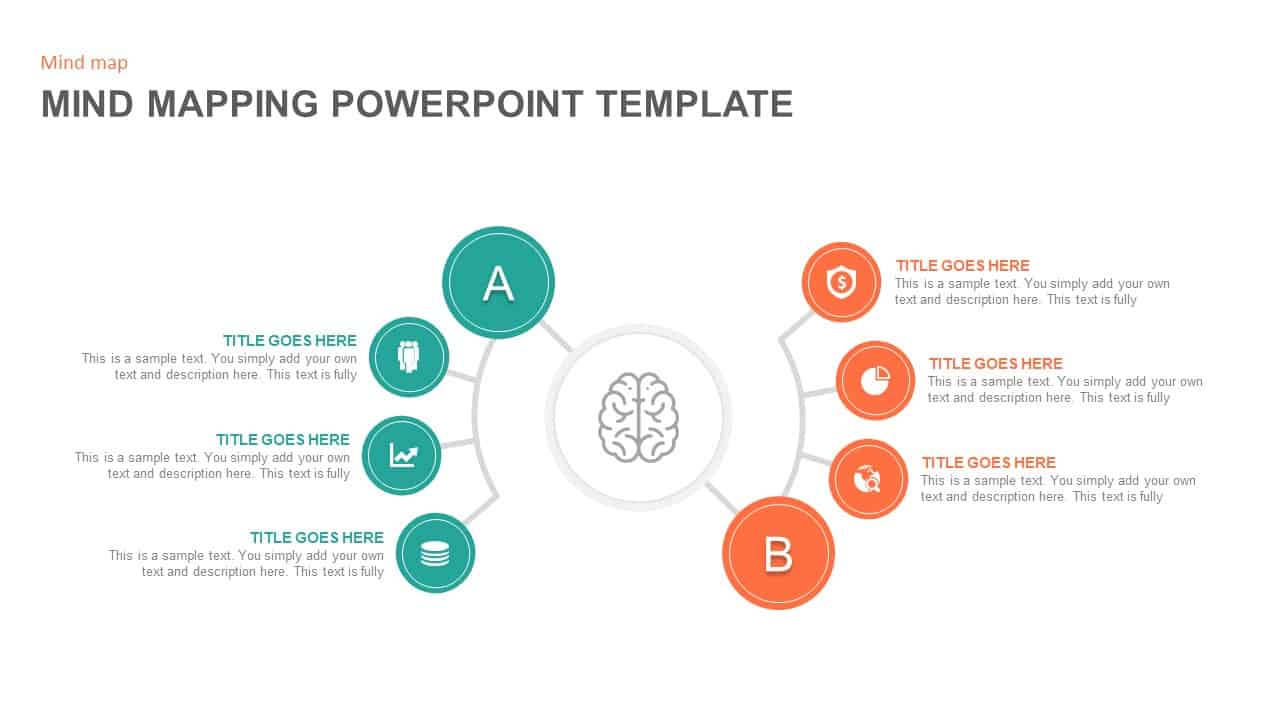
Colorful Mind Map with Icons Template for PowerPoint & Google Slides
Mind Maps
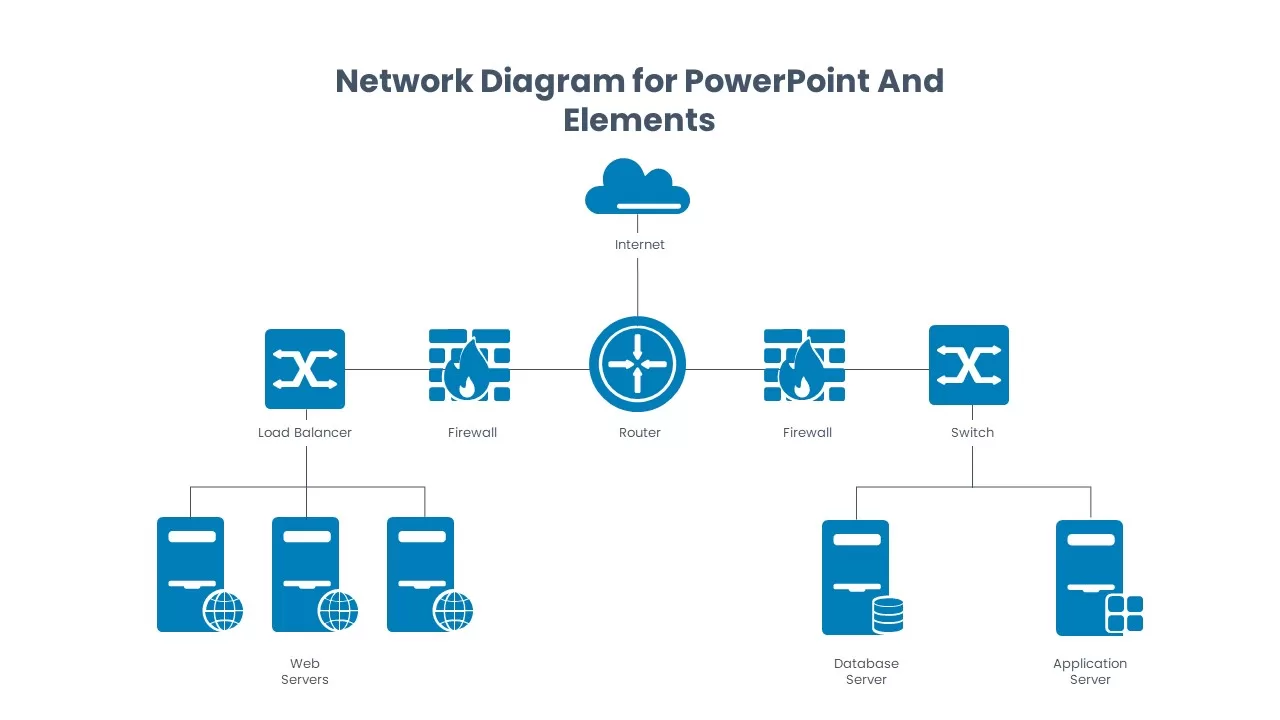
Network Diagram Elements and Icons Pack Template for PowerPoint & Google Slides
Information Technology
SWOT Analysis Infographic with Circular Icons Template for PowerPoint & Google Slides
SWOT
3D Cylinder Bar Chart Visualization Template for PowerPoint
Bar/Column
3D Bar Graph Infographic Template for PowerPoint & Google Slides
Bar/Column
Five-Stage Vertical Bar Process Template for PowerPoint & Google Slides
Process
Timeline Roadmap with Progress Bar Template for PowerPoint & Google Slides
Timeline
Progress Bar and Milestone Visualization Template for PowerPoint & Google Slides
Timeline
Blank Bar Graph Template for PowerPoint & Google Slides
Bar/Column
Progress Bar Graph Layout Design for PowerPoint & Google Slides
Charts
Progress Bar Infographic for PowerPoint & Google Slides
Business
Progress Bar infographic pack for PowerPoint & Google Slides
Business
Five Options Business Bar Graph for PowerPoint & Google Slides
Business Report
Tornado Chart Data Comparison Slide Template for PowerPoint & Google Slides
Bar/Column
Free Editable Simple Column Chart Slide Template for PowerPoint & Google Slides
Bar/Column
Free
Stacked Gantt Chart Timeline Slide Template for PowerPoint & Google Slides
Gantt Chart
Weekly Data Chart Slide for PowerPoint & Google Slides
Comparison Chart
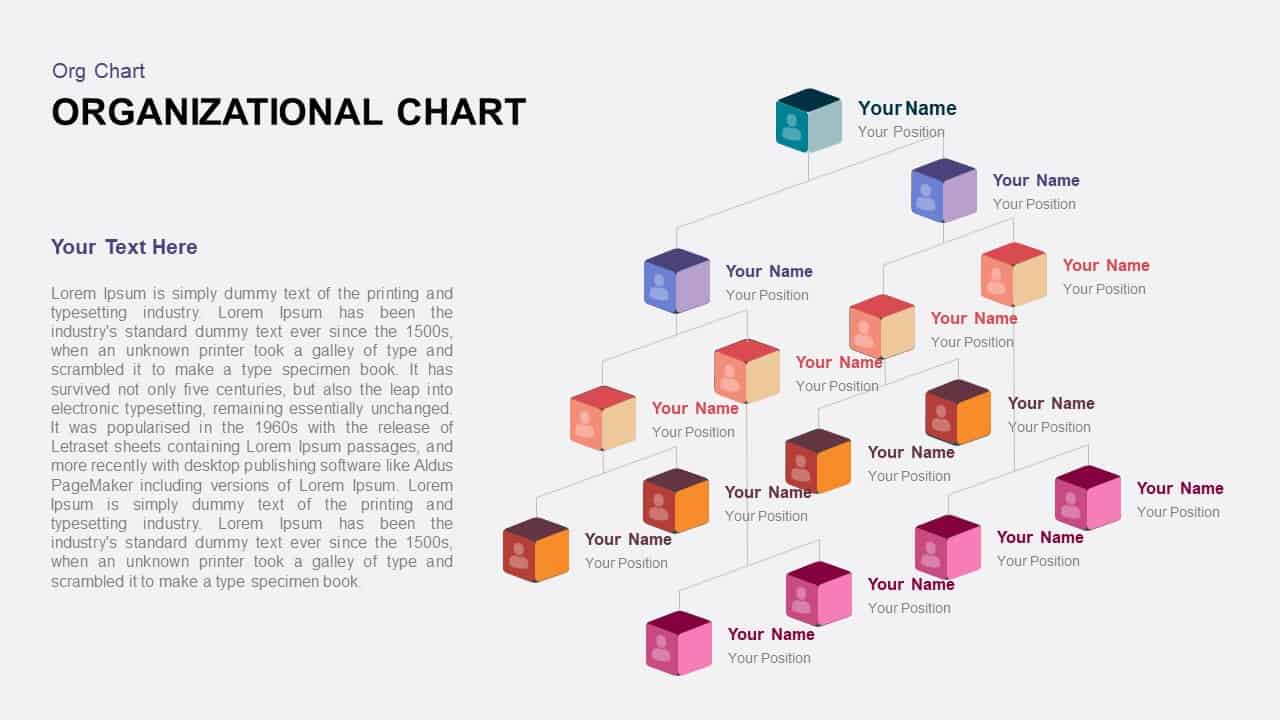
3D Color Block Organizational Chart Slide for PowerPoint & Google Slides
Org Chart
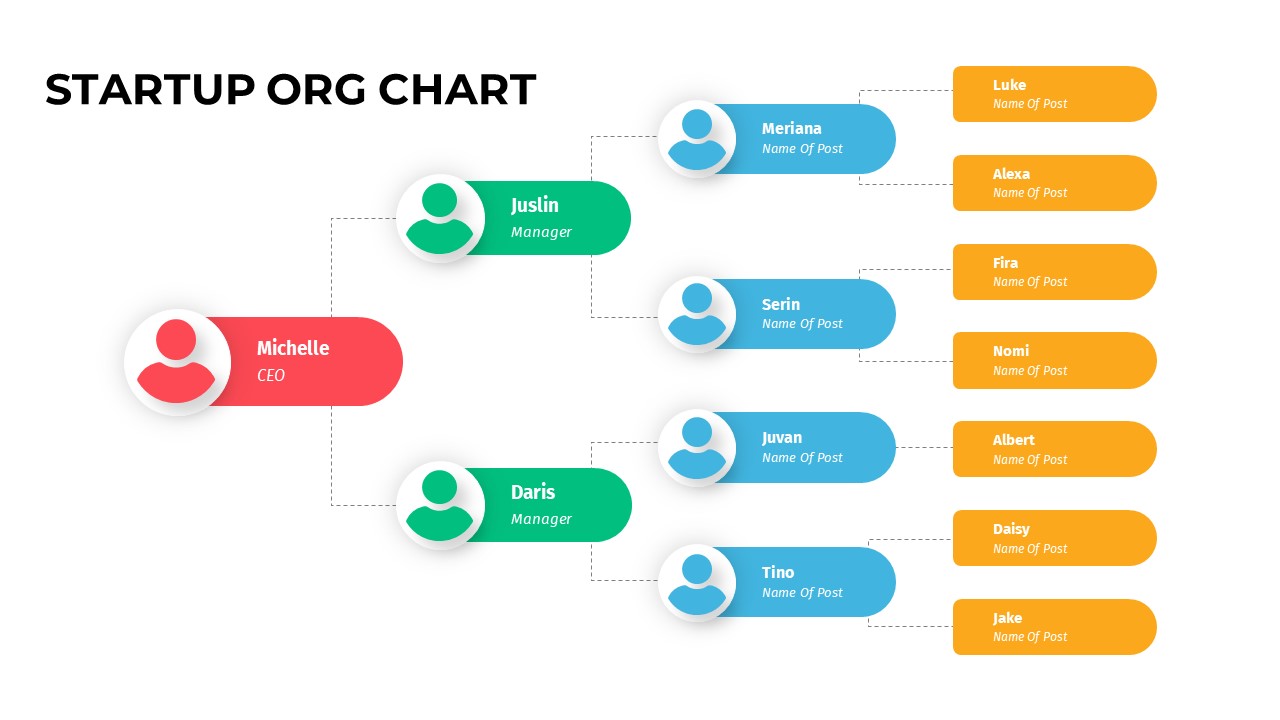
Color-Coded Startup Org Chart Slide for PowerPoint & Google Slides
Org Chart
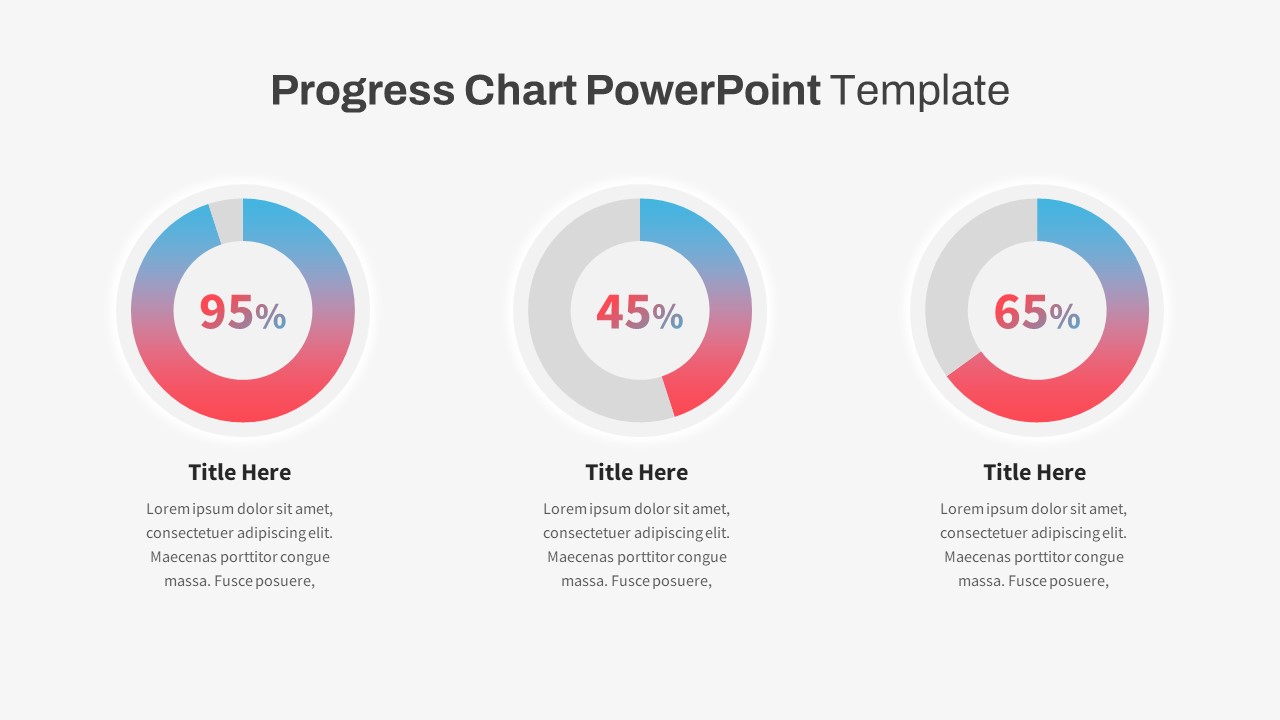
Progress Chart Slide for PowerPoint & Google Slides
Charts
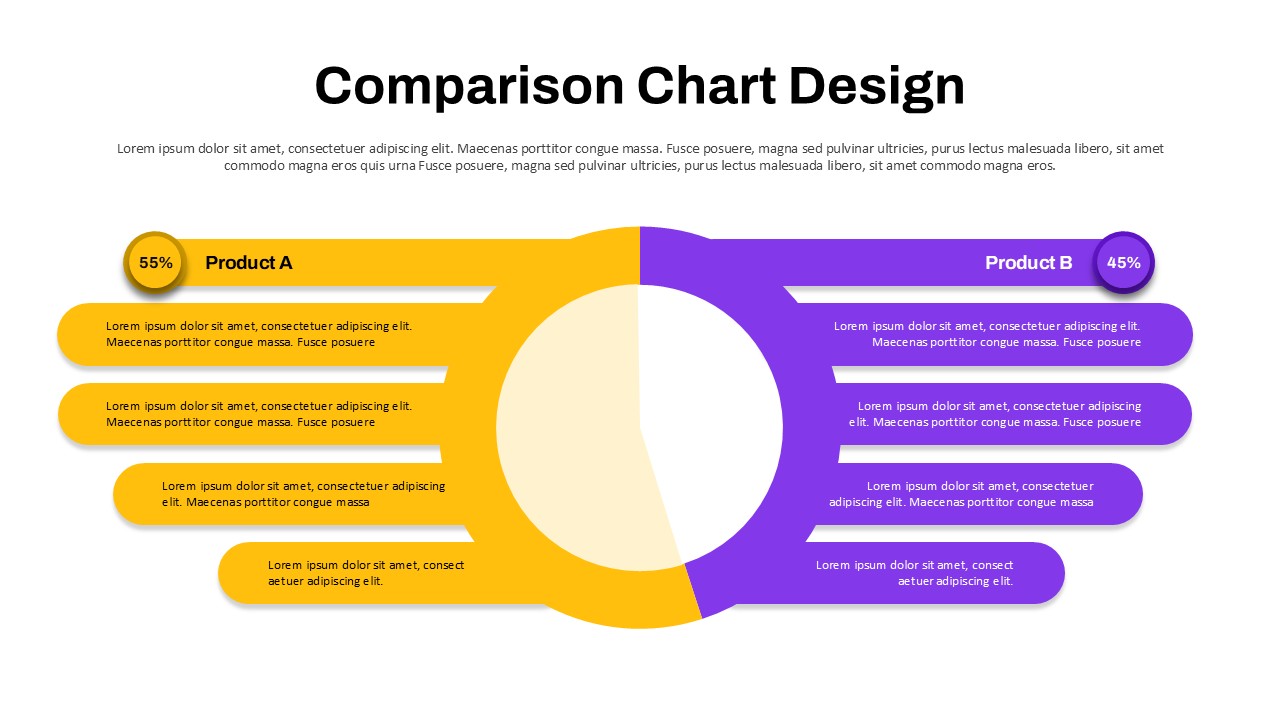
Comparison Chart Design Slide for PowerPoint & Google Slides
Infographics
Quad Chart Infographic Pack of 8 Slides Template for PowerPoint & Google Slides
Comparison Chart
Free Professional Gantt Chart Pack – 4 Slides Template for PowerPoint & Google Slides
Gantt Chart
Free