Multi-Segment Circle Split Diagram template for PowerPoint & Google Slides


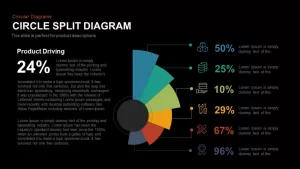
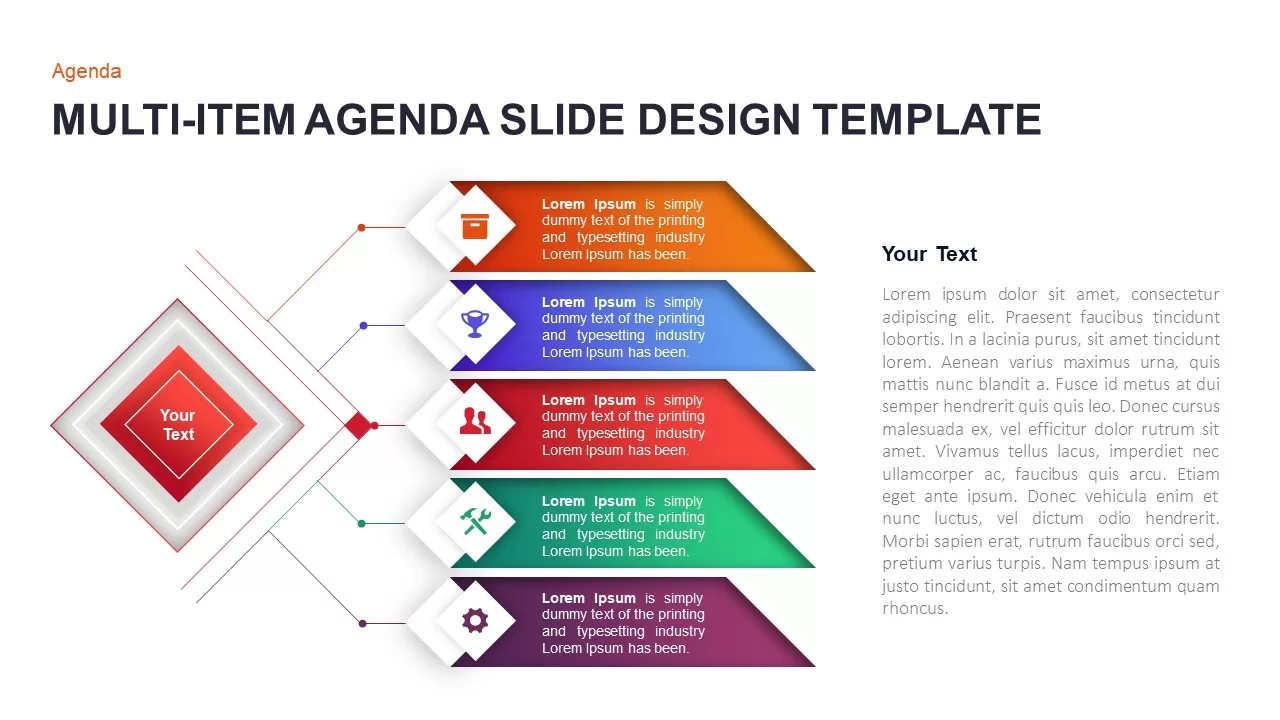
Leverage this versatile Circular Split Diagram slide to present multi-dimensional data in a clean, organized format. This fully editable infographic features six color-coded segments arranged around a central circle, each linked to an icon and percentage label for rapid comprehension. Use the left-hand text block to present an overview or key metric, while the six radial callouts on the right highlight specific categories or performance indicators.
Built on PowerPoint and Google Slides master slides, this diagram uses vector shapes and icons that you can customize with your brand colors and data values. Adjust segment sizes proportionally to represent actual metrics, swap icons to match your content, and replace placeholder text with insights, statistics, or strategic notes. The balanced layout ensures your audience’s focus remains on both narrative context and visual data.
Ideal for illustrating resource allocation, market share distribution, department performance, or budget breakdown, this Circular Split Diagram simplifies complex information into digestible segments. Whether you’re comparing sales regions, visualizing customer segments, or mapping project priorities, this slide transforms detailed data points into an engaging story.
Designed to maintain full-resolution clarity across devices, the slide streamlines collaboration with intuitive placeholders and consistent styles. Easily duplicate the slide for additional datasets, rearrange segment order to suit your narrative flow, or adjust the diagram’s rotation for visual variety. With no dependencies on external plugins, this infographic integrates seamlessly into any presentation.
Optimize your next pitch, report, or training session by turning raw figures into a compelling visual narrative. Modern typography, vibrant color fills, and streamlined icons combine to deliver a professional, impactful look with minimal effort.
Who is it for
Data analysts, marketing managers, project leads, and business consultants looking to present segmented metrics or category breakdowns will benefit from this slide. Educators and trainers can also leverage this diagram for educational workshops, lectures, or workshop presentations.
Other Uses
Beyond category breakdowns, repurpose this slide to showcase budget allocations, resource distribution, KPI dashboards, sales performance, market share visualization, or team responsibility assignments. Simply swap icons and adjust segment sizes to adapt the slide for risk assessments, operational reviews, or stakeholder updates.
Login to download this file

Item ID
SB00305
Related Templates

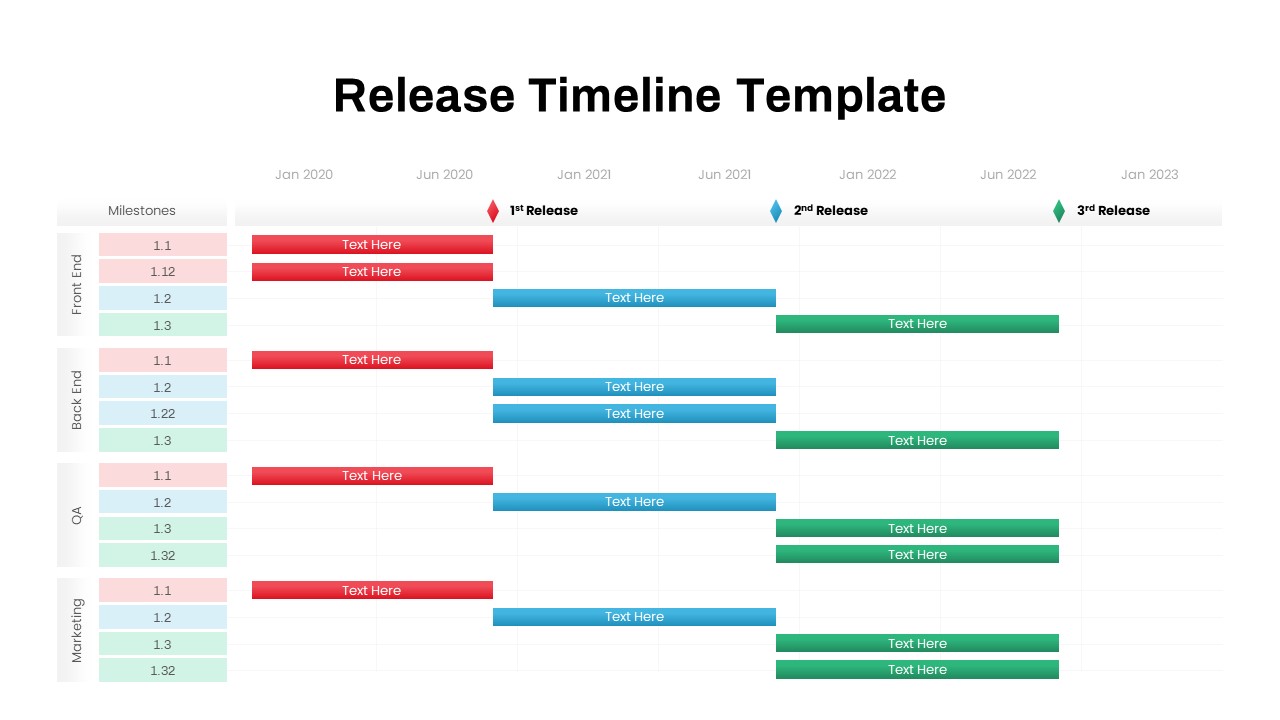
Multi-Team Multi-Phase Release Timeline Template for PowerPoint & Google Slides
Timeline
Multi-layout Circle Spoke Diagram Template for PowerPoint & Google Slides
Circular
Modern Multi-Section Circle Diagram Template for PowerPoint & Google Slides
Circular
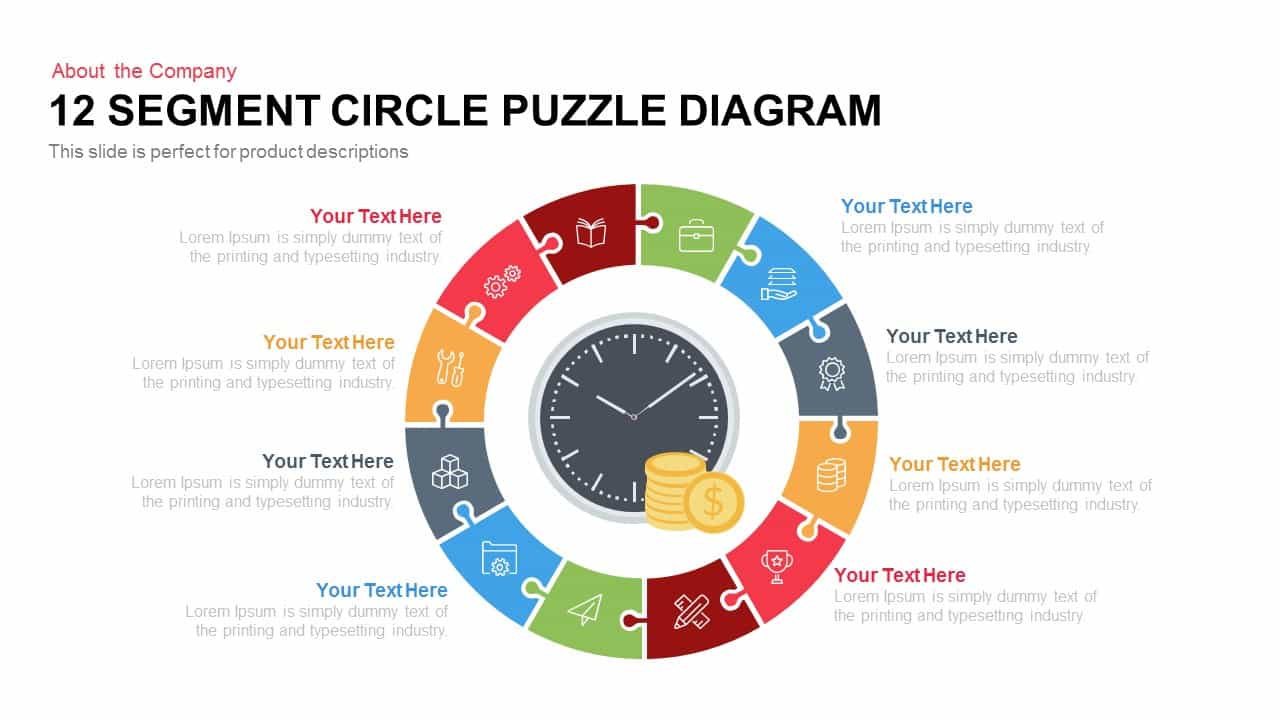
12 Segment Circle Puzzle Diagram Template for PowerPoint and Keynote
Circular
Circle Segment Sales Metrics Infographic Template for PowerPoint & Google Slides
Circular

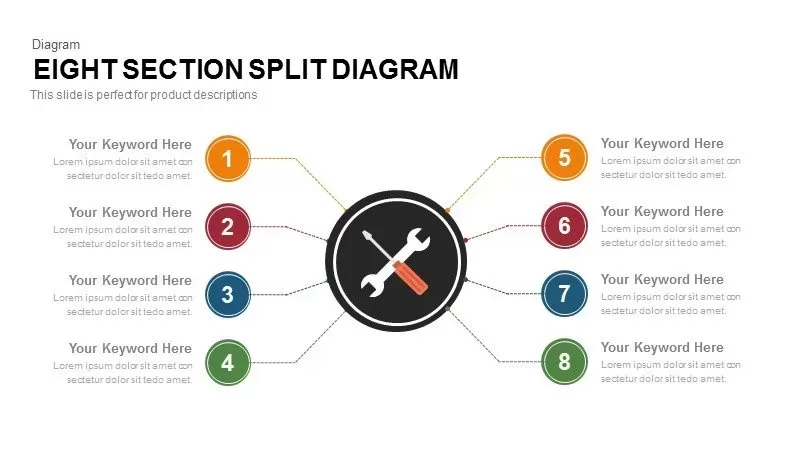
8-Section Split Diagram with Hub Icon template for PowerPoint & Google Slides
Circular
Vertical Split Flow Chart Diagram Template for PowerPoint & Google Slides
Flow Charts
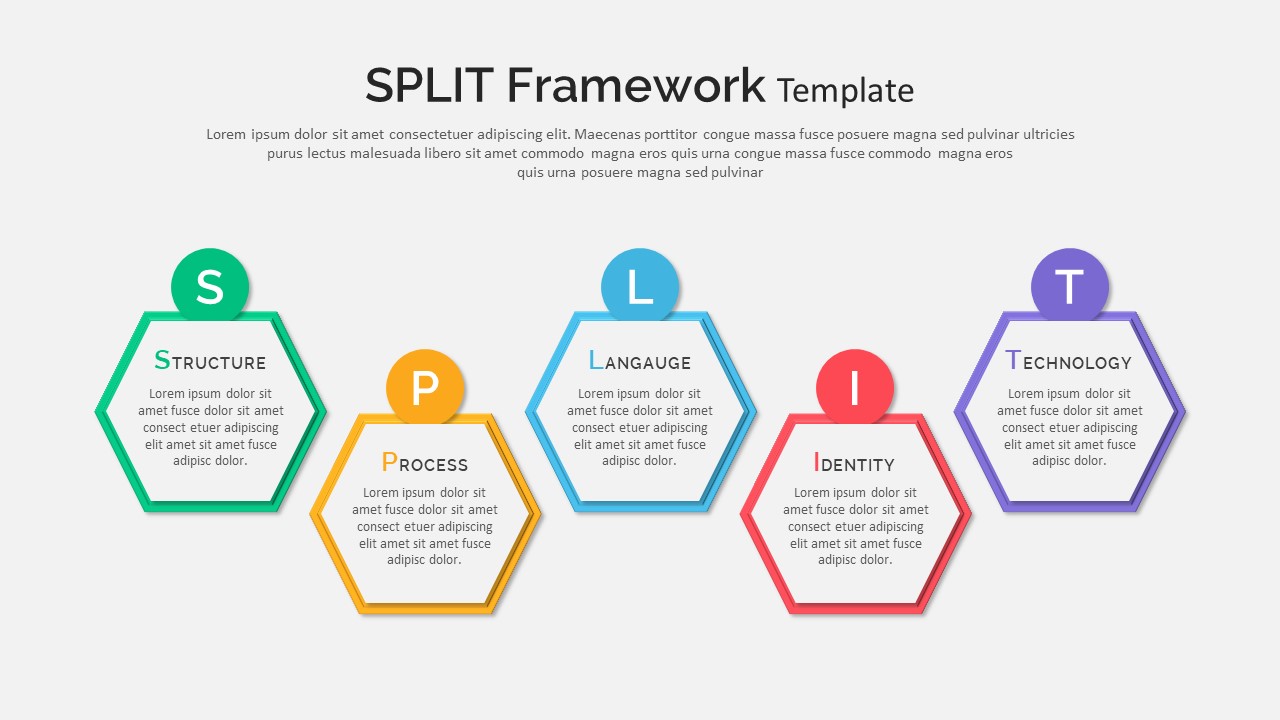
Split Framework Hexagon Diagram Slide Template for PowerPoint & Google Slides
Process
Donut Split Analysis template for PowerPoint & Google Slides
Pie/Donut
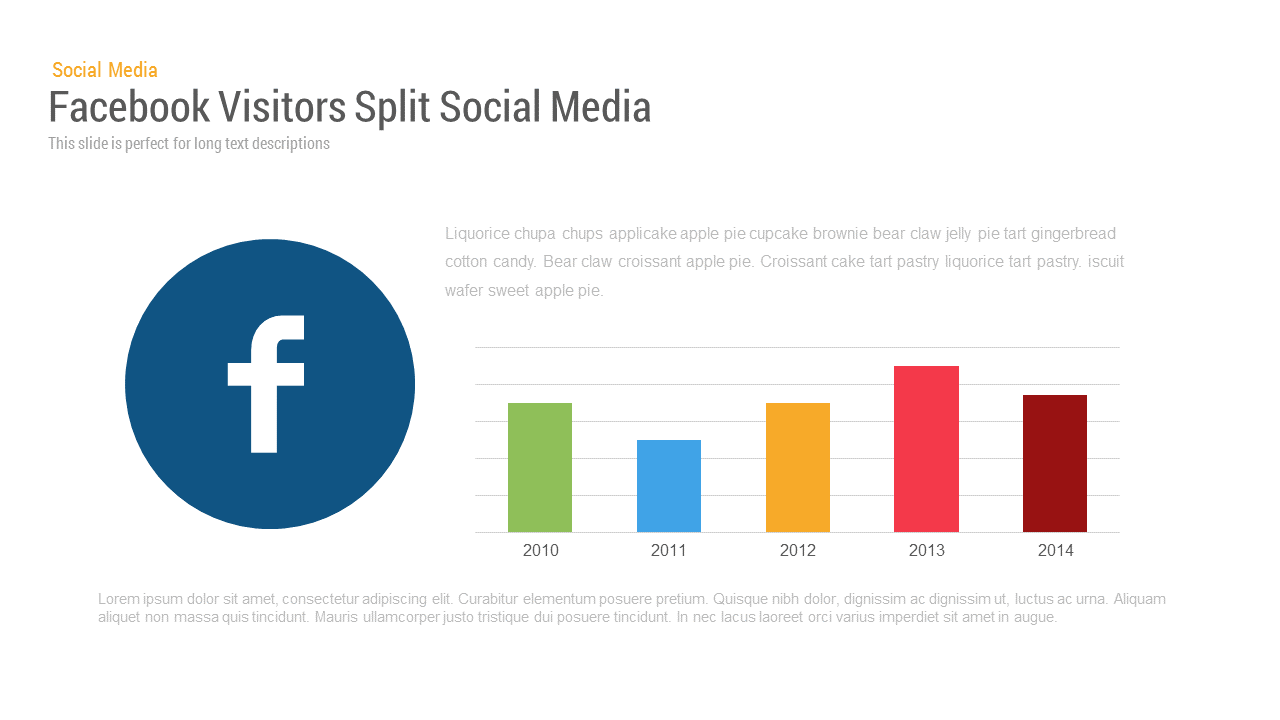
Facebook User Split template for PowerPoint & Google Slides
Bar/Column
Donut Chart Split Template for PowerPoint & Google Slides
Charts
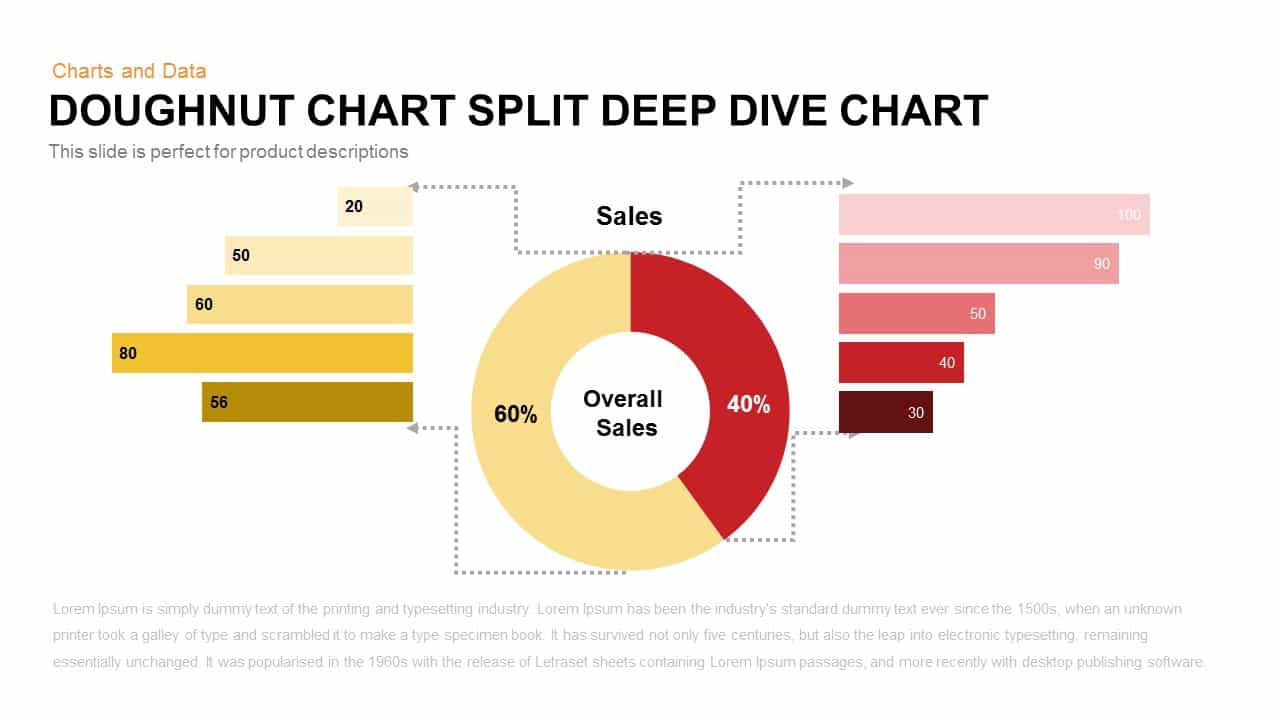
Split Doughnut Deep Dive Sales Analysis Template for PowerPoint & Google Slides
Pie/Donut
Capital Structure Dynamic Split Chart Template for PowerPoint & Google Slides
Comparison Chart
About Us Split Photo Template for PowerPoint & Google Slides
Marketing

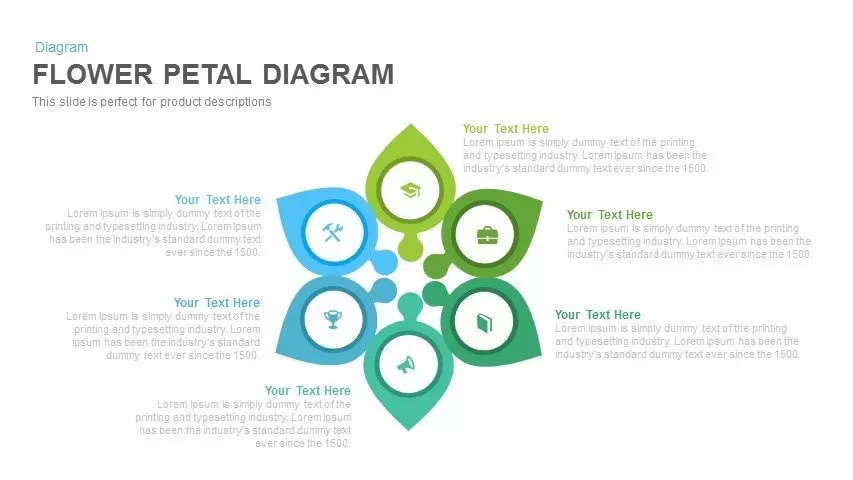
Six-Segment Flower Petal Diagram Template for PowerPoint & Google Slides
Circular

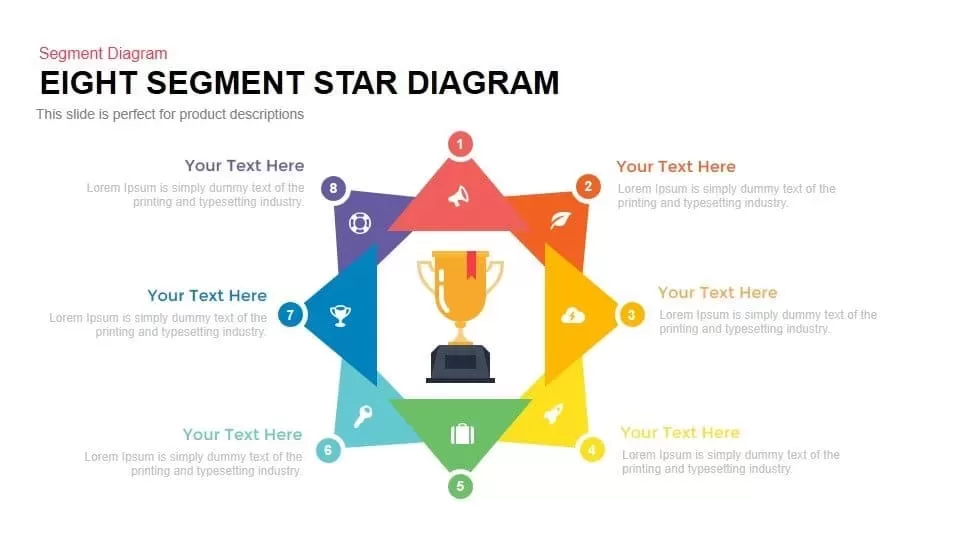
Eight Segment Star Diagram Infographic Template for PowerPoint & Google Slides
Process
Pie Segment Diagram Four-Step Process Template for PowerPoint & Google Slides
Pie/Donut
Seven-Segment Circular Arrow Diagram Template for PowerPoint & Google Slides
Arrow
Six Segment Hexagon Circular Diagram Template for PowerPoint & Google Slides
Circular
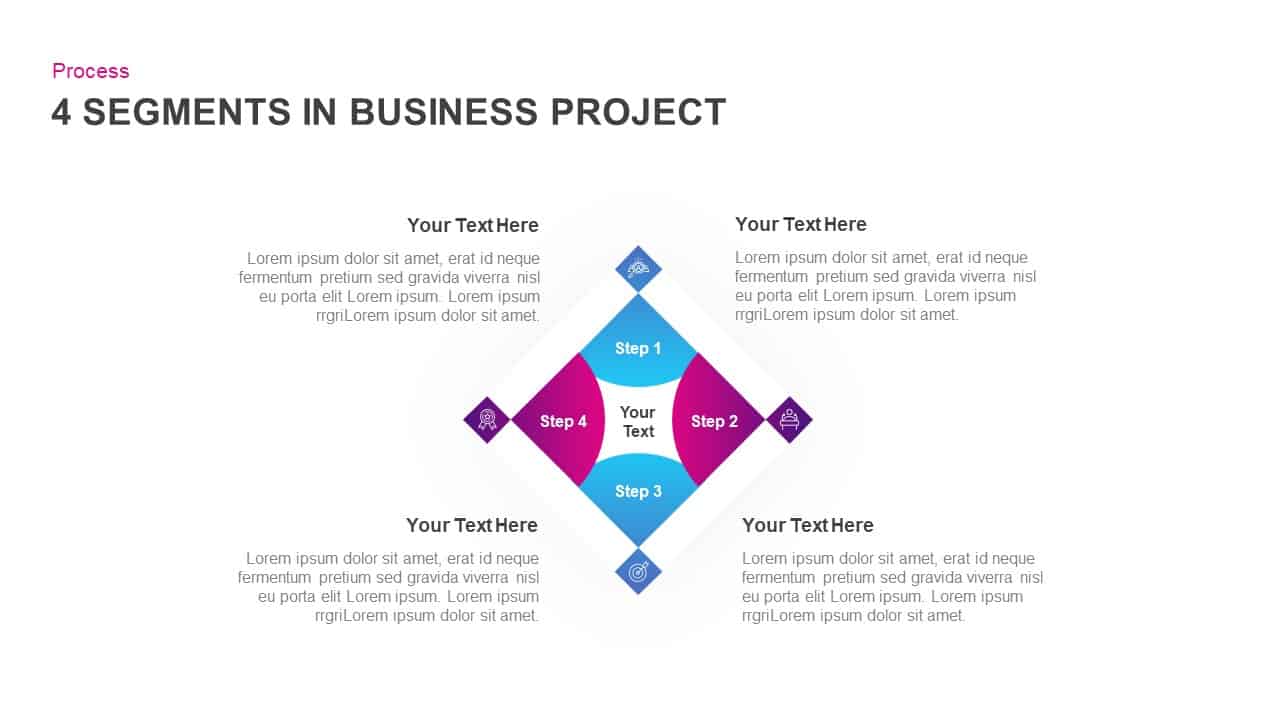
4-Segment Business Project Diamond Diagram Template for PowerPoint & Google Slides
Process
Circular 3D Cube Six-Segment Diagram Template for PowerPoint & Google Slides
Infographics
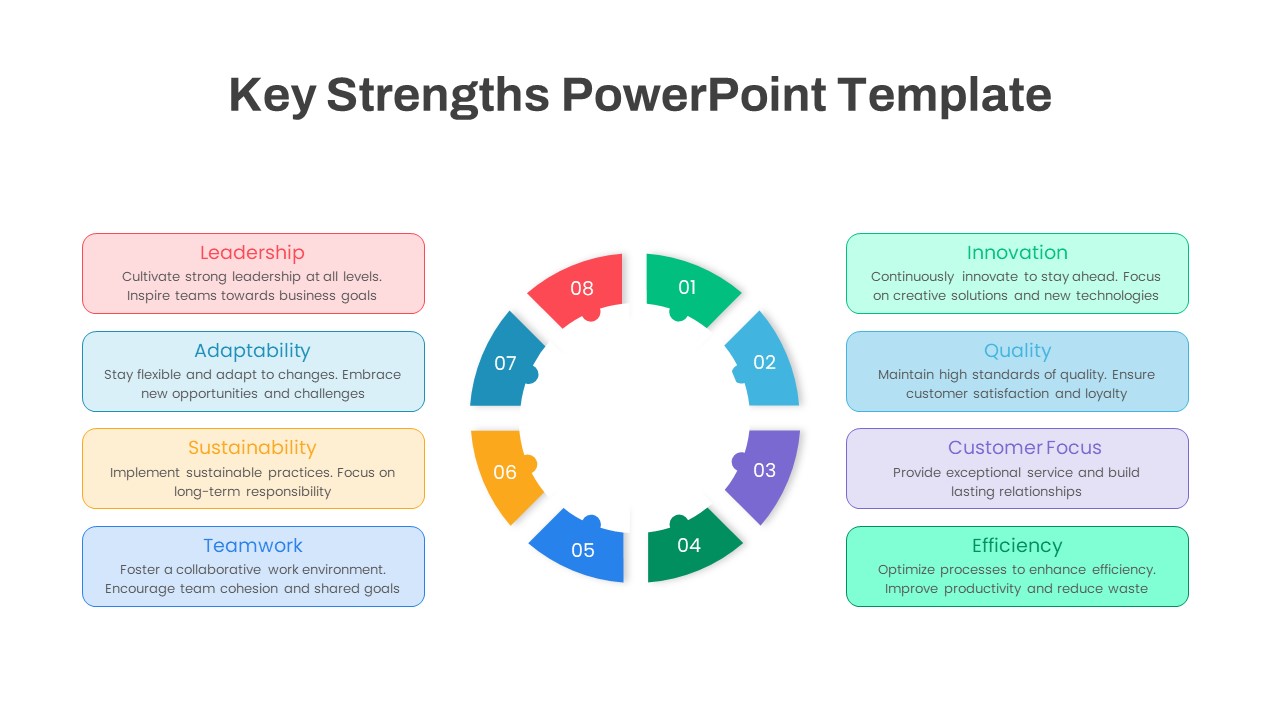
Eight-Segment Key Strengths Diagram Template for PowerPoint & Google Slides
Circular
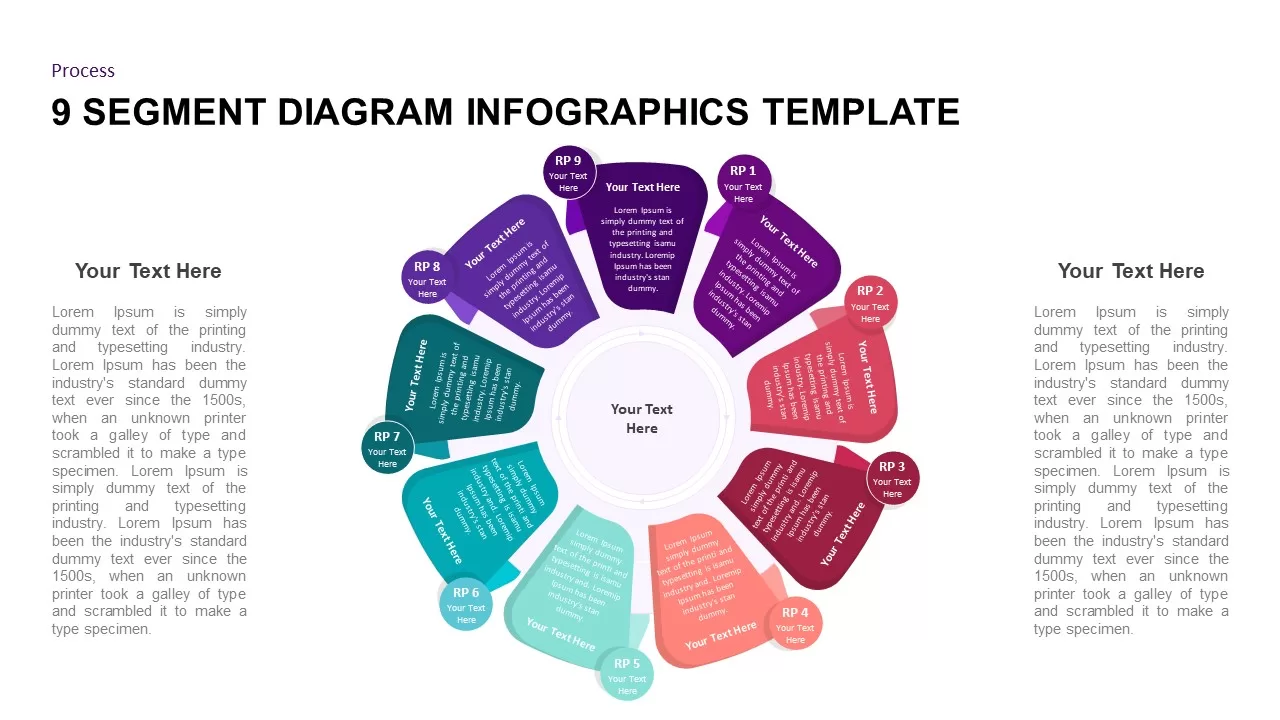
9 Segment Diagram Infographics for PowerPoint & Google Slides
Process
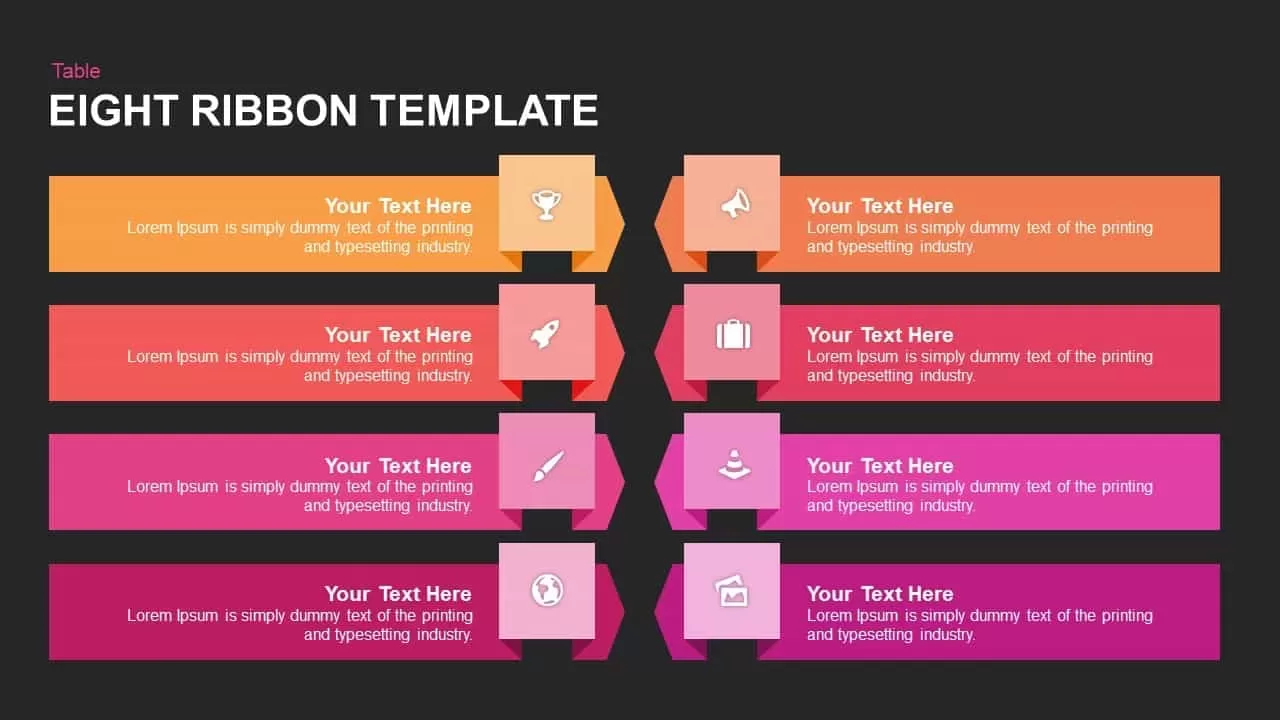
Multi-Color Eight-Step Ribbon Diagram Template for PowerPoint & Google Slides
Process
Multi-Style Project Life Cycle Diagram Template for PowerPoint & Google Slides
Process
Multi-Color Enneagram Circular Diagram Template for PowerPoint & Google Slides
Circular
Multi-Item Agenda Hub-and-Spoke Diagram Template for PowerPoint & Google Slides
Agenda
Free Circular Multi-Step Flow Chart Diagram Template for PowerPoint & Google Slides
Flow Charts
Free
Multi-Style Clock Chart Diagram Template for PowerPoint & Google Slides
Circular
Multi-Variation Circular Chart Diagram Template for PowerPoint & Google Slides
Circular
Modern Multi-Color Polar Chart Diagram Template for PowerPoint & Google Slides
Charts
Multi-Level Wheel Chart Diagram template for PowerPoint & Google Slides
Pie/Donut
Multi-Point Diagram Presentation Template for PowerPoint & Google Slides
Process
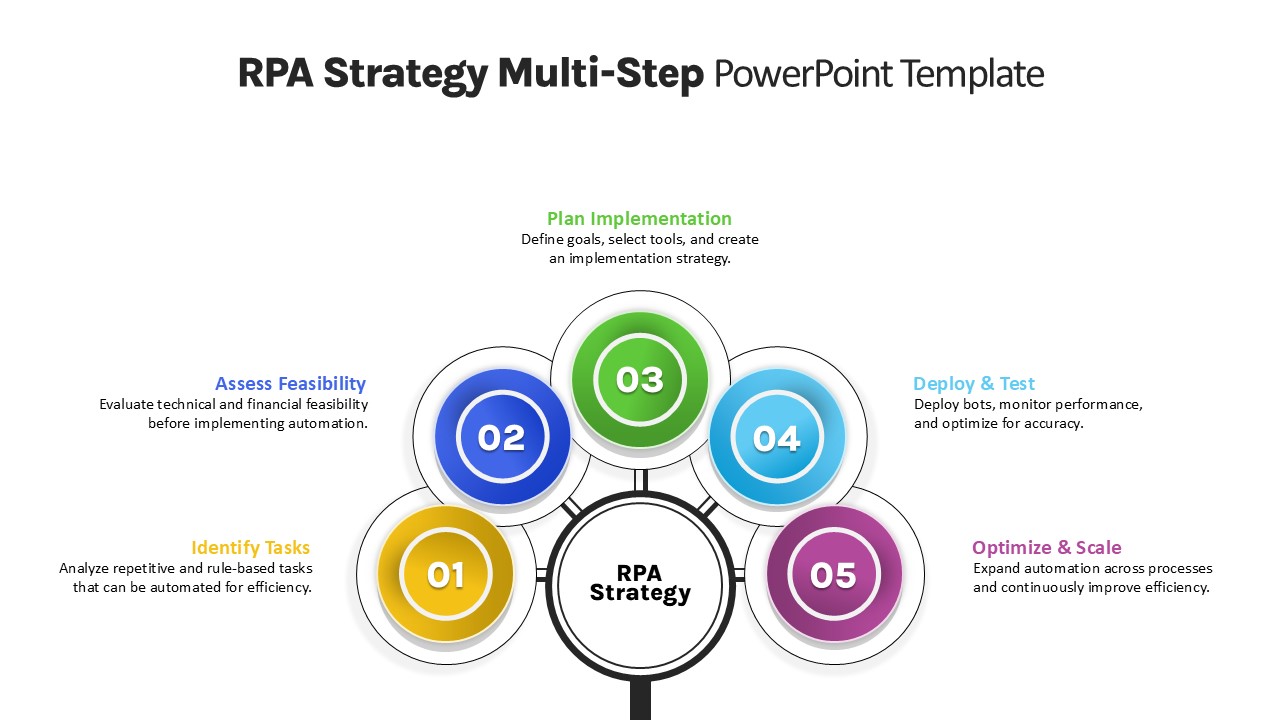
RPA Strategy Multi-Step Diagram Template for PowerPoint & Google Slides
Process
Eight-Segment 3D Arrow Infographics Template for PowerPoint & Google Slides
Arrow
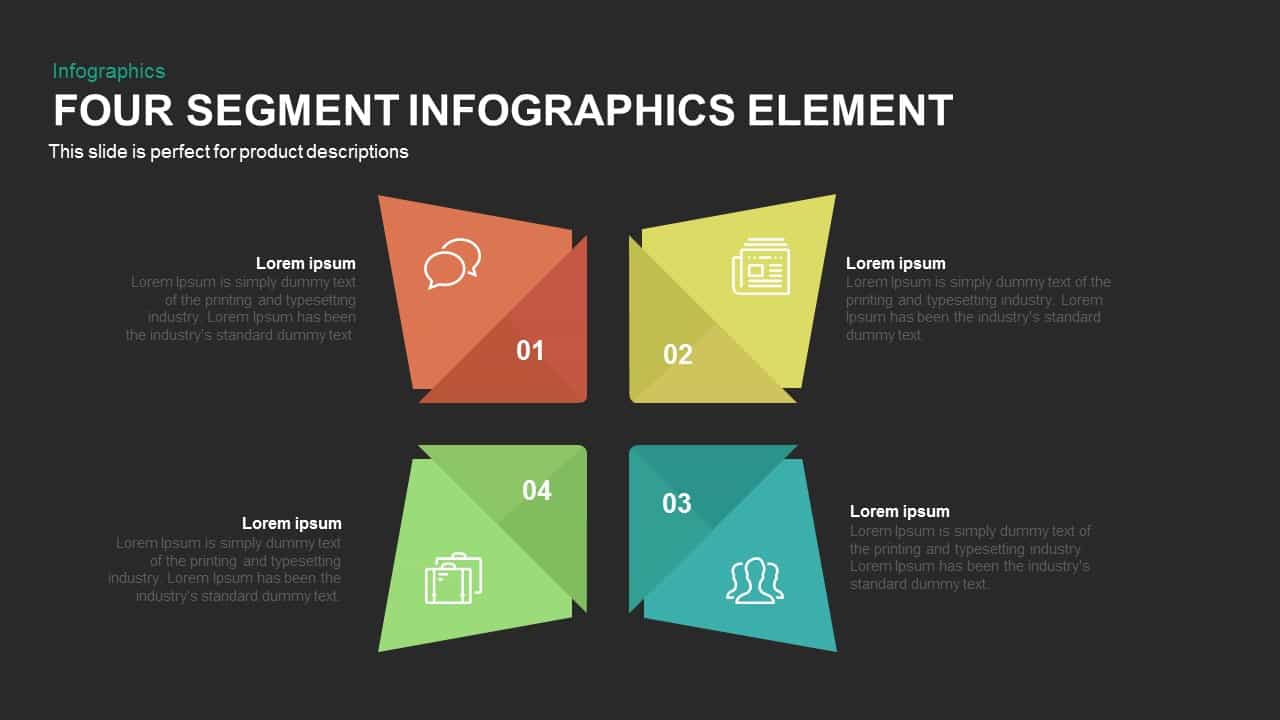
Four Segment Infographics Element Template for PowerPoint & Google Slides
Comparison
Six-Segment Circular Hub Infographic Template for PowerPoint & Google Slides
Circular
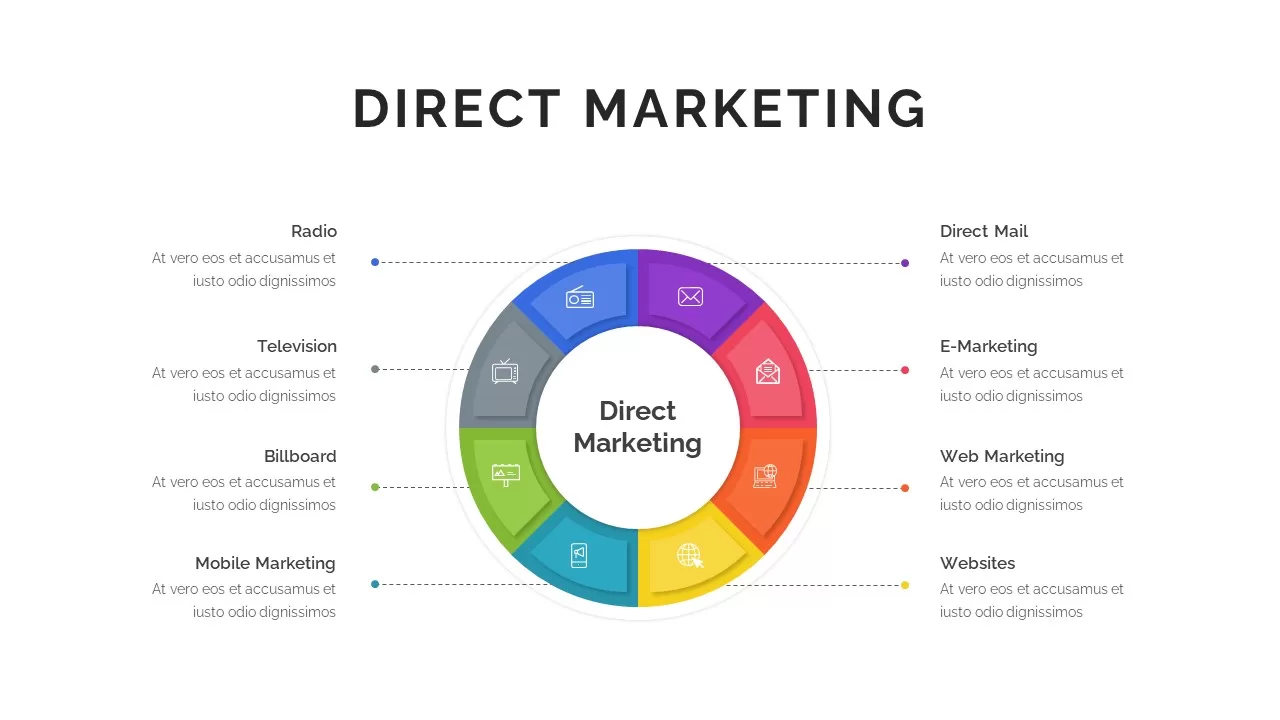
Eight-Segment Direct Marketing Wheel Template for PowerPoint & Google Slides
Circular
Three-Segment Circular Arrow Cycle Template for PowerPoint & Google Slides
Circular
Four-Segment Circular Arrow Cycle Template for PowerPoint & Google Slides
Circular
Six-Segment Circular Arrow Cycle Template for PowerPoint & Google Slides
Circular
Six-Segment Circular Arrow Infographic Template for PowerPoint & Google Slides
Circular
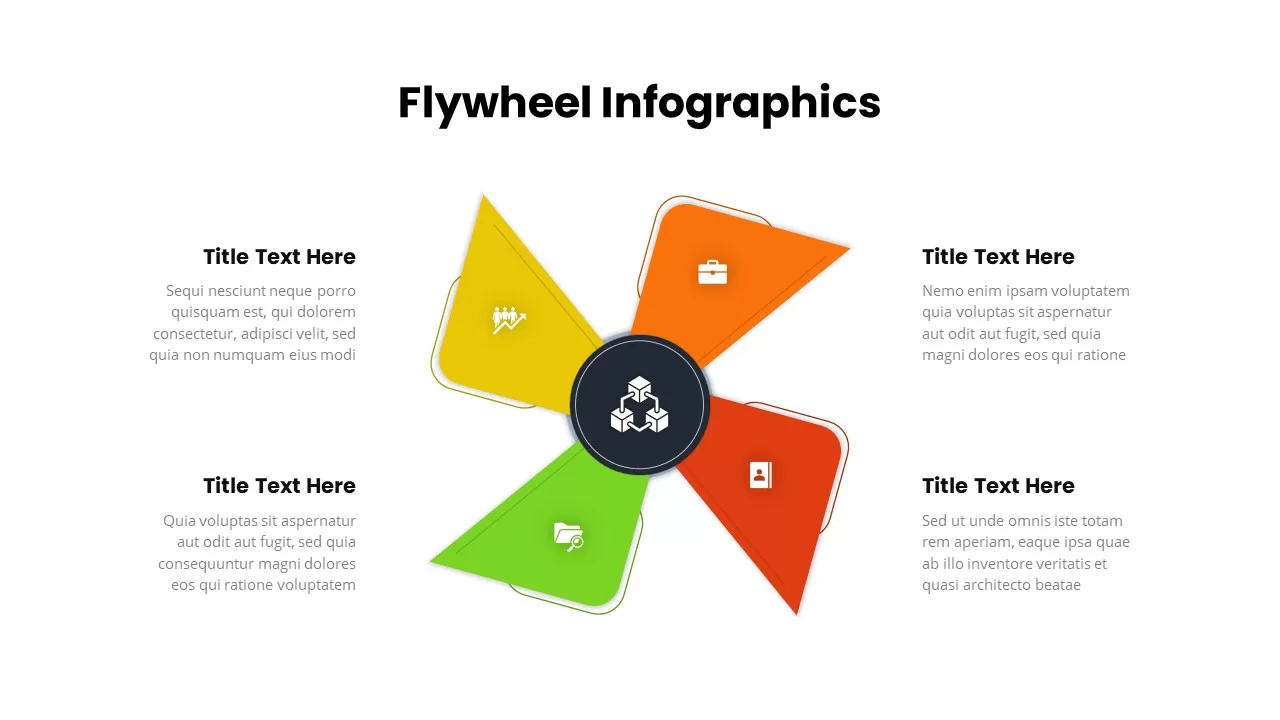
Four-Segment Flywheel Infographic Model Template for PowerPoint & Google Slides
Process
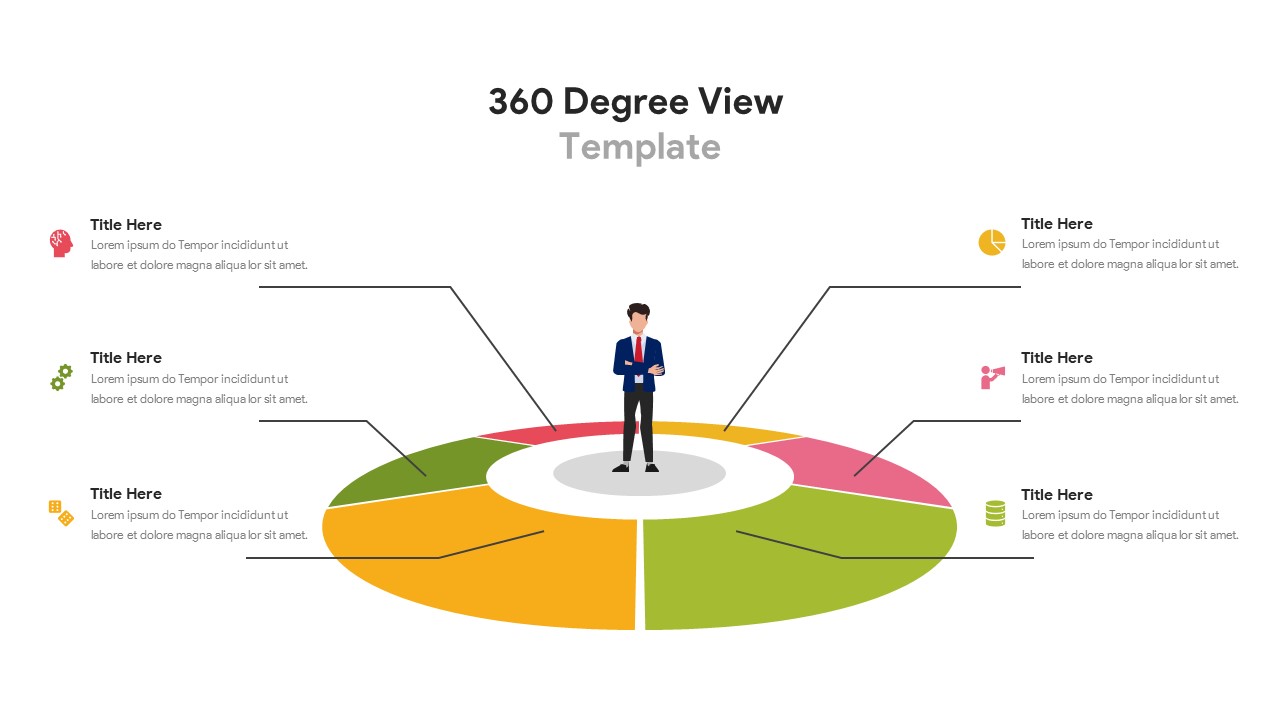
Six-Segment 360 Degree View Infographic Template for PowerPoint & Google Slides
Circular
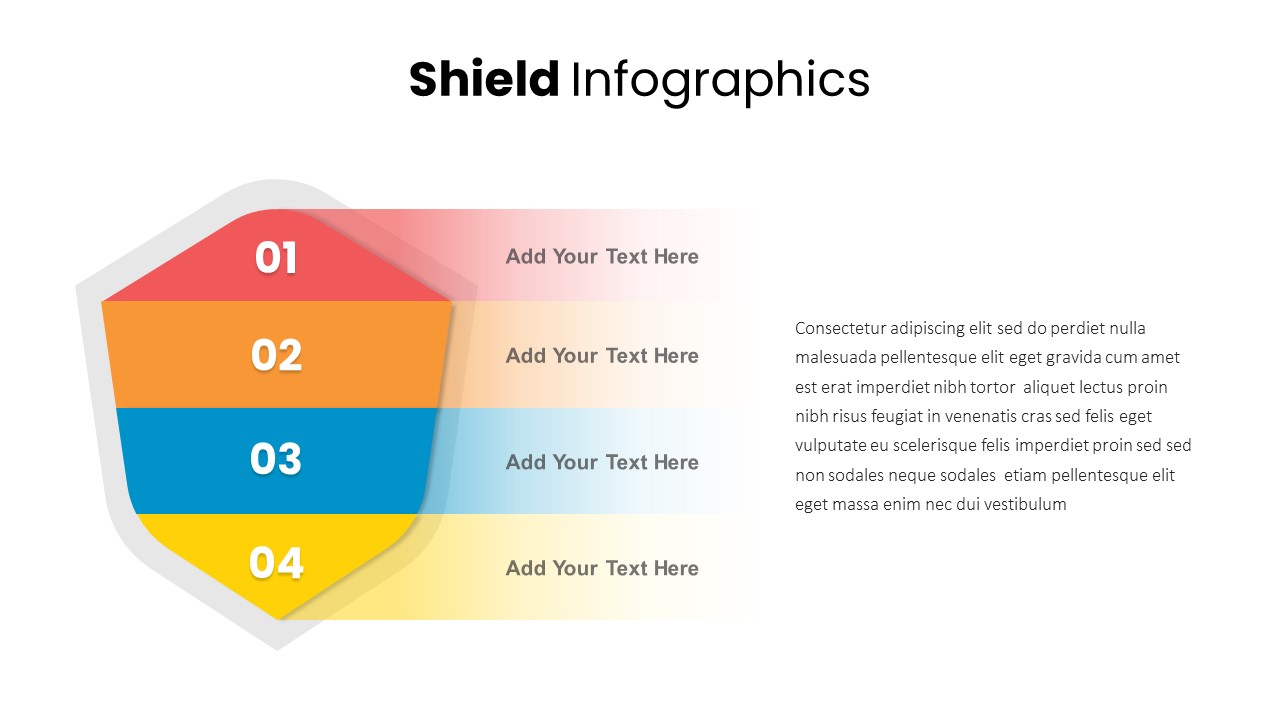
Shield Four-Segment Infographic Template for PowerPoint & Google Slides
Process
Colorful Four-Segment Wheel Chart Template for PowerPoint & Google Slides
Circular
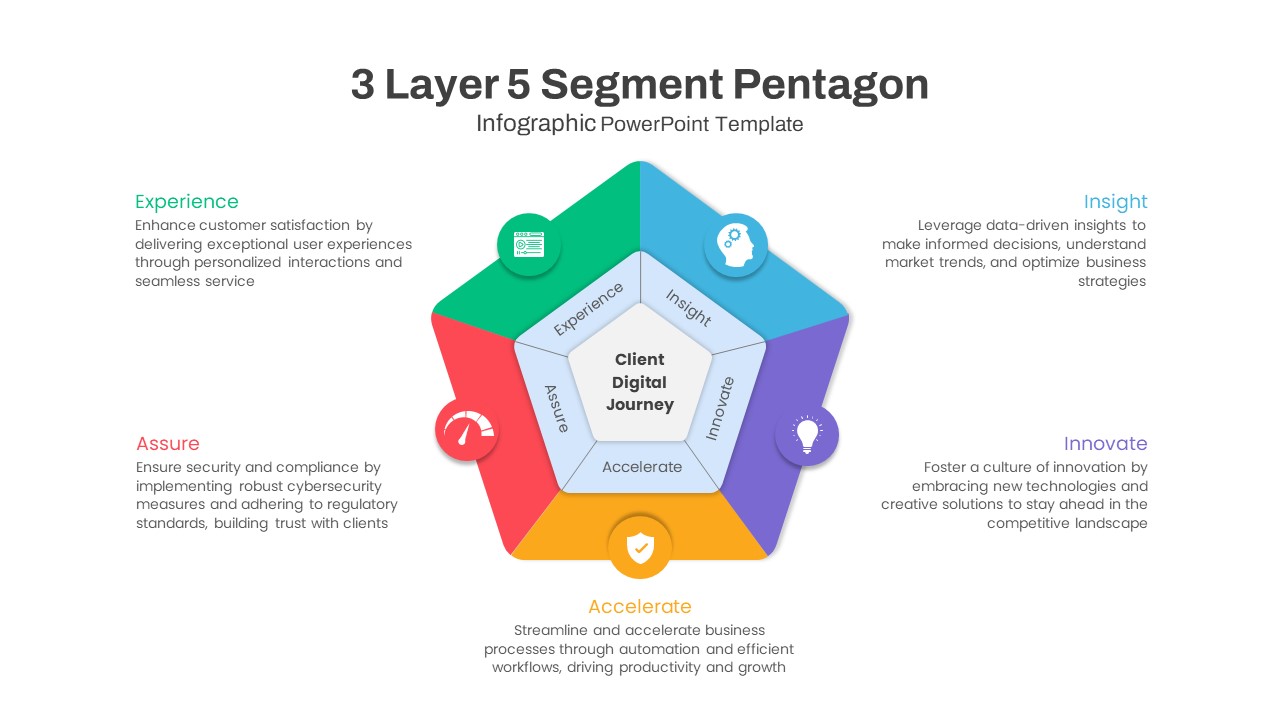
Five-Segment Pentagon Digital Journey Template for PowerPoint & Google Slides
Process
Three Segment Donut Chart KPI Infographic Template for PowerPoint & Google Slides
Pie/Donut
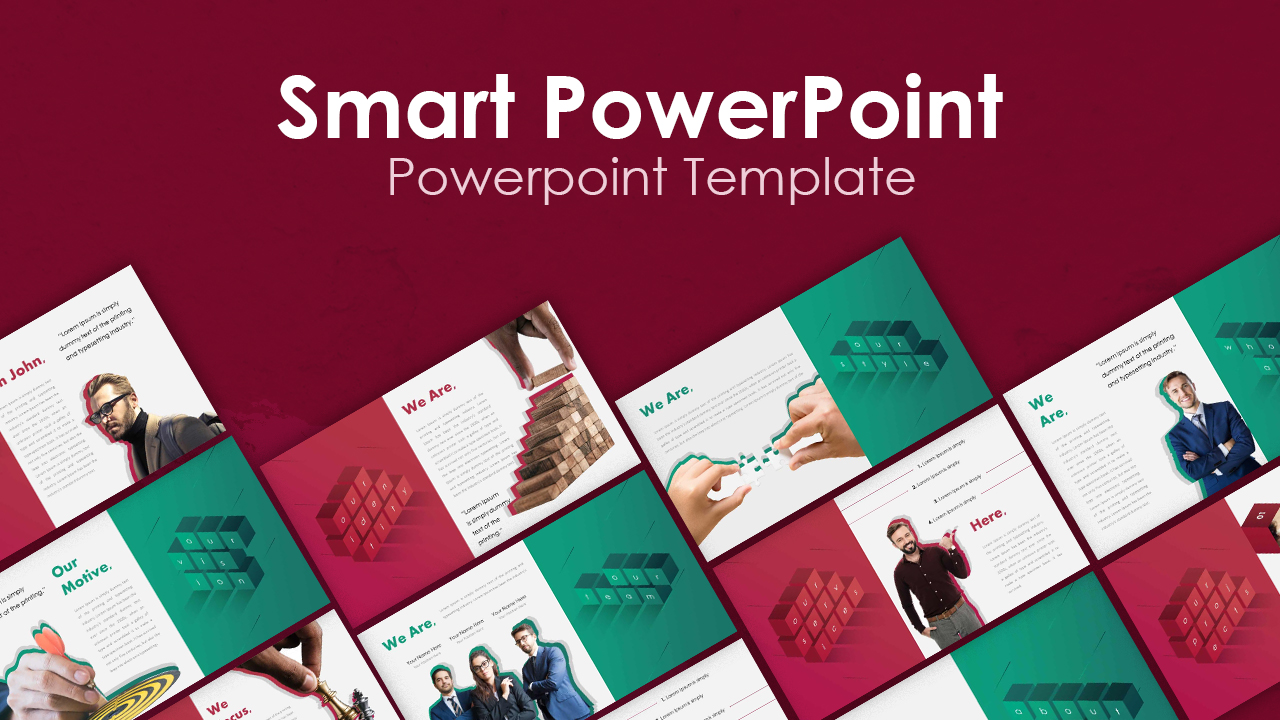
Smart Multi-Purpose PowerPoint Template for PowerPoint & Google Slides
Company Profile
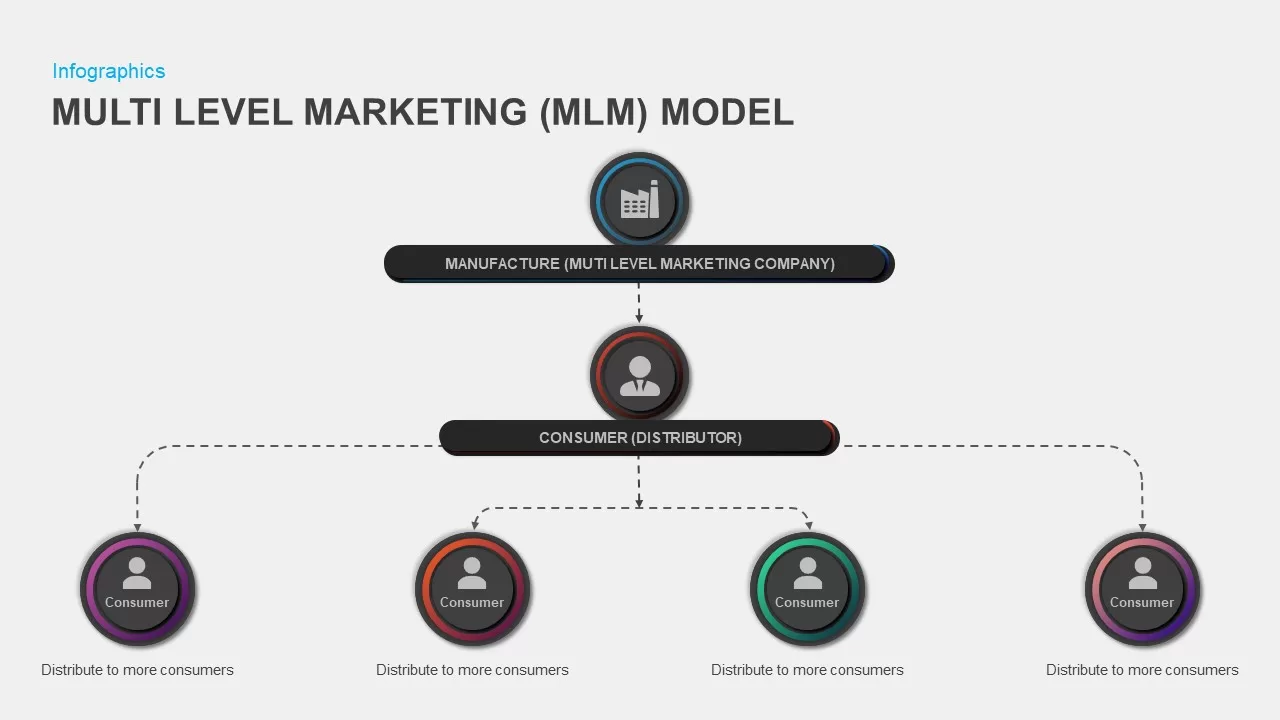
Multi-Level Marketing PowerPoint Template for PowerPoint & Google Slides
Business Models
Multi-Series Curved Line Graph Analytics Template for PowerPoint & Google Slides
Comparison Chart
Horizontal Multi-Level Hierarchy Chart template for PowerPoint & Google Slides
Org Chart
Simple Multi-Branch Mind Map Template for PowerPoint & Google Slides
Mind Maps
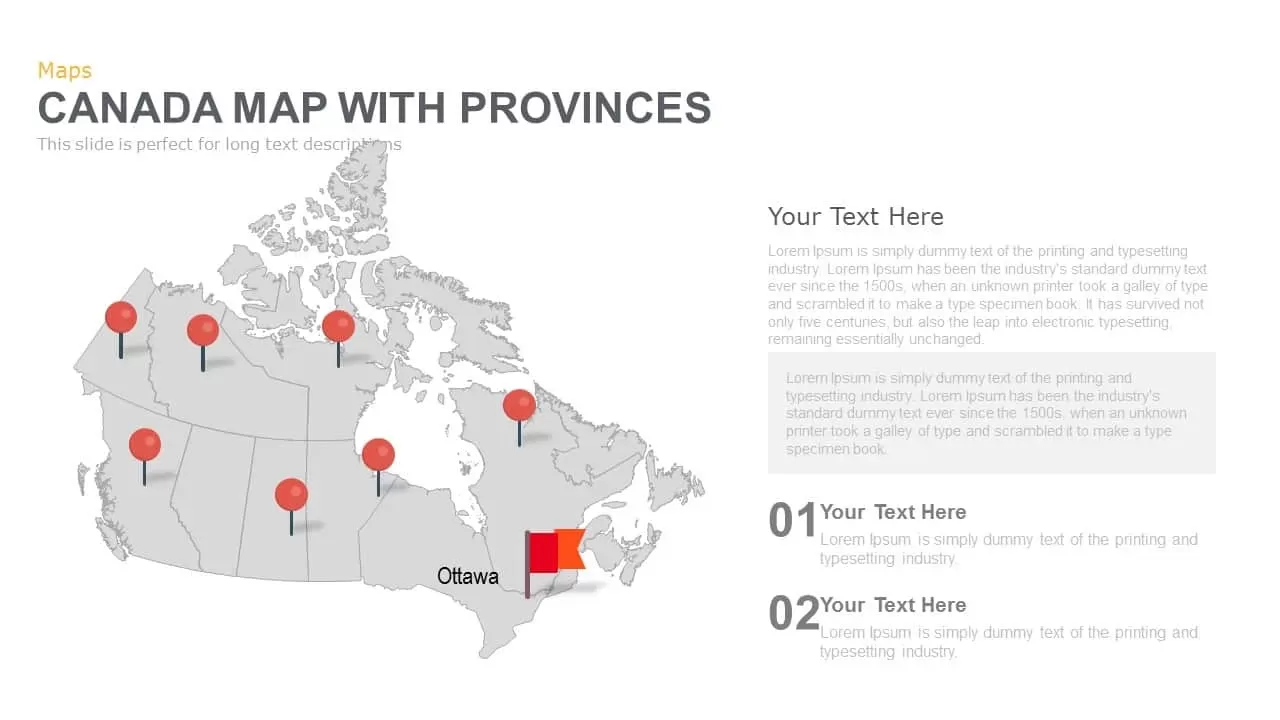
Canada Provinces Map Multi-Layout Template for PowerPoint & Google Slides
World Maps
Multi-Stage Timeline Infographics Template for PowerPoint & Google Slides
Timeline
Multi-Organ Human Body Infographic Template for PowerPoint & Google Slides
Comparison
Multi-Style Presentation Agenda Template for PowerPoint & Google Slides
Agenda
Multi-Year Timeline Infographic Template for PowerPoint & Google Slides
Timeline

Multi-Cluster Mind Map Infographic Template for PowerPoint & Google Slides
Mind Maps
Multi-Functional Presentation Template for PowerPoint & Google Slides
Pitch Deck
Multi-Purpose Corporate Infographic Template for PowerPoint & Google Slides
Company Profile
Free
Doodle Multi Presentation Template for PowerPoint & Google Slides
Company Profile
Free Multi-Year Arrow Timeline Infographic Template for PowerPoint & Google Slides
Timeline
Free
Free Multi-Level Roadmap Infographic Template for PowerPoint & Google Slides
Roadmap
Free
Multi-Step Infographic Process Layout Template for PowerPoint & Google Slides
Process
Multi-Style Flow Infographic Slide template for PowerPoint & Google Slides
Process
Multi-Color Five-Step Curved Arrow Template for PowerPoint & Google Slides
Process
Automotive Infographic Multi-Layout Template for PowerPoint & Google Slides
Comparison
Multi-Series Stacked Bar Chart Template for PowerPoint & Google Slides
Bar/Column
Animated Multi-Gear Cluster Infographic Template for PowerPoint & Google Slides
Process
Versatile 12-Month Multi-Style Timeline Template for PowerPoint & Google Slides
Timeline
Minimal Multi-Year Column Chart Template for PowerPoint & Google Slides
Bar/Column
Editable Multi-Series Peak Line Chart Template for PowerPoint & Google Slides
Comparison Chart
Multi-Color Milestone Timeline Layout Template for PowerPoint & Google Slides
Timeline
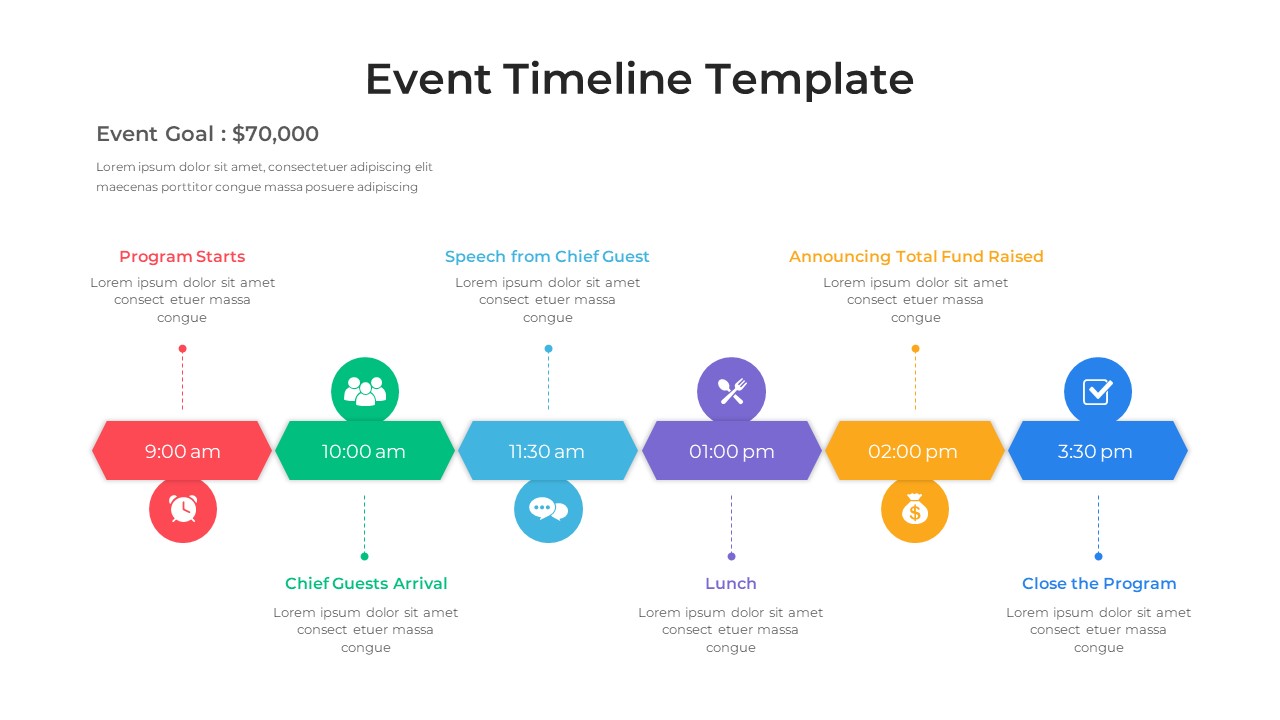
Multi-Style Event Timeline Agenda Template for PowerPoint & Google Slides
Timeline
Multi-Series Line Chart with Icons Template for PowerPoint & Google Slides
Comparison Chart
Multi-Series Vertical Dot Chart Template for PowerPoint & Google Slides
Comparison Chart
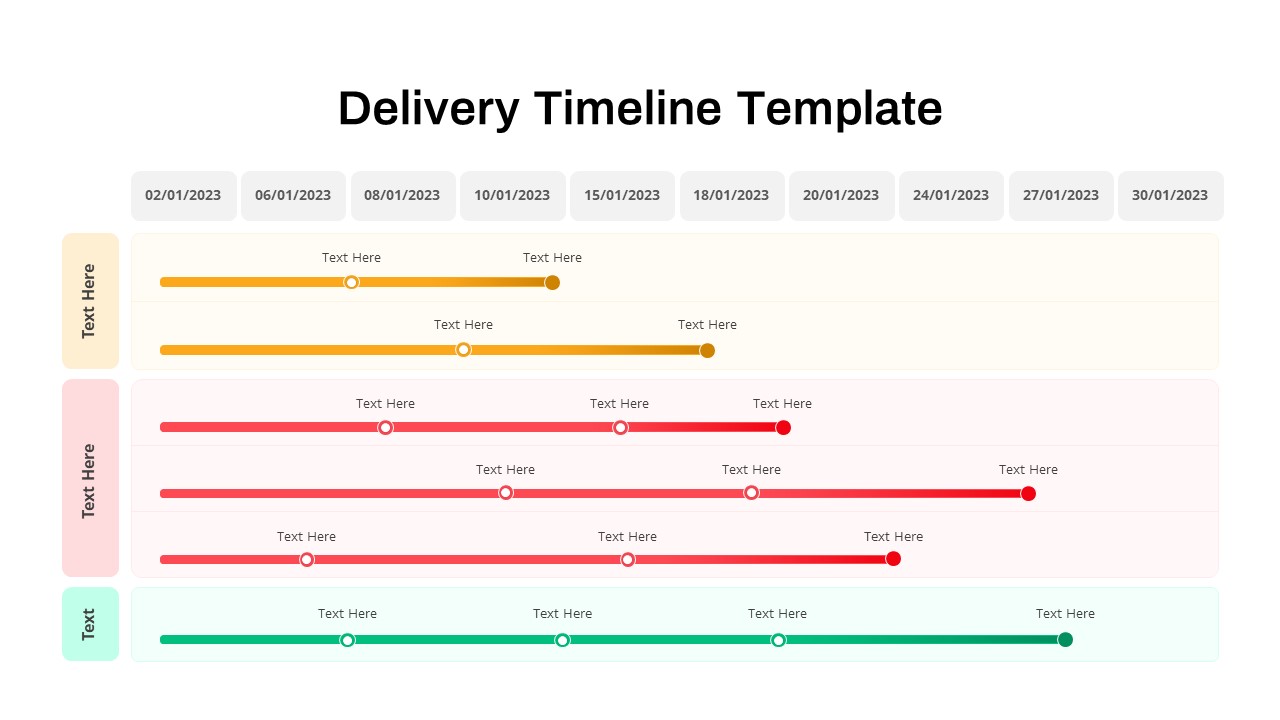
Delivery Timeline Multi-Row Template for PowerPoint & Google Slides
Timeline
Multi-Variation Thermometer Chart Template for PowerPoint & Google Slides
Bar/Column
Interactive Multi-Use Cost Comparison Template for PowerPoint & Google Slides
Comparison
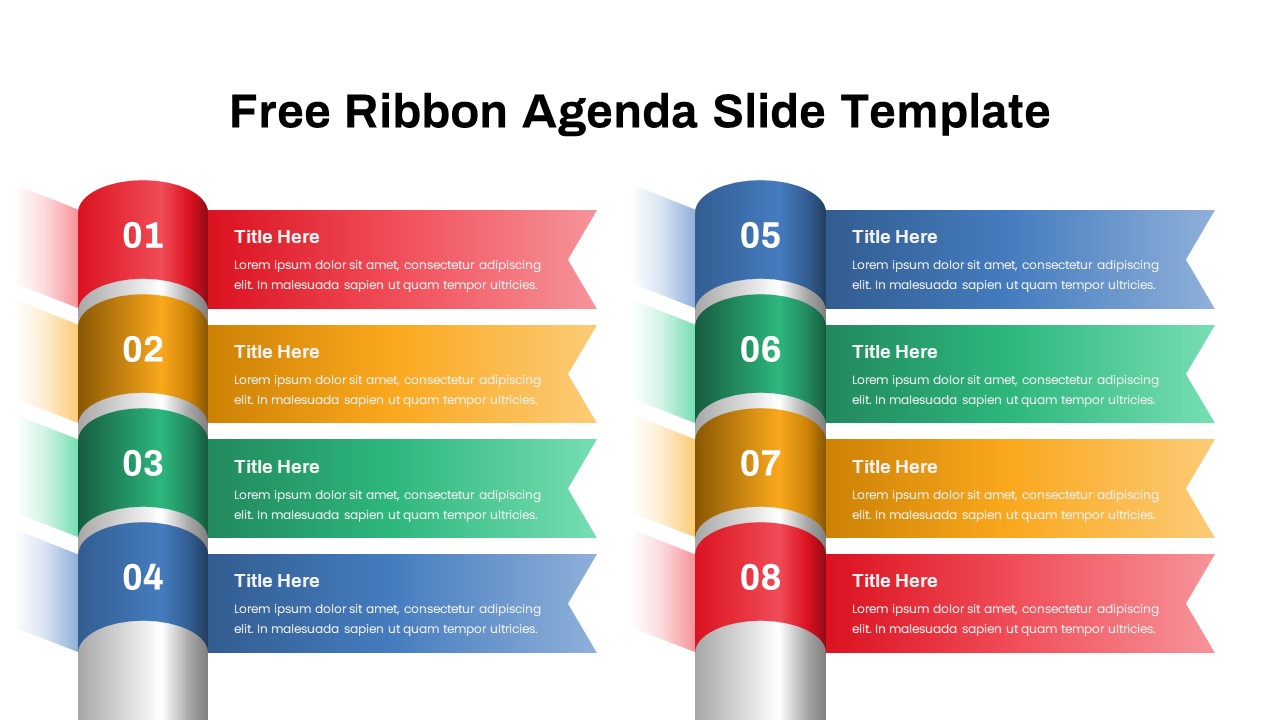
Free Editable Multi-Step Ribbon Agenda Slide Template for PowerPoint & Google Slides
Agenda
Free
Multi-Phase Research Roadmap Infographic Template for PowerPoint & Google Slides
Roadmap
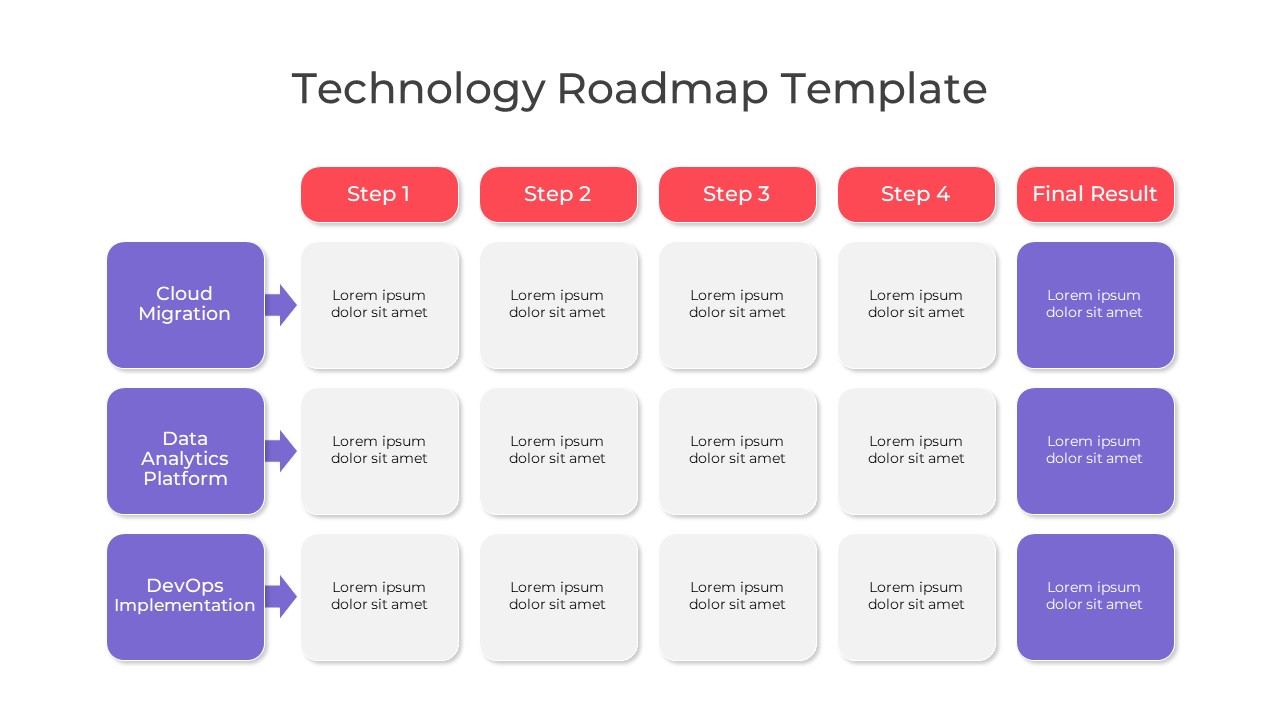
Multi-Color Technology Roadmap Template Pack for PowerPoint & Google Slides
Roadmap
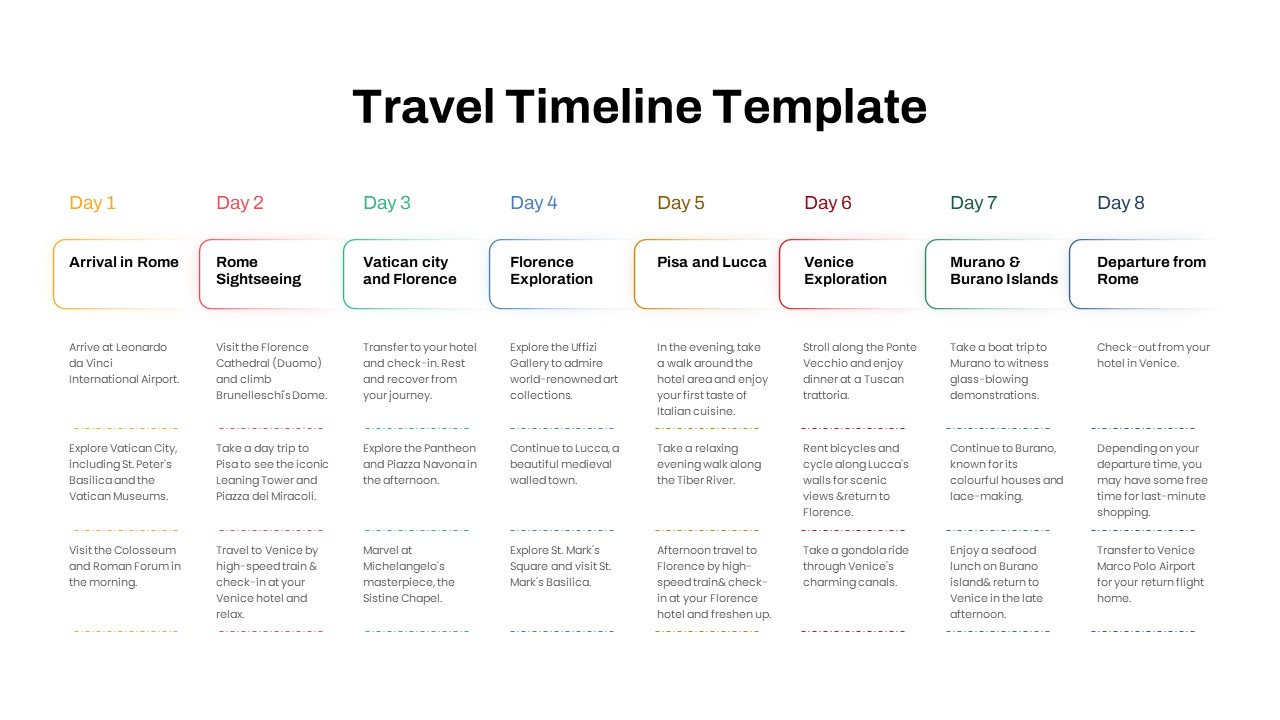
Free Elegant Multi-Day Travel Timeline Template for PowerPoint & Google Slides
Timeline
Free
Multi-Level Colorful Pyramid Chart Template for PowerPoint & Google Slides
Pyramid
Free Multi-Step Funnel Infographic Slide Pack Template for PowerPoint & Google Slides
Funnel
Free
Free Minimal Multi-Color Table of Contents Template for PowerPoint & Google Slides
Agenda
Free
Colorful Multi-Branch Mind Map Slide Template for PowerPoint & Google Slides
Mind Maps
Multi-color Curved Timeline Roadmap Template for PowerPoint & Google Slides
Timeline
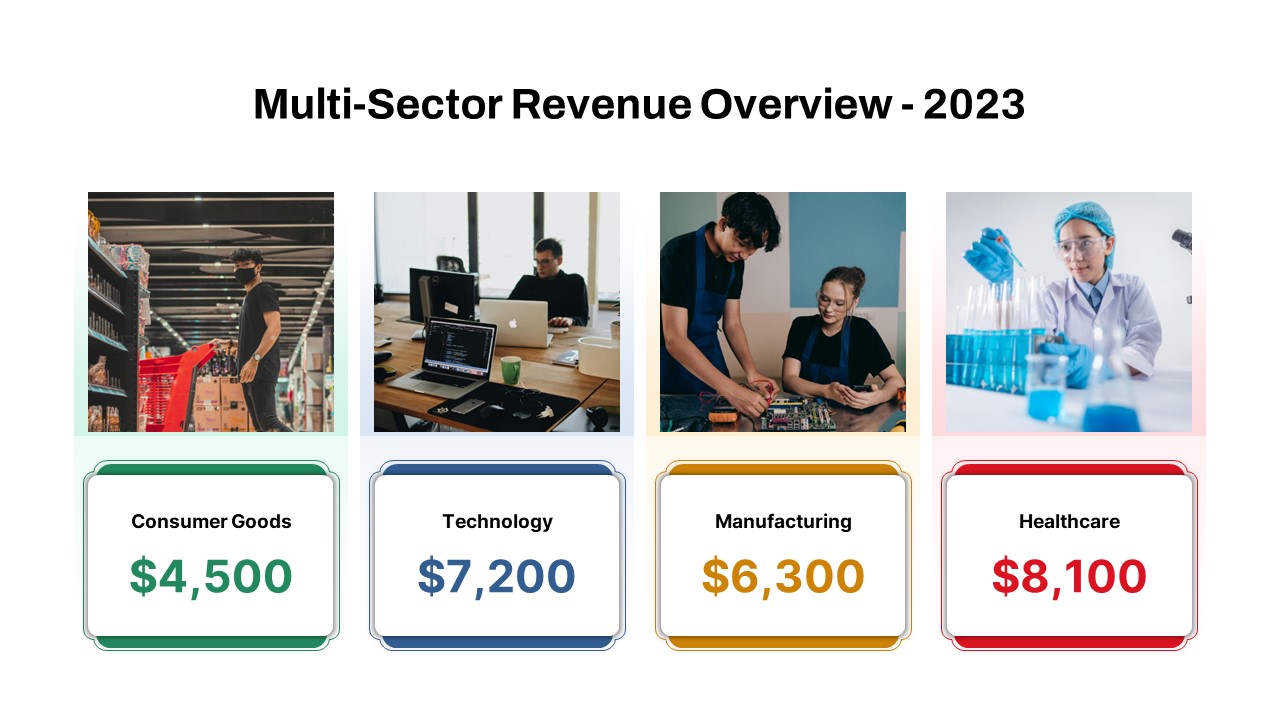
Multi-Sector Revenue Breakdown Cards Template for PowerPoint & Google Slides
Comparison
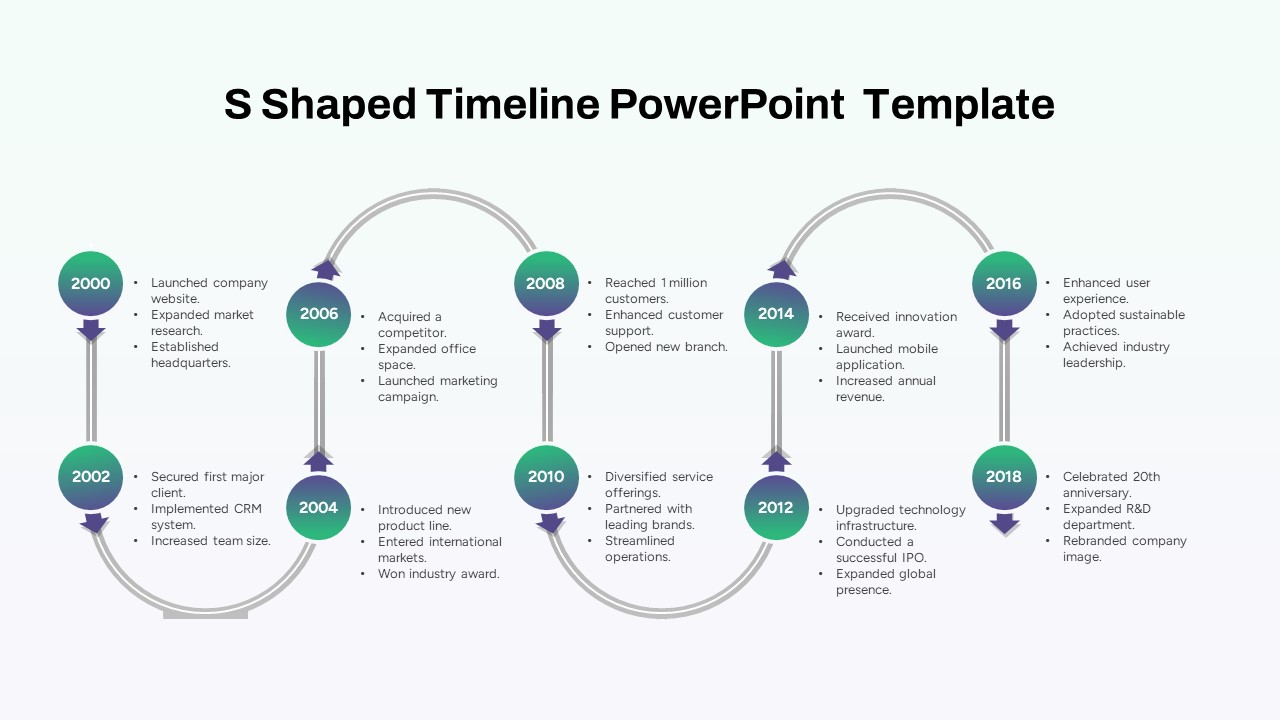
Multi-Year S-Shaped Roadmap Timeline Template for PowerPoint & Google Slides
Timeline
Multi-Style Board of Directors Profile Template for PowerPoint & Google Slides
Our Team
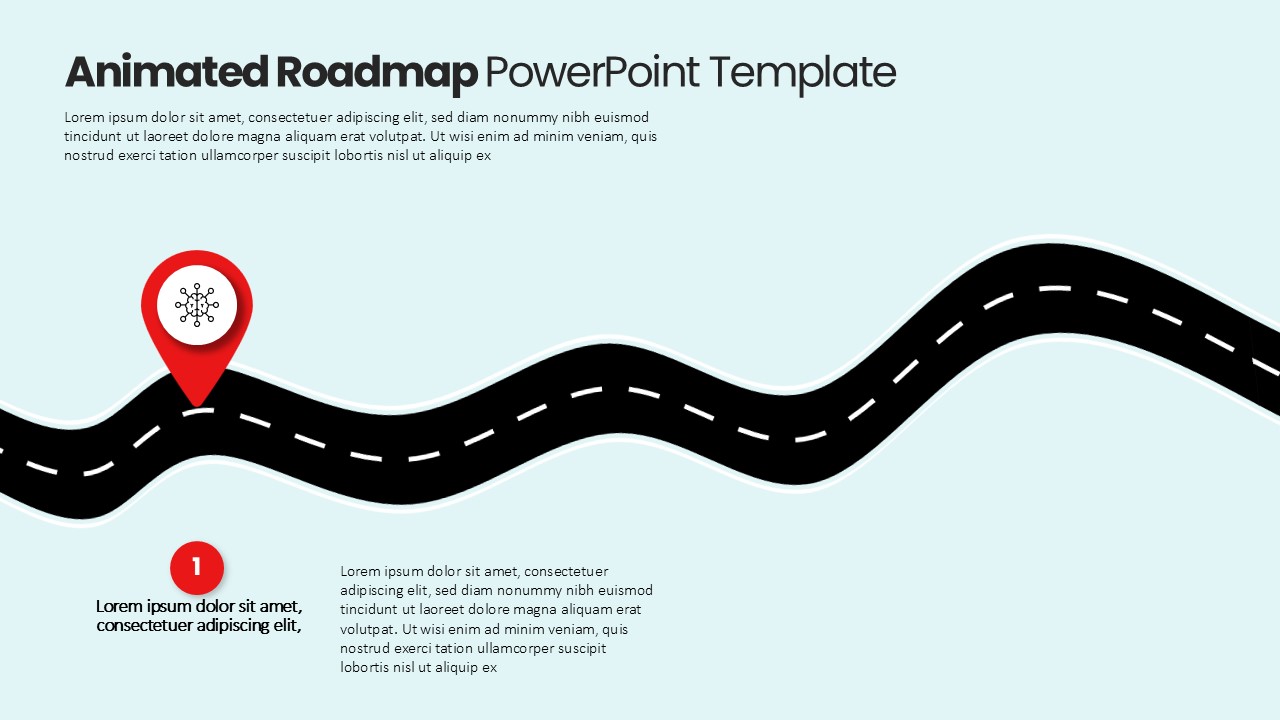
Animated Multi-Milestone Roadmap Template for PowerPoint & Google Slides
Roadmap
Multi-Column Table Presentation Template for PowerPoint & Google Slides
Table
Six-Row Multi-Column Table Presentation Template for PowerPoint & Google Slides
Table
Multi Color SWOT Analysis Quadrant Template for PowerPoint & Google Slides
SWOT
Free Eight Circle Creative Diagram template for PowerPoint & Google Slides
Circular
Free
Five-Stage Semi-Circle Diagram Template for PowerPoint & Google Slides
Process
Two-Stage Semi-Circle Diagram Overview Template for PowerPoint & Google Slides
Circular
Dan Harmon Story Circle Diagram Template for PowerPoint & Google Slides
Circular