Current vs Future State Comparison Slide Template for PowerPoint & Google Slides


Description
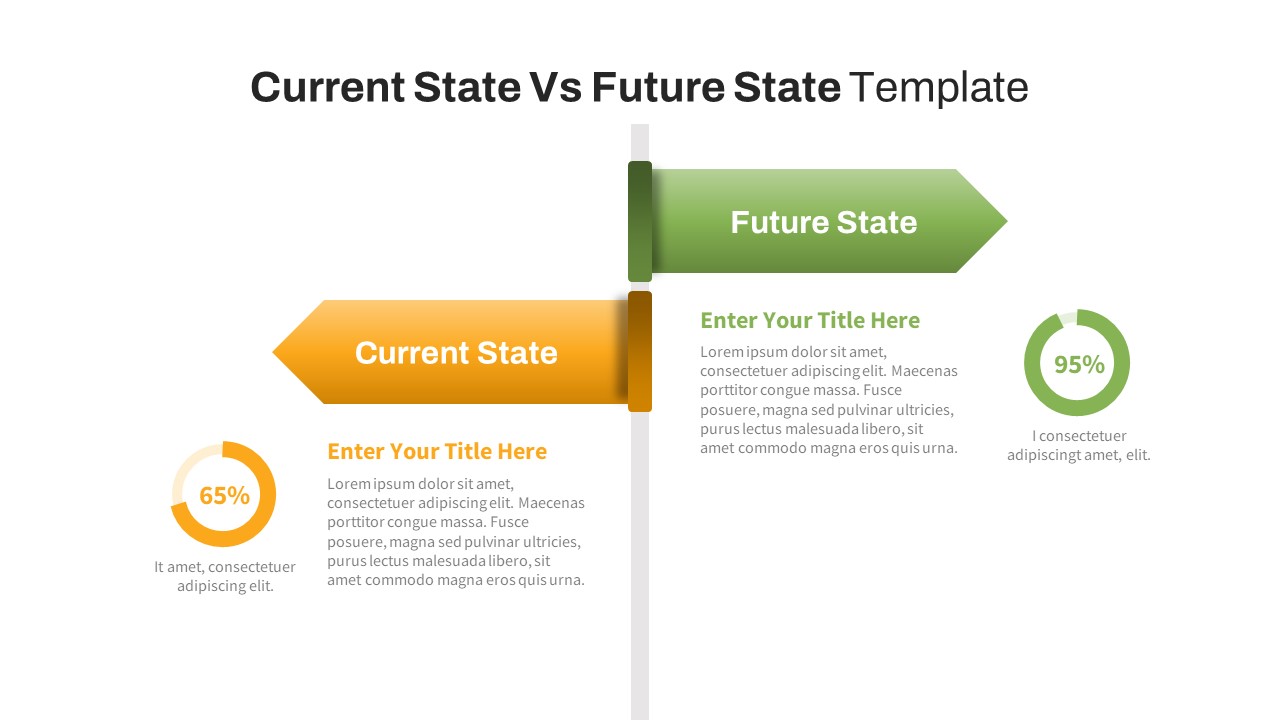
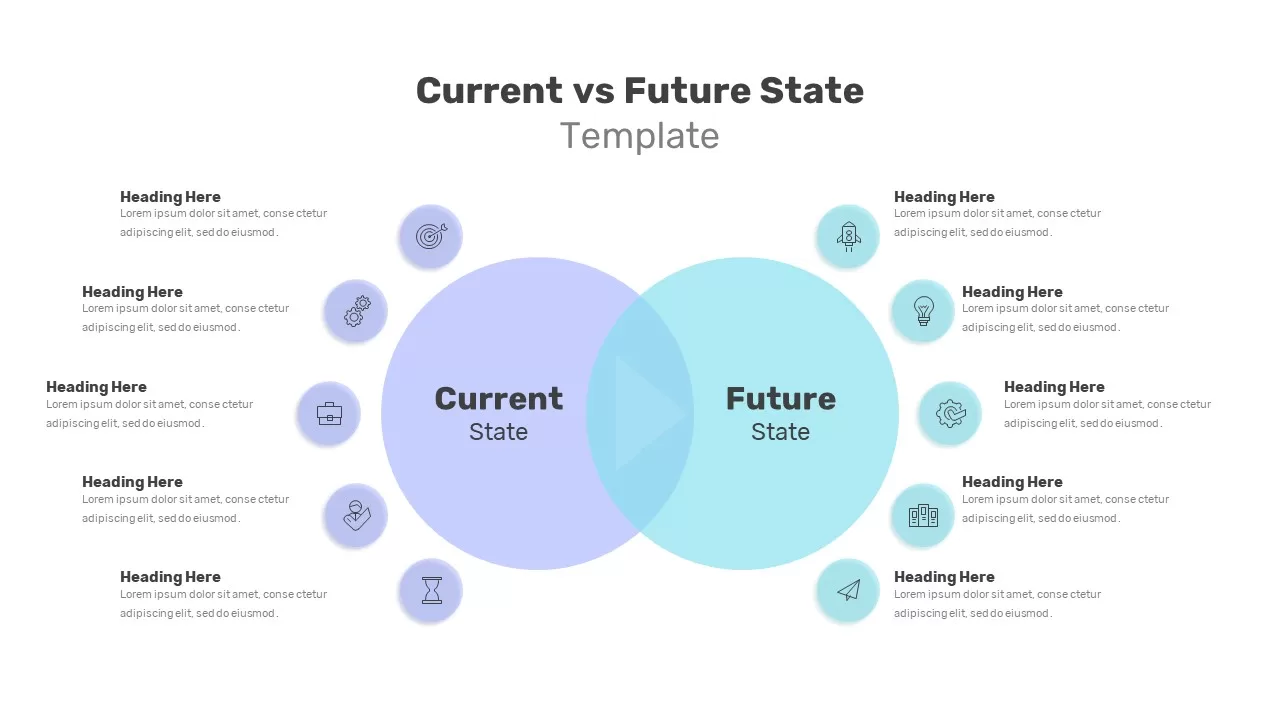
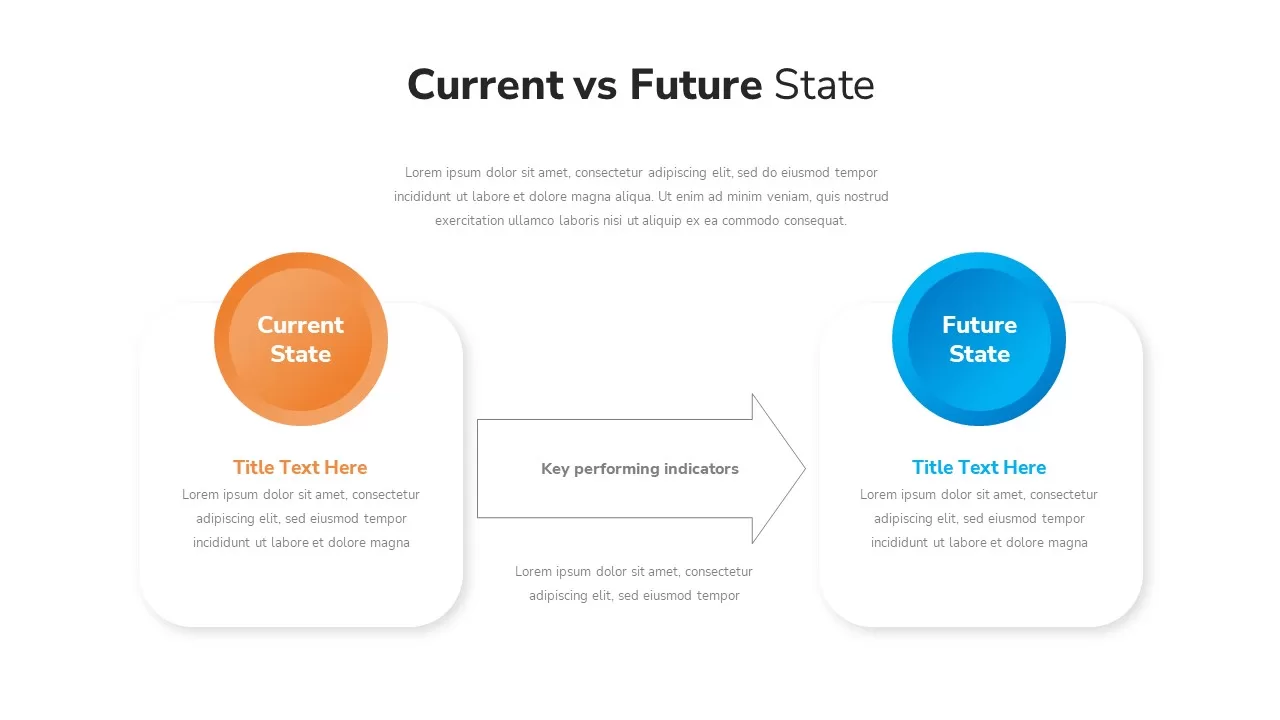
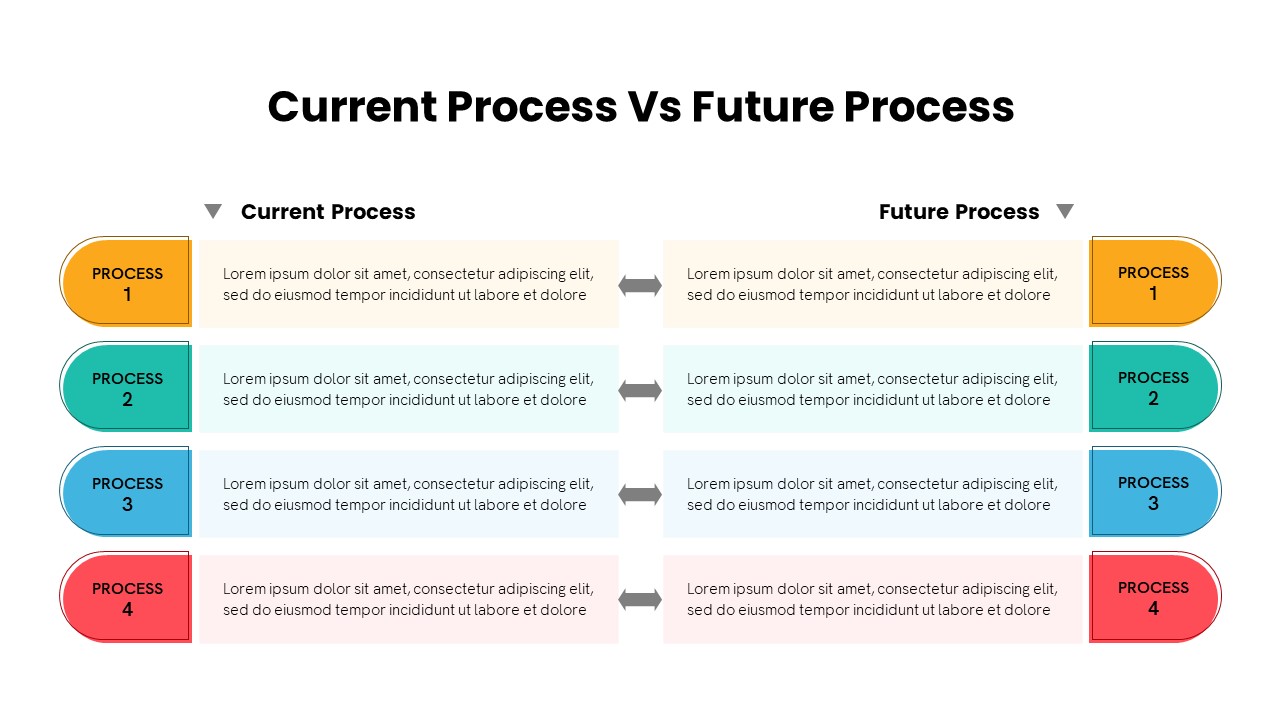
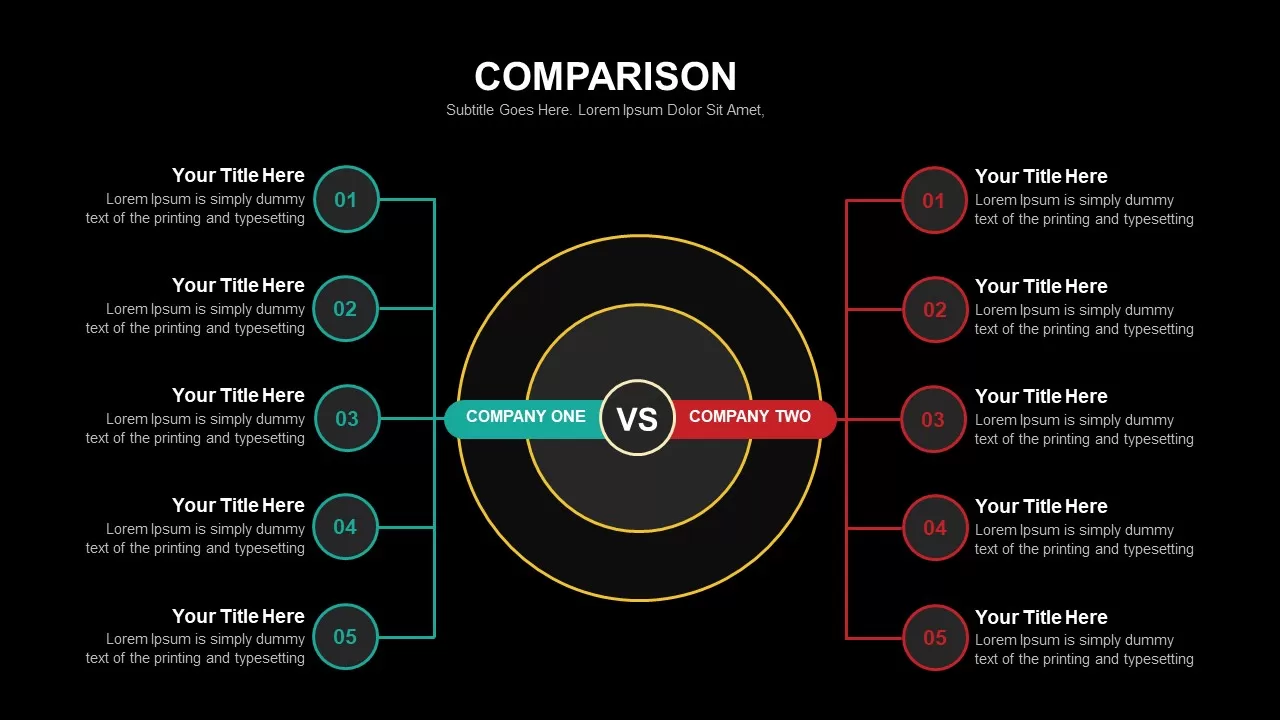
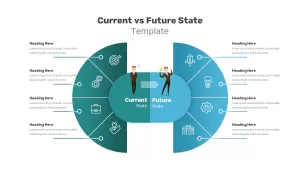
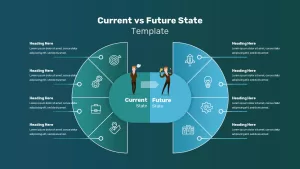
This professional infographic slide presents a clear comparison of a current versus future state using a radial hub-and-spoke design. Two semi-circular rings flank a central two-tone pill shape labeled “Current State” on the left and “Future State” on the right. The left ring is rendered in a gradient of deep green to mint, while the right ring shifts from bright cyan to sky blue. Eight evenly spaced radial segments each contain a flat white icon and connect via fine lines to text callouts for concise headings and supporting details. Subtle drop shadows and a dotted outer outline reinforce dimensionality against a clean white backdrop.
Built on editable master slides for both PowerPoint and Google Slides, this template leverages fully vector-based shapes, gradient fills, and hidden alignment guides. Instantly swap icons, adjust ring thickness, modify gradients to match your brand palette, or reposition connectors for additional annotation points. Predefined typography styles guarantee consistent formatting across headings and body text, while snap-to-grid functionality eliminates manual alignment struggles. The modular structure supports quick adaptation—hide or duplicate connectors to highlight only the most critical factors driving change.
Ideal for gap analyses, performance reviews, or organizational transformation roadmaps, this radial comparison model helps stakeholders visualize before-and-after scenarios at a glance. Use it to map technology migrations, process improvements, or customer journey enhancements within executive briefings, strategic workshops, or team meetings. Cross-platform compatibility eradicates formatting conflicts, enabling smooth collaboration across Windows, macOS, and web-based editors. Fast customization and professional polish empower presenters to communicate complex transitions with clarity and impact in minutes.
Who is it for
Business analysts, change leaders, and project managers who need to compare current operations with future goals. Perfect for strategic planning sessions, executive briefings, and stakeholder alignment workshops.
Other Uses
Repurpose this layout for maturity assessments, risk versus reward analyses, or KPI comparisons. Tailor the number of callouts to illustrate service improvements, organizational shifts, or customer experience enhancements.
Login to download this file

Item ID
SB02778
Related Templates

Free Current State vs Future State Template for PowerPoint & Google Slides
Business Strategy
Free
Current vs Future State Comparison Slide Template for PowerPoint & Google Slides
Comparison Chart
Current vs Future State Comparison Template for PowerPoint & Google Slides
Comparison Chart
Modern Current vs Future State Template for PowerPoint & Google Slides
Comparison
Current vs Future State Venn Diagram Template for PowerPoint & Google Slides
Comparison
Current vs Future State Analysis template for PowerPoint & Google Slides
Comparison
Current vs Future State Gap Analysis template for PowerPoint & Google Slides
Comparison
Current VS Future State PowerPoint Presentation Template
Comparison Chart
Current State Assessment Template for PowerPoint & Google Slides
Gap
Current vs Future Process Flow Template for PowerPoint & Google Slides
Comparison
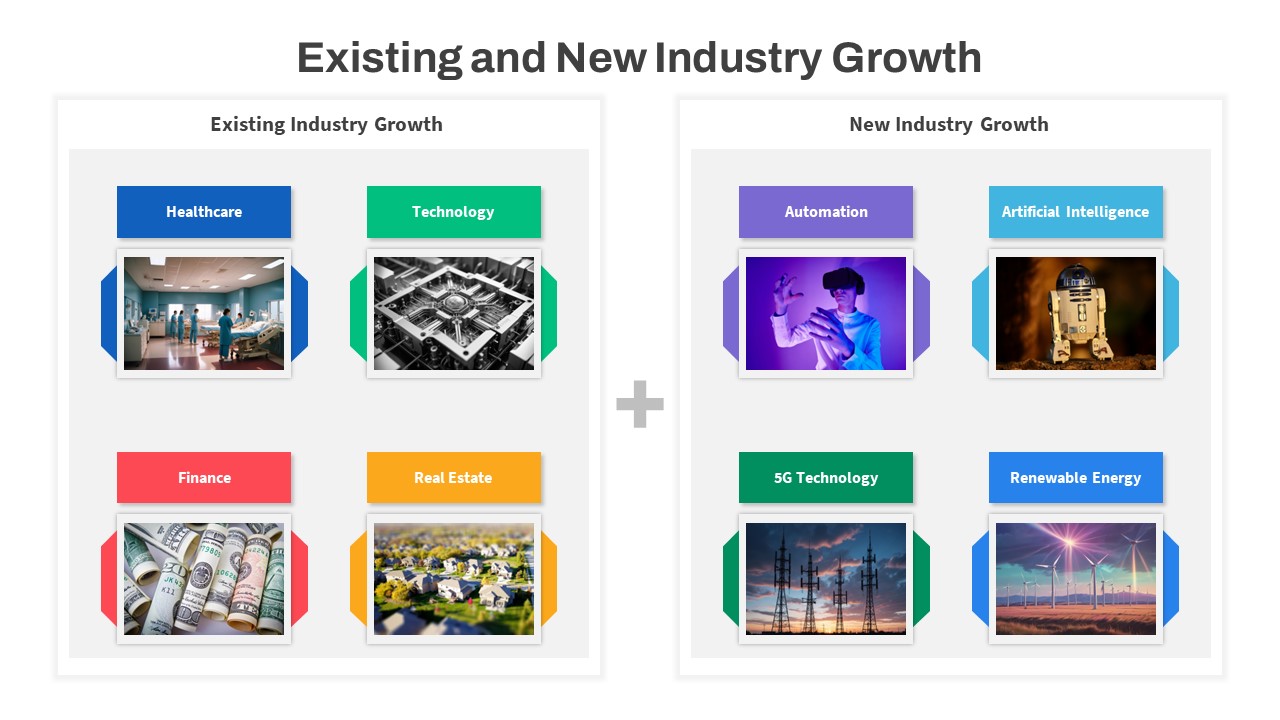
Current and Future Industry Innovations Template for PowerPoint & Google Slides
Comparison
Customizable USA Map With State Markers Template for PowerPoint & Google Slides
World Maps
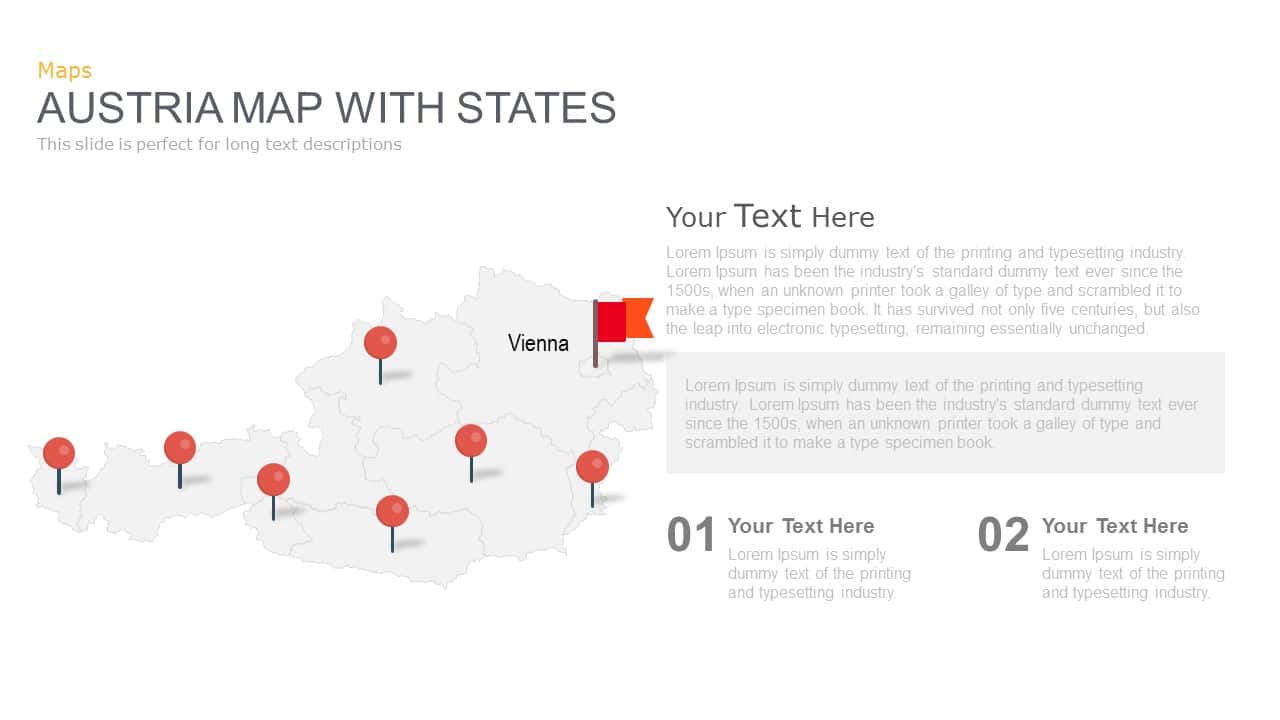
Austria Map With State Markers Template for PowerPoint & Google Slides
World Maps

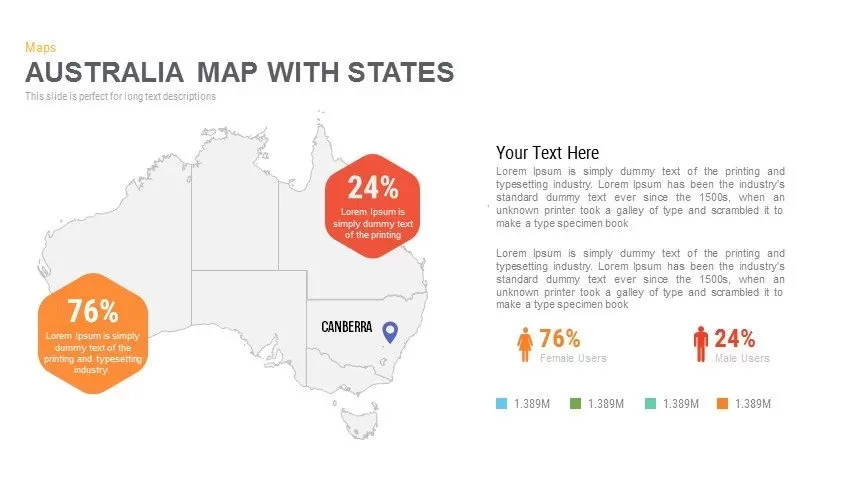
Australia Map with State Markers Template for PowerPoint & Google Slides
Maps
Pennsylvania State Map Diagram Template for PowerPoint & Google Slides
World Maps
AI & Future of Work Gradient Cover Slide Template for PowerPoint & Google Slides
AI
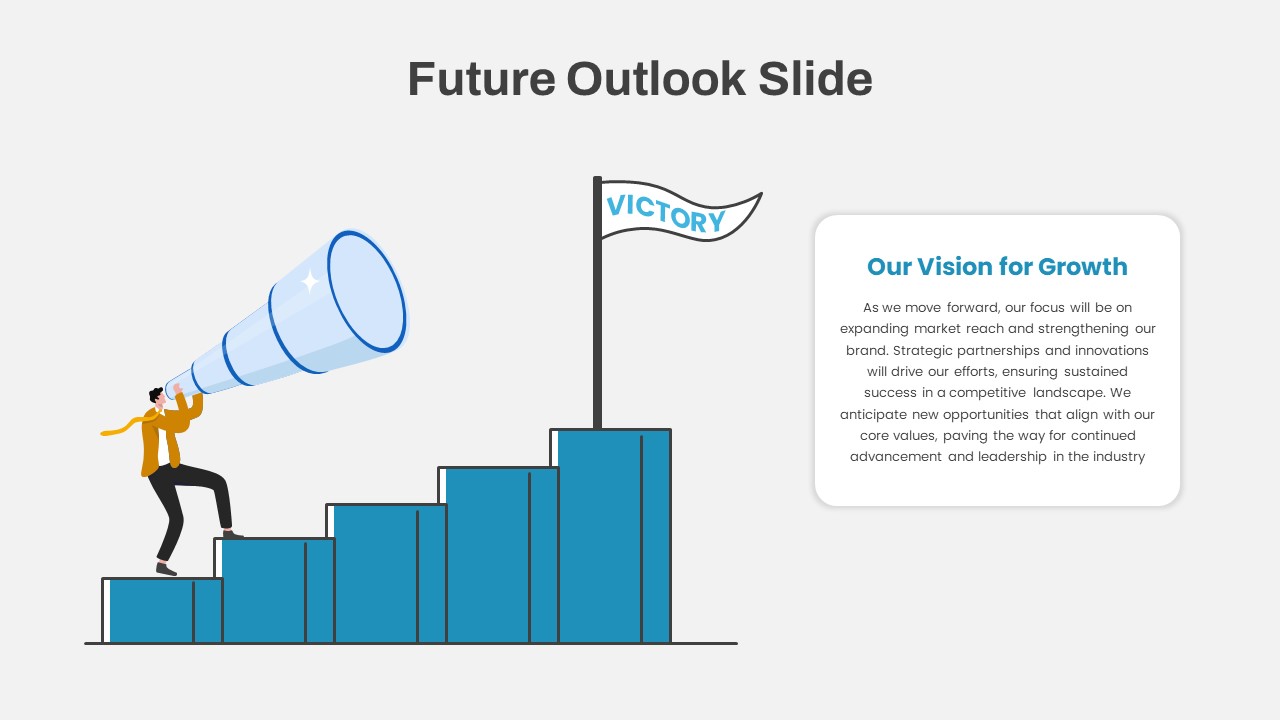
Future Outlook and Growth Strategy Slide Template for PowerPoint & Google Slides
Infographics
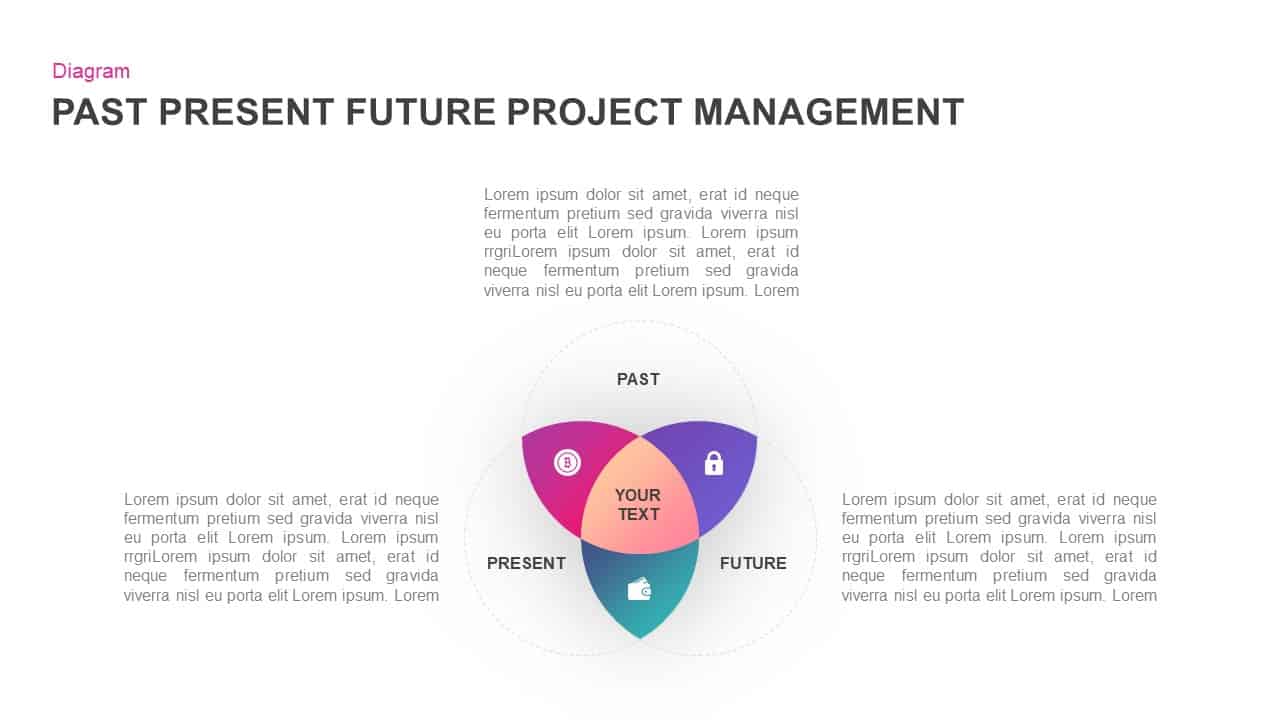
Past, Present & Future Venn Diagram Template for PowerPoint & Google Slides
Comparison
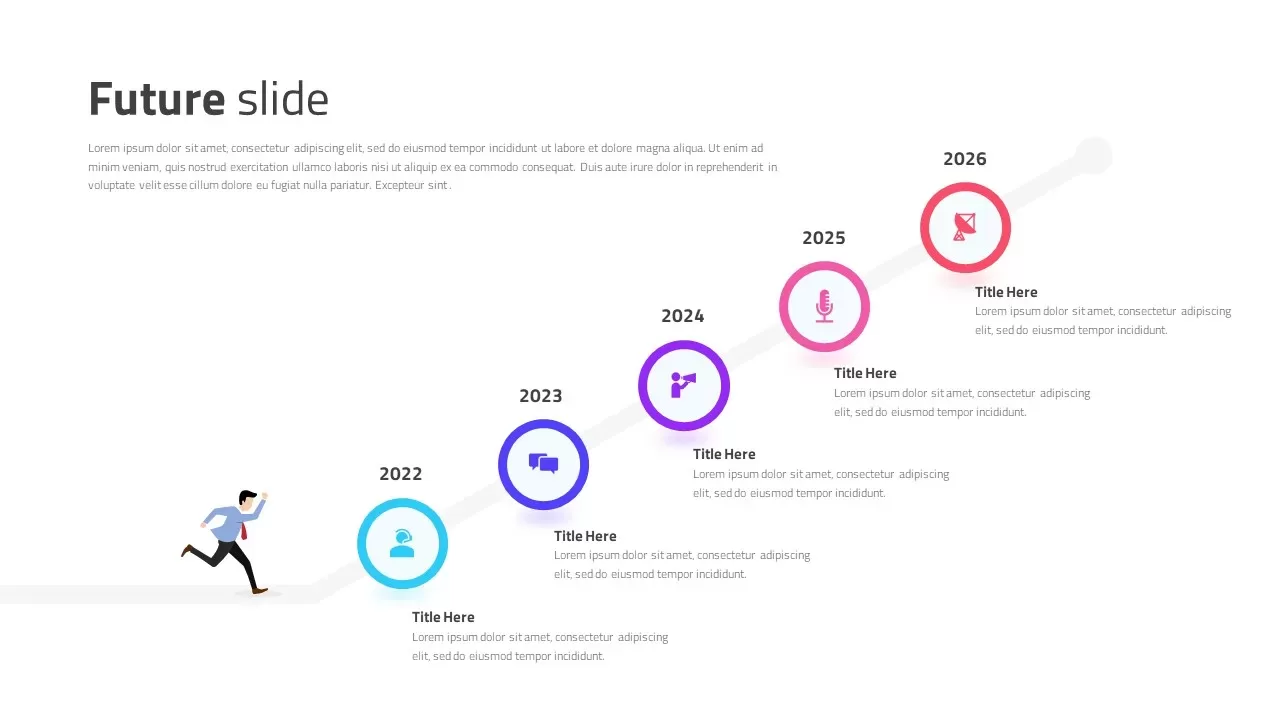
Diagonal Future Timeline Template for PowerPoint & Google Slides
Timeline
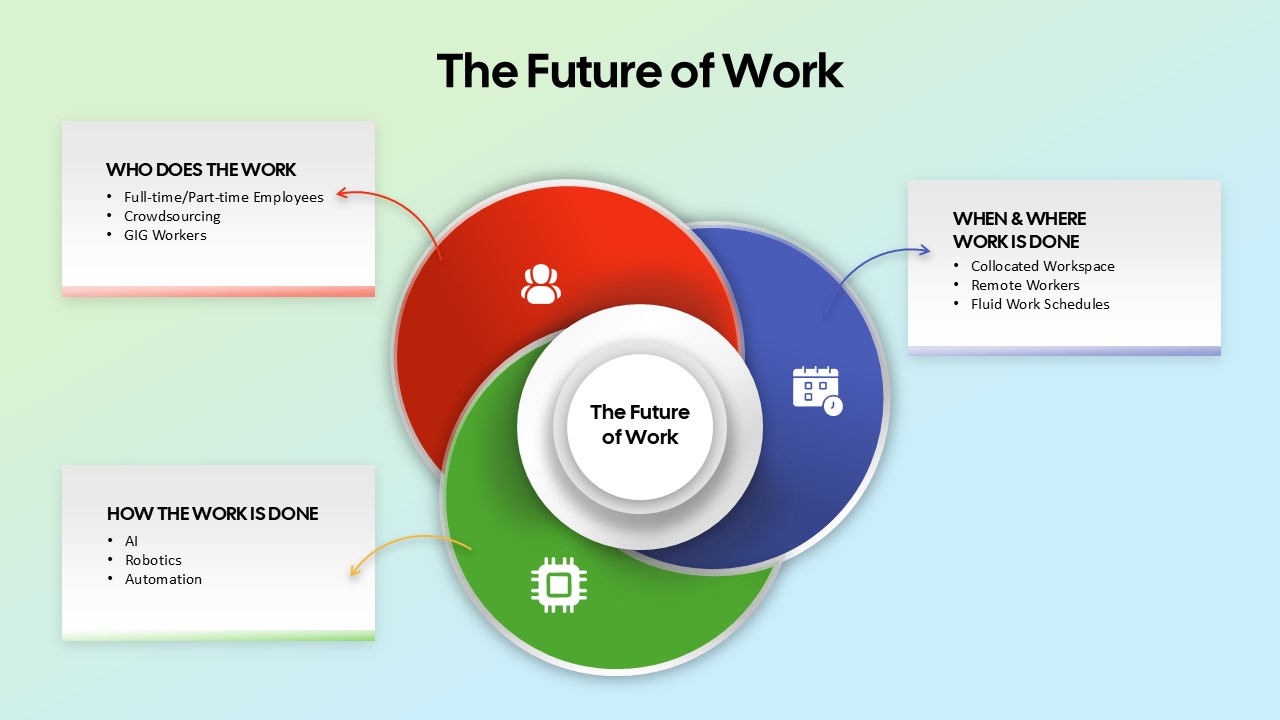
The Future of Work Venn Diagram Template for PowerPoint & Google Slides
Circular
Clean Mobile Service Comparison Slide Template for PowerPoint & Google Slides
Comparison
Tornado Chart Data Comparison Slide Template for PowerPoint & Google Slides
Bar/Column
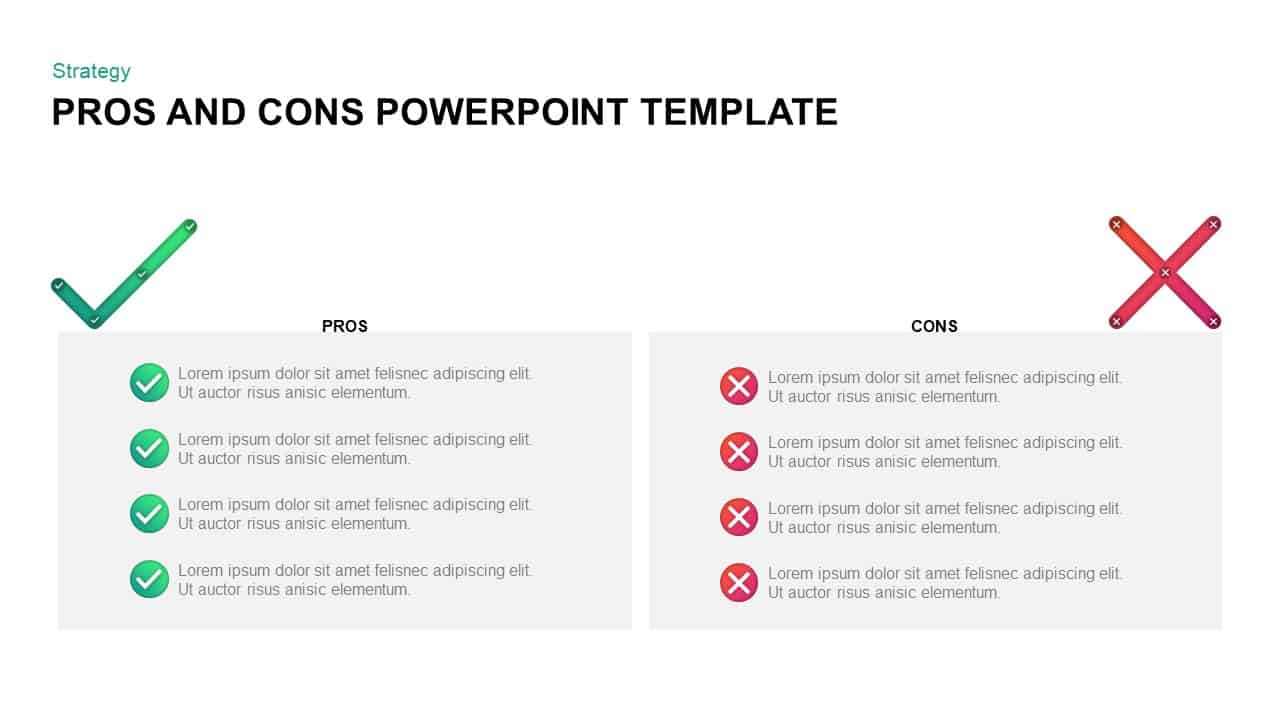
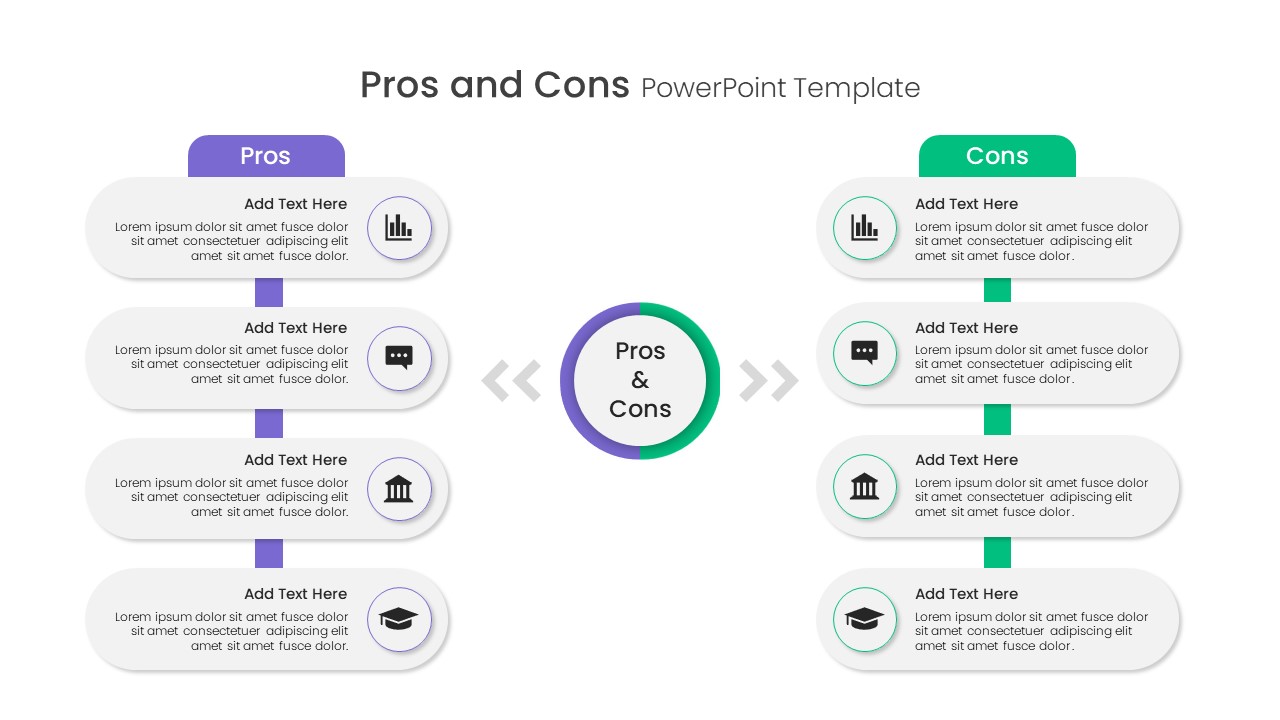
Pros and Cons Comparison Slide Template for PowerPoint & Google Slides
Comparison
Two-Column Comparison Infographic Slide Template for PowerPoint & Google Slides
Comparison
Fact and Figures Comparison Slide Template for PowerPoint & Google Slides
Business Report
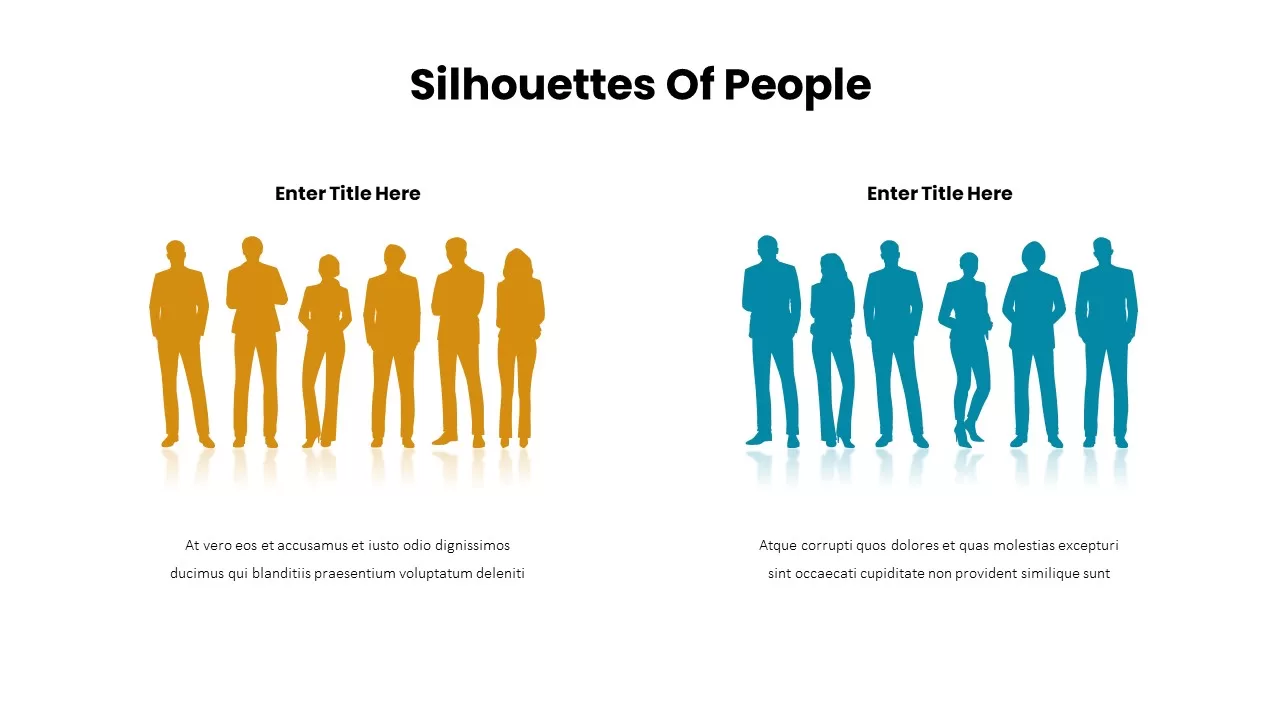
Business Silhouettes Comparison Slide Template for PowerPoint & Google Slides
HR
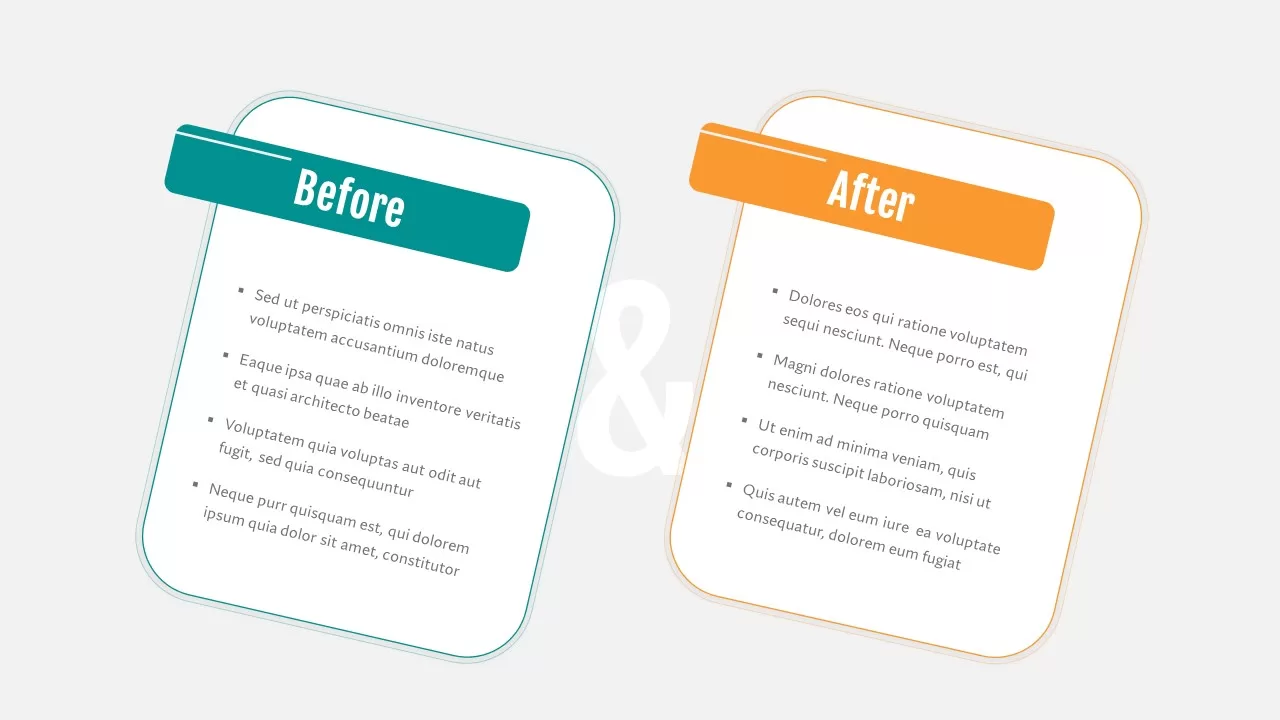
Before and After Comparison Slide Template for PowerPoint & Google Slides
Comparison
Benchmarking Metrics Comparison Slide Template for PowerPoint & Google Slides
Pie/Donut
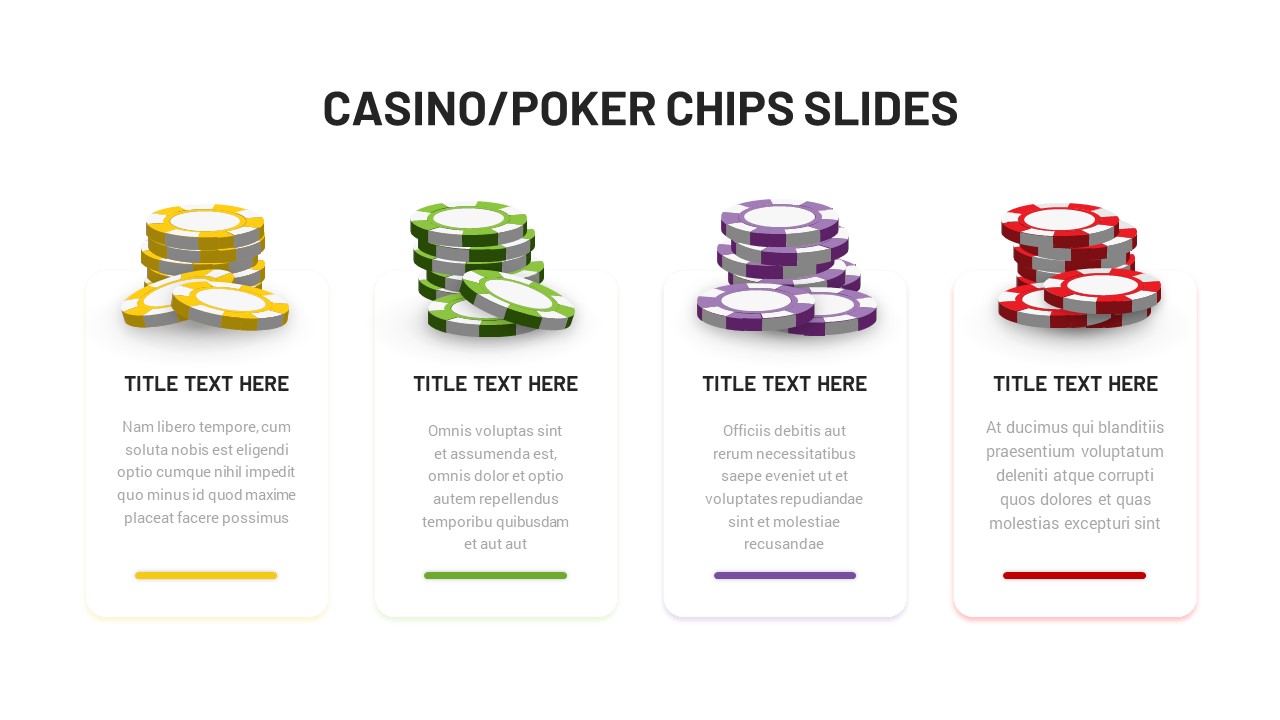
Casino Poker Chips Comparison Slide Template for PowerPoint & Google Slides
Comparison
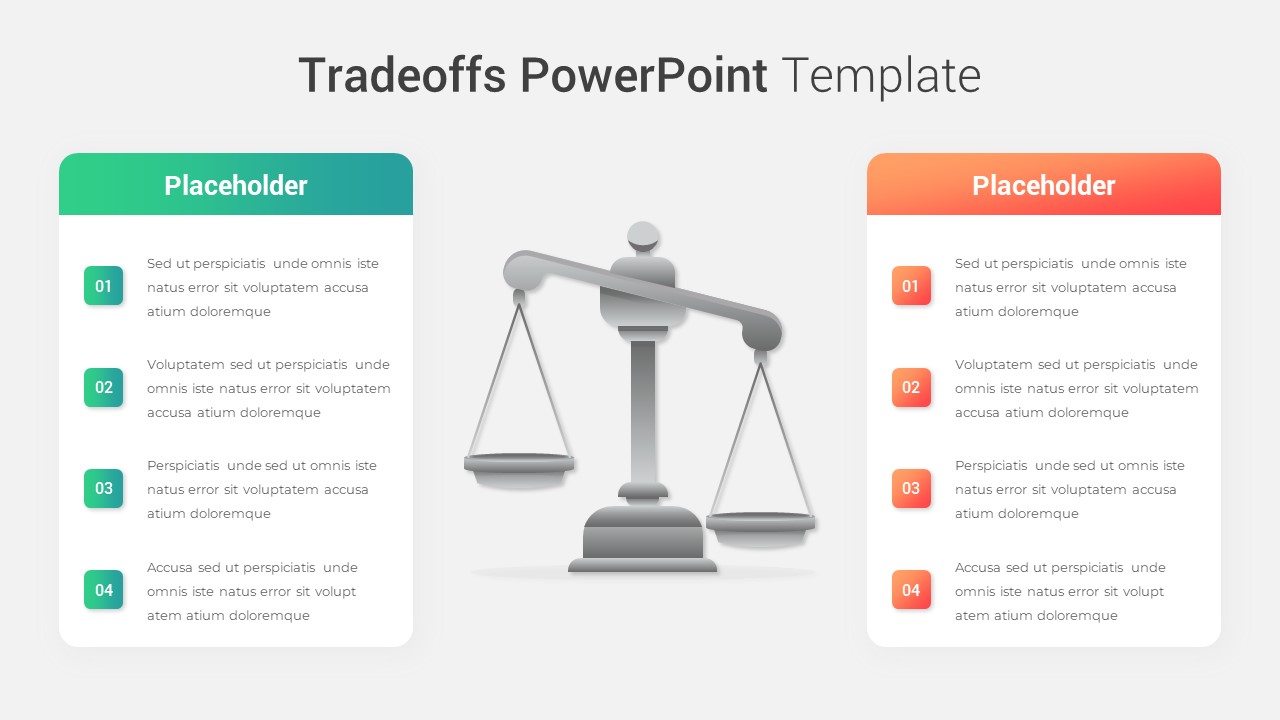
Modern Tradeoffs Comparison Slide Template for PowerPoint & Google Slides
Comparison
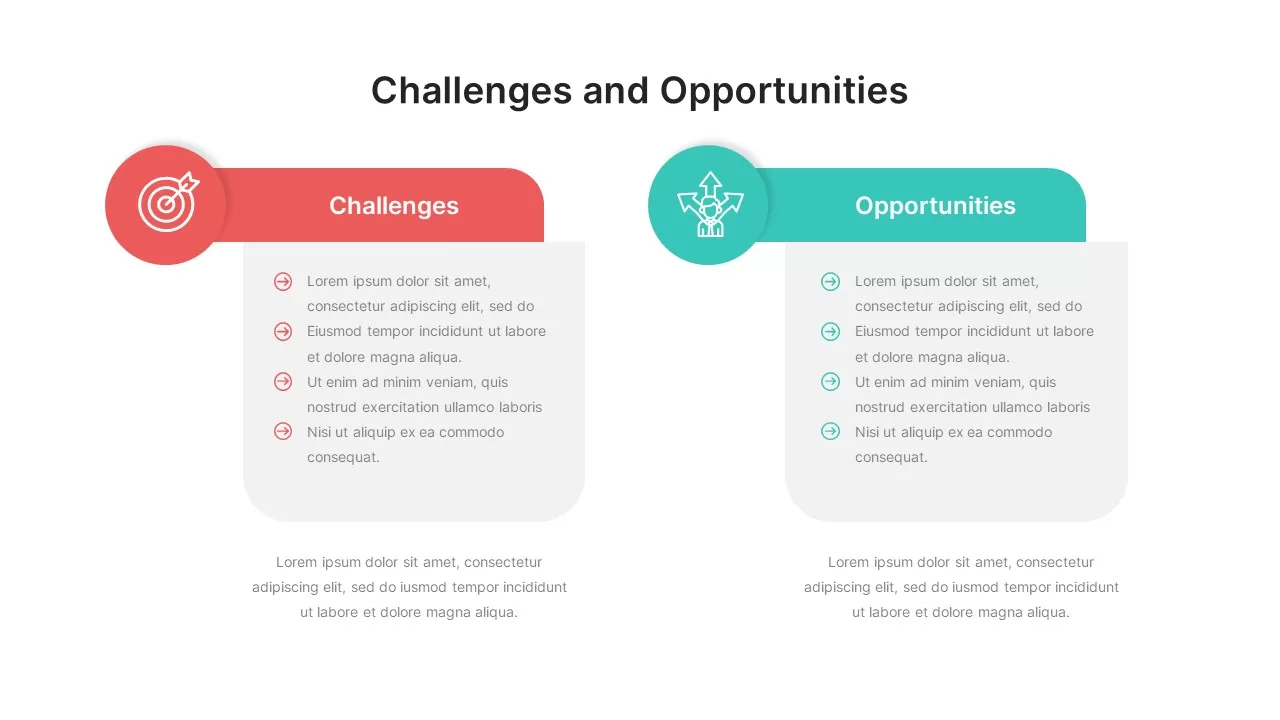
Challenges and Opportunities Comparison Slide for PowerPoint & Google Slides
Opportunities Challenges
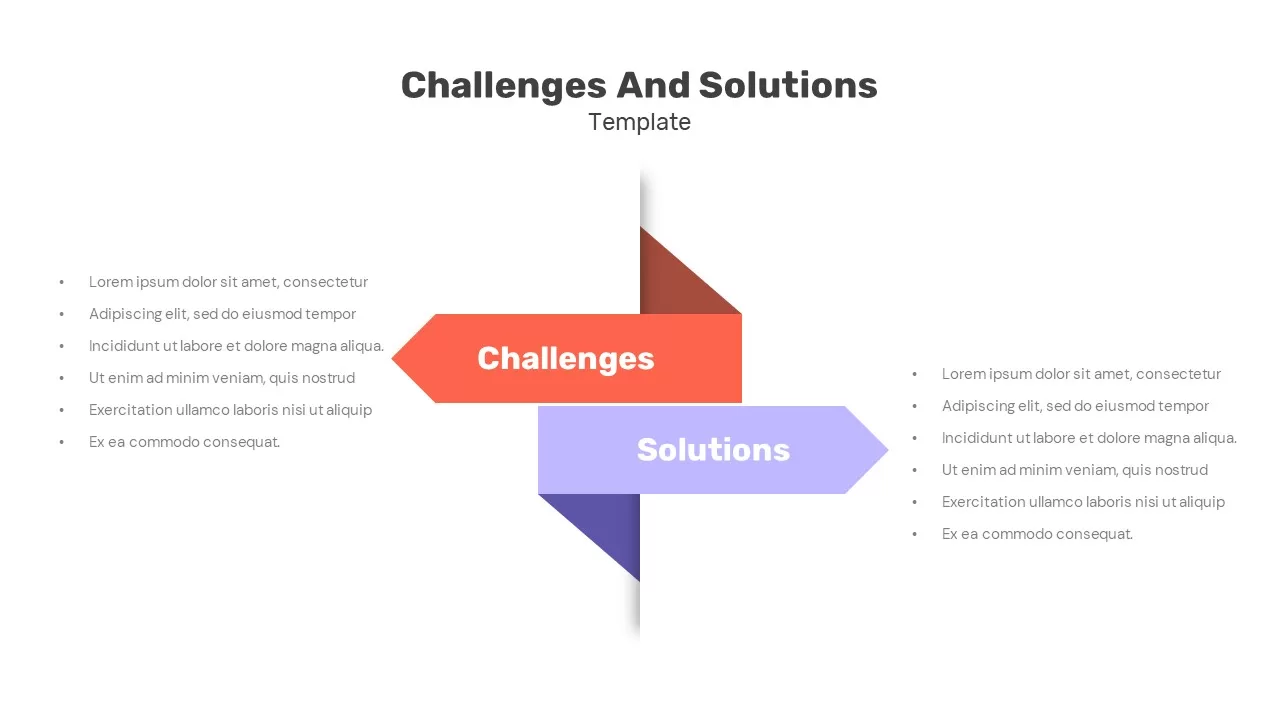
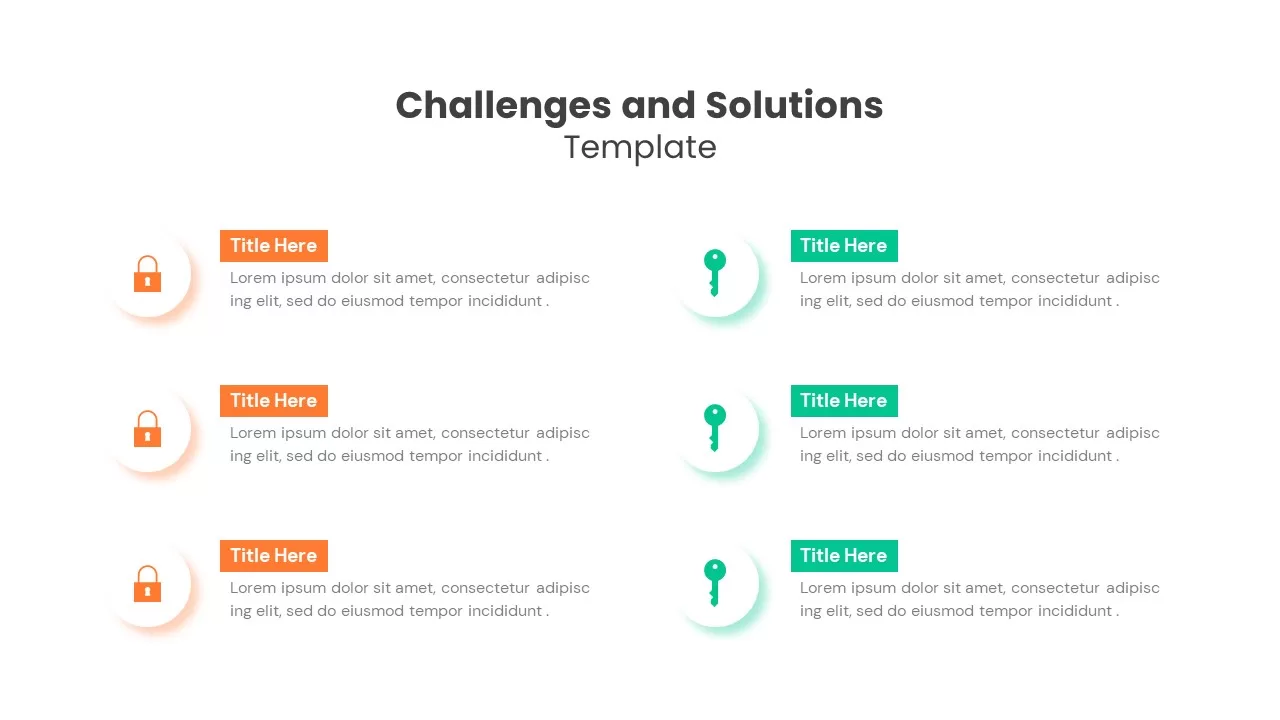
Challenges and Solutions Comparison Slide for PowerPoint & Google Slides
Opportunities Challenges
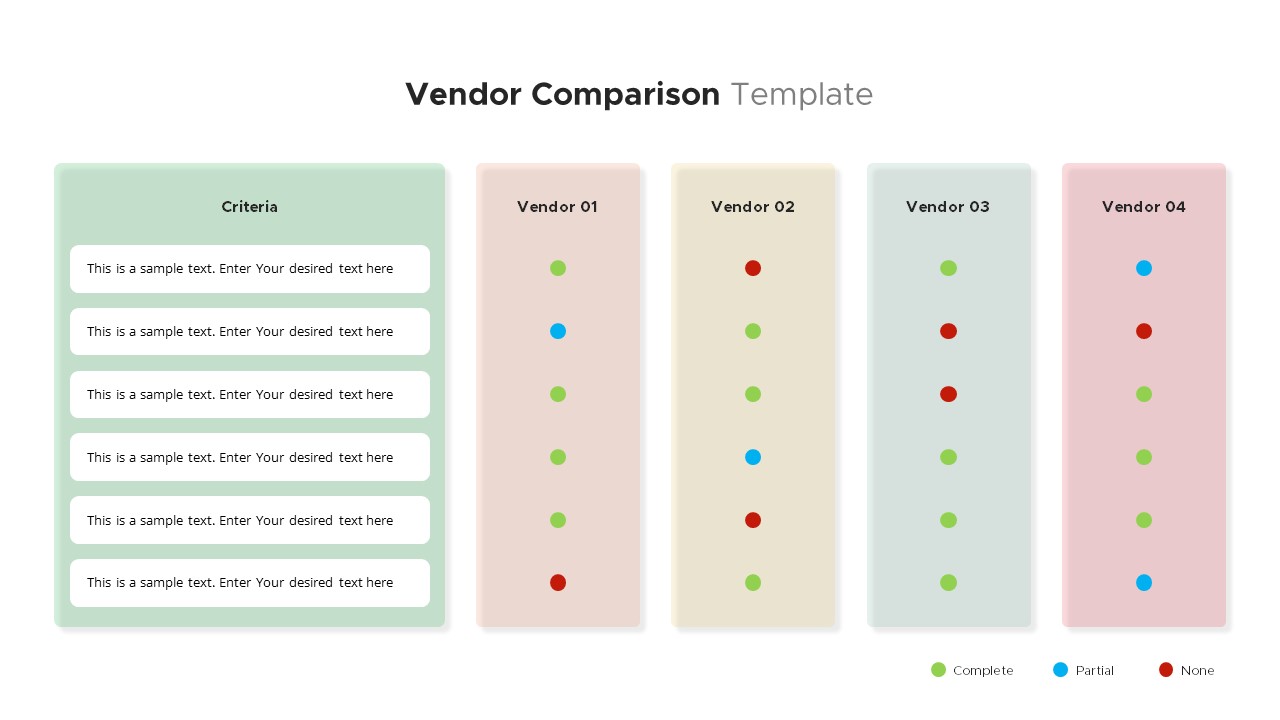
Vendor Comparison Slide for PowerPoint & Google Slides
Comparison
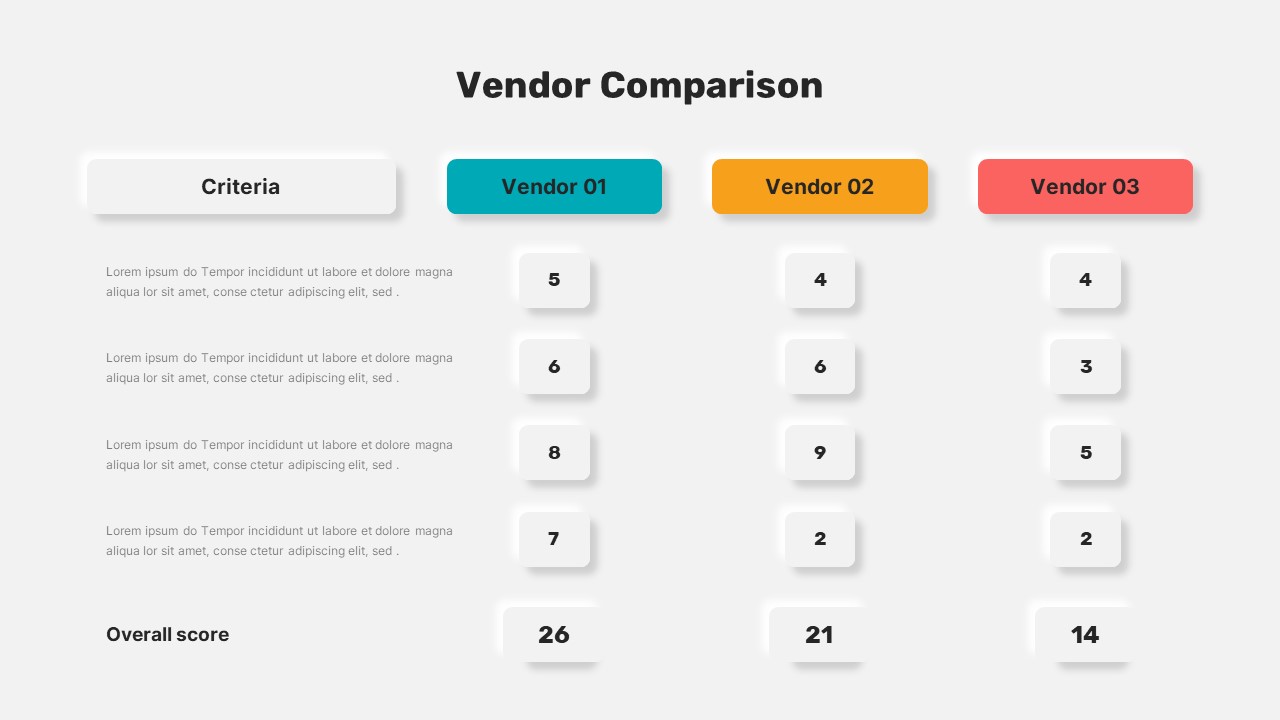
Vendor Comparison Slide for PowerPoint & Google Slides
Business Proposal
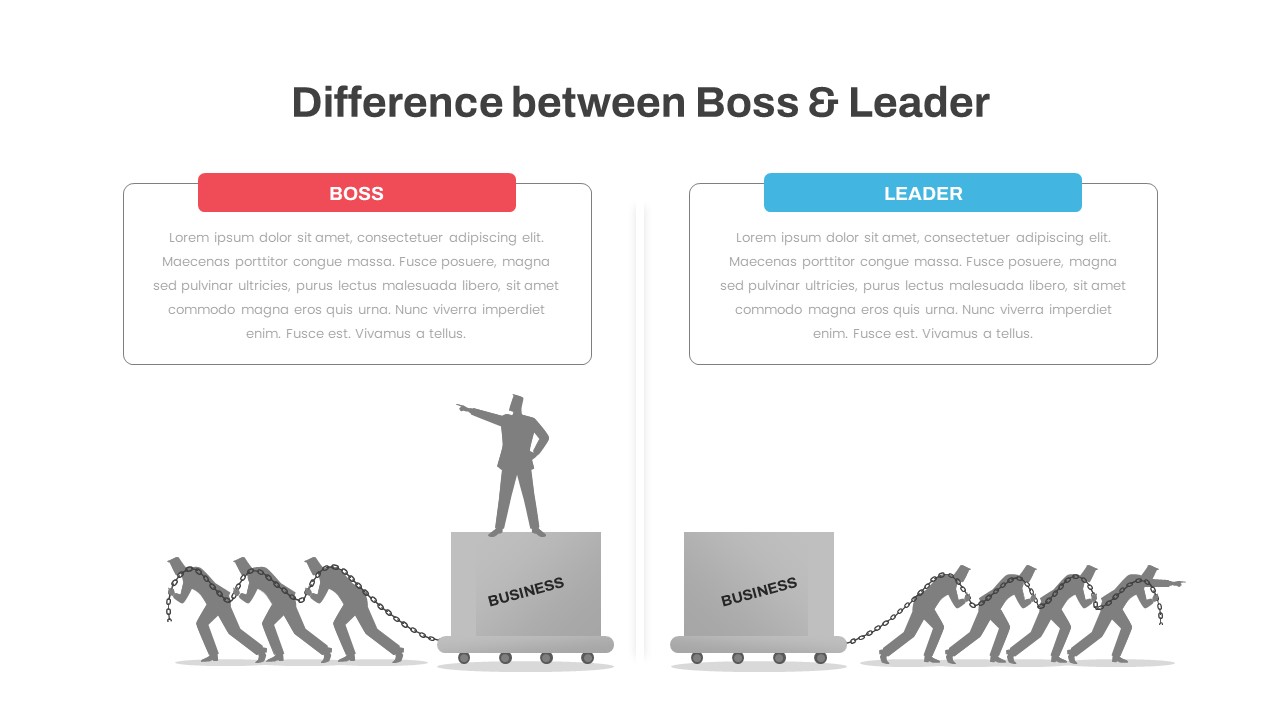
Boss vs Leader Comparison Slide for PowerPoint & Google Slides
Leadership
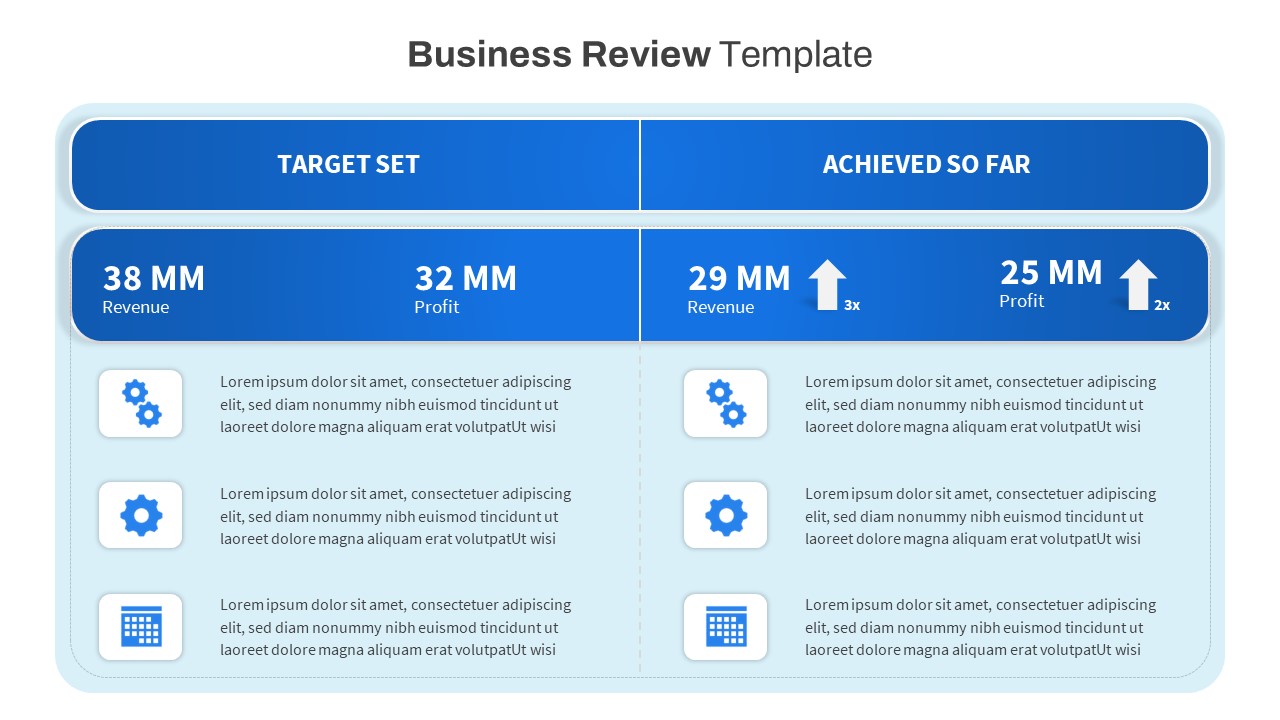
Free Business Review Comparison Slide for PowerPoint & Google Slides
Business Report
Free
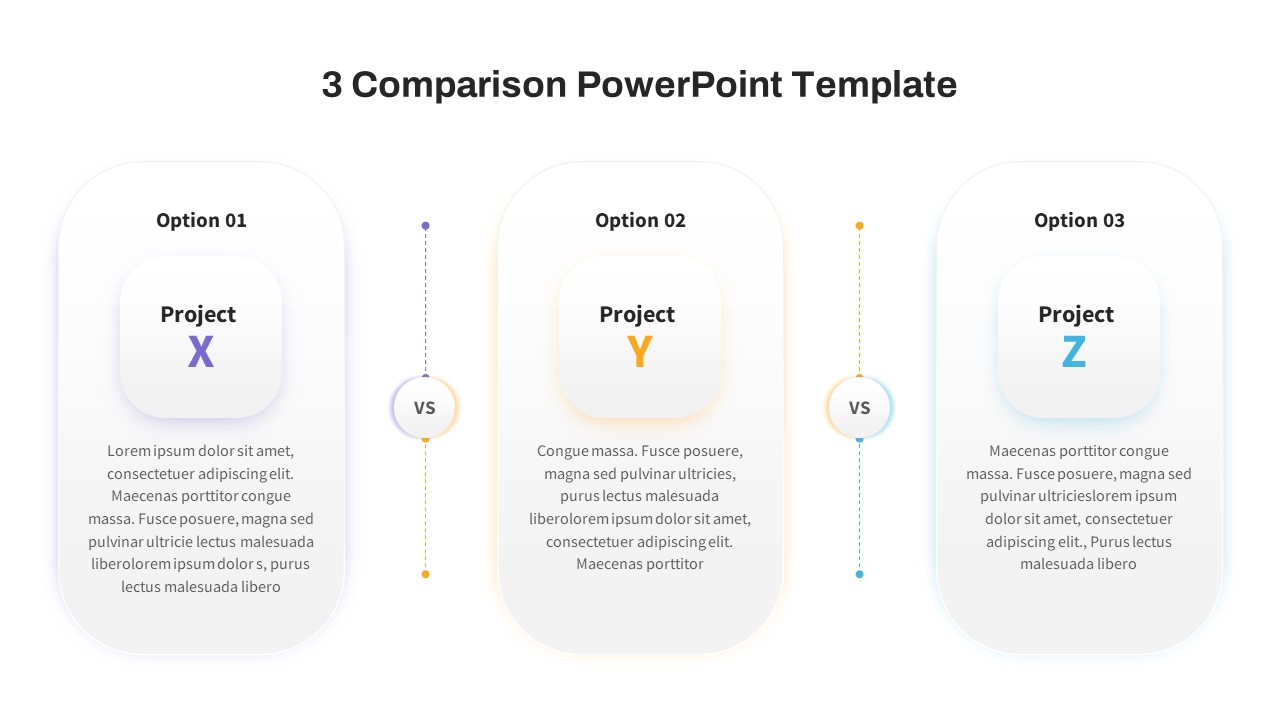
Free Three-Option Comparison Slide for PowerPoint & Google Slides
Comparison
Free
Service Zoom Feature Slides Comparison template for PowerPoint & Google Slides
Process
Simple Comparison Table Template for PowerPoint & Google Slides
Comparison
Speedometer Infographic Gauge Comparison Template for PowerPoint & Google Slides
Comparison
Four Section Comparison Chart Diagram Template for PowerPoint & Google Slides
Infographics

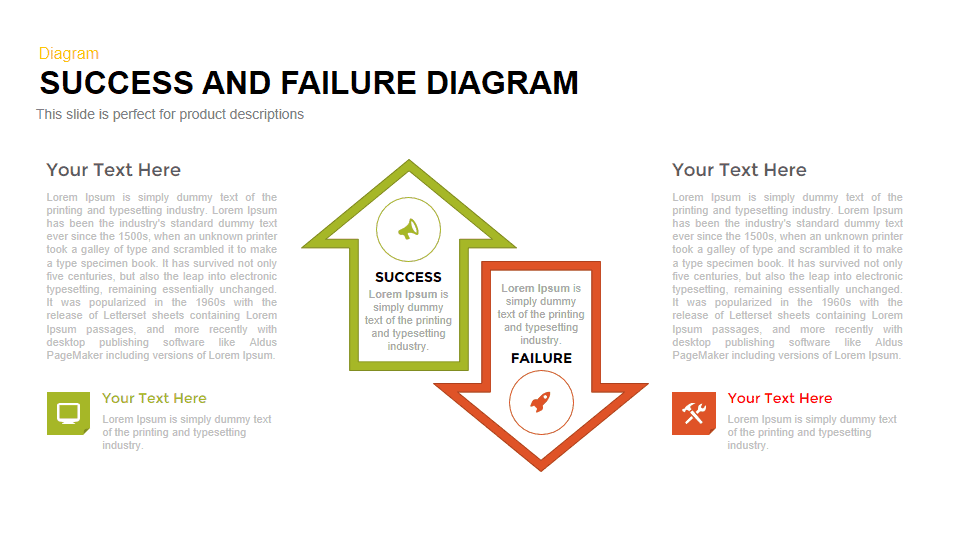
Success vs Failure Comparison Diagram Template for PowerPoint & Google Slides
Comparison
Scale Metaphor Metrics Comparison Template for PowerPoint & Google Slides
Charts
Dual Percentage Comparison Metaphor Template for PowerPoint & Google Slides
Comparison
Dynamic Multicolor Comparison Table Template for PowerPoint & Google Slides
Comparison
Five-Option Text Boxes Table Comparison Template for PowerPoint & Google Slides
Business Report
Radar Chart Product Comparison Template for PowerPoint & Google Slides
Comparison Chart
Seller Portals Comparison Infographic Template for PowerPoint & Google Slides
Process
Four Business Structure Types Comparison Diagram Template for PowerPoint & Google Slides
Business Strategy
Generations Comparison Infographic Template for PowerPoint & Google Slides
Timeline
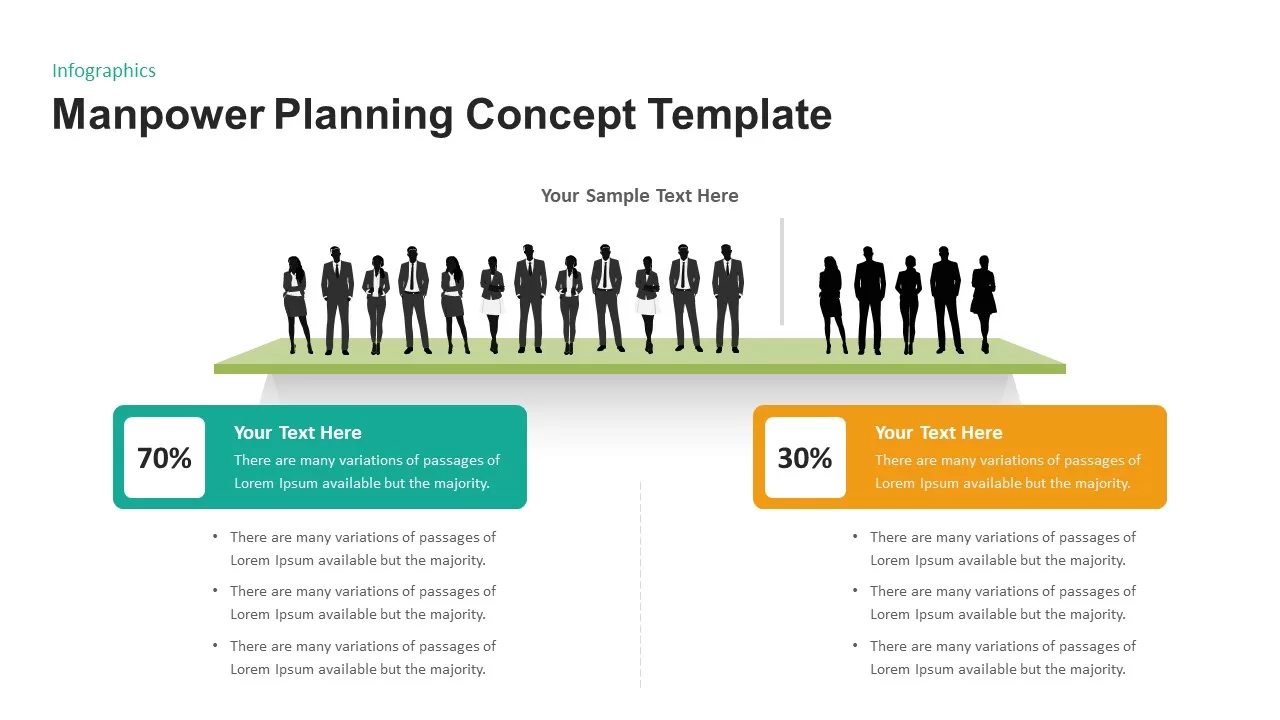
Manpower Planning Concept Comparison Template for PowerPoint & Google Slides
Comparison Chart
RAG Status Infographic Comparison Template for PowerPoint & Google Slides
Project
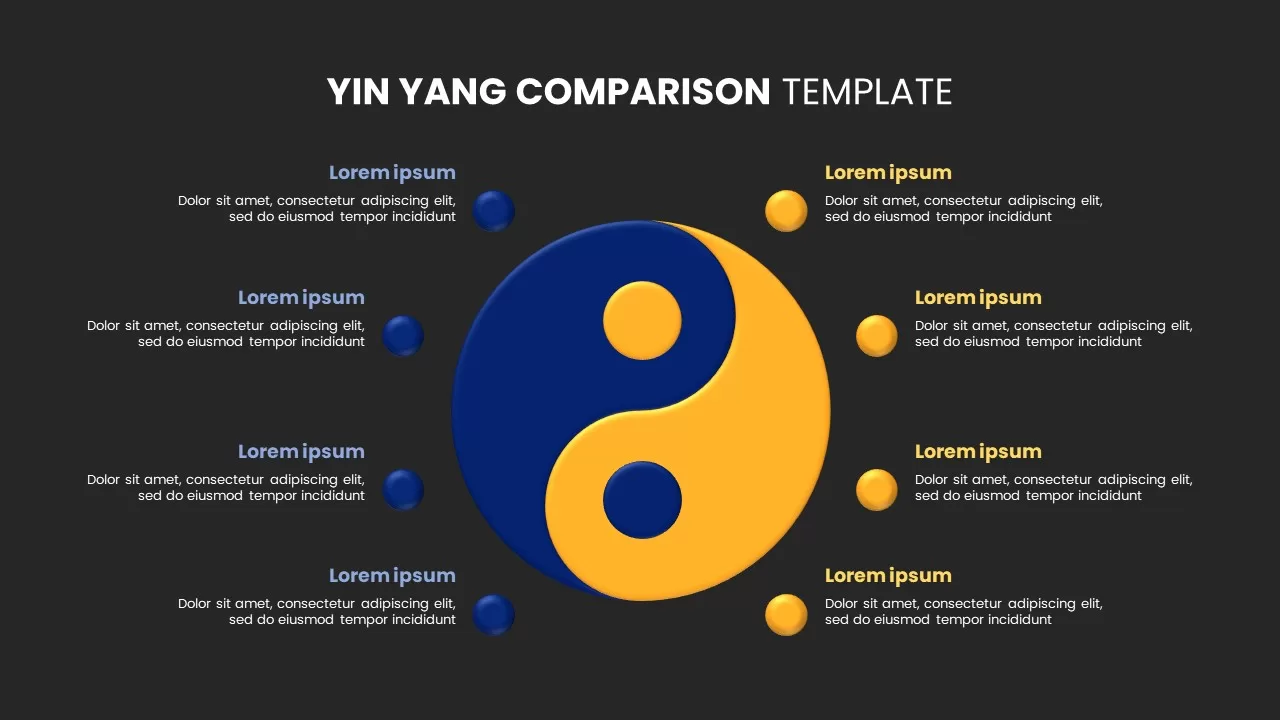
Yin Yang Comparison template for PowerPoint & Google Slides
Business
Comparison Infographic Overview template for PowerPoint & Google Slides
Business
Pugh Matrix Decision Comparison Chart Template for PowerPoint & Google Slides
Comparison Chart
Challenges & Opportunities Comparison Template for PowerPoint & Google Slides
Opportunities Challenges
Opportunities Hub-and-Spoke Comparison Diagram Template for PowerPoint & Google Slides
Opportunities Challenges
Modern Before and After Comparison Template for PowerPoint & Google Slides
Infographics
Challenges & Solutions Comparison Template for PowerPoint & Google Slides
Opportunities Challenges
Adam’s Equity Theory Scale Comparison Template for PowerPoint & Google Slides
Comparison
Vendor Comparison Matrix with High-Level Requirements template for PowerPoint & Google Slides
Comparison Chart
Popular Social Media Comparison Grid Template for PowerPoint & Google Slides
Digital Marketing
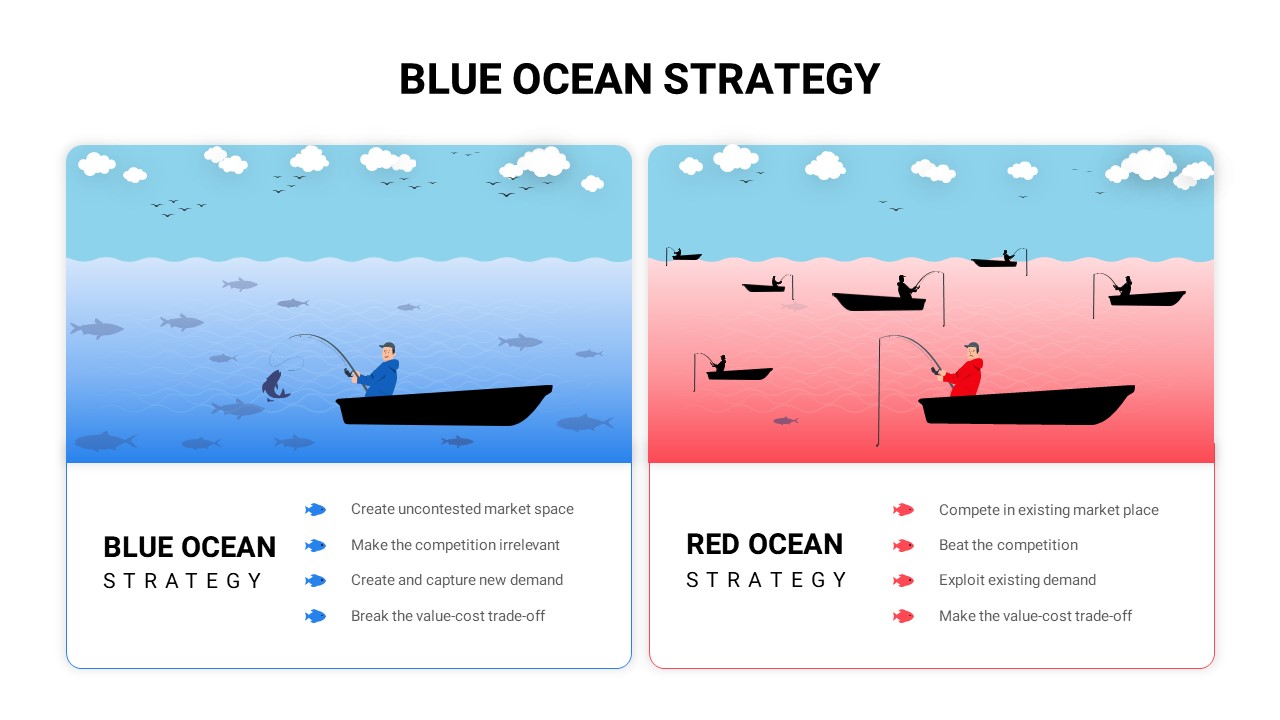
Blue vs Red Ocean Strategy Comparison Template for PowerPoint & Google Slides
Business Strategy
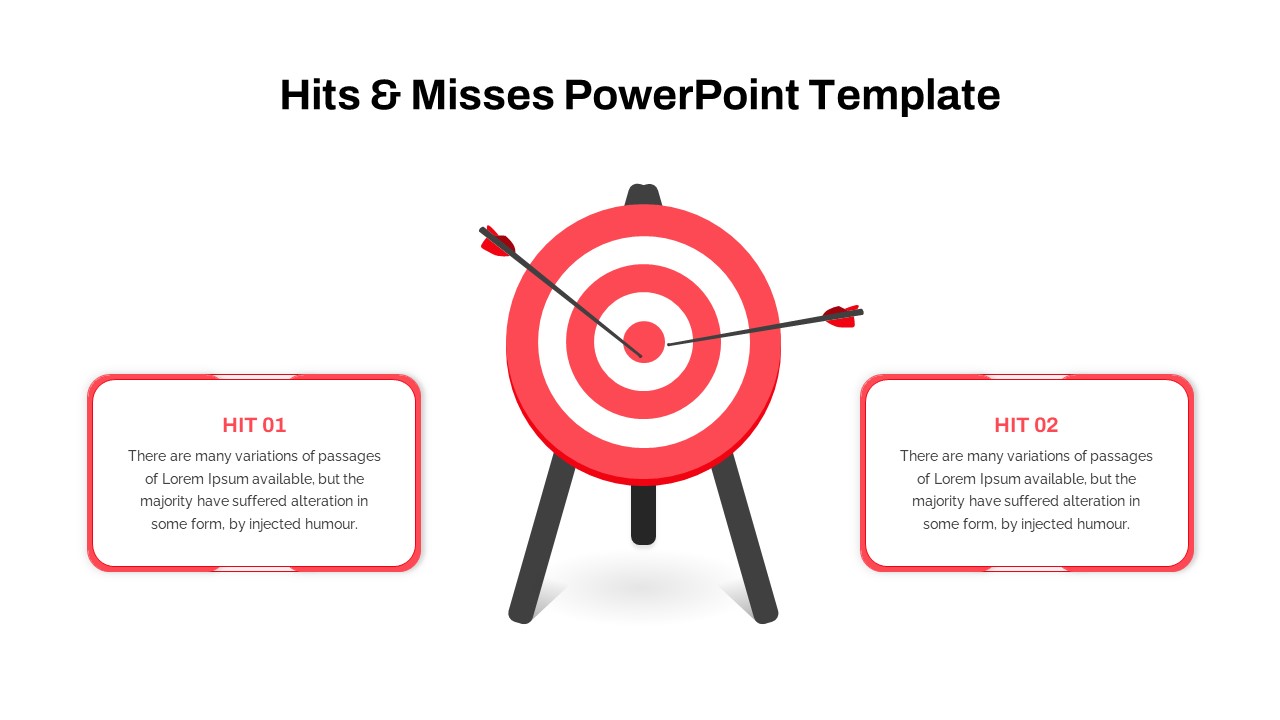
Hits and Misses Performance Comparison Template for PowerPoint & Google Slides
Comparison
People Demographic Comparison Chart Template for PowerPoint & Google Slides
Comparison
Surgery Infographics Comparison Template for PowerPoint & Google Slides
Health
Grouped Column Chart Comparison Template for PowerPoint & Google Slides
Bar/Column
Mirror Bar Chart Comparison Template for PowerPoint & Google Slides
Bar/Column
Free Pros and Cons Comparison Template for PowerPoint & Google Slides
Comparison
Free
Free Versatile Product Comparison Chart Template for PowerPoint & Google Slides
Charts
Free
AI vs. Human Intelligence Comparison Template for PowerPoint & Google Slides
Comparison
Economies of Scale Cost Curve Comparison Template for PowerPoint & Google Slides
Comparison Chart
Quarterly Revenue Comparison Bar Chart Template for PowerPoint & Google Slides
Bar/Column
Hits & Misses Comparison Infographic Template for PowerPoint & Google Slides
Pitch Deck
Risk Level Gauge Comparison Dashboard Template for PowerPoint & Google Slides
Comparison
Competitor Comparison Chart Design Template for PowerPoint & Google Slides
Comparison
Two-Option Bar Chart Comparison Table Template for PowerPoint & Google Slides
Comparison
Cross Sell & Up Sell Strategy Comparison template for PowerPoint & Google Slides
Comparison
Product Feature Comparison Table Template for PowerPoint & Google Slides
Comparison Chart
Two-Sided Coin Comparison Diagram Template for PowerPoint & Google Slides
Comparison
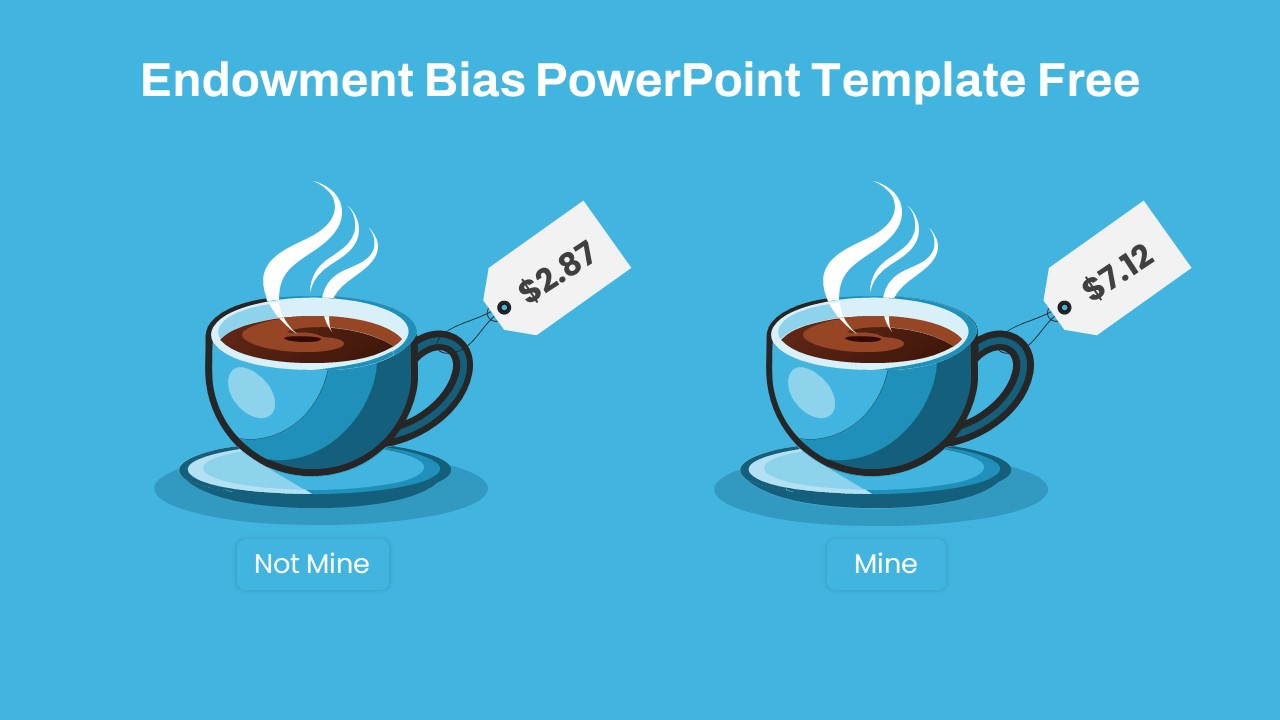
Endowment Bias Coffee Price Comparison Template for PowerPoint & Google Slides
Comparison
Free
Two-Box Analysis & Target Comparison Template for PowerPoint & Google Slides
Comparison
Two Section Comparison template for PowerPoint & Google Slides
Business Proposal
VUCA vs BANI Comparison Infographic Template for PowerPoint & Google Slides
Comparison
Category Analysis Comparison Infographic Template for PowerPoint & Google Slides
Comparison
Funnel and Flywheel Thinking Comparison template for PowerPoint & Google Slides
Infographics
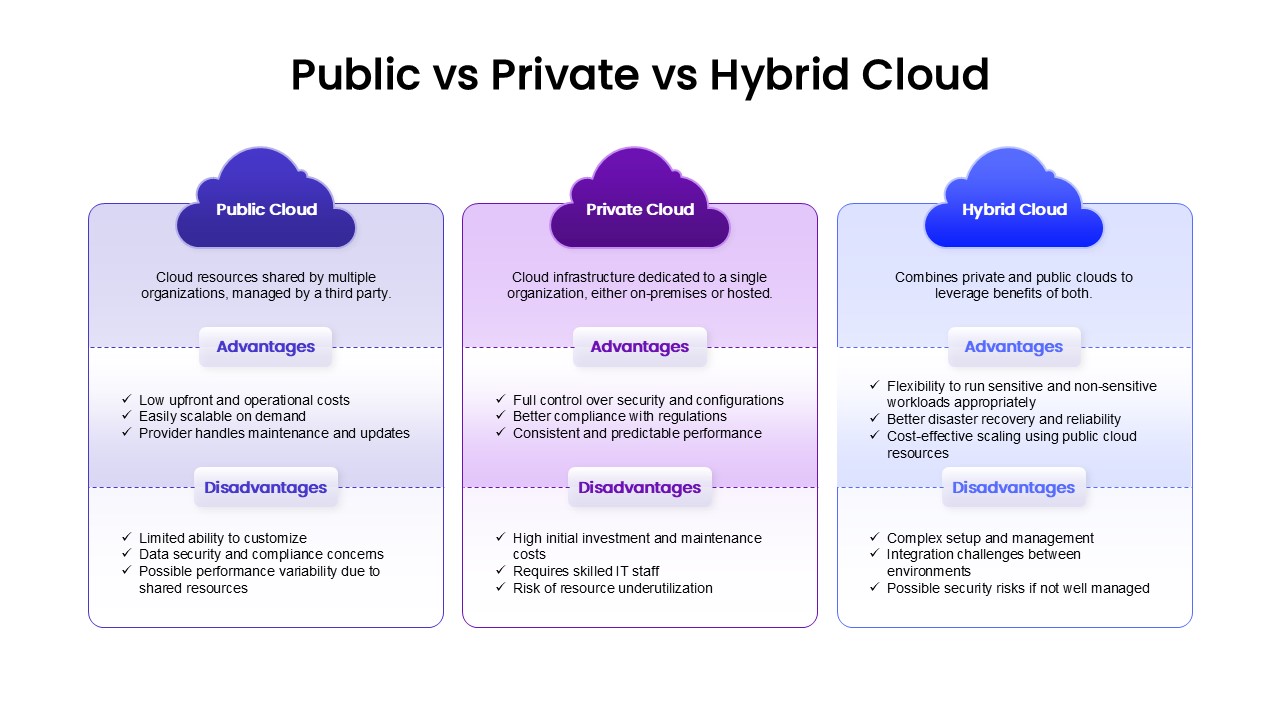
Public, Private & Hybrid Cloud Comparison Template for PowerPoint & Google Slides
Cloud Computing
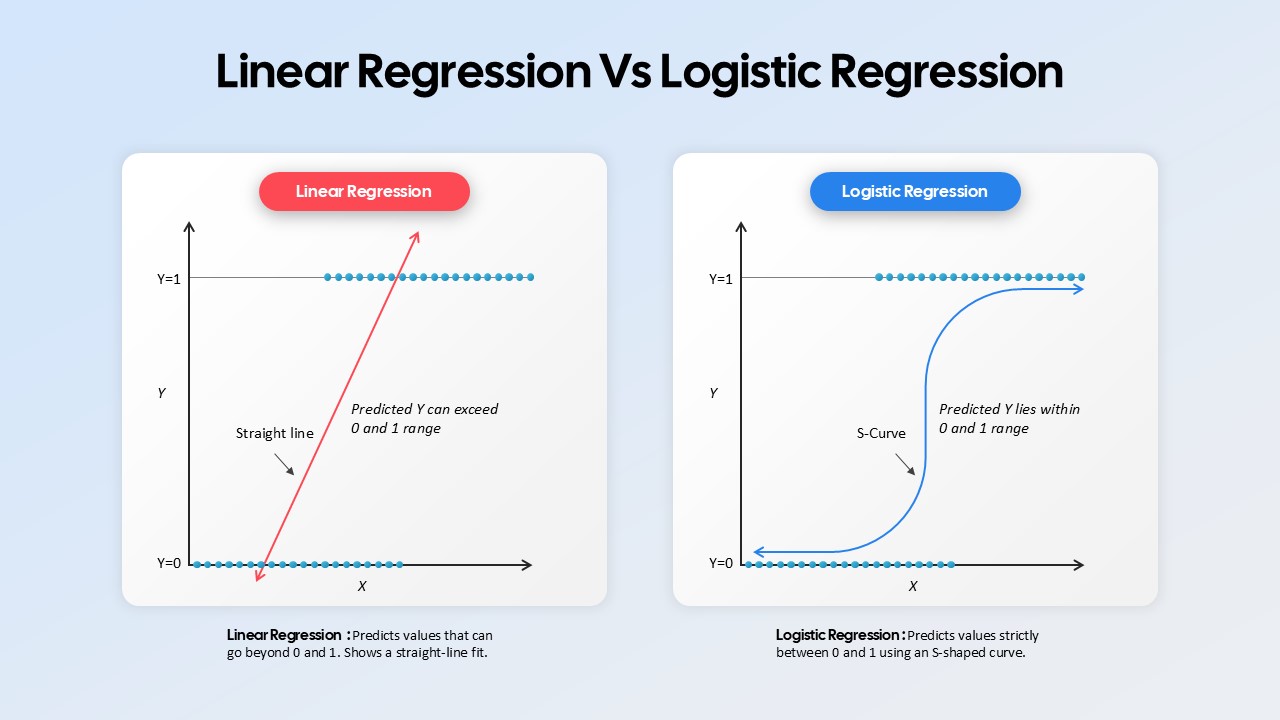
Linear Regression vs Logistic Regression Comparison template for PowerPoint & Google Slides
Comparison
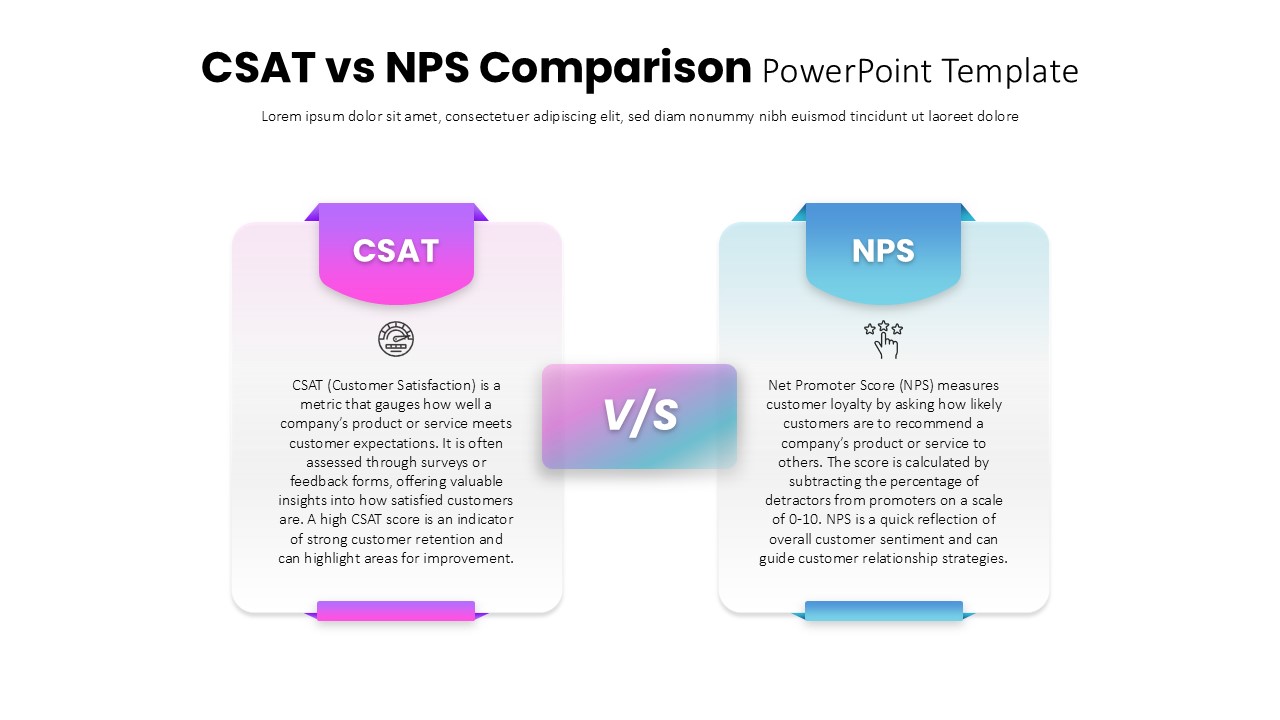
CSAT vs NPS Comparison template for PowerPoint & Google Slides
Business Strategy
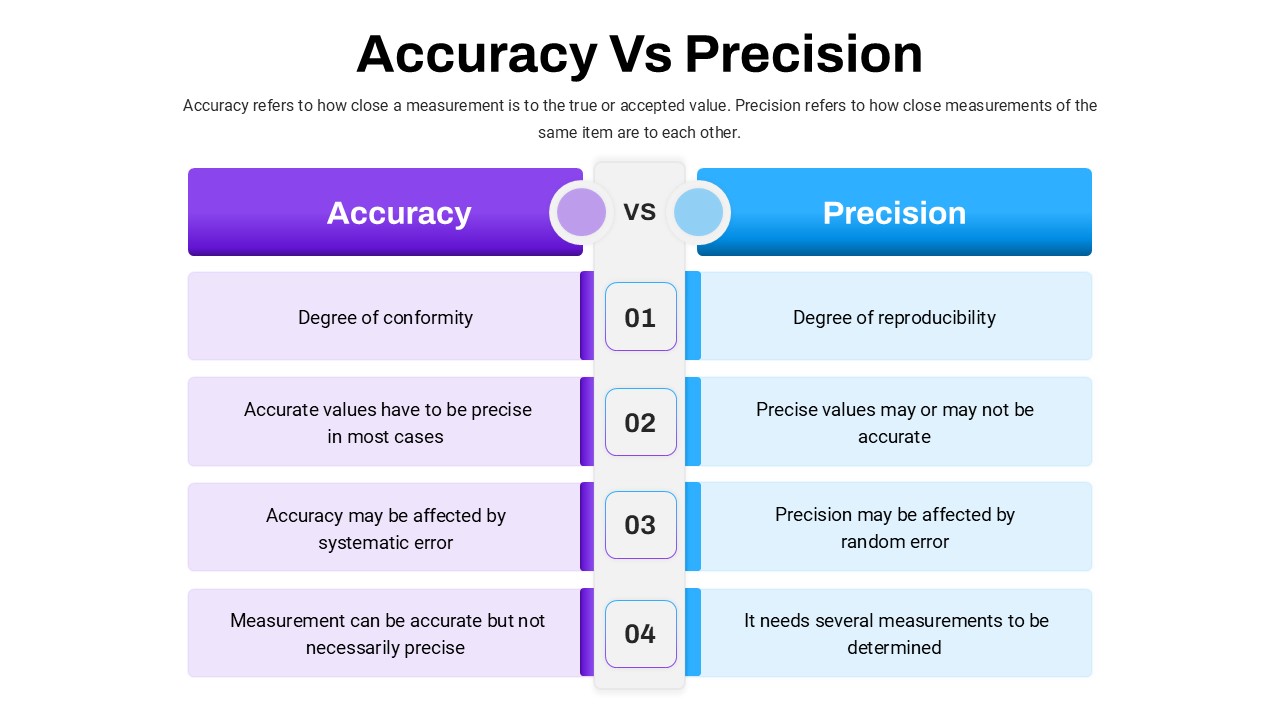
Accuracy Vs Precision Comparison Template for PowerPoint & Google Slides
Comparison Chart
Risk vs Reward Comparison Template for PowerPoint & Google Slides
Opportunities Challenges
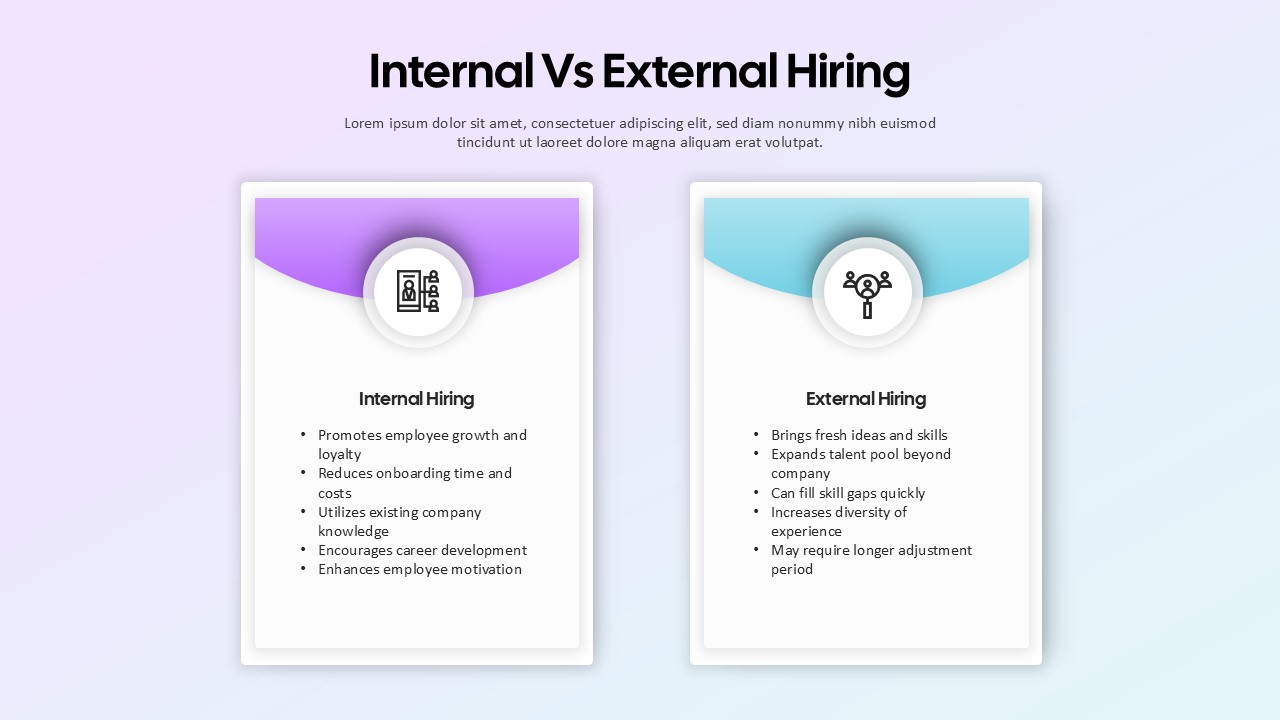
Internal vs External Hiring Comparison Template for PowerPoint & Google Slides
Comparison
Comparison Table Presentation Template for PowerPoint & Google Slides
Table
Colorful Comparison Table Presentation Template for PowerPoint & Google Slides
Table
Five Column Comparison Table Layout Template for PowerPoint & Google Slides
Comparison
Quarterly Comparison Pie Chart Template for PowerPoint & Google Slides
Pie/Donut
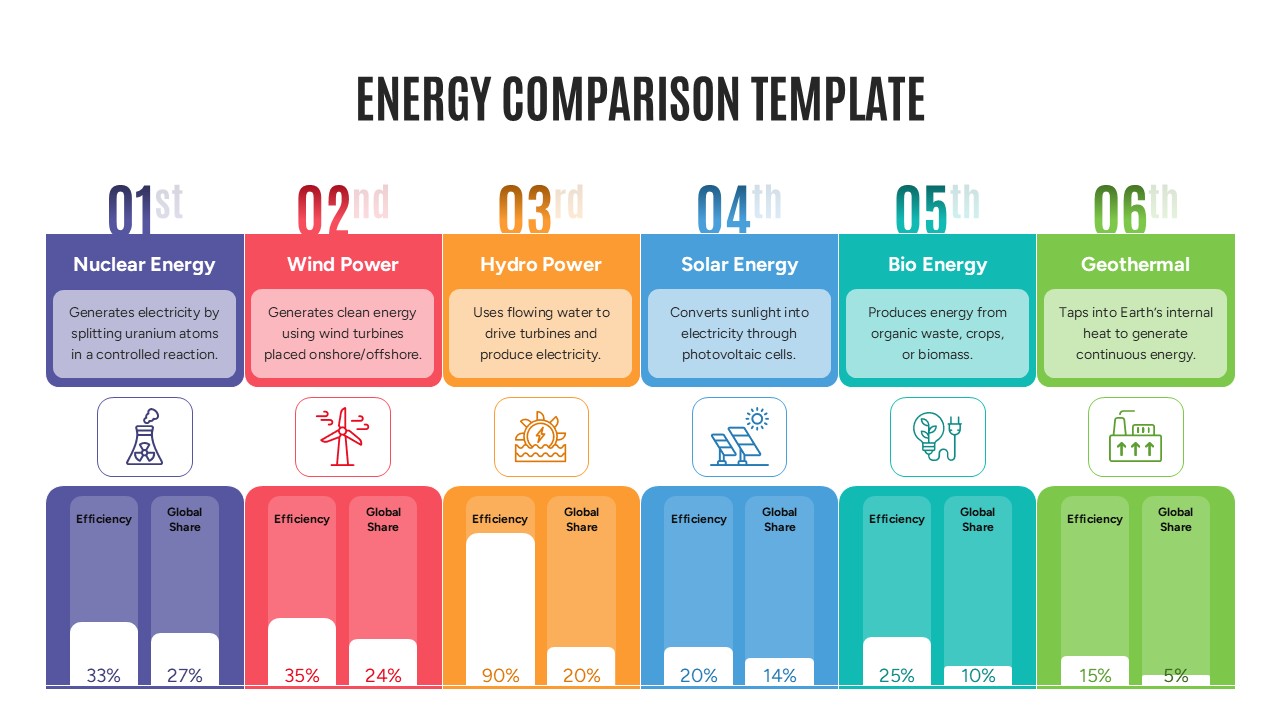
Energy Comparison Template for PowerPoint & Google Slides
Comparison
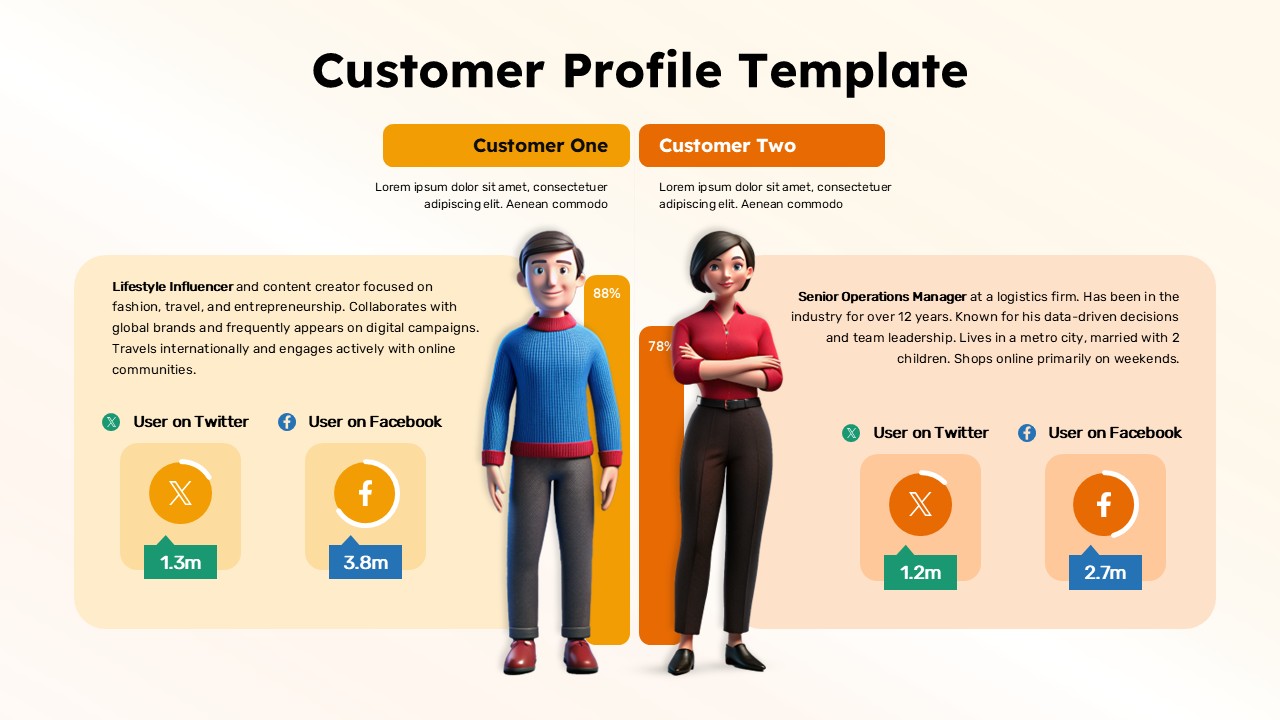
Customer Persona Comparison Profile Template for PowerPoint & Google Slides
Business
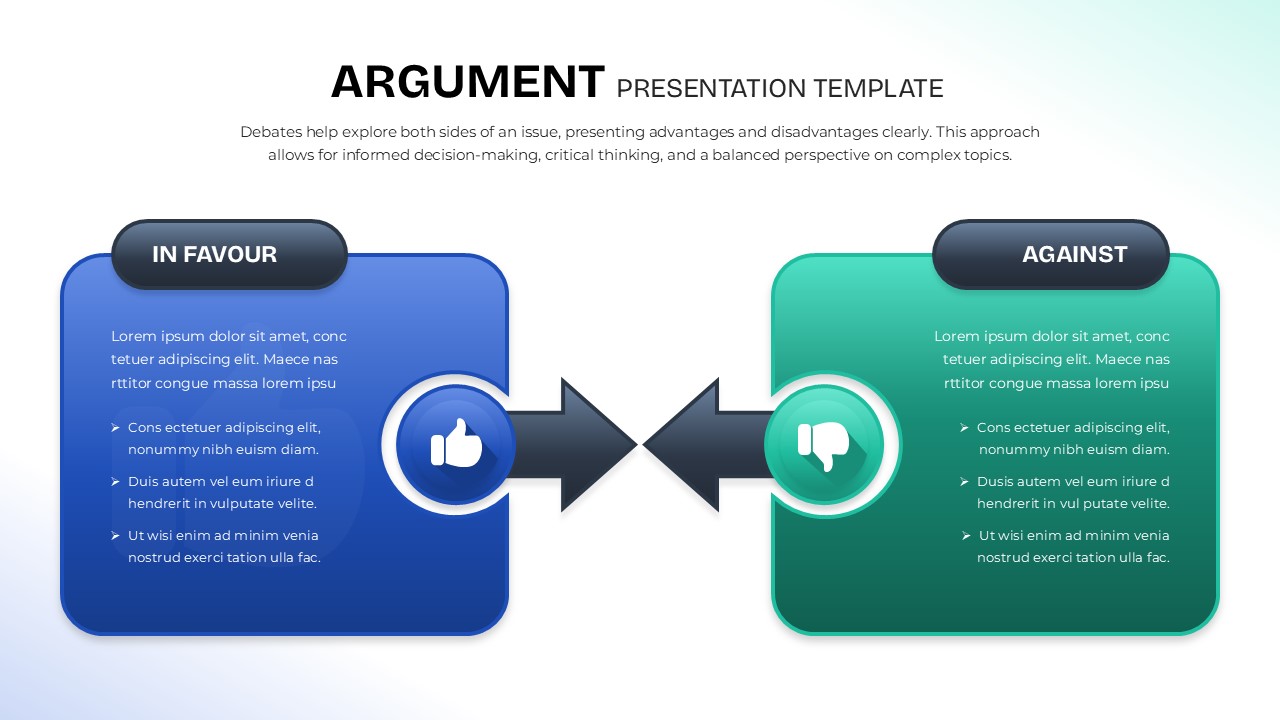
Argument Comparison Template for PowerPoint & Google Slides
Comparison
Operating Channels Comparison Diagram Template for PowerPoint & Google Slides
Business Models