Current vs Future State Analysis template for PowerPoint & Google Slides
Current vs Future State Analysis Template for PowerPoint & Google Slides
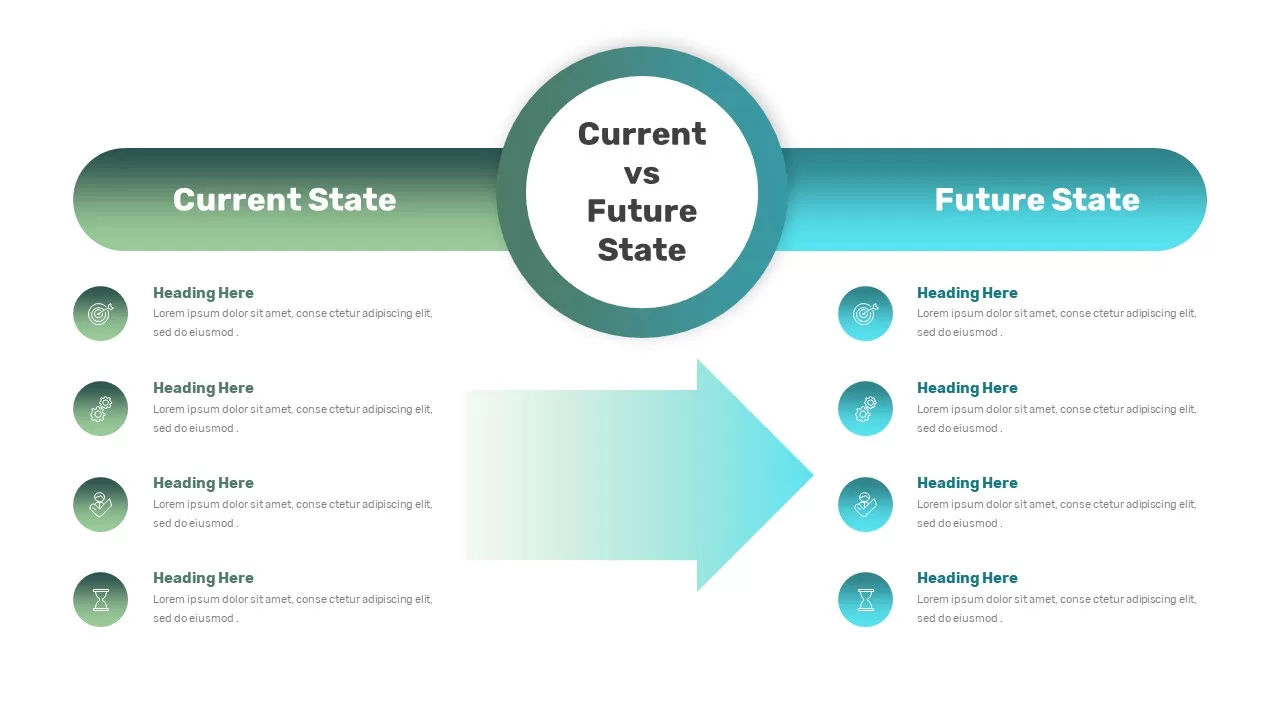
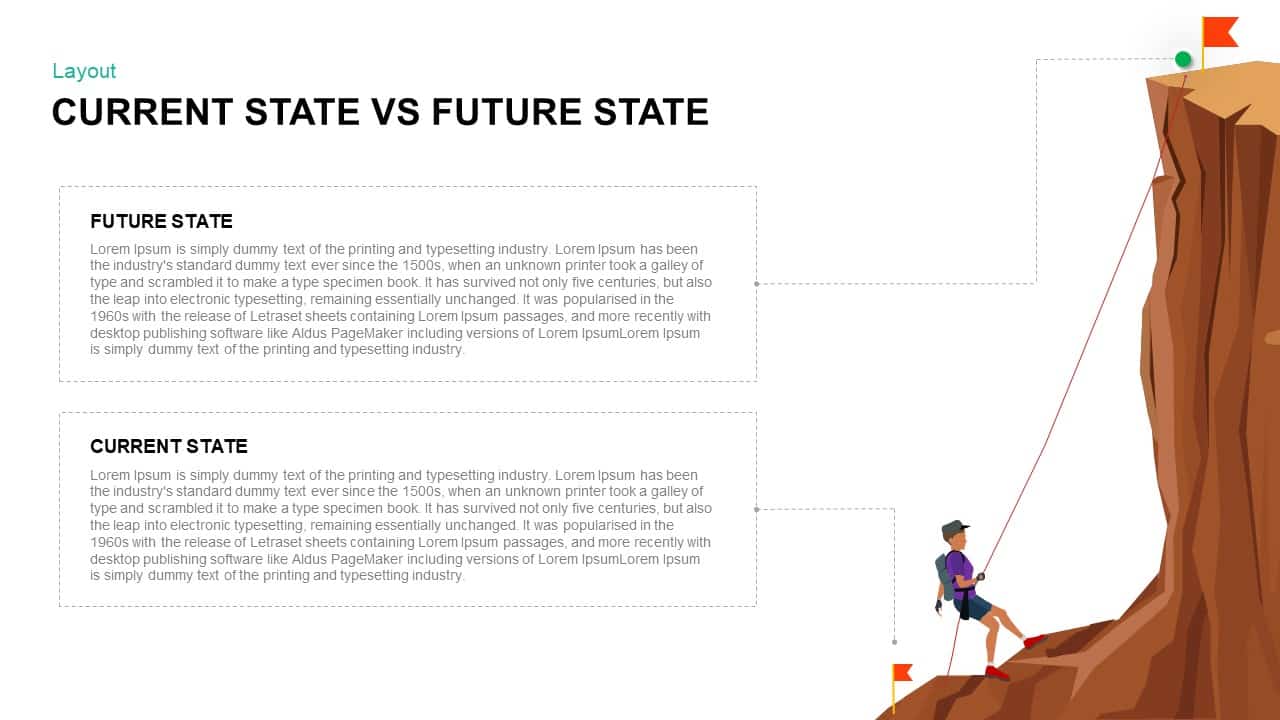
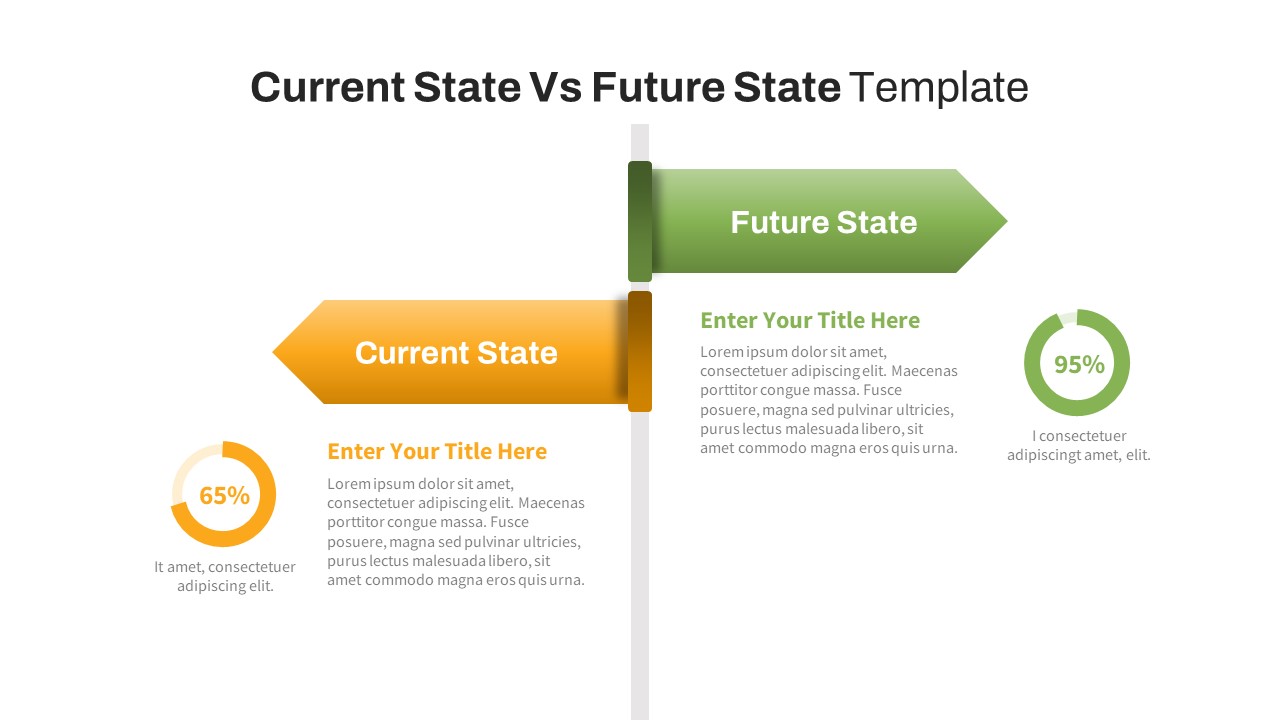
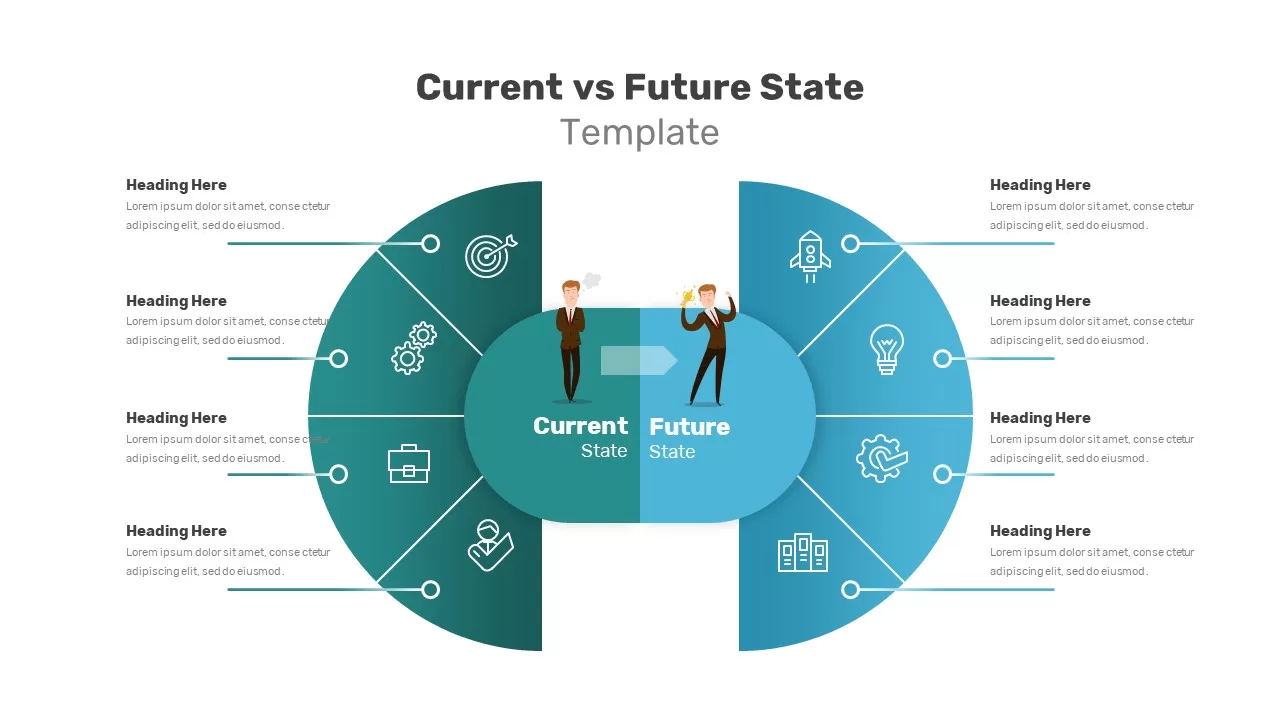
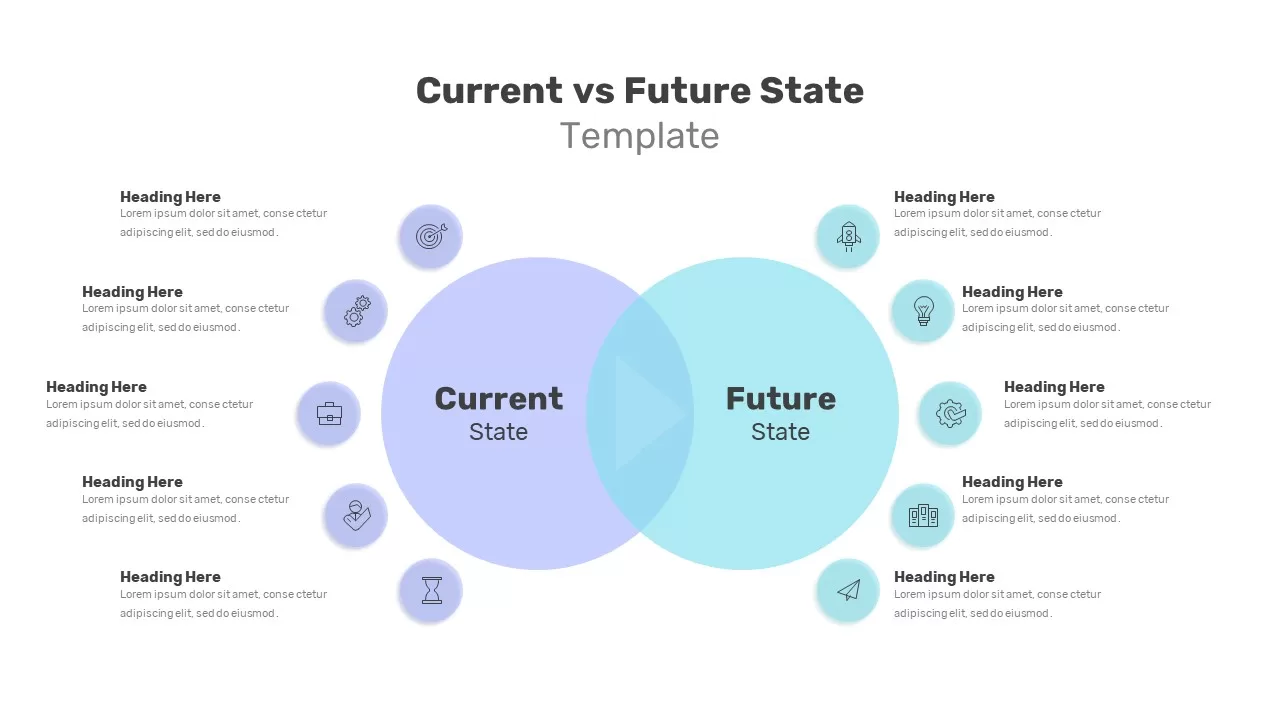
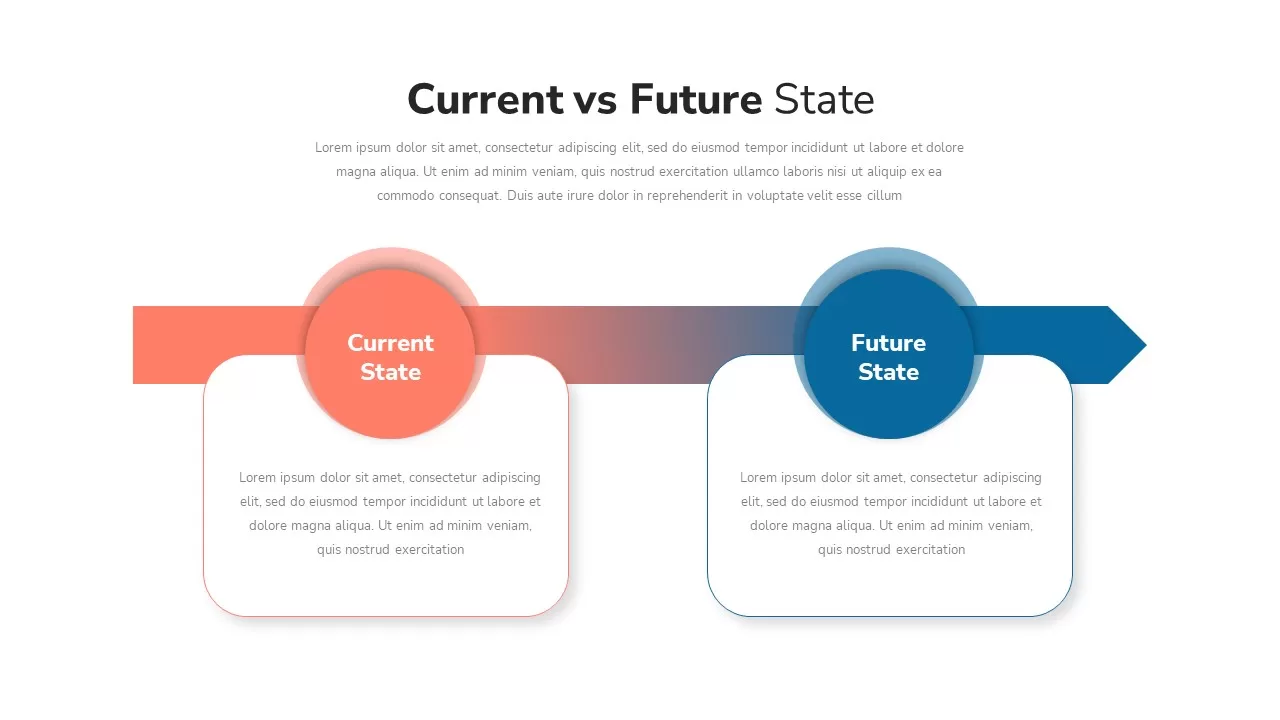
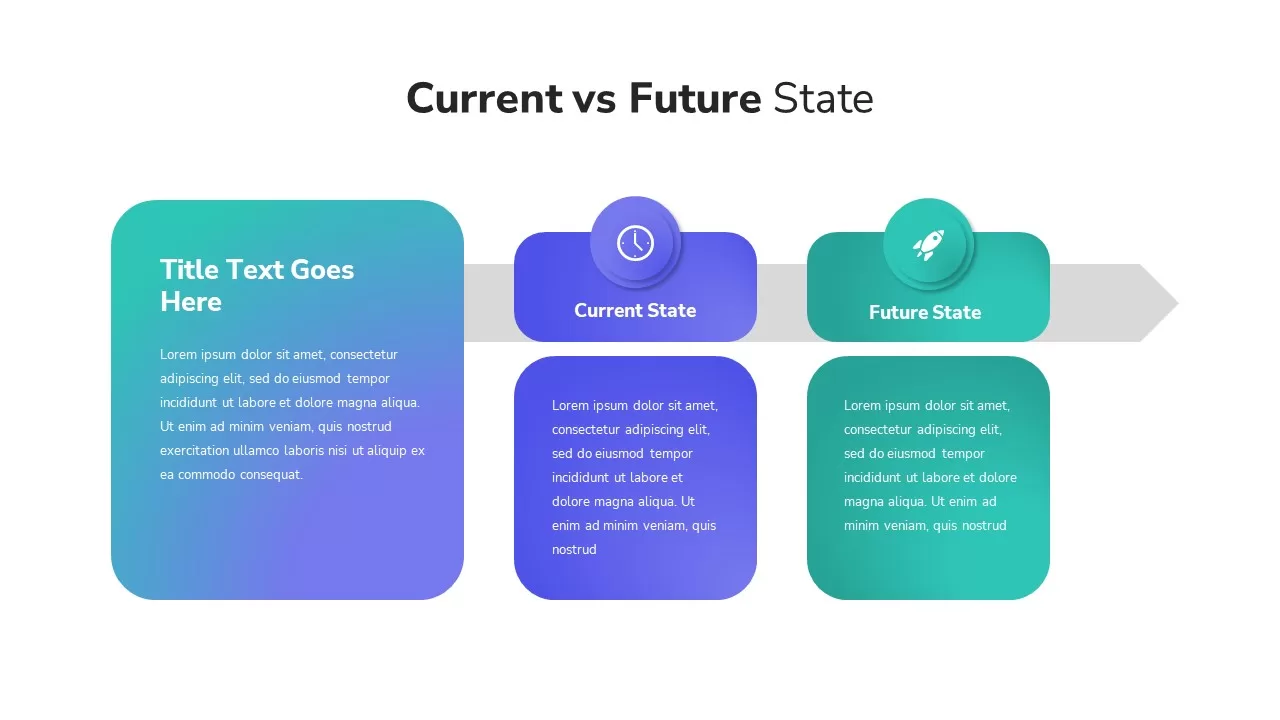
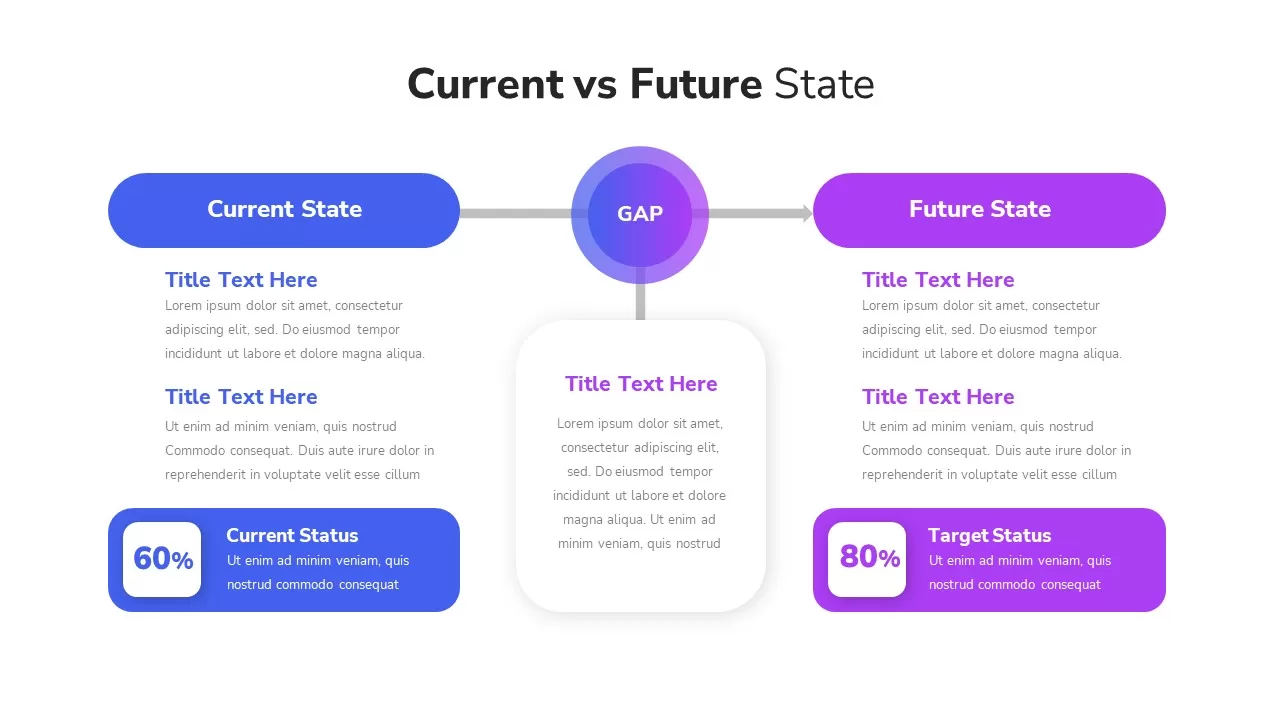
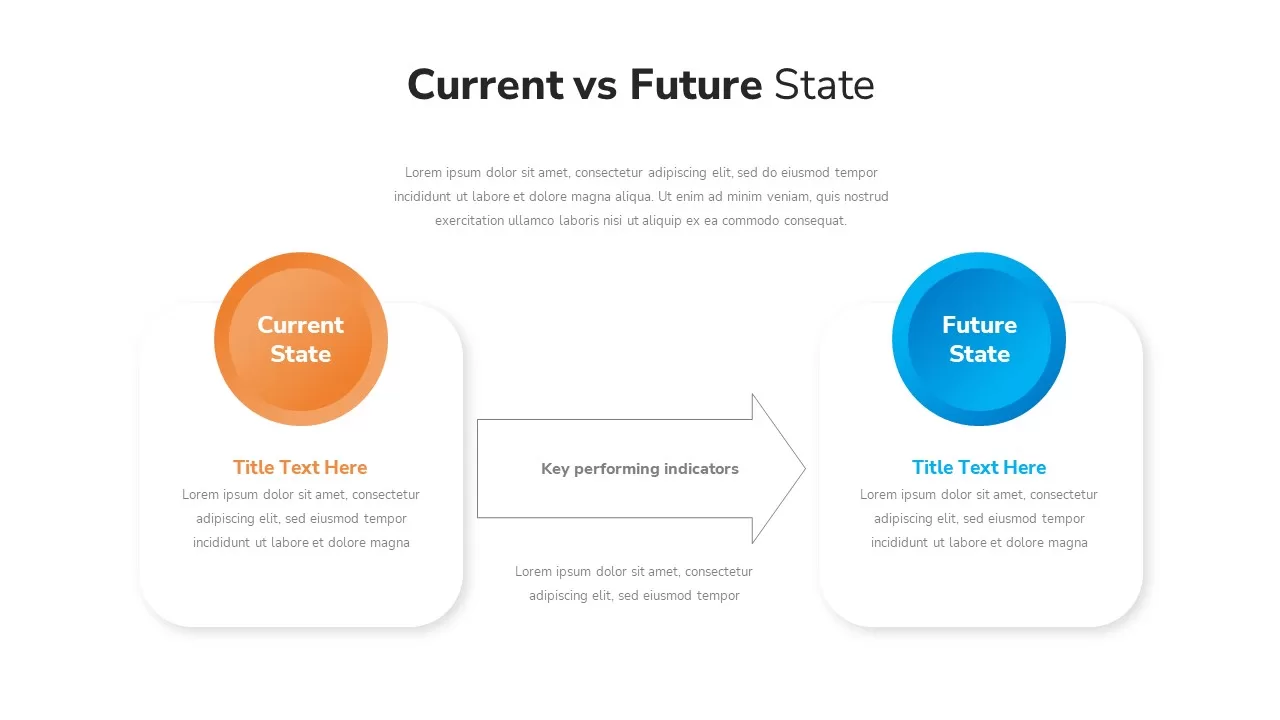
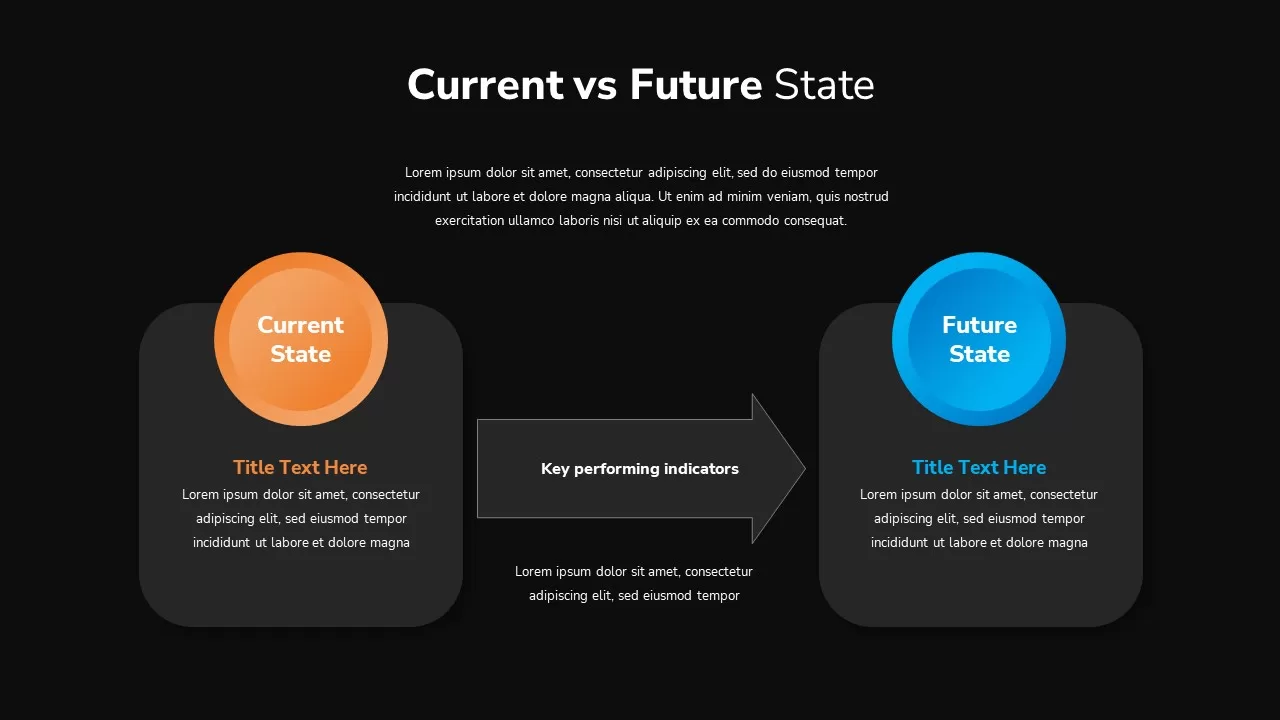
Navigating organizational change, technology upgrades, or operational restructuring requires a visual layout that clearly contrasts existing challenges with proposed target outcomes. When presenting gap analysis, process optimization, or digital transformation roadmaps, presenting unstructured data across separate slides makes it difficult for stakeholders to evaluate the intended return on investment. Utilizing a Current vs Future State Analysis template for PowerPoint & Google Slides delivers a balanced side-by-side comparison framework that isolates operational pain points, highlights strategic interventions, and illustrates target performance benchmarks on a single view.
Clarify Operational Gaps and Transformation Strategies
Driving organizational alignment starts with establishing a shared understanding of where your operations currently stand and where they need to go. A dedicated gap analysis presentation graphic creates an explicit visual bridge between existing inefficiencies and target capabilities. By organizing current bottlenecks, transition requirements, and future state metrics into color-coded side-by-side columns or split-screen containers, you eliminate confusion and help executive leadership evaluate proposed strategic shifts. Whether you are illustrating software migration plans, customer experience enhancements, or corporate governance updates, this structured visual layout ensures your recommendations remain clear and grounded in data.
Built for Change Leads, Consultants, and Strategy Officers
Designed for complete cross-platform versatility, this gap analysis slide asset functions seamlessly across both PowerPoint and Google Slides. Every vector shape, comparison column, process icon, and text box is fully customizable, giving you complete freedom to adapt color themes, section dividers, and typography to your firm’s brand identity. Whether you are leading a digital transformation workshop, pitching a restructuring strategy to board members, or presenting operational audits to enterprise clients, adding this side-by-side comparison layout to your presentation library enables you to communicate operational growth strategies with complete executive polish.
Login to download this file

Item ID
SB02784


Related Templates

Current State vs Future State Template for PowerPoint & Google Slides
Comparison Chart
Current State Vs Future State Template for PowerPoint
Comparison
Free Current State vs Future State Template
Business Strategy
Free
Current vs Future State Comparison Slide Template for PowerPoint & Google Slides
Comparison Chart
Current vs Future State PowerPoint Template
Comparison
Current VS Future State PowerPoint Presentation Template
Comparison Chart
Current VS Future State Template
Comparison Chart
Current vs Future State Slide
Comparison
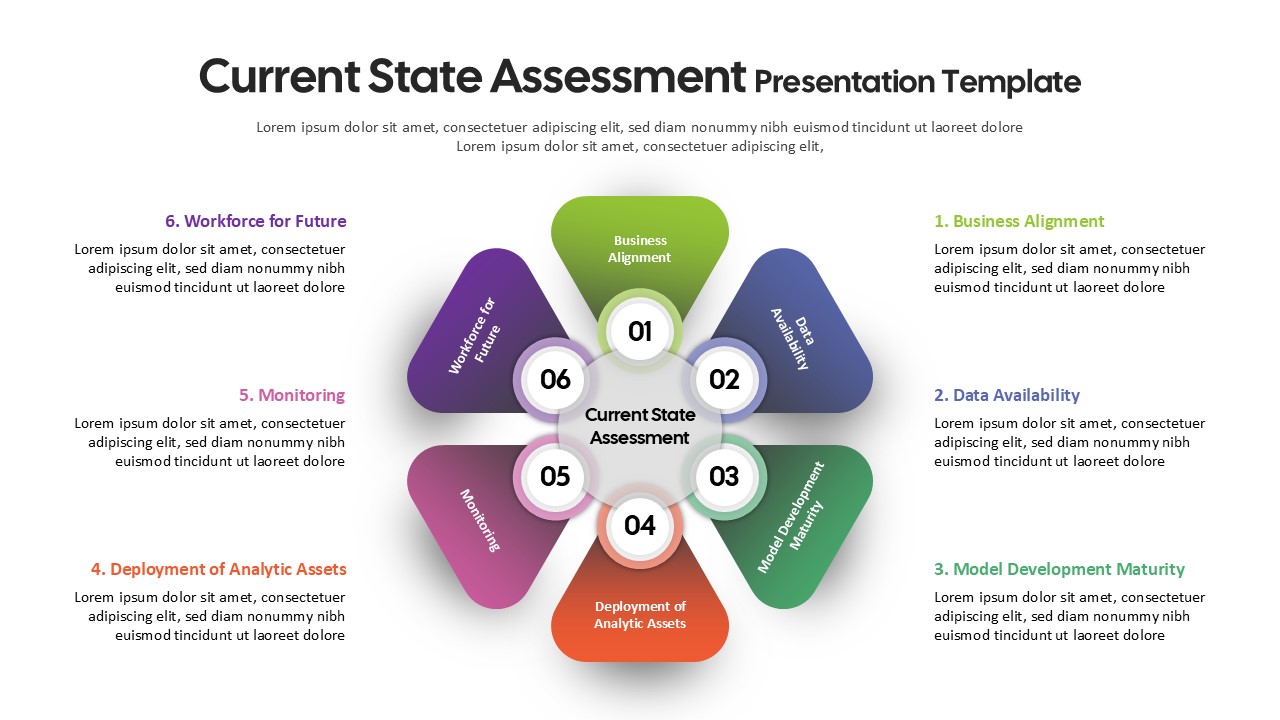
Current State Assessment Presentation Template
Gap
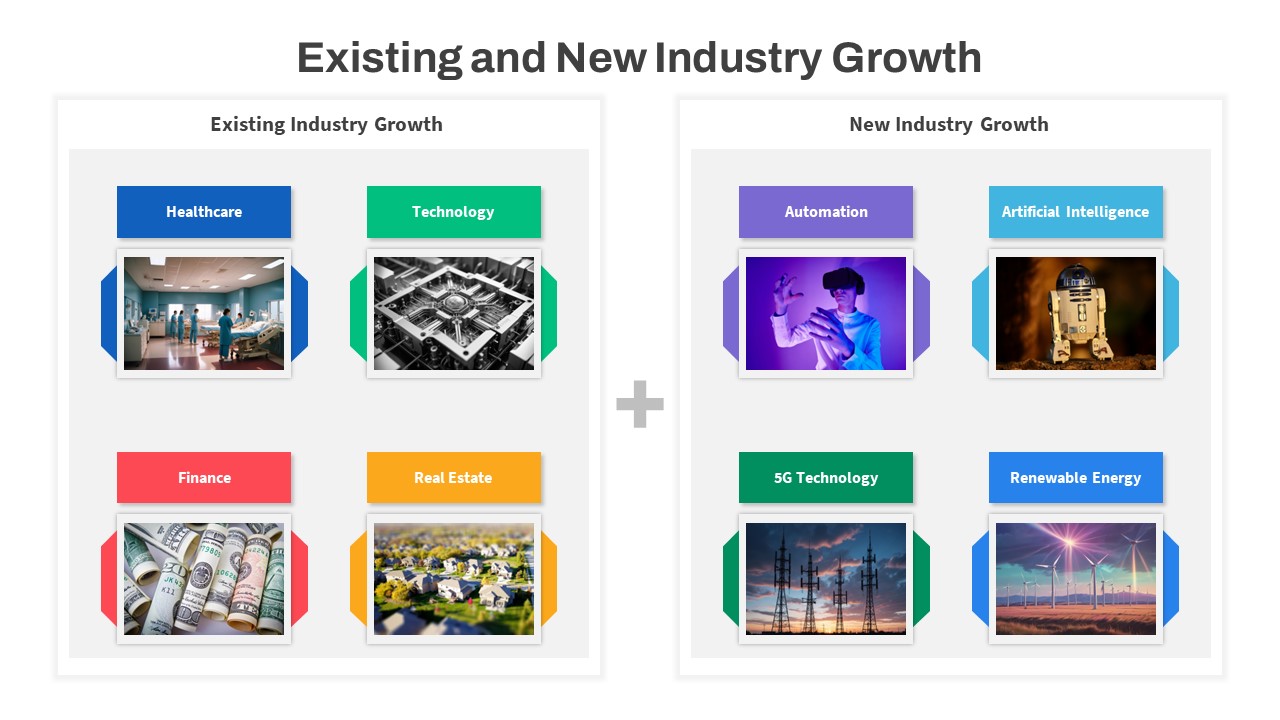
Current and Future Industry Innovations Template for PowerPoint & Google Slides
Comparison
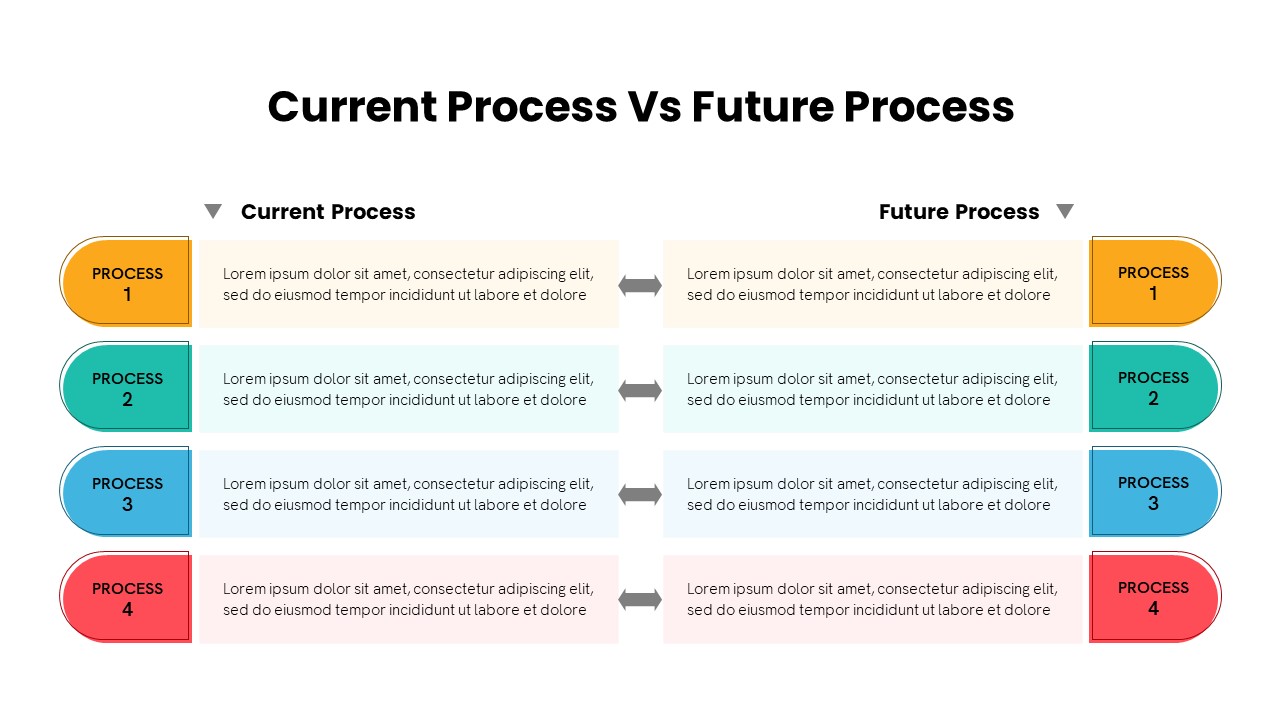
Current vs Future Process PowerPoint Template
Comparison
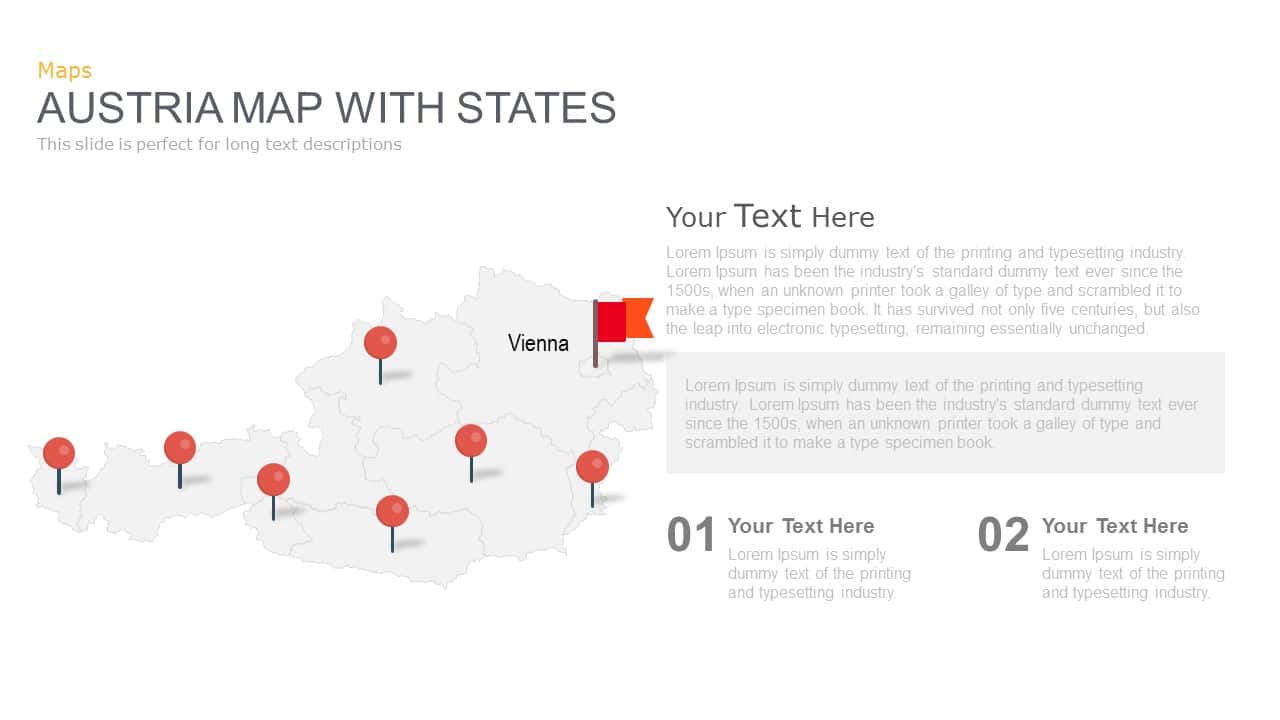
Austria Map With State Markers Template for PowerPoint & Google Slides
World Maps
Pennsylvania State Map Diagram Template for PowerPoint & Google Slides
World Maps
Business Sectors and Current Portfolio PowerPoint Template
Comparison
The Future of Work Venn Diagram Template
Circular
Future Technology Deck Template for PowerPoint and Google Slides
Decks
Past Present Future Project Management Template for PowerPoint
Comparison
AI Future Of Work PowerPoint Template
Graphics
Future Outlook PowerPoint Template
Infographics
Future Slide Template
Timeline