Current vs Future Process PowerPoint Template
Description
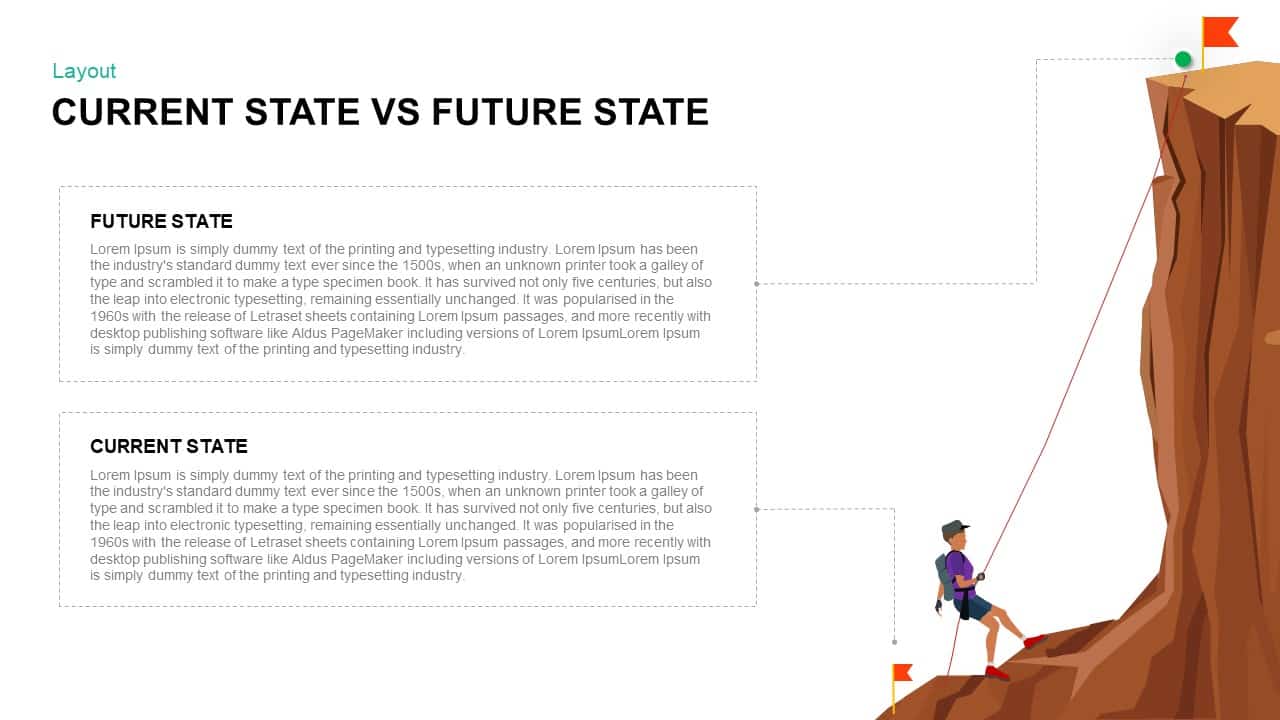
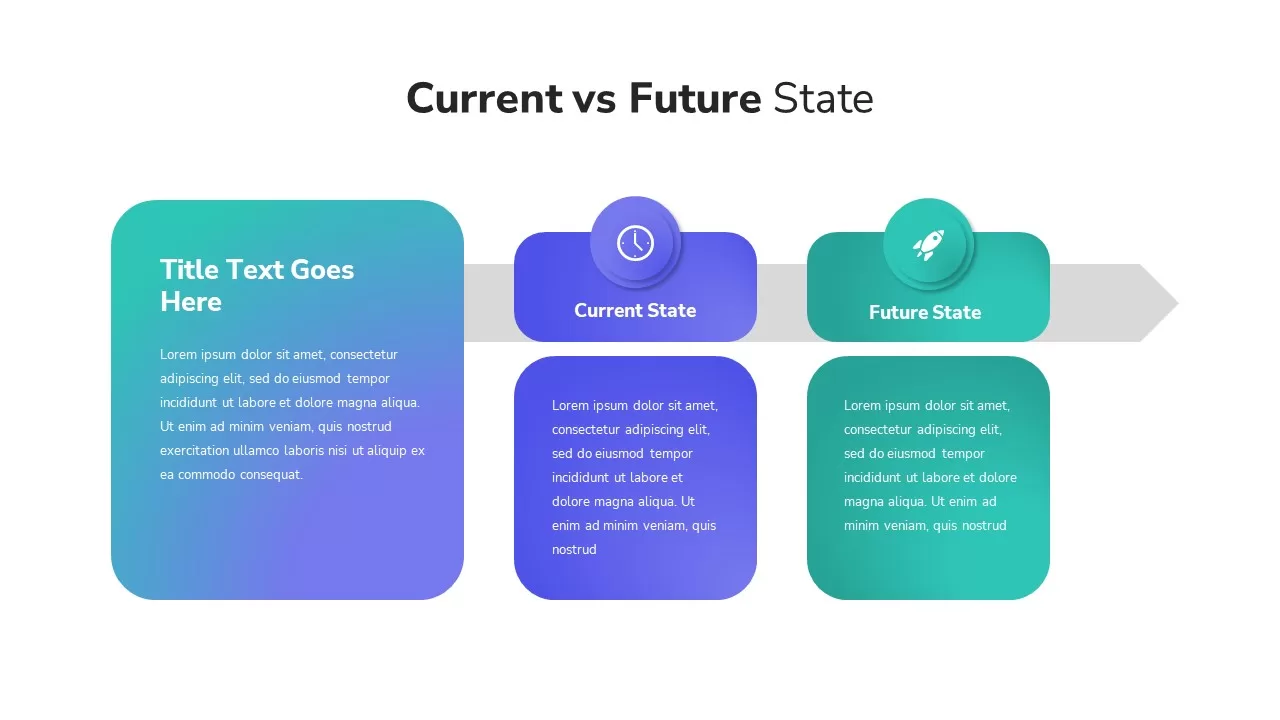
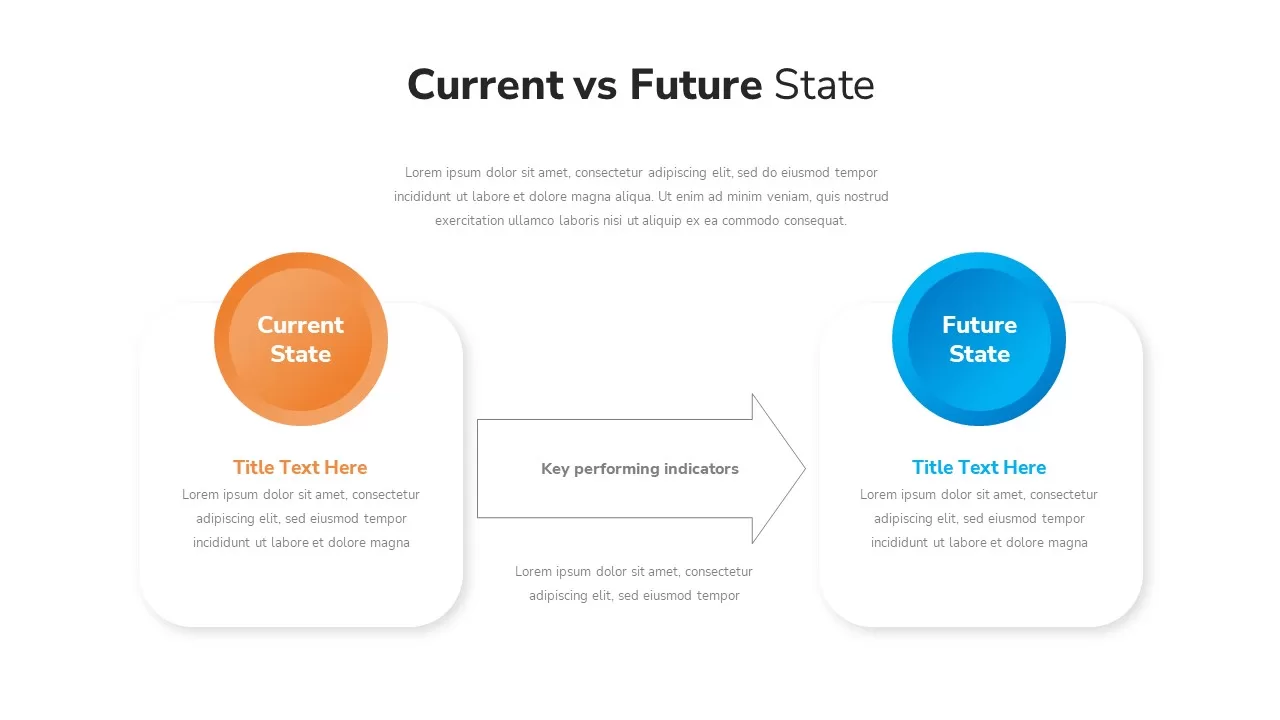
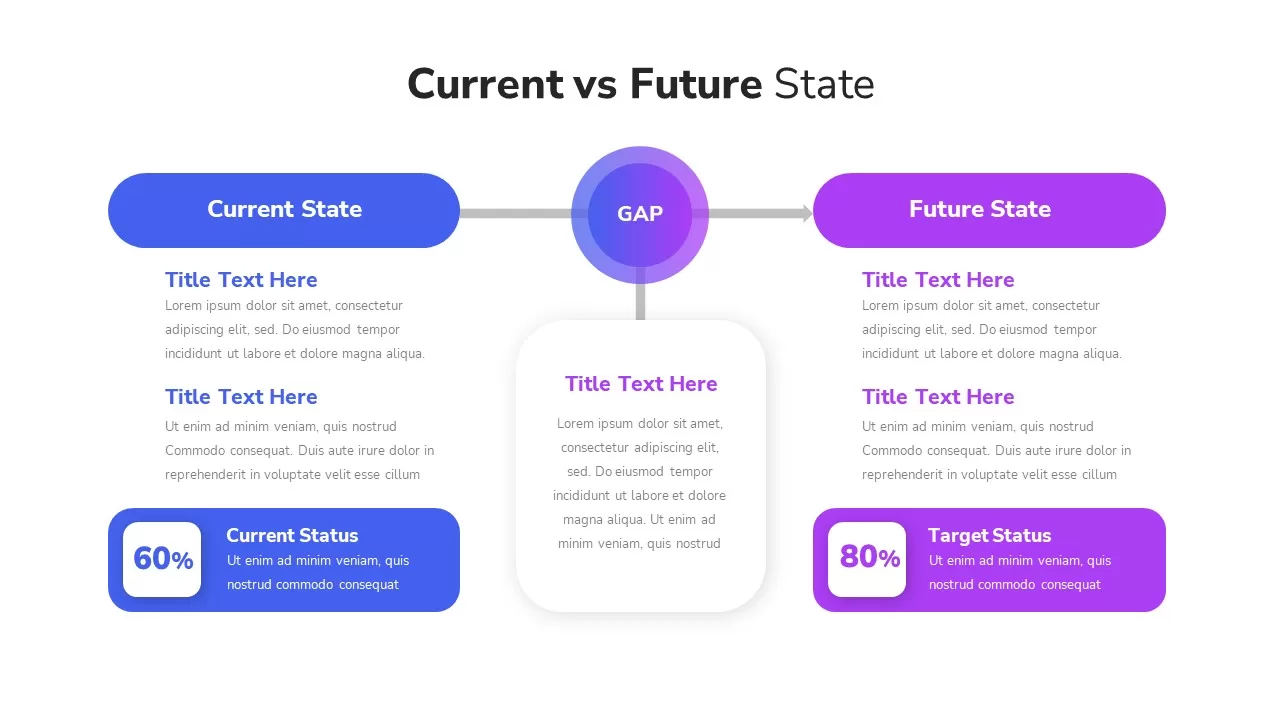
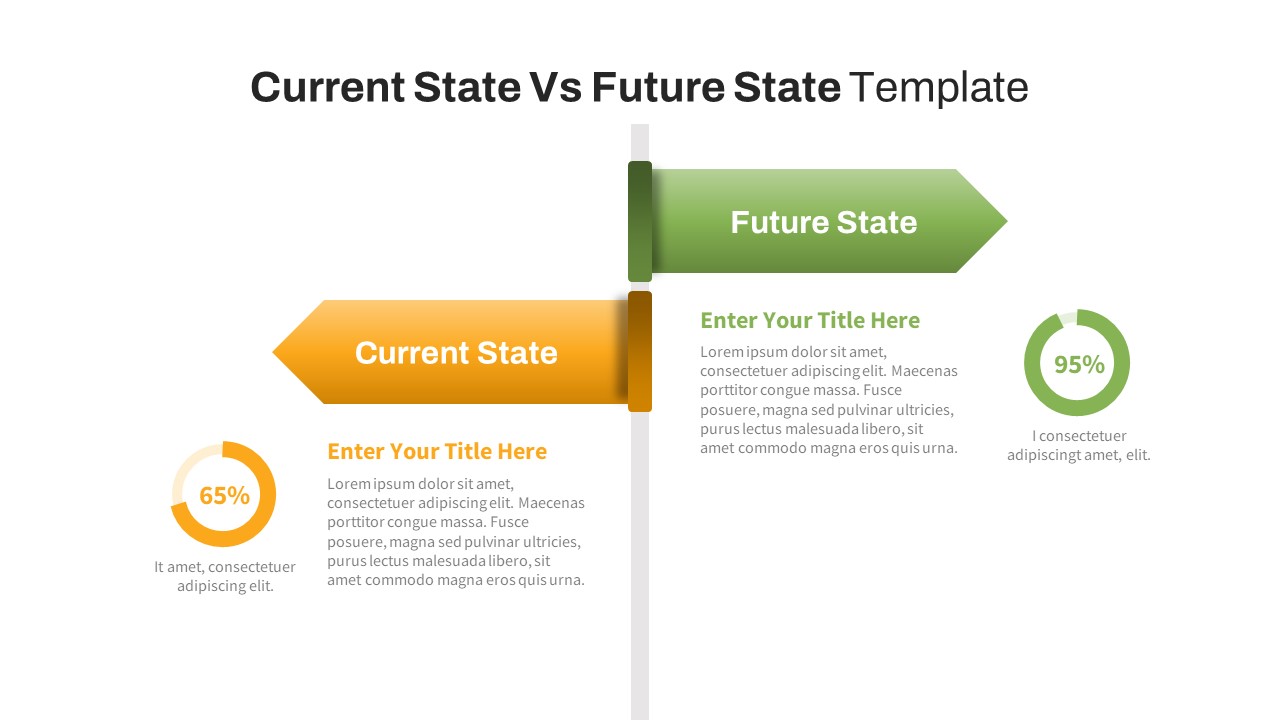
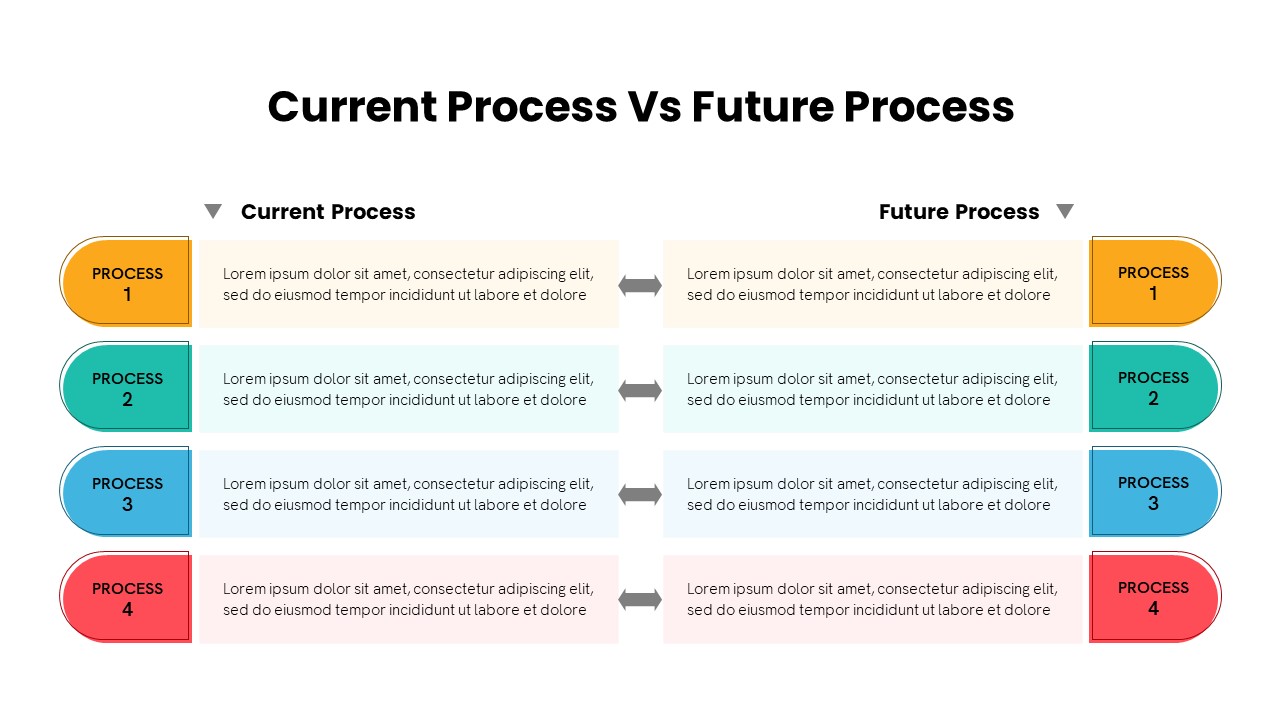
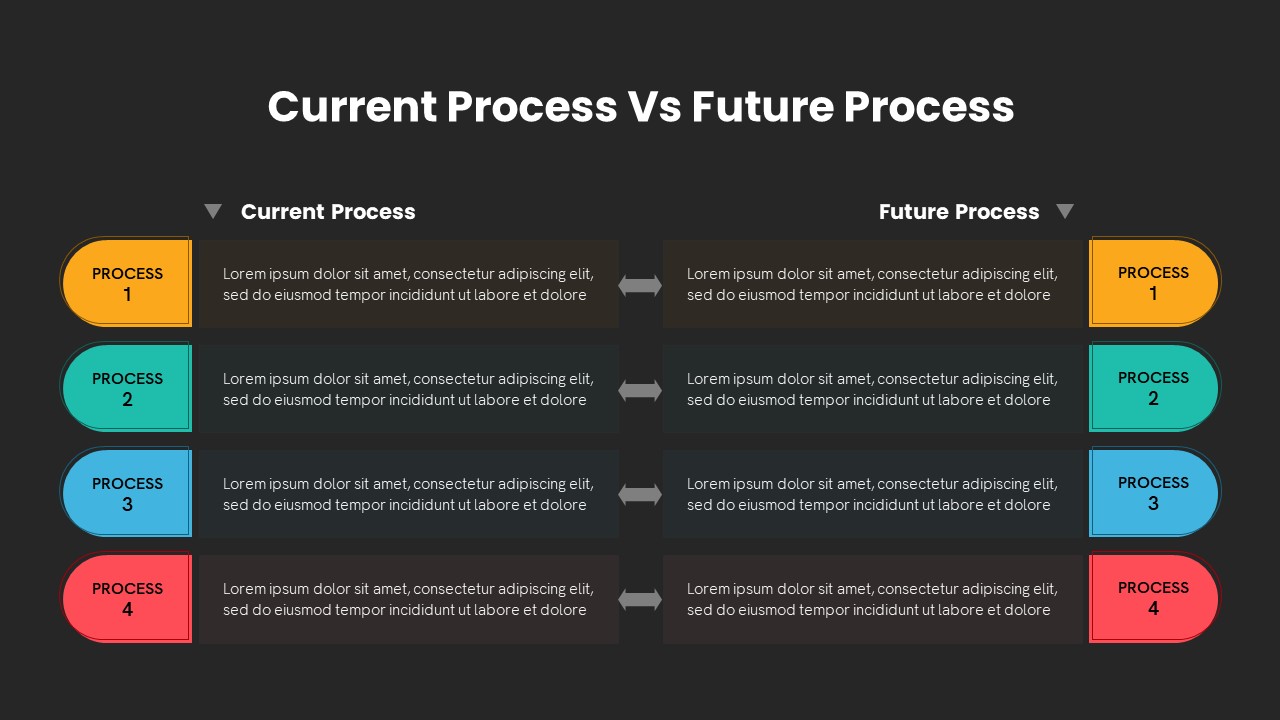
Current Process Vs. Future Process PowerPoint comes in two variant designs with four background PPT slides. One is an arrow timeline template, and the other is a comparison PowerPoint diagram. With this template, the users can portray the current process of a business with future expectations. So, it is similar to the current state and future state. Business professionals, marketers, analysts, and sales executives can leverage this fully editable template to depict their current goals as well as their futuristic objectives. This is a transformation presentation model that allows the presenter to emphasize which change measures should be taken to improve companies future process.
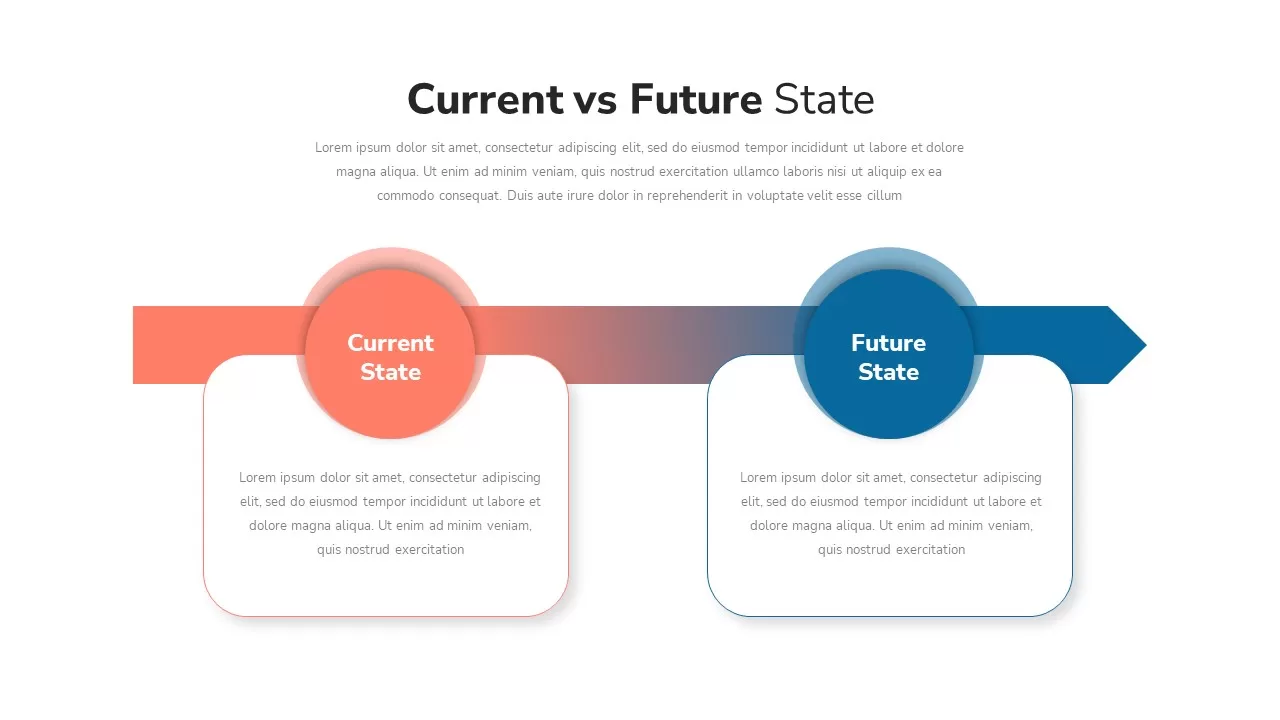
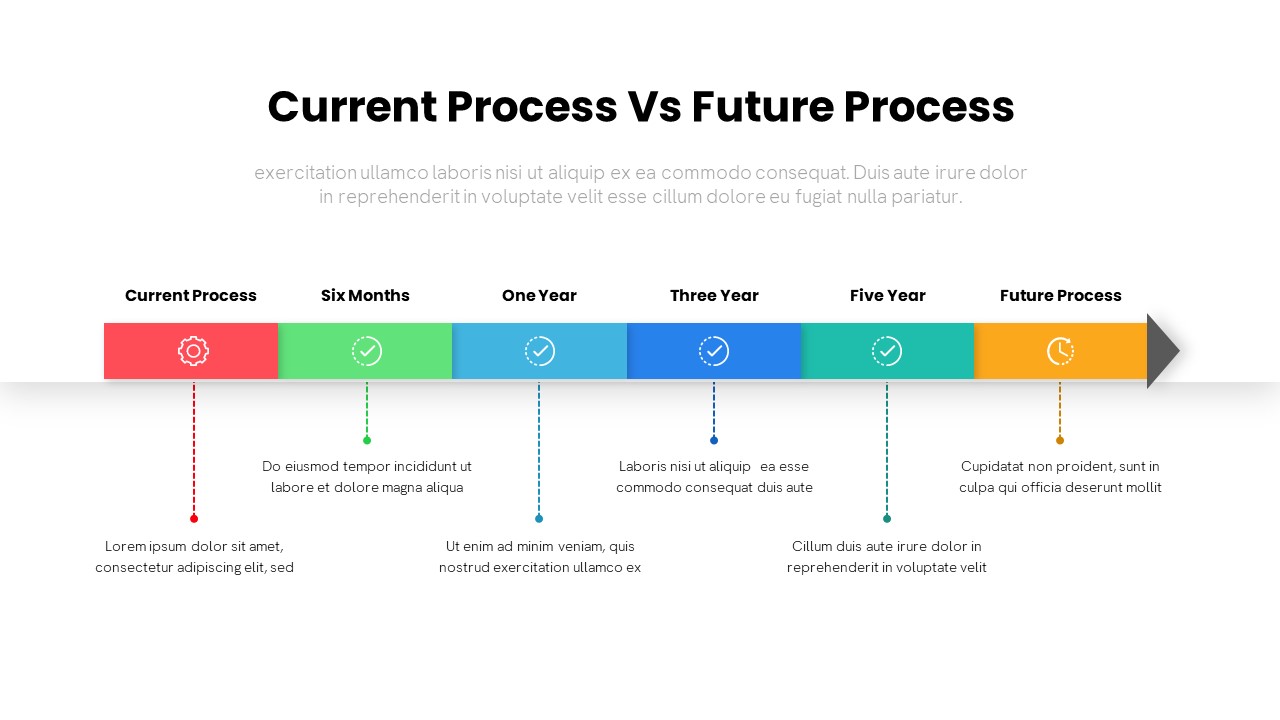
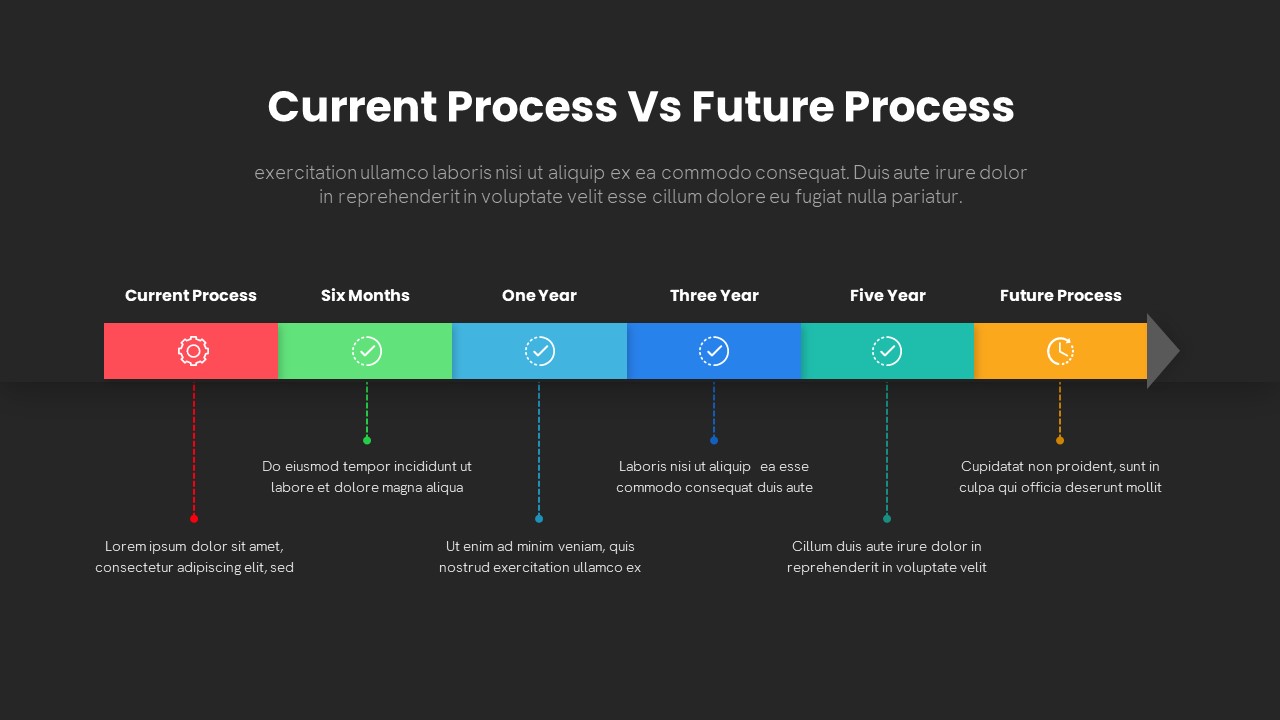
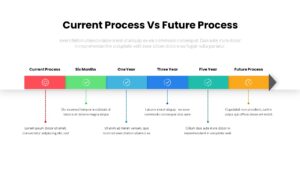
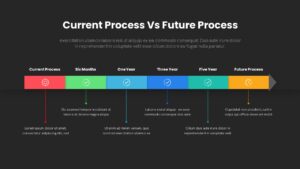
The current Process Vs. Future Process template for PowerPoint presentations presents a colorful timeline and comparison diagram to maximize the audience’s attention. The arrow timeline template has six divisions to show the current and future strategies or Processes of a business. The multi-functional timeline design allows the presenter to insert text at the bottom of the design. Dotted color lines will show it.
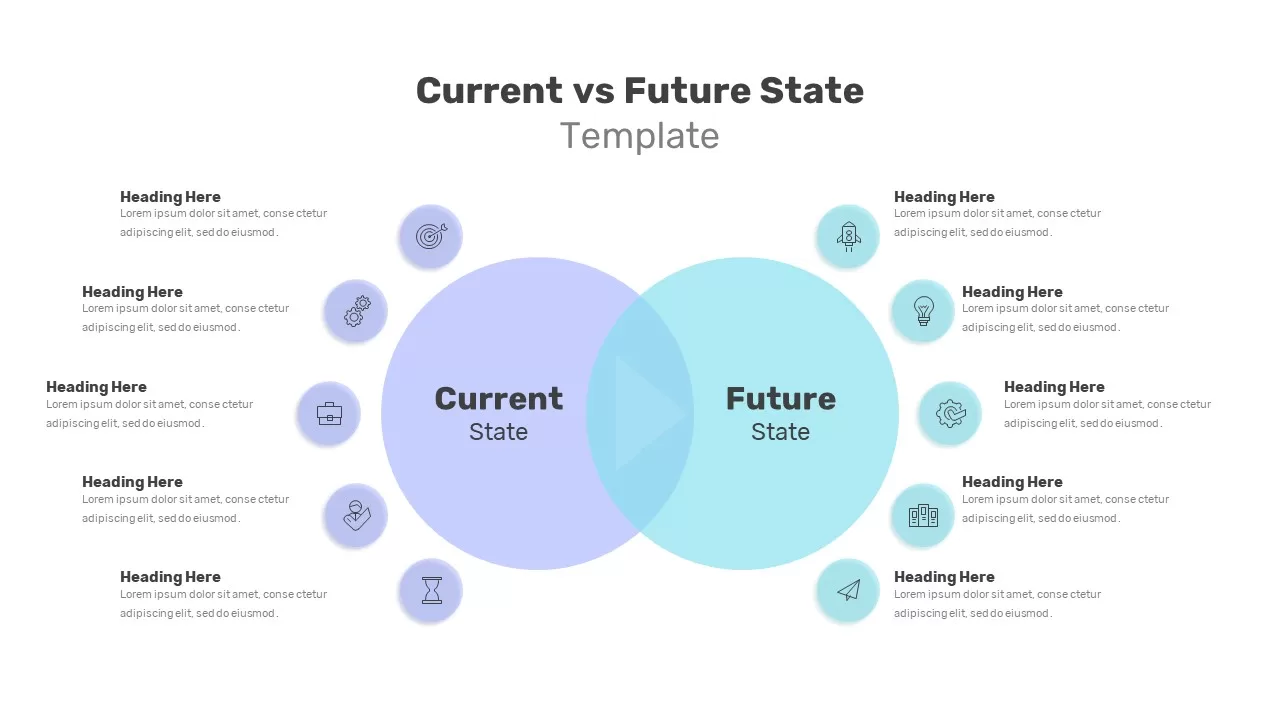
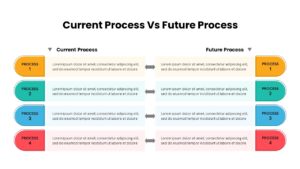
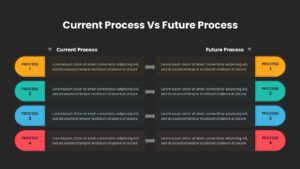
On the other hand, the comparison diagram is a perfect tree diagram design with four sections on each slide. Therefore, the presenters can compare current and future Processes with descriptive notes. Current Process Vs. Future Process PowerPoint Template let’s make changes to its features. Download it now!
Login to download this file

Item ID
SB03423
Related Templates

Modern Current vs Future State Template for PowerPoint & Google Slides
Comparison
Current State vs Future State Template for PowerPoint & Google Slides
Comparison Chart
Current vs Future State PowerPoint Template
Comparison
Current vs Future State Comparison Slide Template for PowerPoint & Google Slides
Comparison Chart
Current vs Future State Comparison Template for PowerPoint & Google Slides
Comparison Chart
Current VS Future State PowerPoint Presentation Template
Comparison Chart
Current vs Future State Analysis template for PowerPoint & Google Slides
Comparison
Current vs Future State Gap Analysis template for PowerPoint & Google Slides
Comparison
Free Current State vs Future State Template
Business Strategy
Free
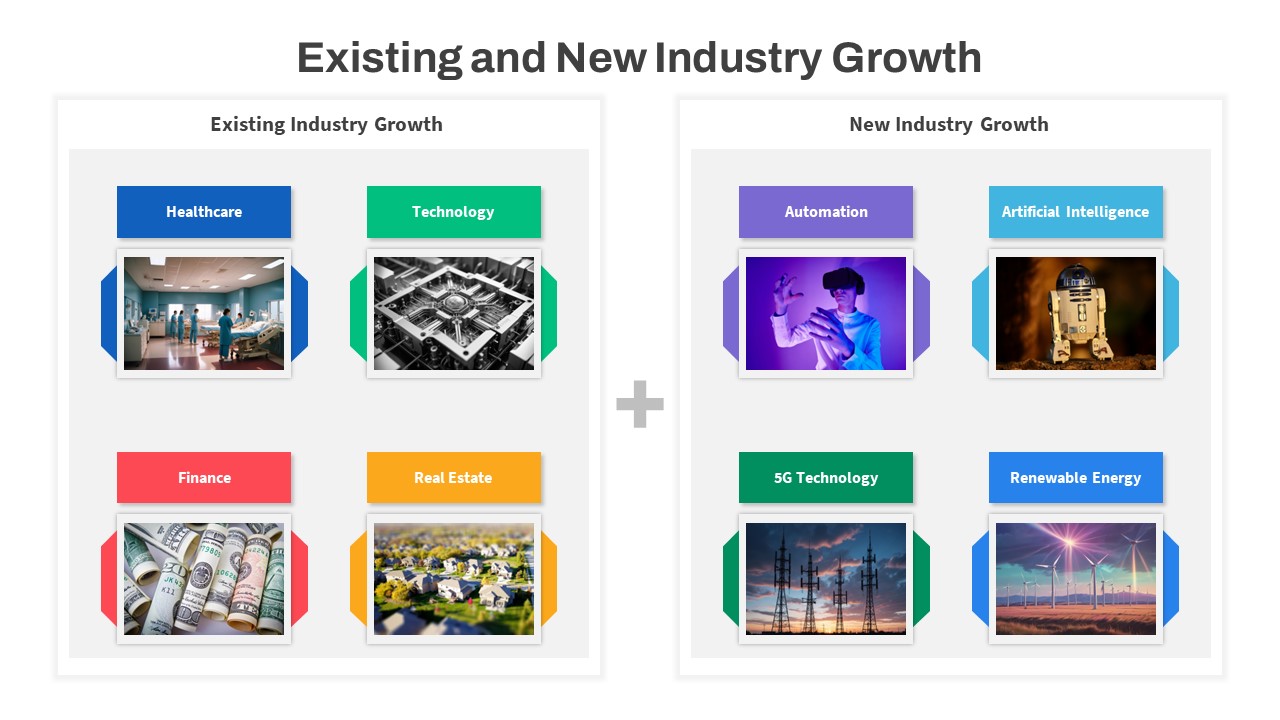
Current and Future Industry Innovations Template for PowerPoint & Google Slides
Comparison
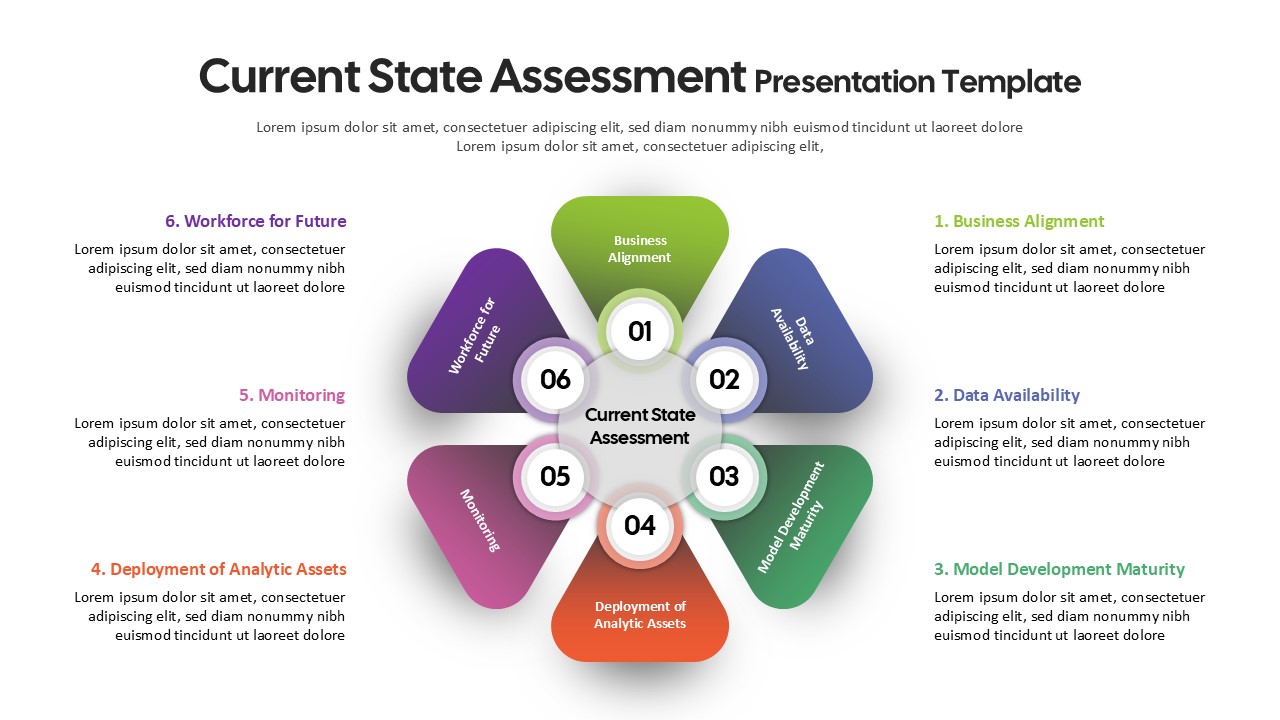
Current State Assessment Template for PowerPoint & Google Slides
Gap
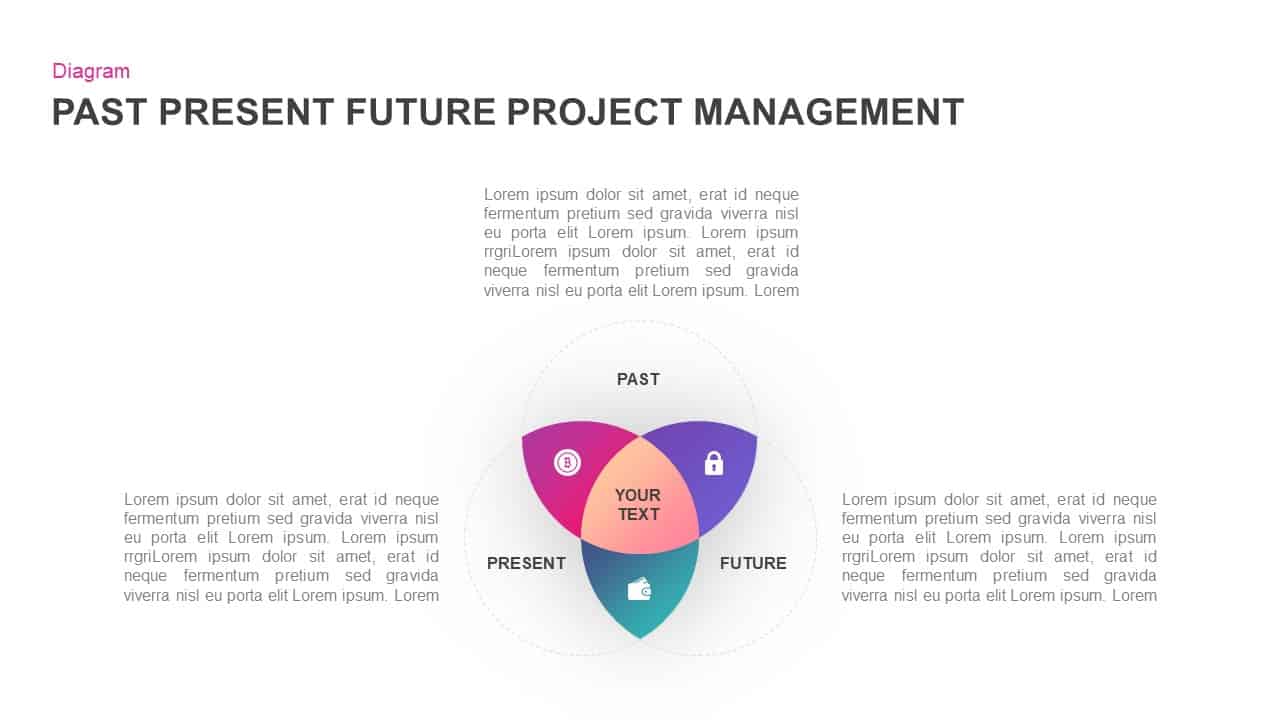
Past, Present & Future Venn Diagram Template for PowerPoint & Google Slides
Comparison
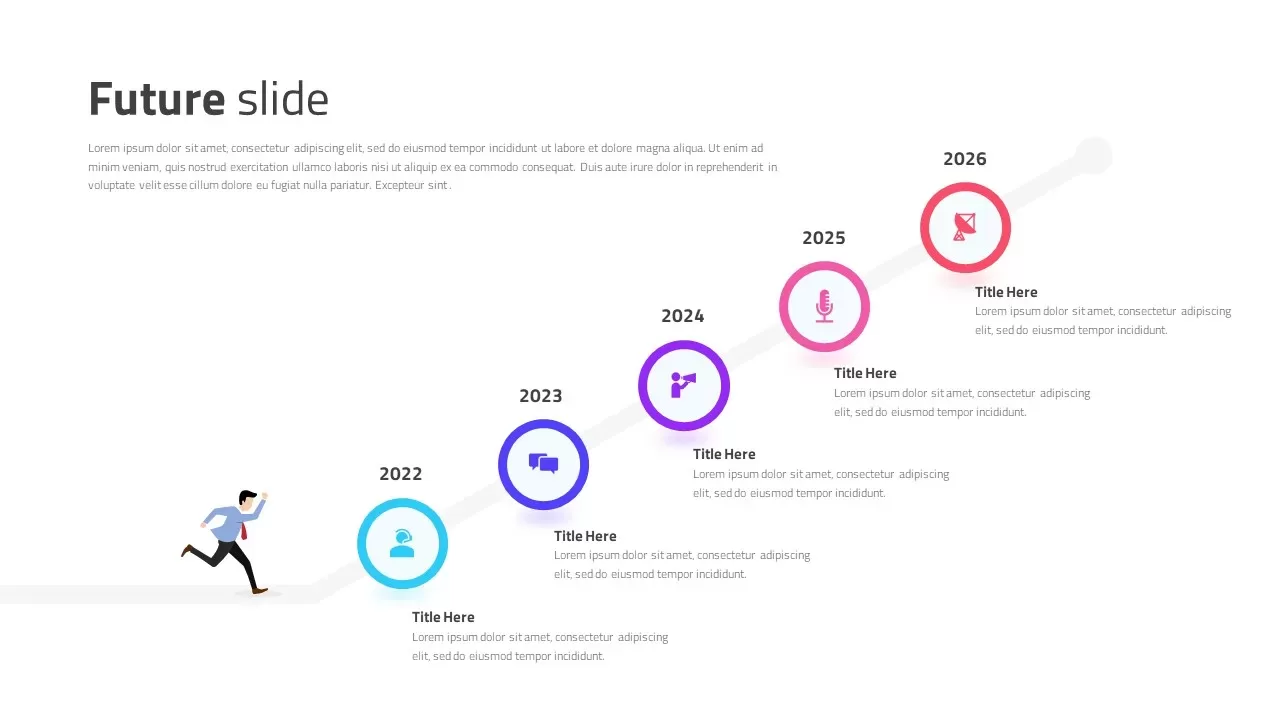
Diagonal Future Timeline Template for PowerPoint & Google Slides
Timeline
AI & Future of Work Gradient Cover Slide Template for PowerPoint & Google Slides
AI
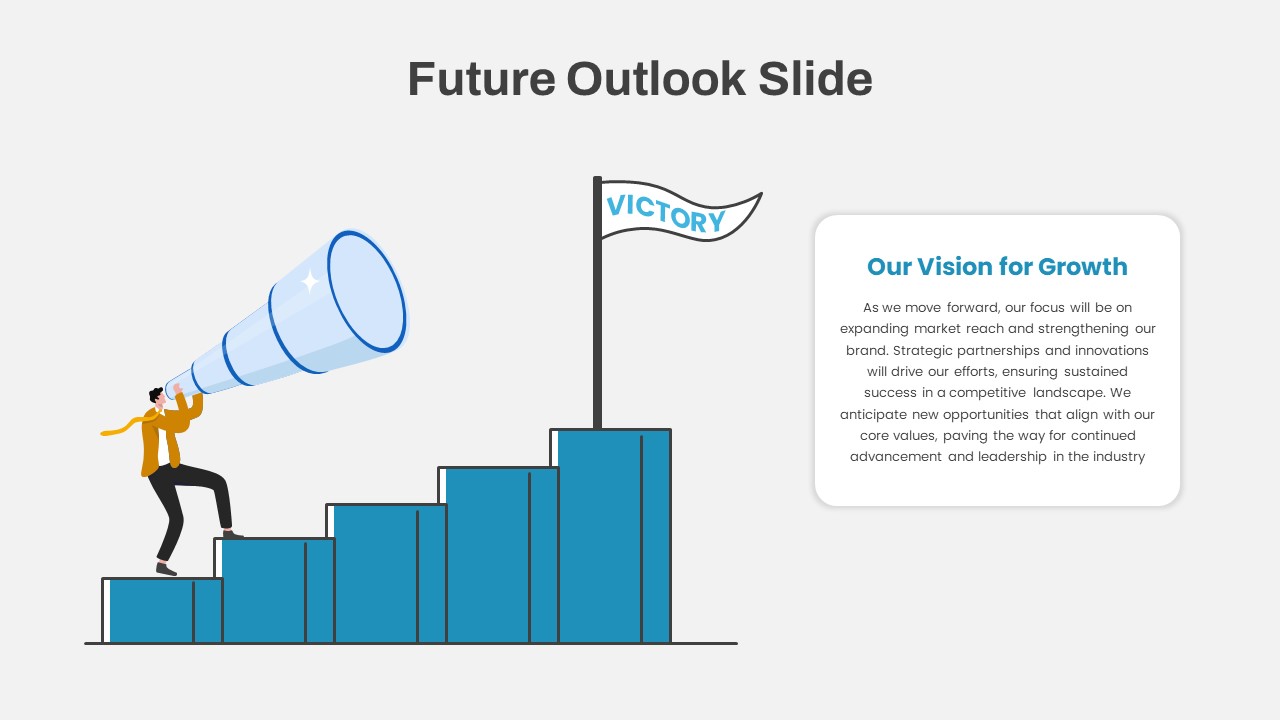
Future Outlook PowerPoint Template
Infographics
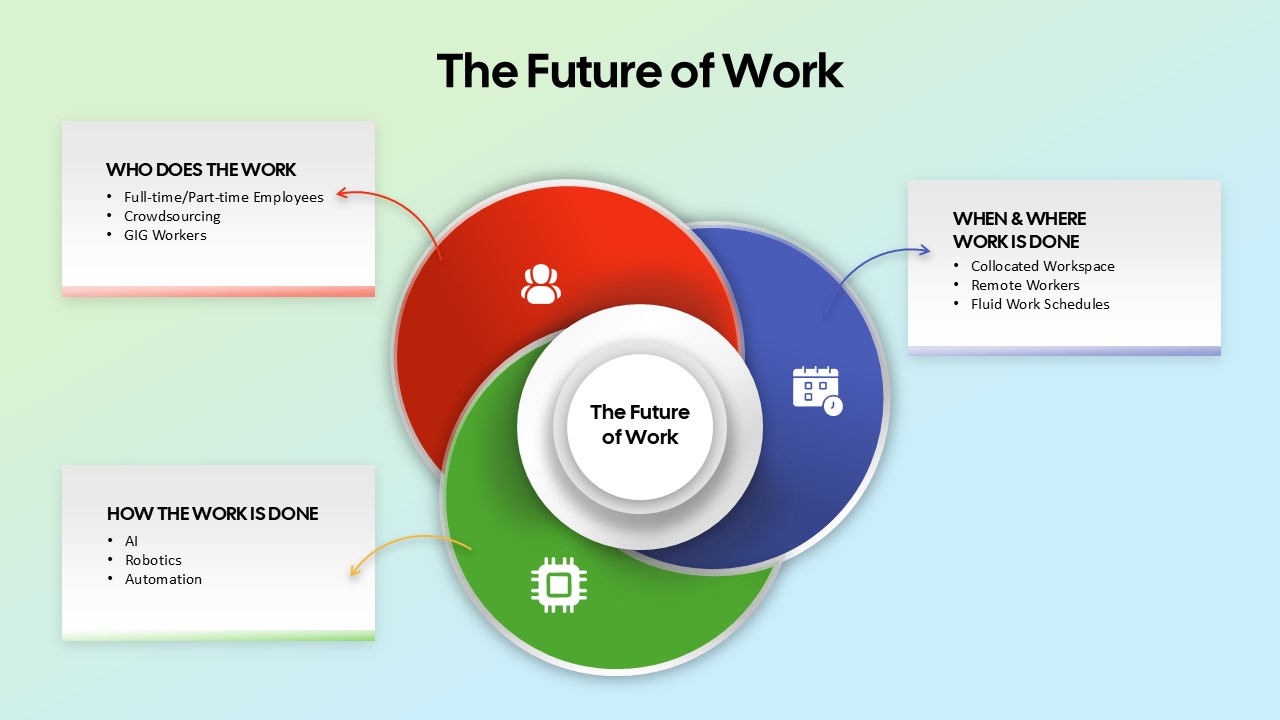
The Future of Work Venn Diagram Template for PowerPoint & Google Slides
Circular
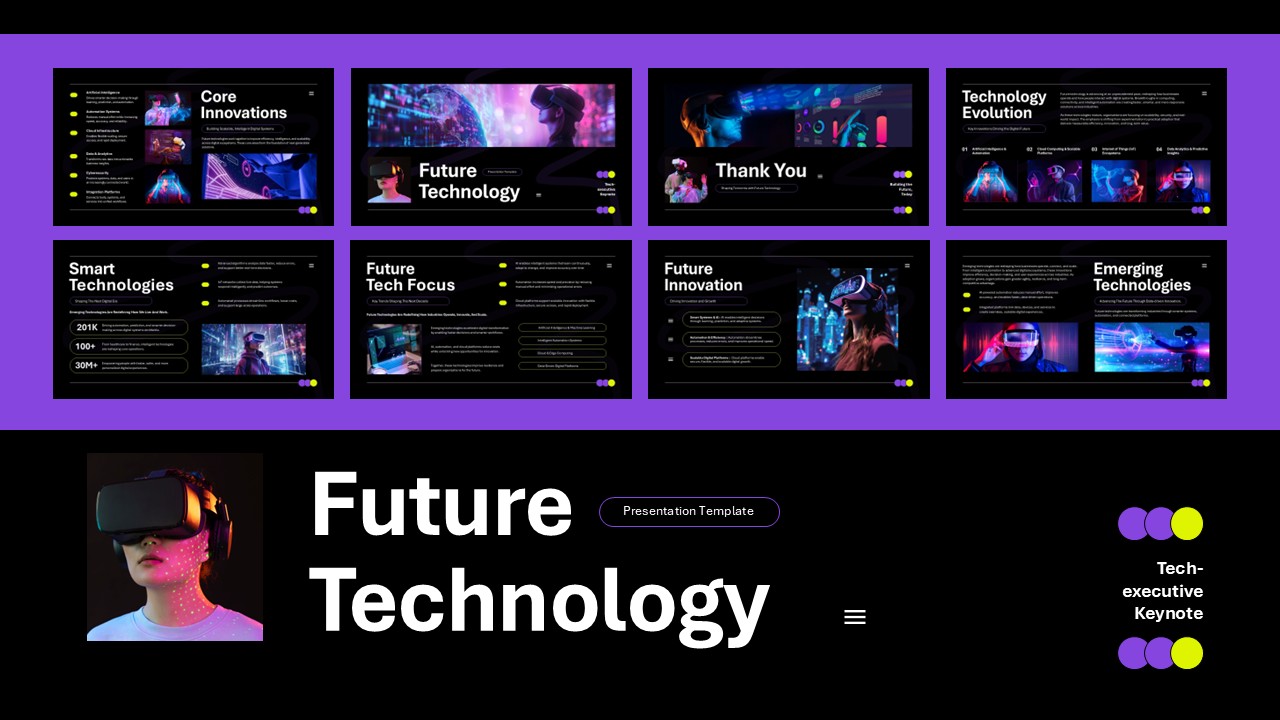
Future Technology Presentation Template for PowerPoint & Slides
AI