Connect the Dots Mind Map template for PowerPoint & Google Slides

Description
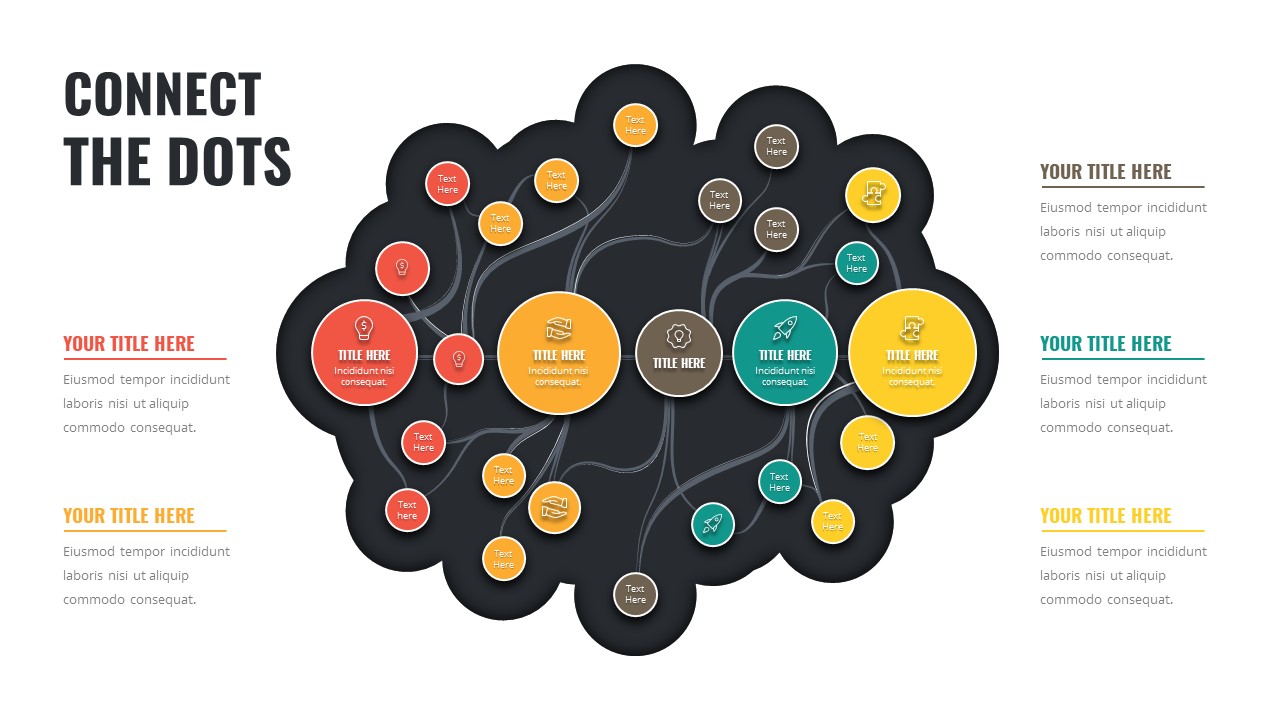
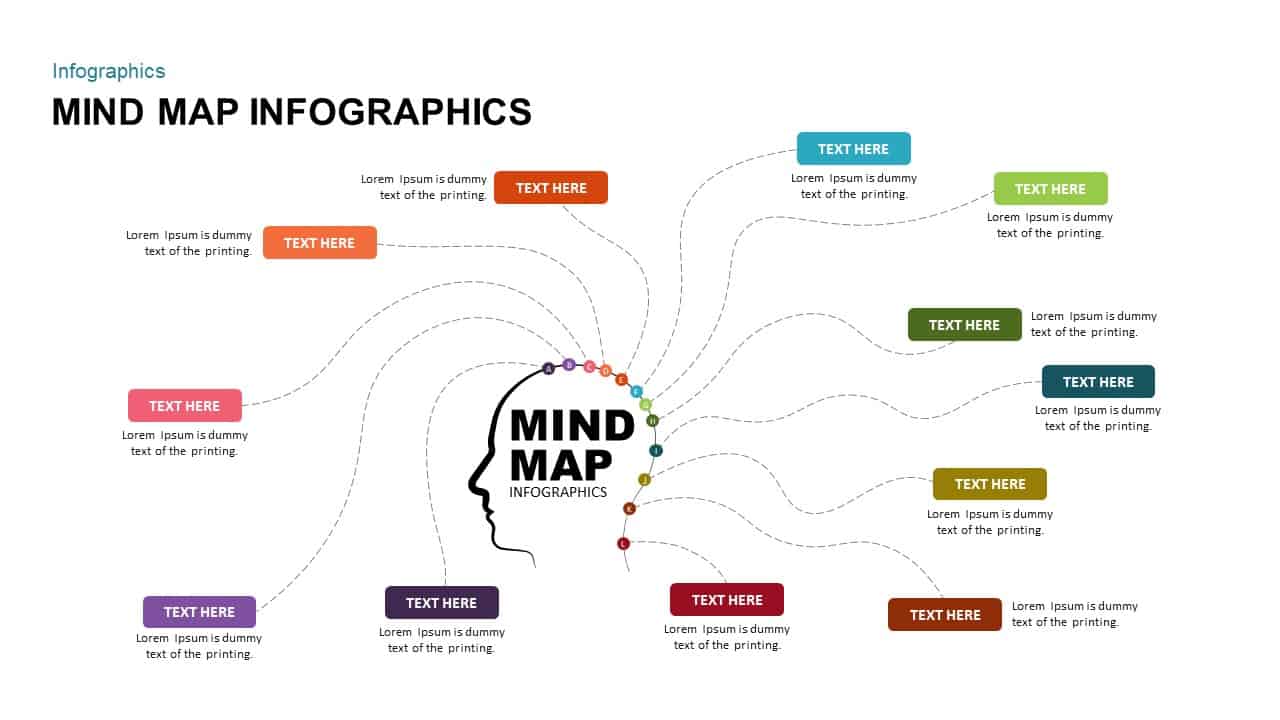
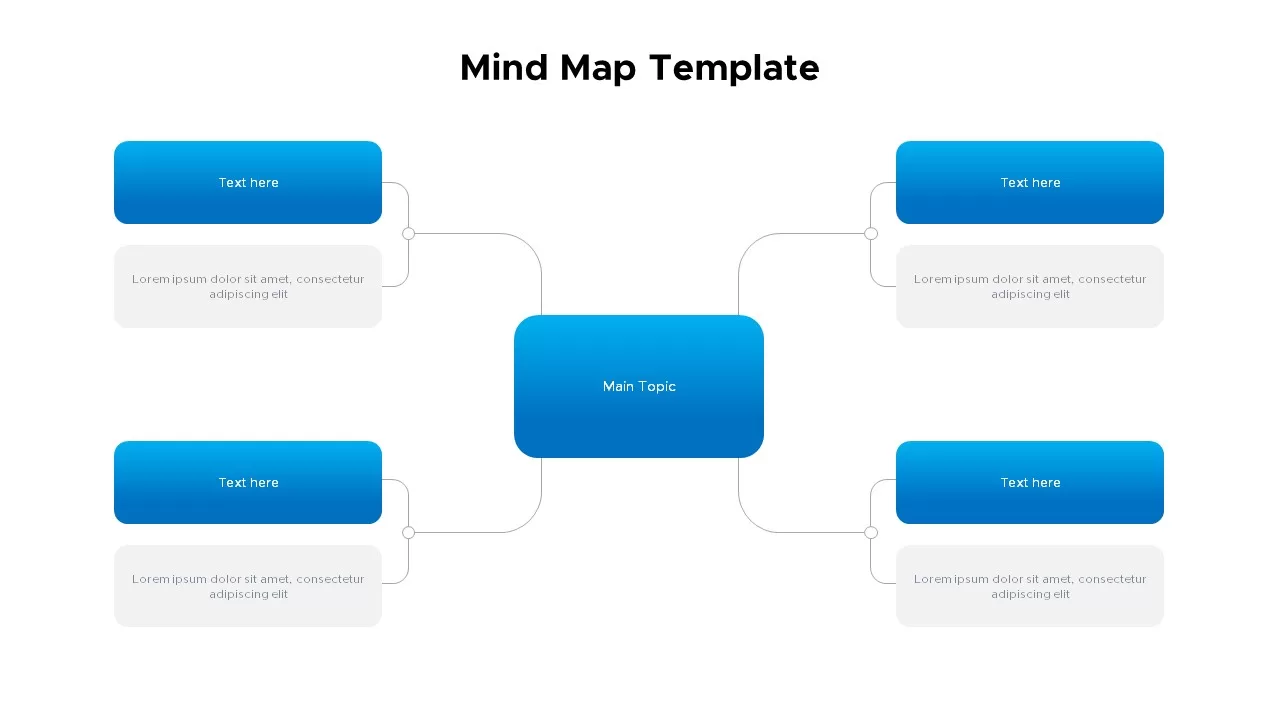
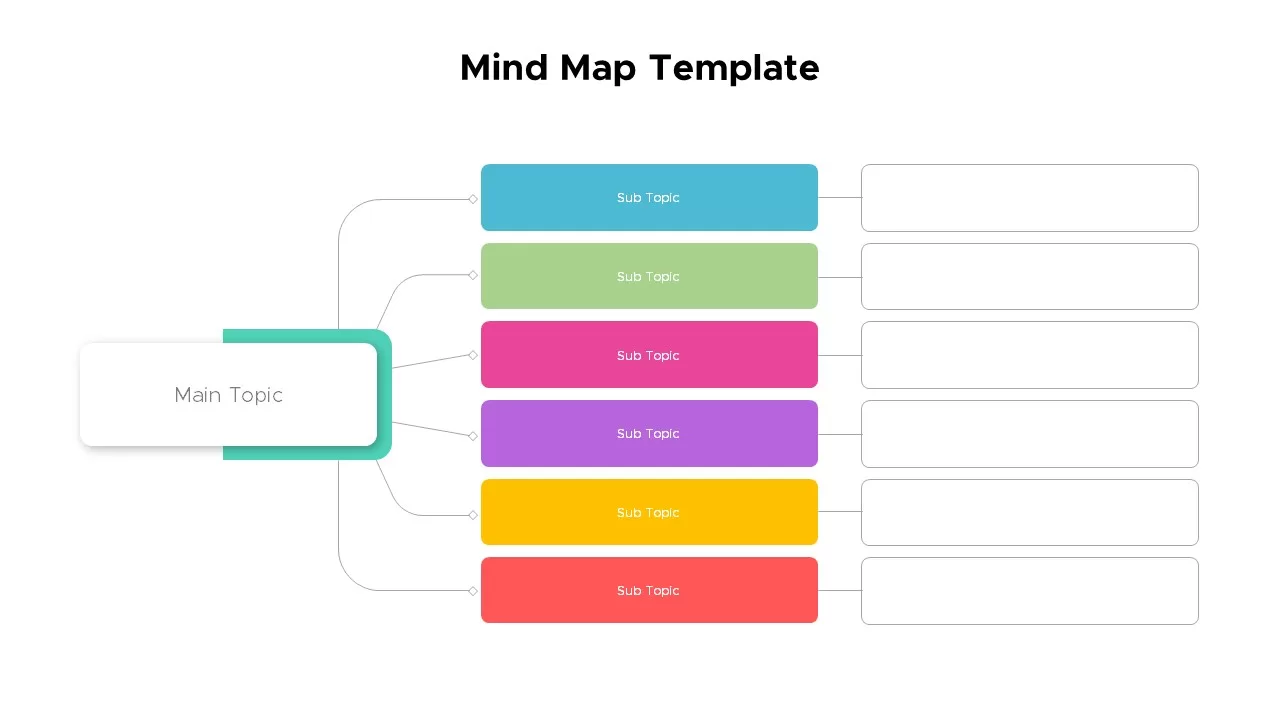
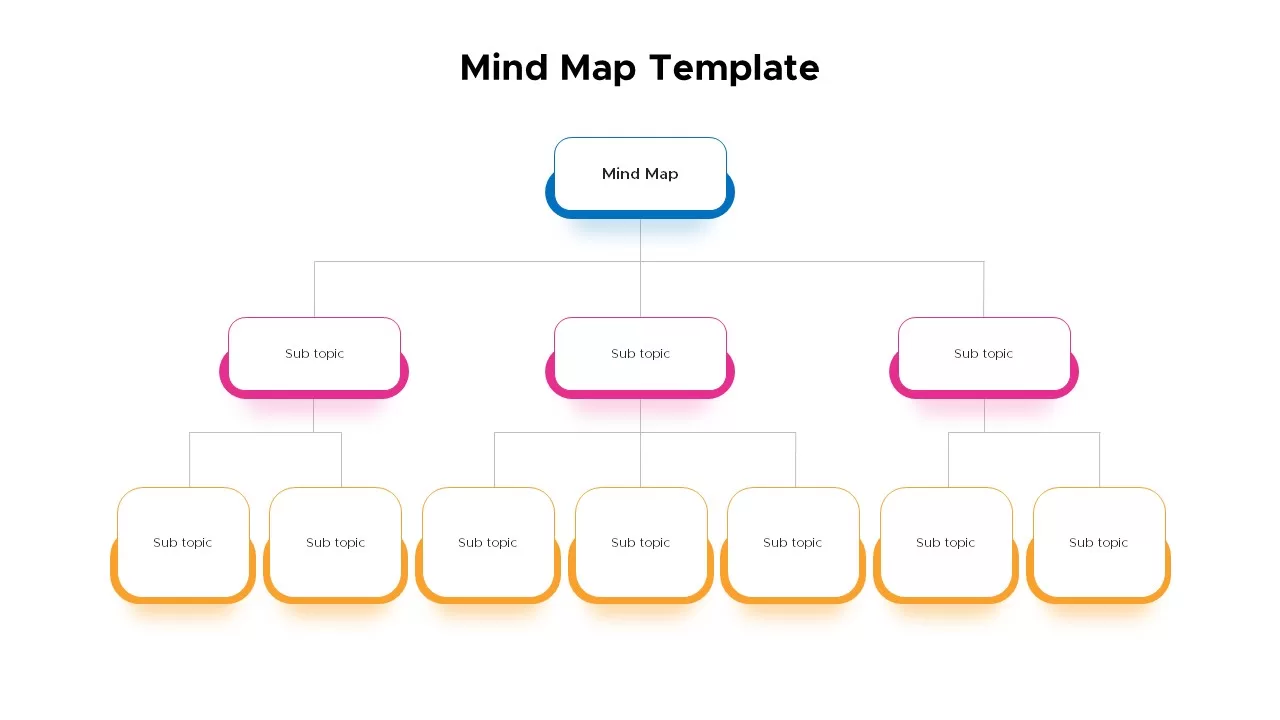
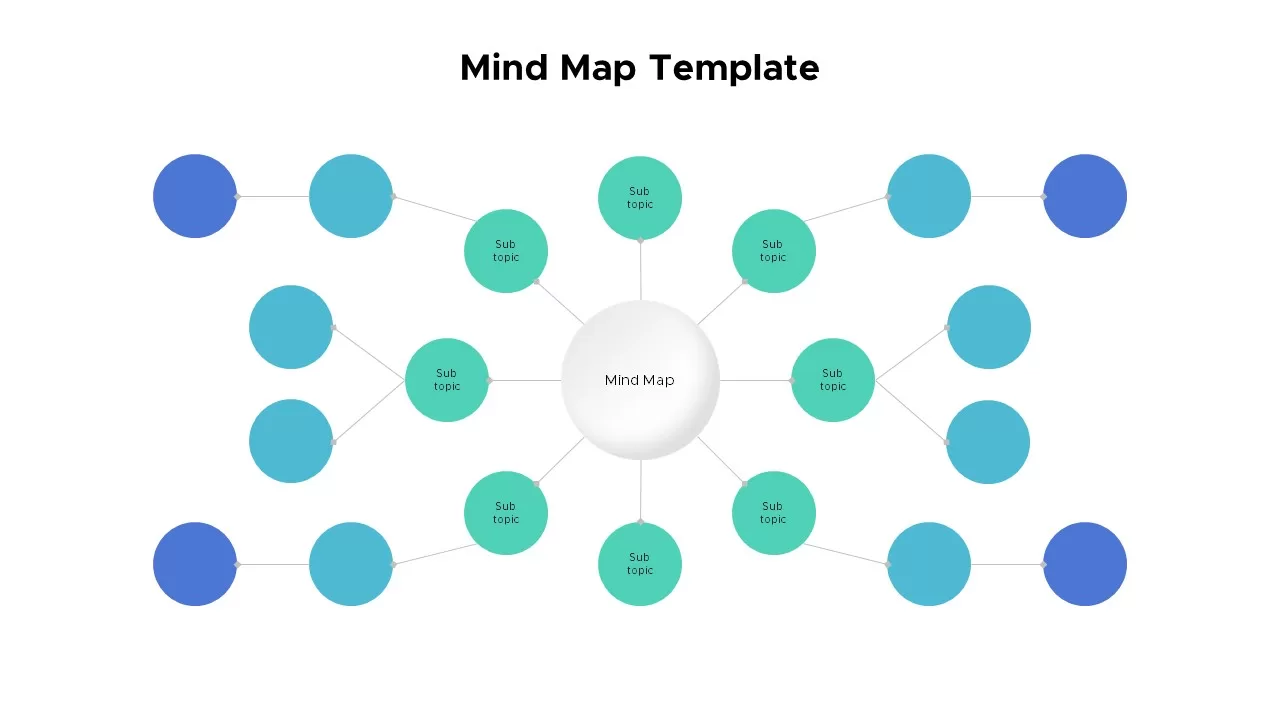
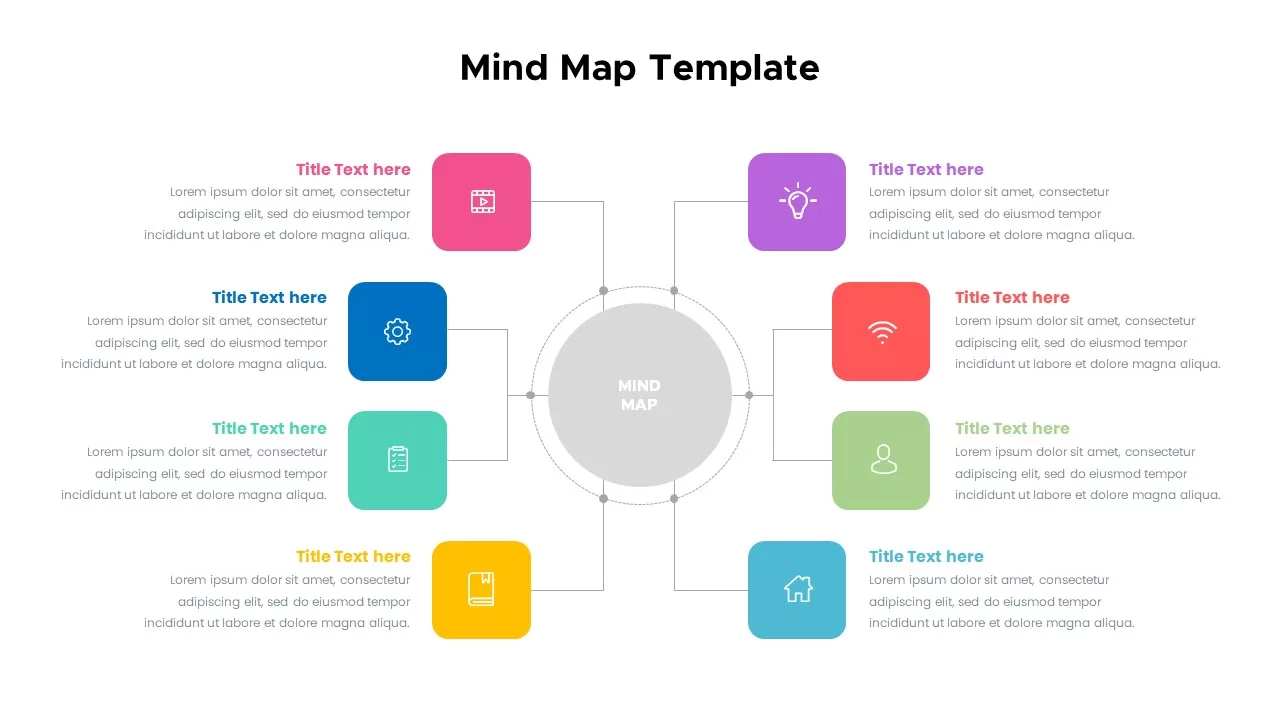
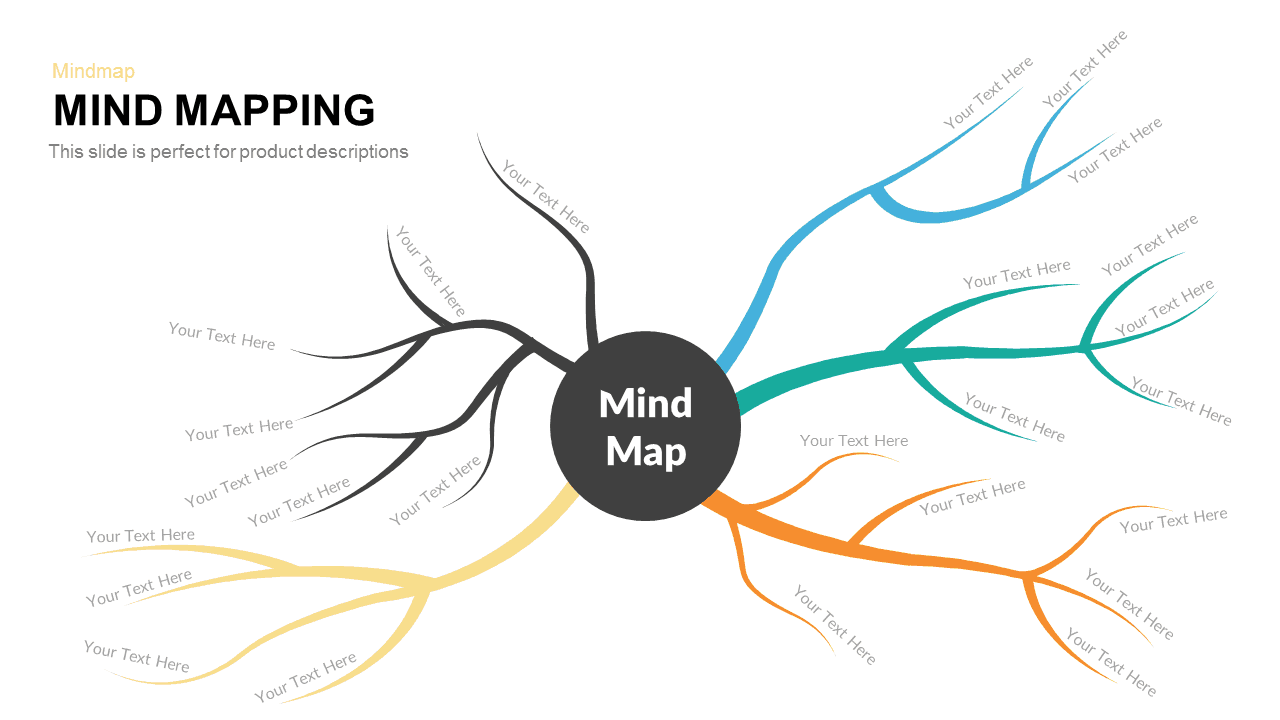
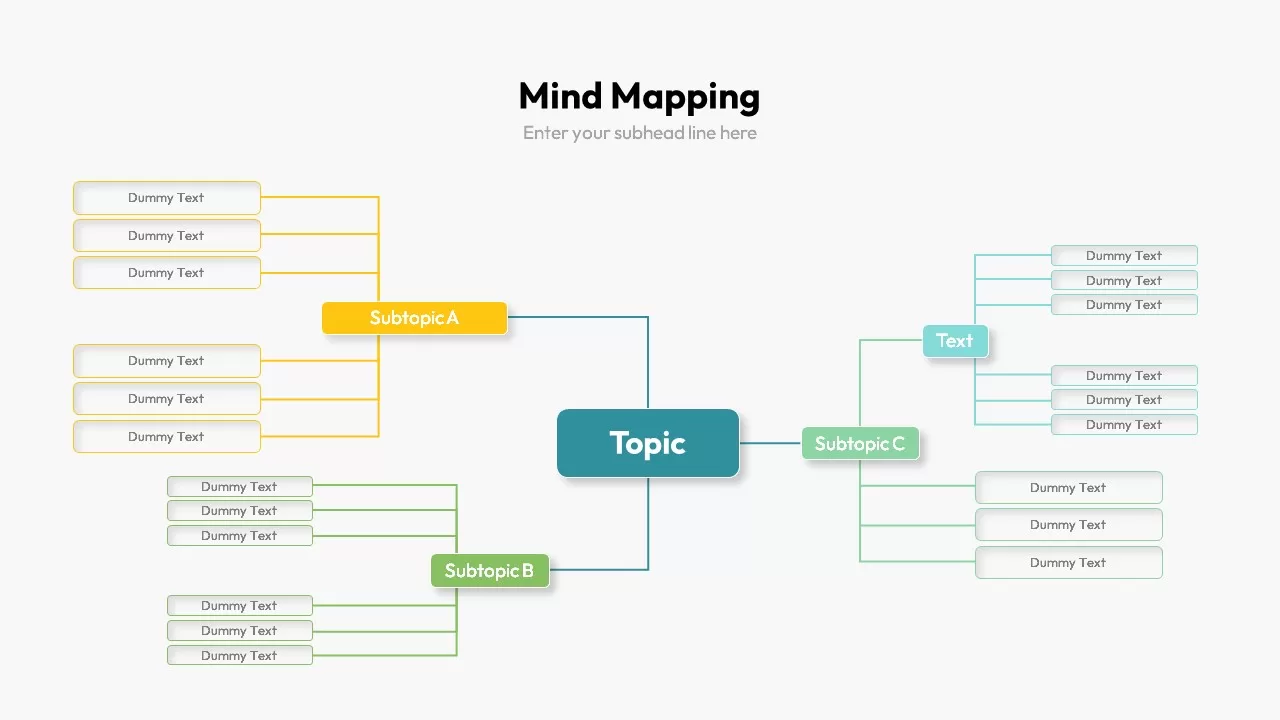
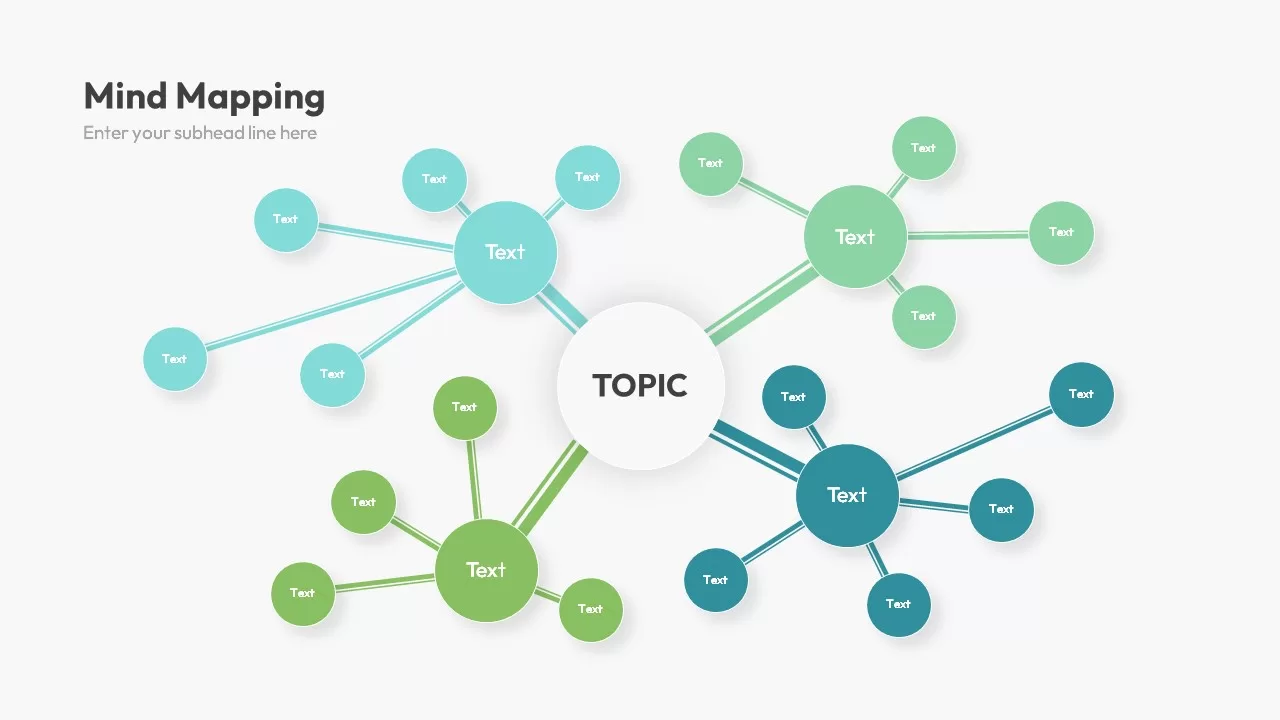
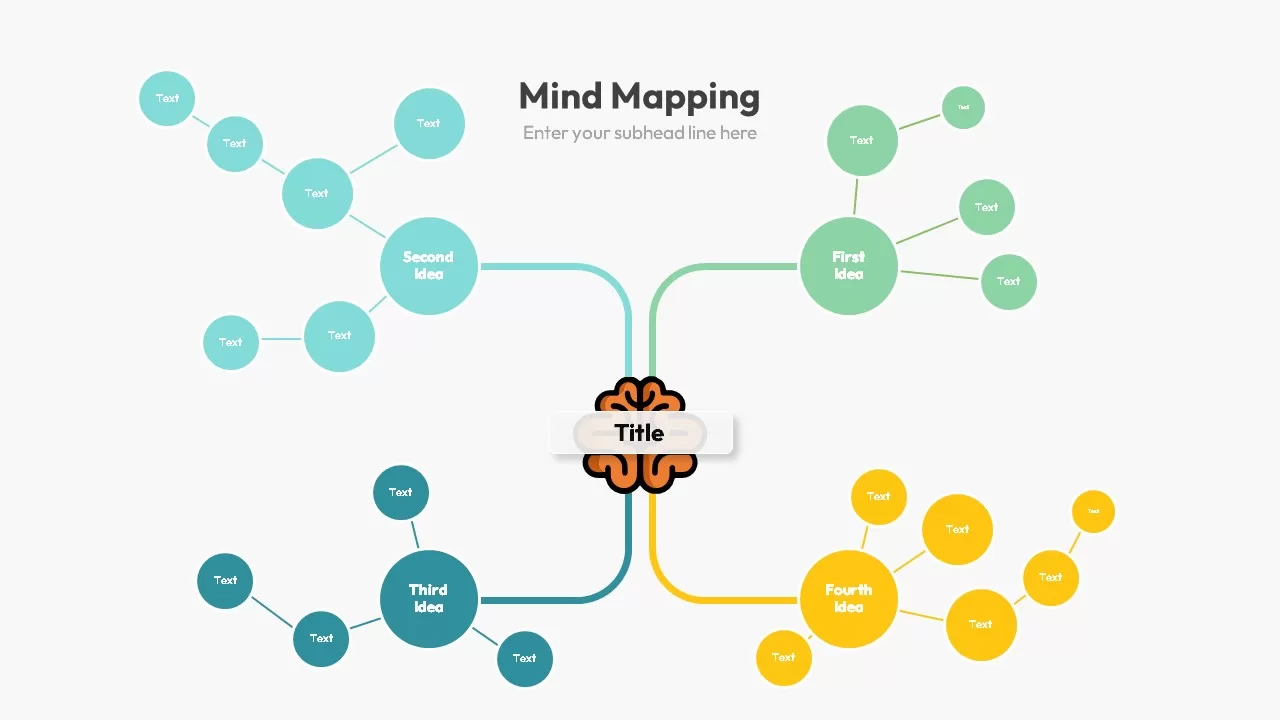
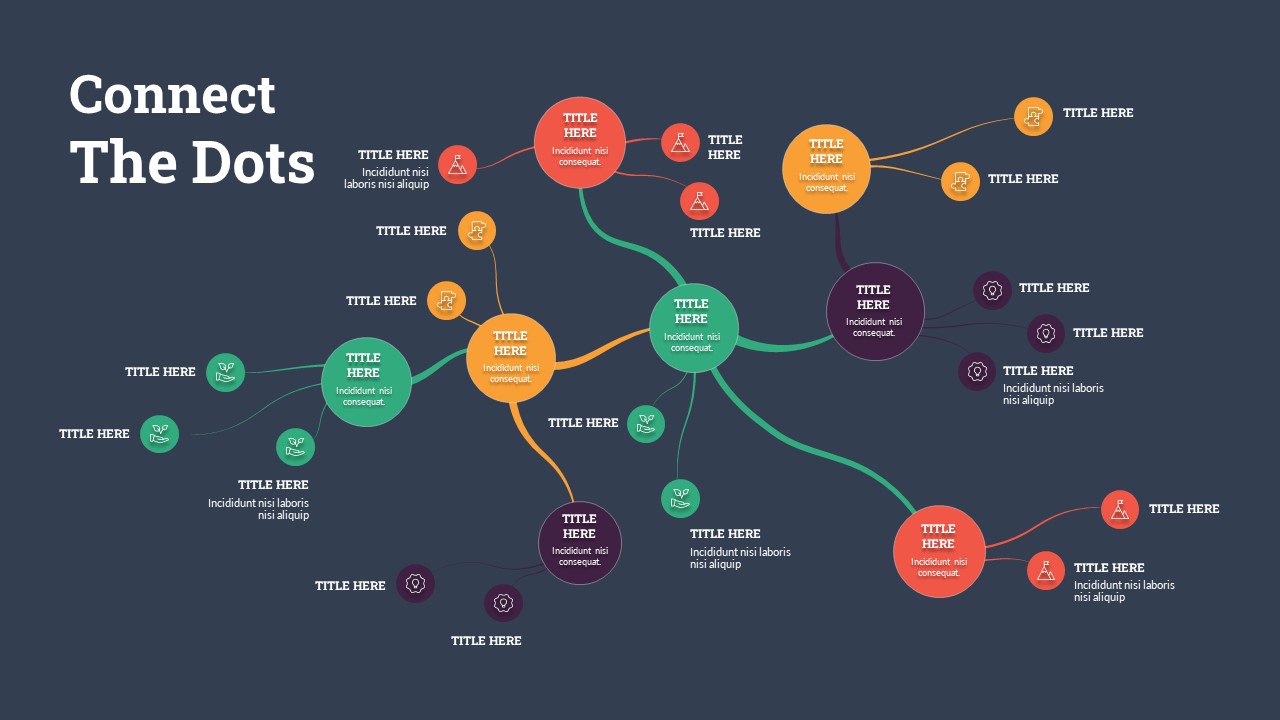
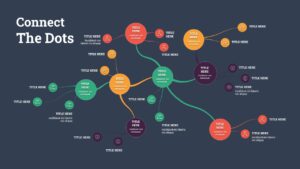
The “Connect the Dots” diagram is a highly engaging, visually compelling way to display interconnected concepts or relationships between ideas. Featuring a network of circular nodes in vibrant colors, this design uses connecting lines to visually link topics, providing clarity and enhancing comprehension for audiences. Each dot can represent a key idea, project component, or piece of information, with customizable text placeholders for easy adaptation to your specific content. The dynamic use of colors—green, orange, purple, and blue—helps differentiate the various components, making the flow of information clear and easy to follow.
This modern, minimalist slide style is optimized for use in both PowerPoint and Google Slides, allowing for effortless adjustments to suit a variety of contexts such as brainstorming sessions, project management, strategic planning, and presentations that require complex yet visually appealing relationship mapping. Whether used to illustrate organizational structures, workflows, product features, or any other interconnected elements, this diagram promotes clarity and ensures the audience remains engaged.
The layout allows you to adjust text and icons within each circle, so you can personalize the content as needed. Thanks to its clean and professional design, the diagram integrates seamlessly with existing branding and presentation styles. It’s also fully editable, meaning you can scale the design or make further customizations quickly to ensure it fits your presentation’s tone and purpose.
Who is it for
This diagram is ideal for business professionals, project managers, consultants, and educators who need to communicate complex systems or relationships in an easily digestible format. Marketing teams, data analysts, and product designers will also find it useful for mapping out workflows, processes, and product features.
Other Uses
Beyond mapping ideas or processes, this diagram is perfect for illustrating supply chains, showing dependencies between projects, or visualizing customer journeys. Its flexibility makes it an excellent tool for organizing thoughts in brainstorming sessions, presenting research findings, or showing organizational hierarchies. Adapt it to fit your needs for various types of business, marketing, or educational presentations.
Login to download this file

Item ID
SB03235
Related Templates

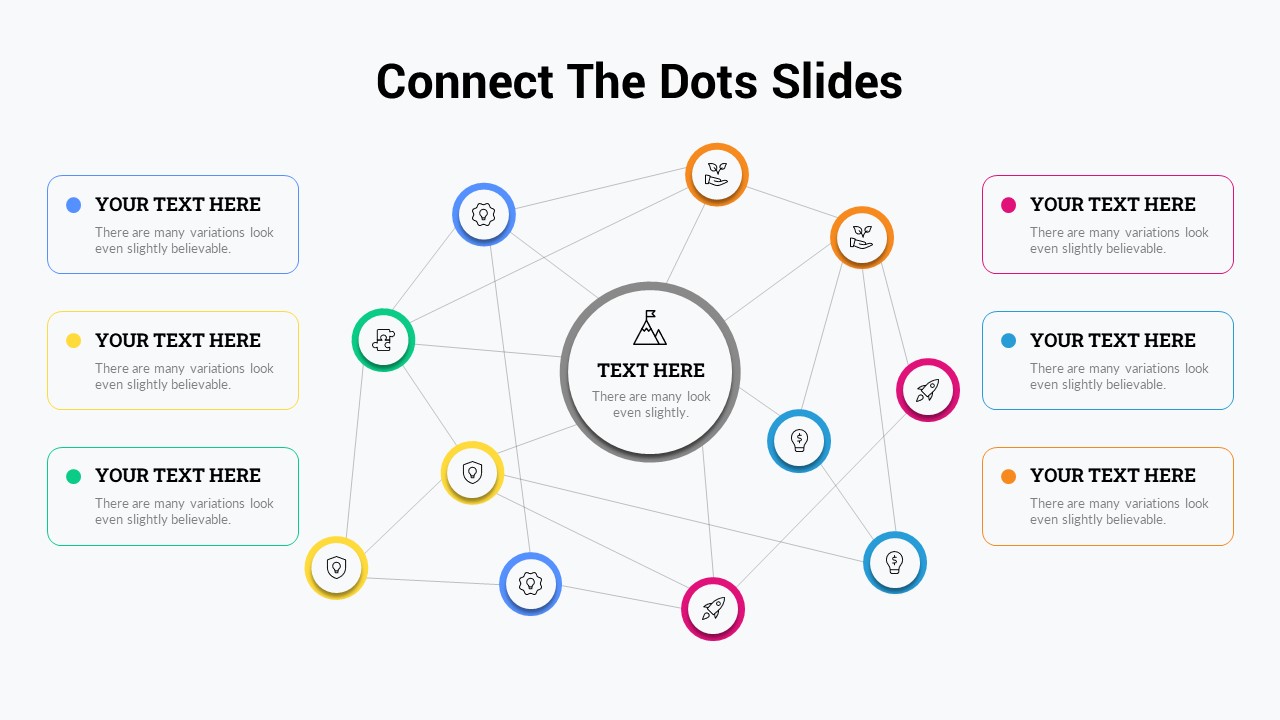
Connect the Dots Mind Map Diagram Template for PowerPoint & Google Slides
Mind Maps
Connect The Dots slide template for PowerPoint & Google Slides
Business
Mind Map PowerPoint template for PowerPoint & Google Slides
Mind Maps
Diamond Mind Map Diagram Four Branches Template for PowerPoint & Google Slides
Mind Maps
Risk Management Mind Map Radial Diagram template for PowerPoint & Google Slides
Mind Maps
Colorful Creative Mind Map Diagram template for PowerPoint & Google Slides
Mind Maps

Simple Multi-Branch Mind Map Template for PowerPoint & Google Slides
Mind Maps

Multi-Cluster Mind Map Infographic Template for PowerPoint & Google Slides
Mind Maps
Colorful Mind Map Infographic Template with Icons for PowerPoint & Google Slides
Mind Maps
Colorful Mind Map Infographic Template for PowerPoint & Google Slides
Mind Maps
Mind Map Infographic Slide Template for PowerPoint & Google Slides
Mind Maps
Mind Map Infographics template for PowerPoint & Google Slides
Mind Maps

Eight-Node Mind Map Infographic Diagram Template for PowerPoint & Google Slides
Mind Maps
Mind Map Diagram Template for PowerPoint & Google Slides
Mind Maps
Versatile Mind Map Infographic Template for PowerPoint & Google Slides
Mind Maps
Structured Mind Map Infographic Diagram Template for PowerPoint & Google Slides
Mind Maps
Dual Topic Mind Map Infographic Template for PowerPoint & Google Slides
Mind Maps
Tri-Cluster Mind Map Infographic Template for PowerPoint & Google Slides
Mind Maps
Mind Map Template for PowerPoint & Google Slides
Mind Maps
Mind Map Template for PowerPoint & Google Slides
Mind Maps
Colorful Mind Map Template for PowerPoint & Google Slides
Mind Maps
Colorful Mind Map Template for PowerPoint & Google Slides
Mind Maps
Circular Mind Map Template for PowerPoint & Google Slides
Mind Maps
Colorful Mind Map with Icons Template for PowerPoint & Google Slides
Mind Maps
Colorful Mind Map Template for PowerPoint & Google Slides
Mind Maps
Mind Map Template for PowerPoint & Google Slides
Mind Maps
Modern Custom Eight-Branch Mind Map Template for PowerPoint & Google Slides
Mind Maps
Colorful Multi-Branch Mind Map Slide Template for PowerPoint & Google Slides
Mind Maps
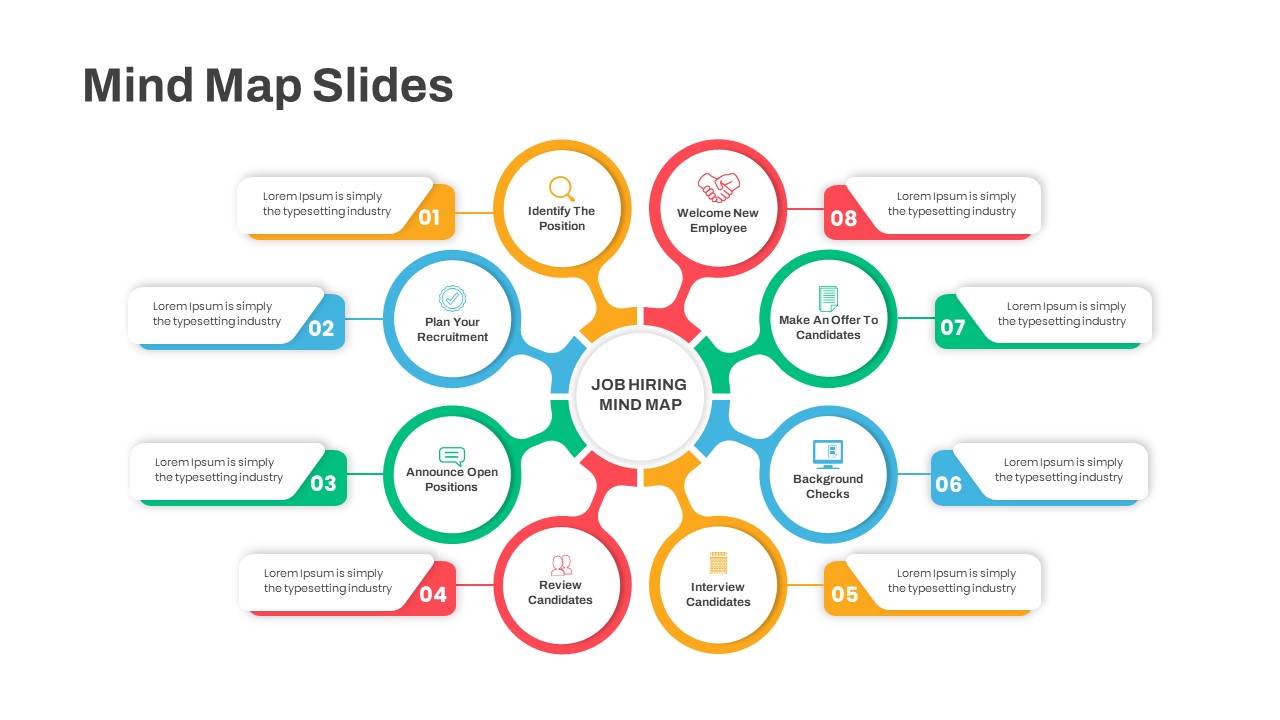
Eight-Step Job Hiring Mind Map Template for PowerPoint & Google Slides
Mind Maps
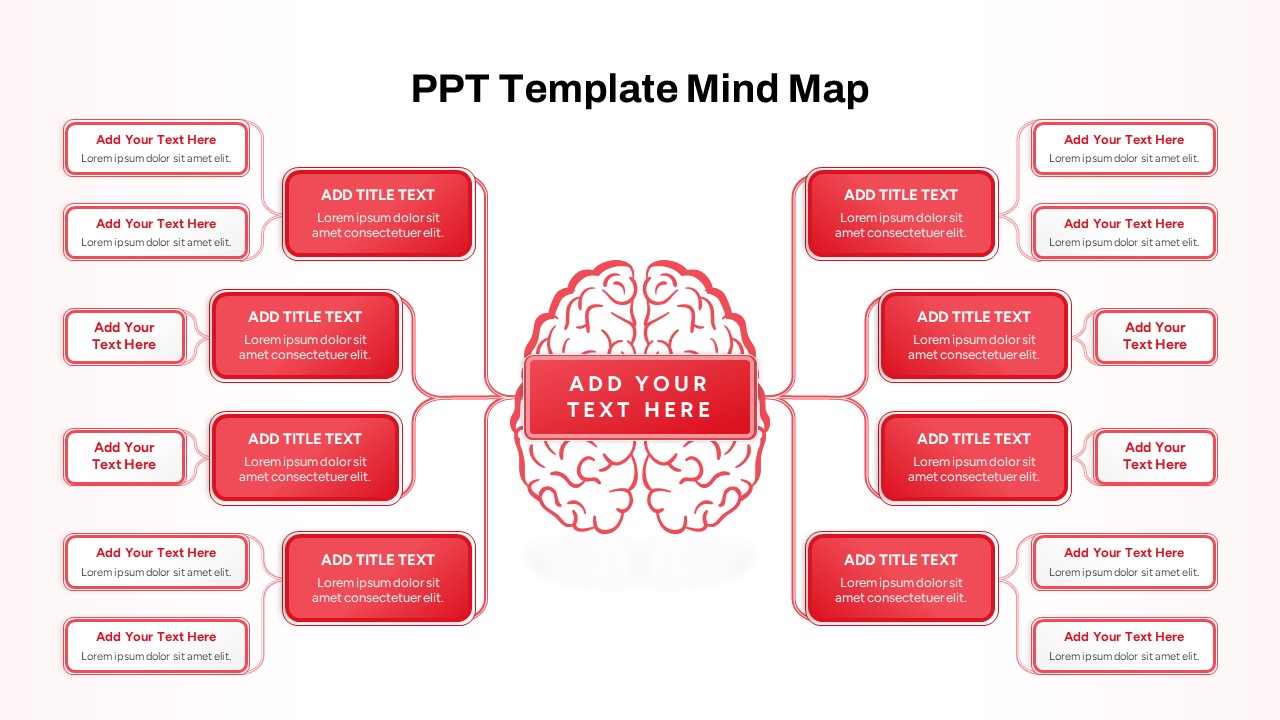
Red Brain Mind Map Diagram Template for PowerPoint & Google Slides
Mind Maps
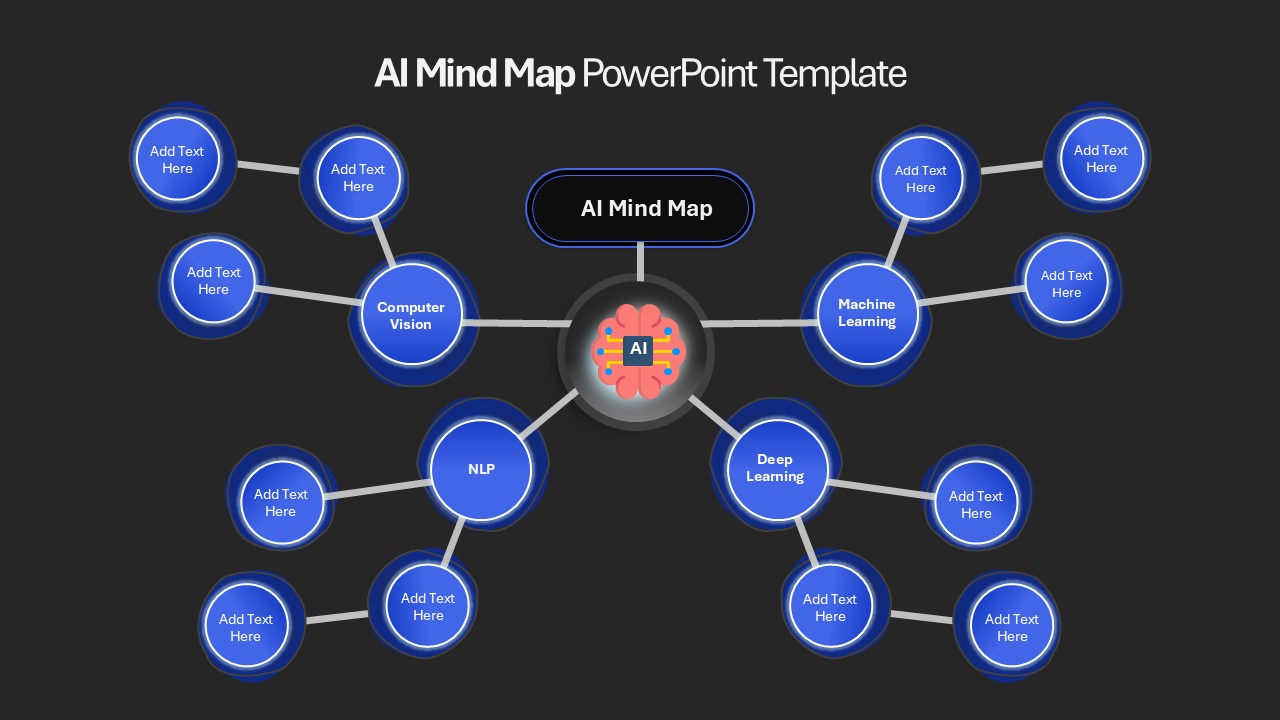
AI Mind Map & Hub-and-Spoke Diagram Template for PowerPoint & Google Slides
Mind Maps
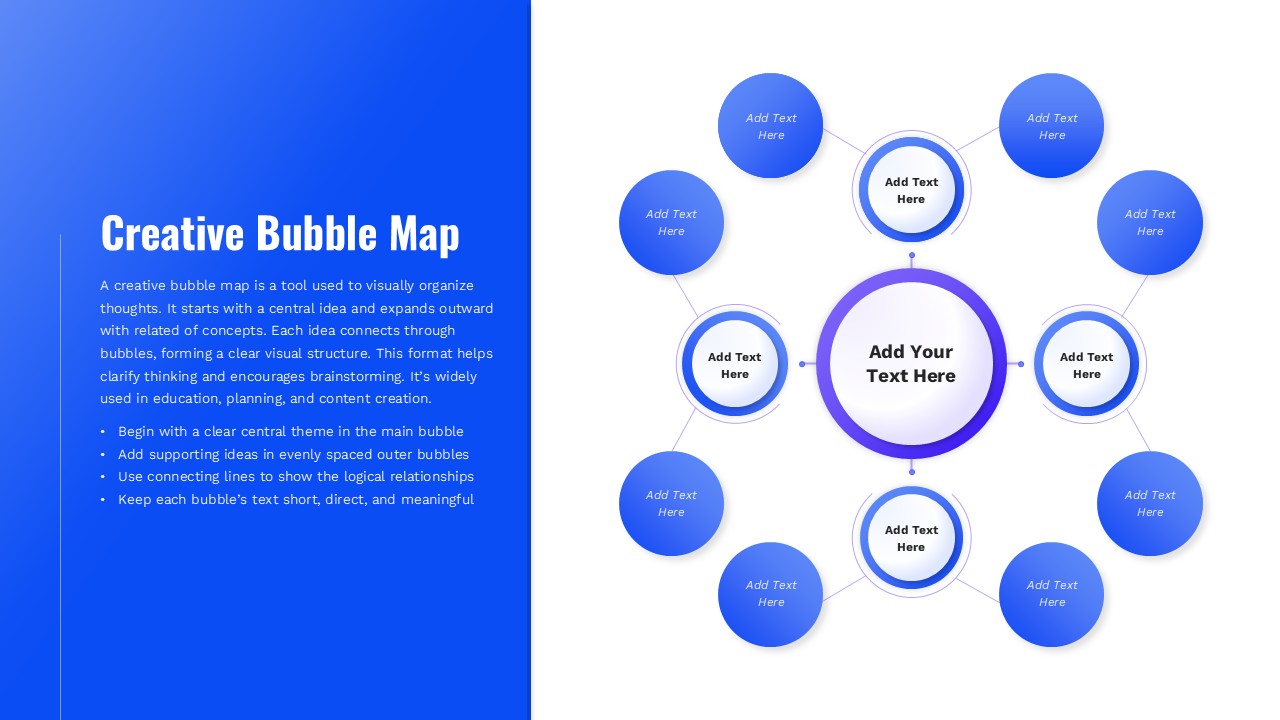
Creative Bubble Mind Map Template for PowerPoint & Google Slides
Mind Maps
Five-Branch Mind Mapping Diagram template for PowerPoint & Google Slides
Mind Maps
Social Media Mind Network Infographic Template for PowerPoint & Google Slides
Digital Marketing
Mind Mapping Hub and Spoke Diagram Template for PowerPoint & Google Slides
Mind Maps
Mind Mapping Hub and Spoke Diagram Template for PowerPoint & Google Slides
Mind Maps
Creative Mind Mapping Diagram with Icons Template for PowerPoint & Google Slides
Mind Maps
Mind Mapping Template for PowerPoint & Google Slides
Mind Maps
Mind Mapping Template for PowerPoint & Google Slides
Mind Maps
Creative Mind Mapping Template for PowerPoint & Google Slides
Mind Maps
Editable Colombia Map PowerPoint Template for PowerPoint & Google Slides
Business Models
Creative World Map template for PowerPoint & Google Slides
World Maps
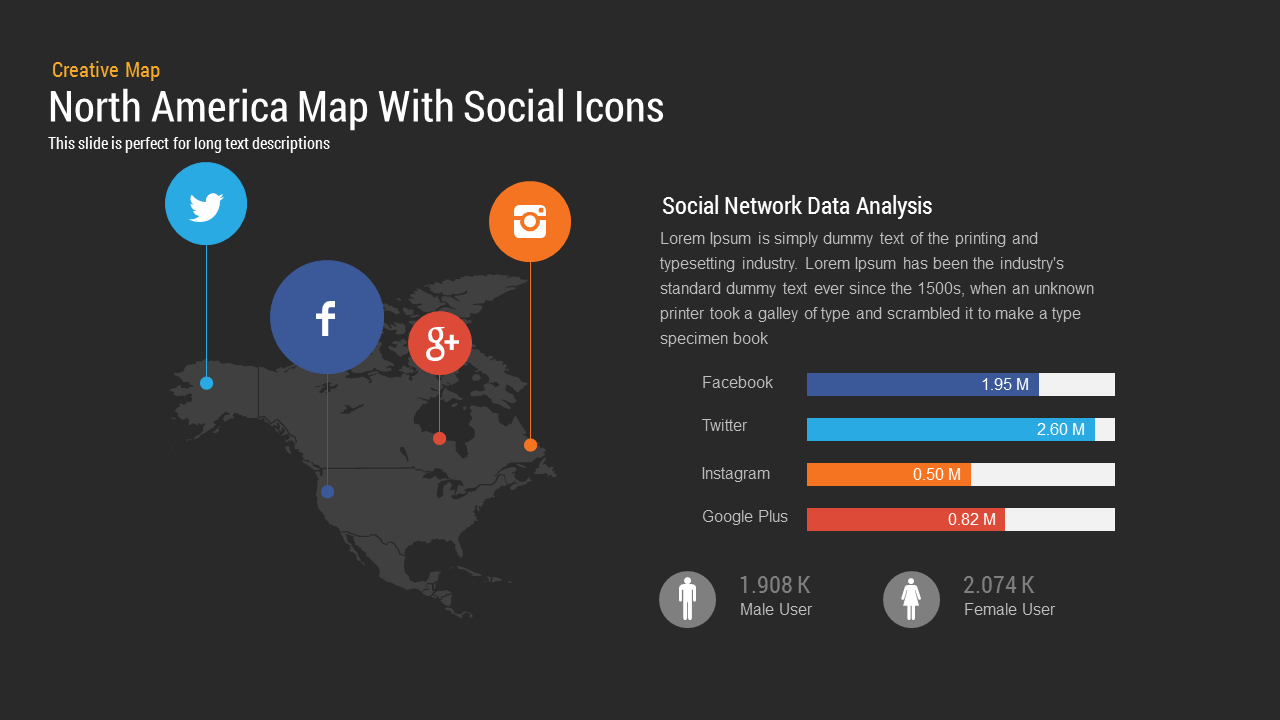
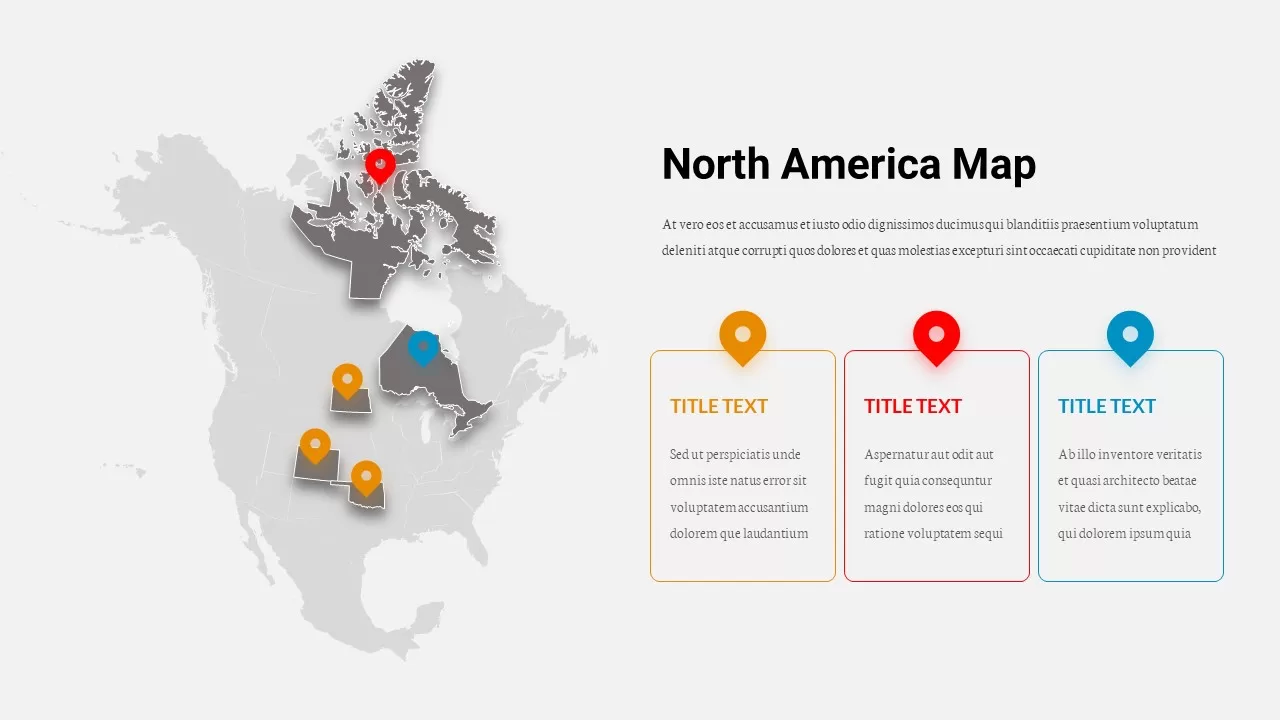
North America Map template for PowerPoint & Google Slides
World Maps
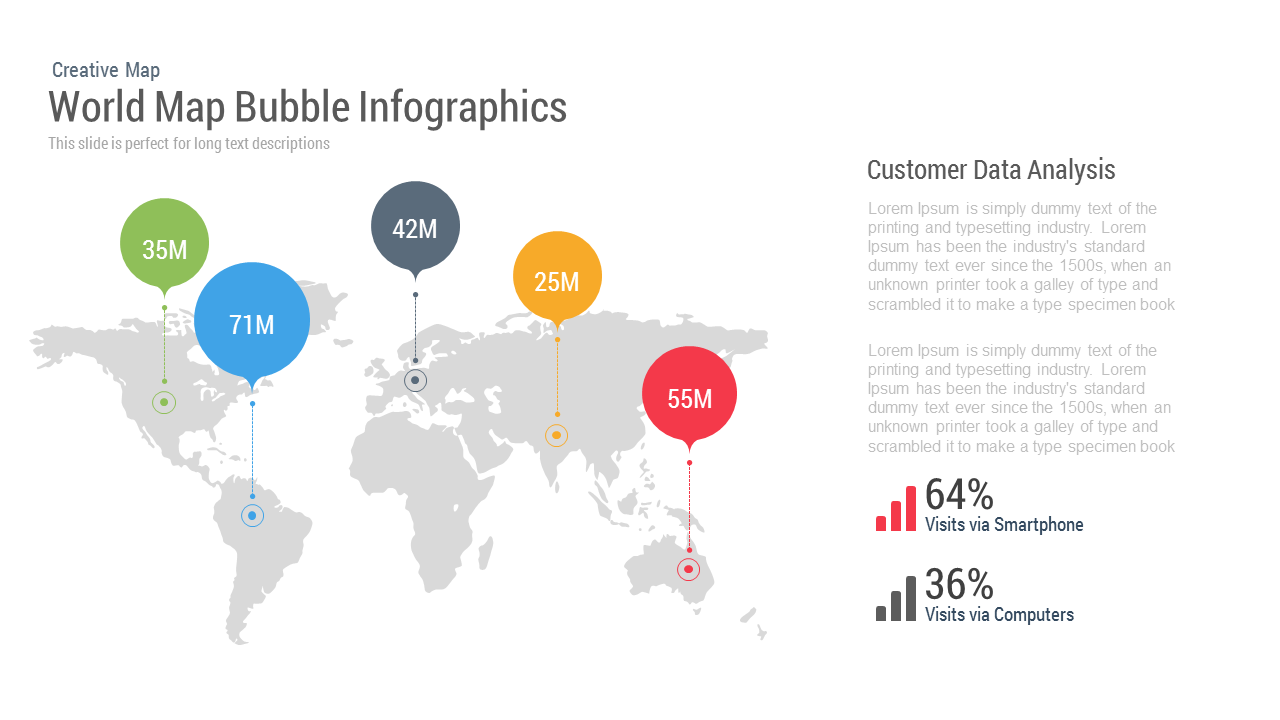
World Map Bubble template for PowerPoint & Google Slides
World Maps

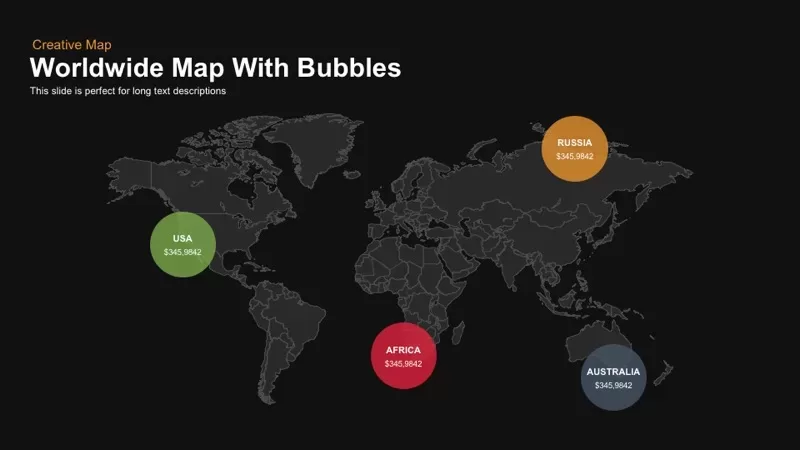
Worldwide Map with Bubbles template for PowerPoint & Google Slides
World Maps
Interactive US Population Data Map Slide Template for PowerPoint & Google Slides
World Maps
Asia Map with KPI Metrics and Legend Template for PowerPoint & Google Slides
World Maps
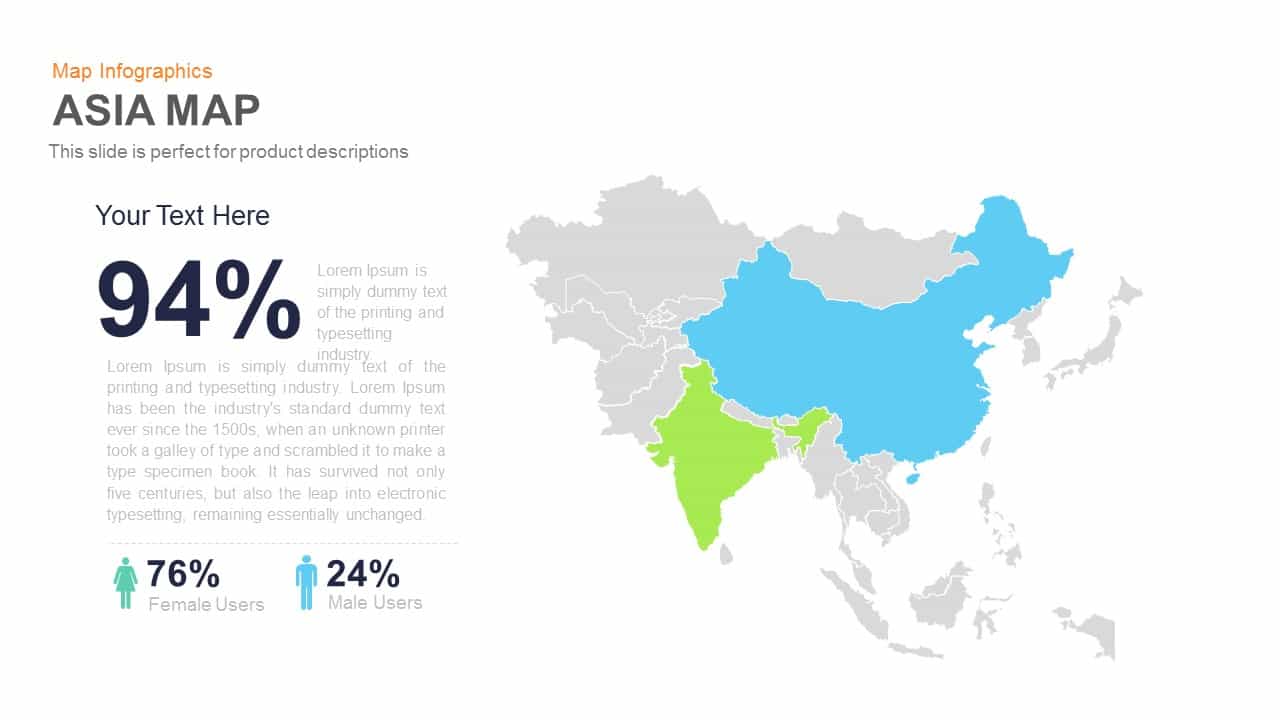
Asia Map Infographic with Demographics template for PowerPoint & Google Slides
World Maps
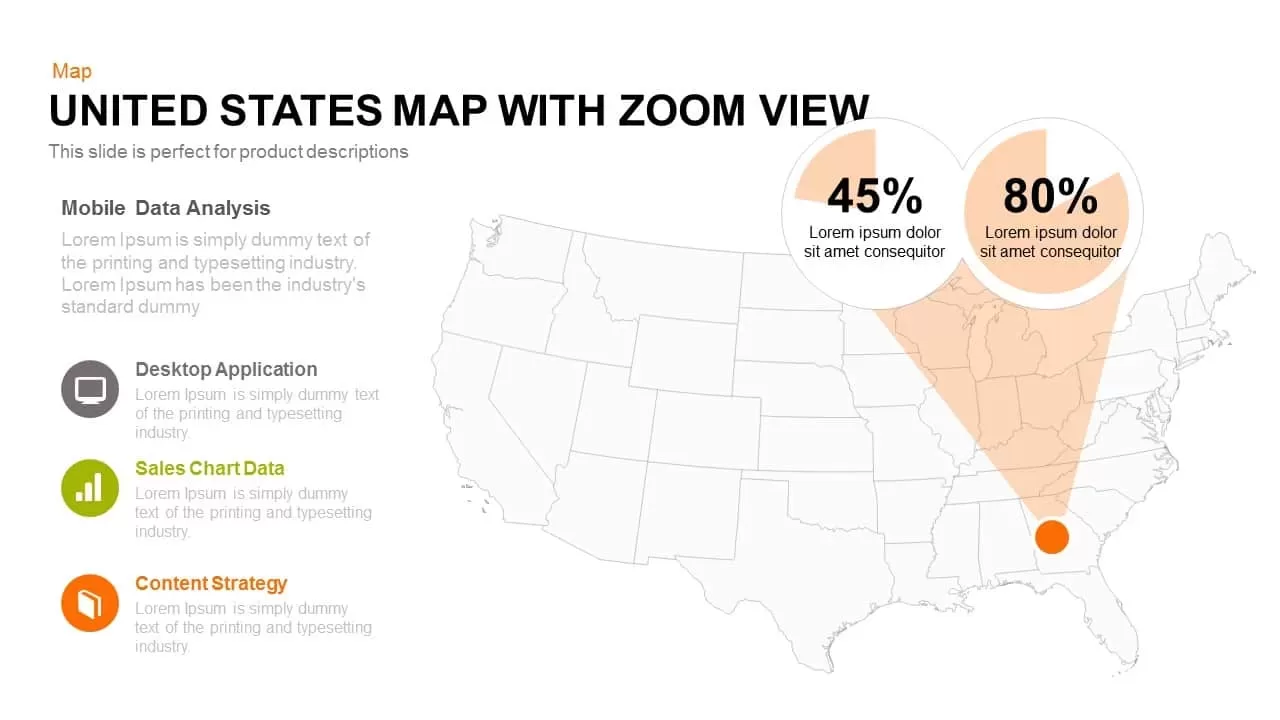
United States Map with Zoom View template for PowerPoint & Google Slides
World Maps
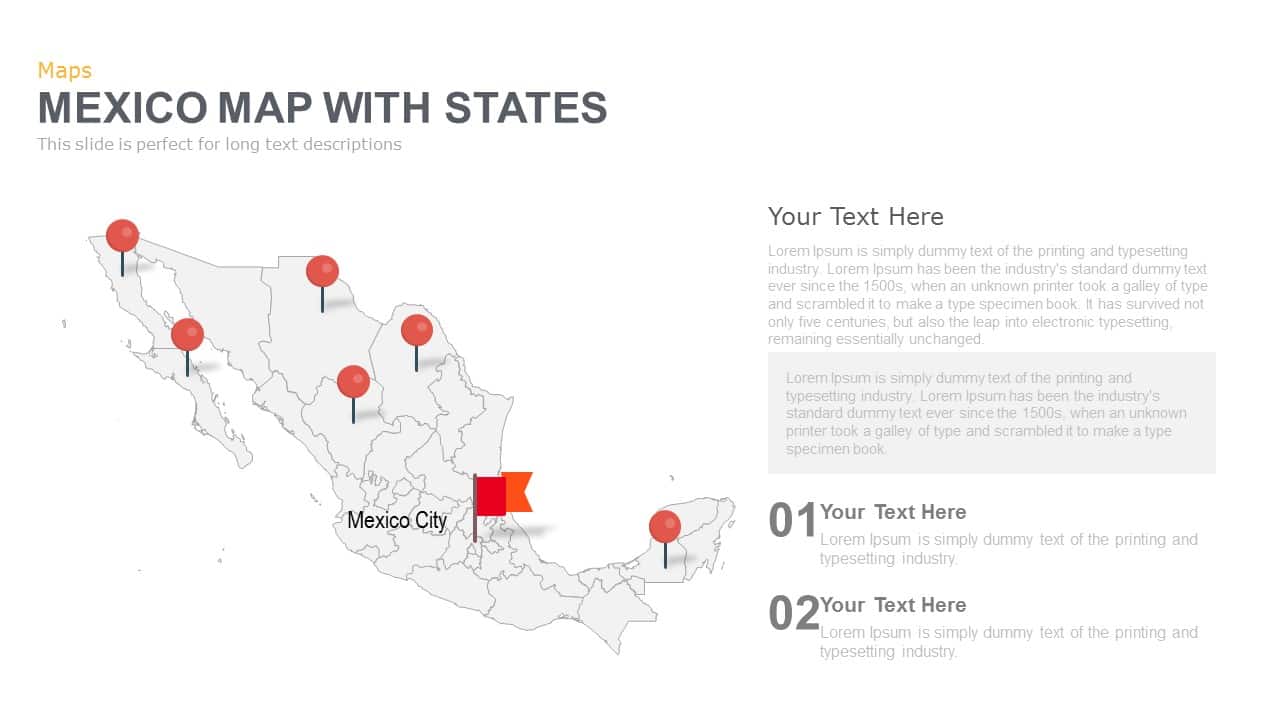
Mexico Map With States Template for PowerPoint & Google Slides
World Maps
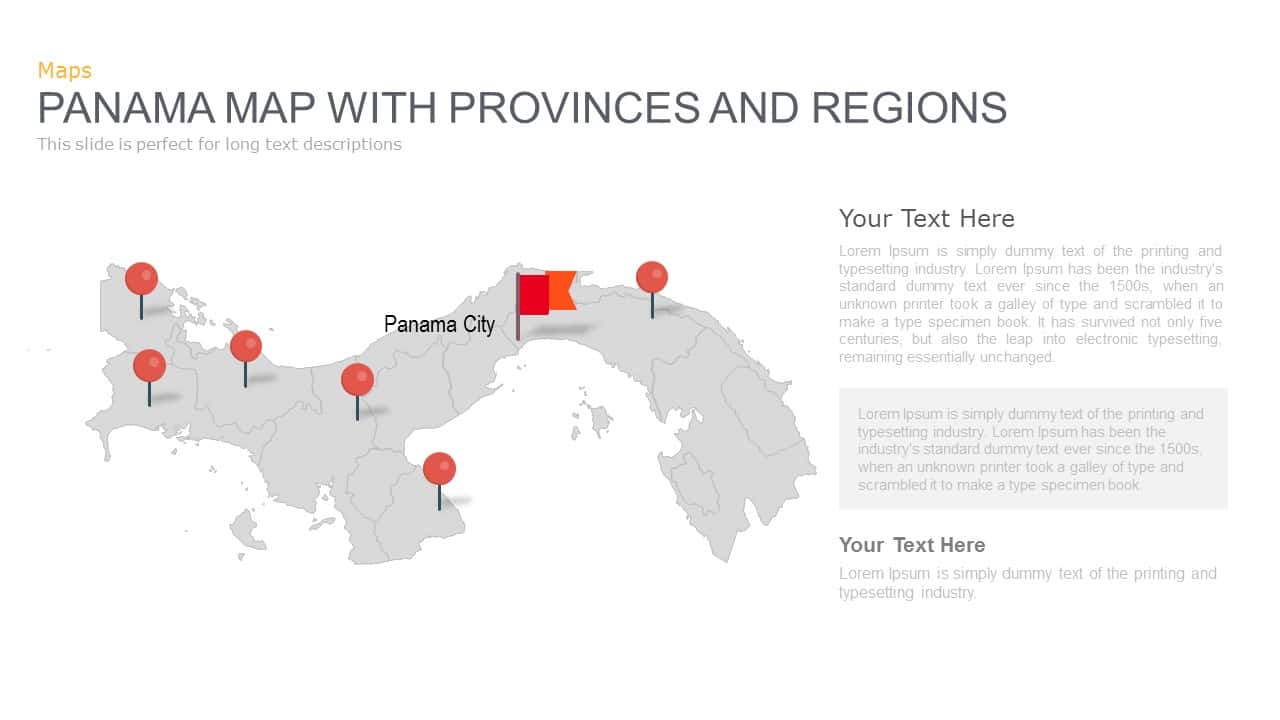
Panama Map with Region Markers Template for PowerPoint & Google Slides
World Maps
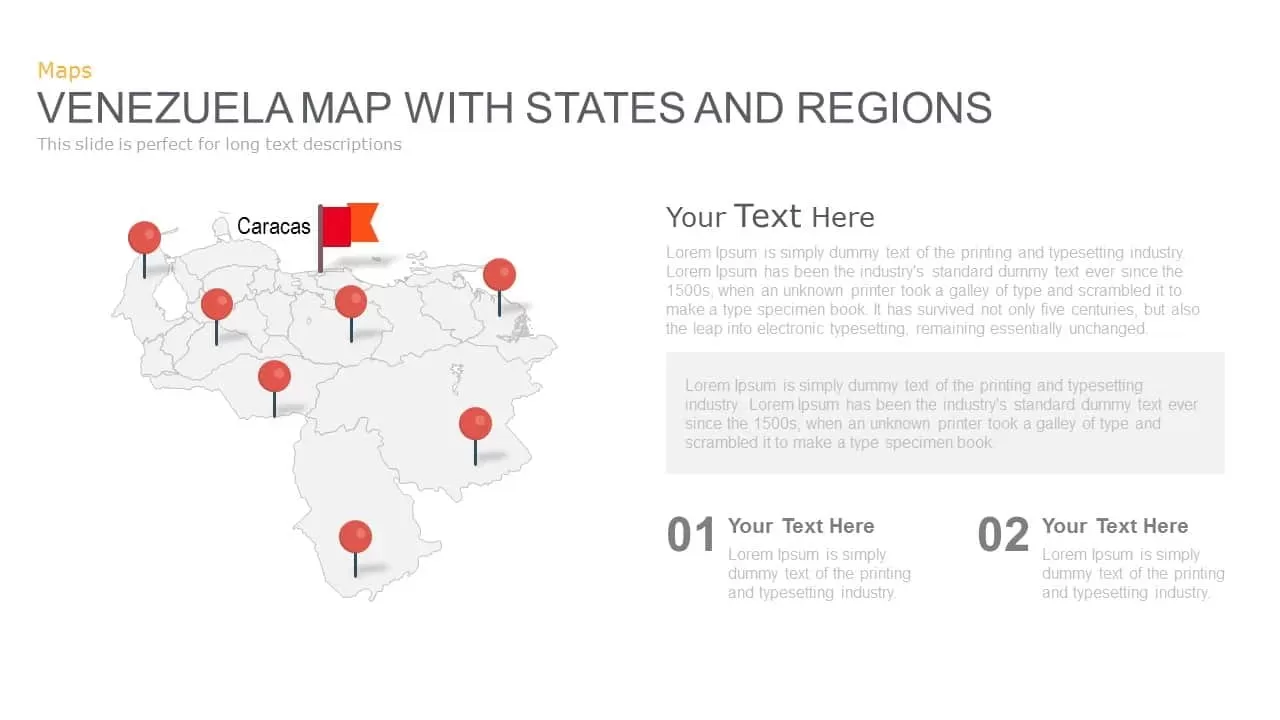
Venezuela Map with States and Regions Template for PowerPoint & Google Slides
World Maps
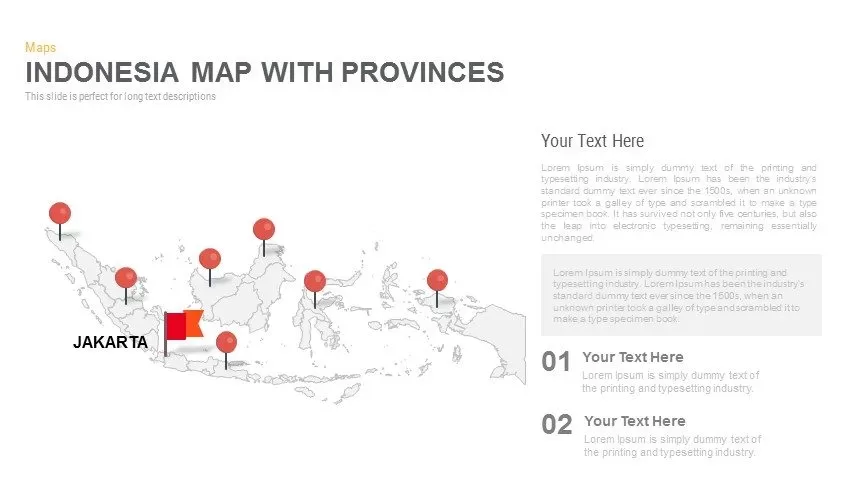
Indonesia Province Map Callout Slide Template for PowerPoint & Google Slides
Maps
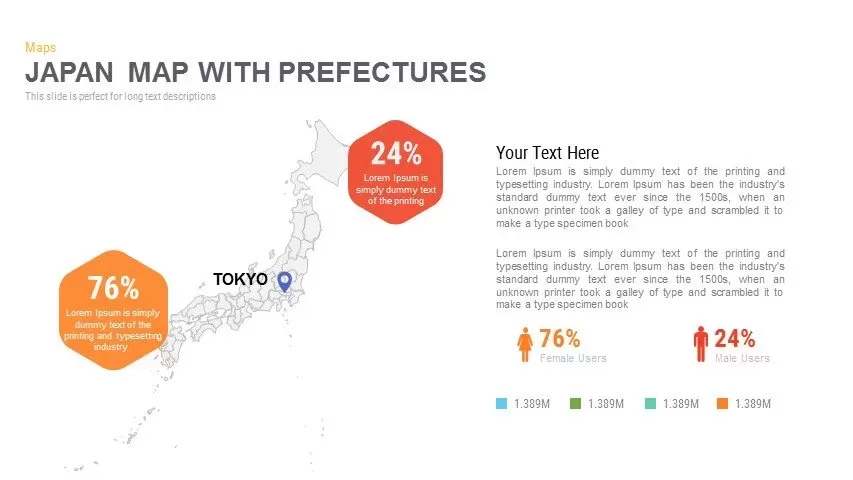
Japan Province Map Infographic Template for PowerPoint & Google Slides
Maps
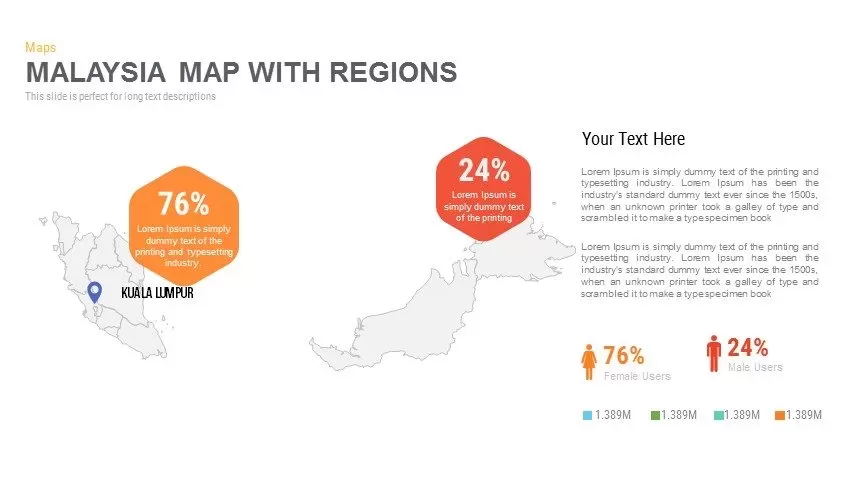
Malaysia Regional Map Infographic Template for PowerPoint & Google Slides
Maps
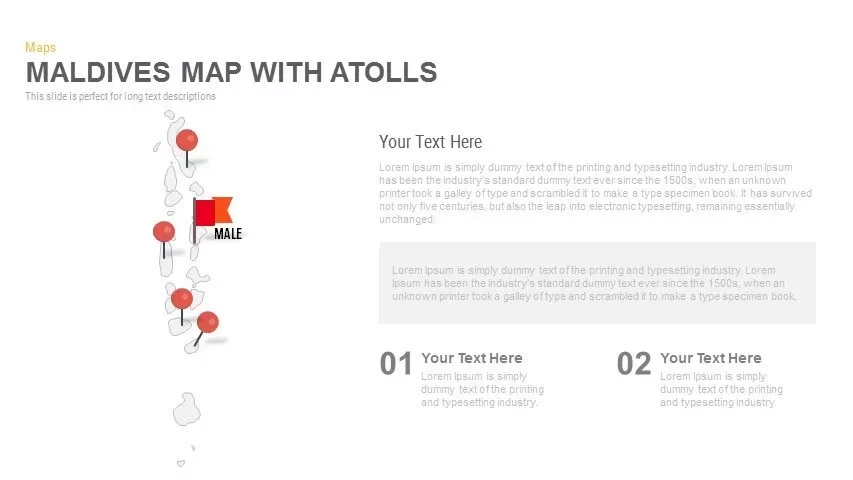
Maldives Map Infographic Template for PowerPoint & Google Slides
Maps
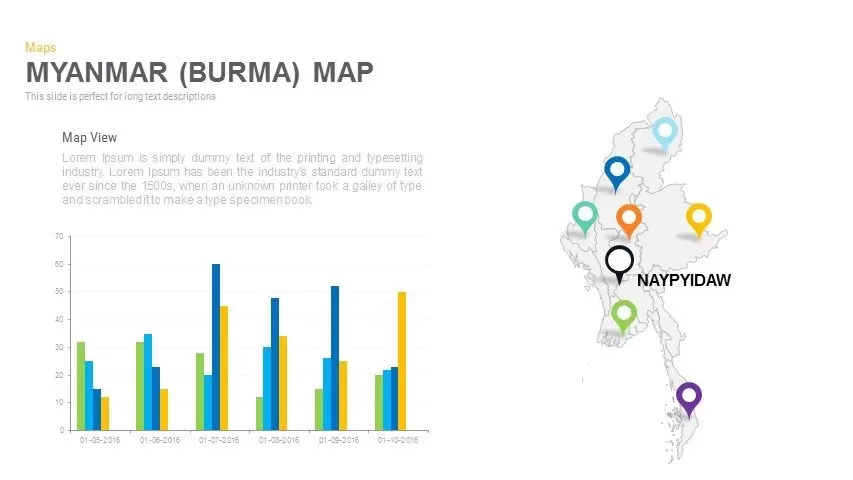
Myanmar (Burma) Provincial Map Infographic Template for PowerPoint & Google Slides
Maps
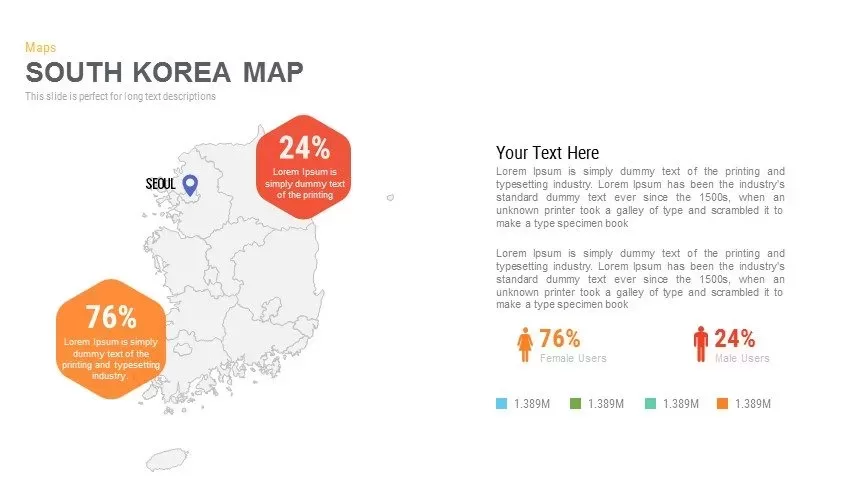
Infographic South Korea Map Template for PowerPoint & Google Slides
Maps
Sri Lanka Map Infographic Pack Template for PowerPoint & Google Slides
Maps
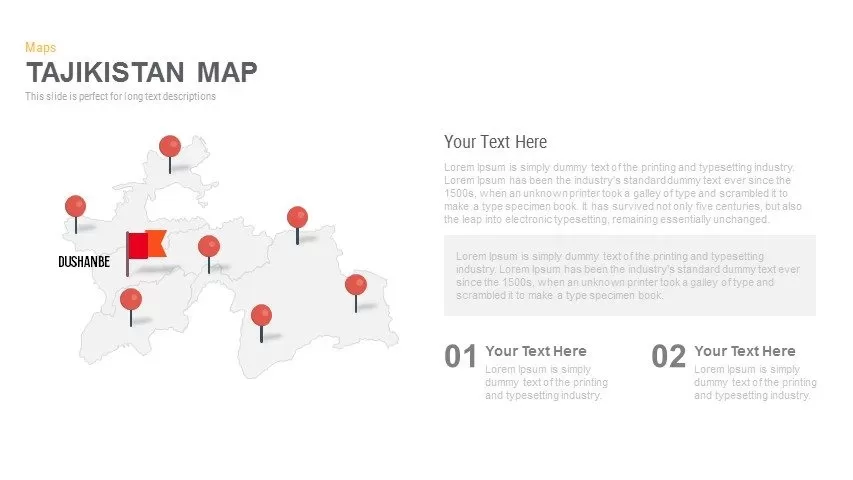
Editable Tajikistan Provinces Map Pack Template for PowerPoint & Google Slides
Maps
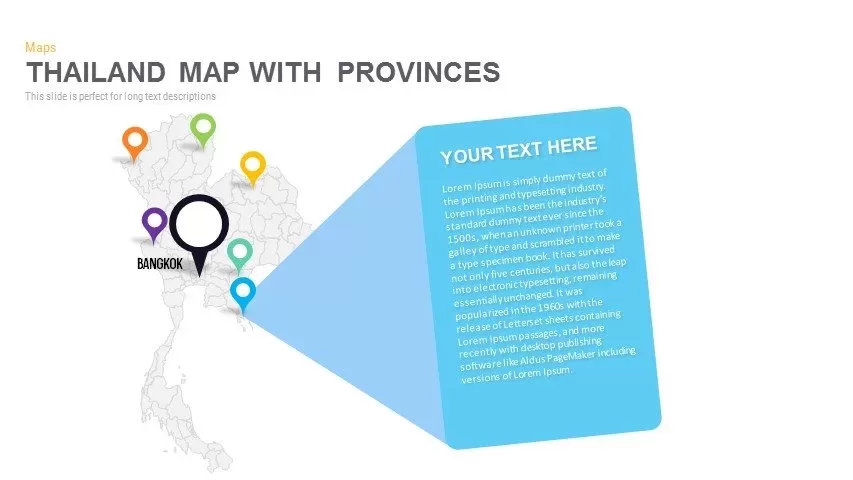
Thailand Provinces Map Infographic Pack Template for PowerPoint & Google Slides
Maps
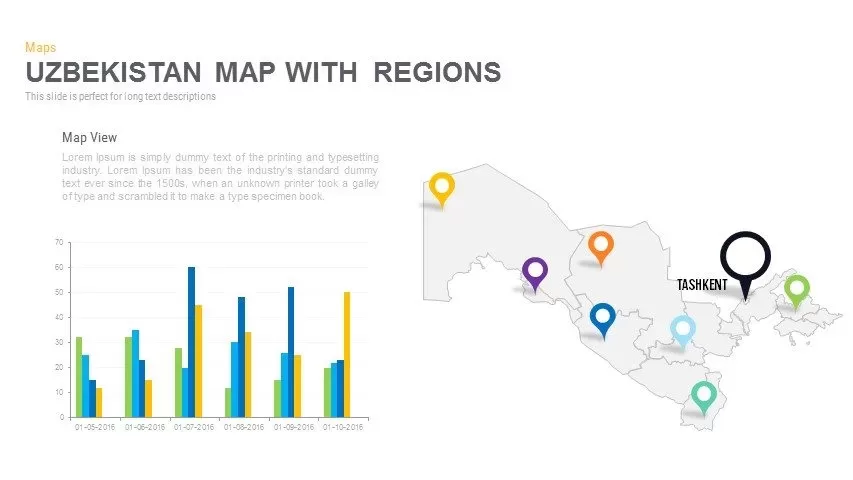
Uzbekistan Map with Regions Pack Template for PowerPoint & Google Slides
Maps
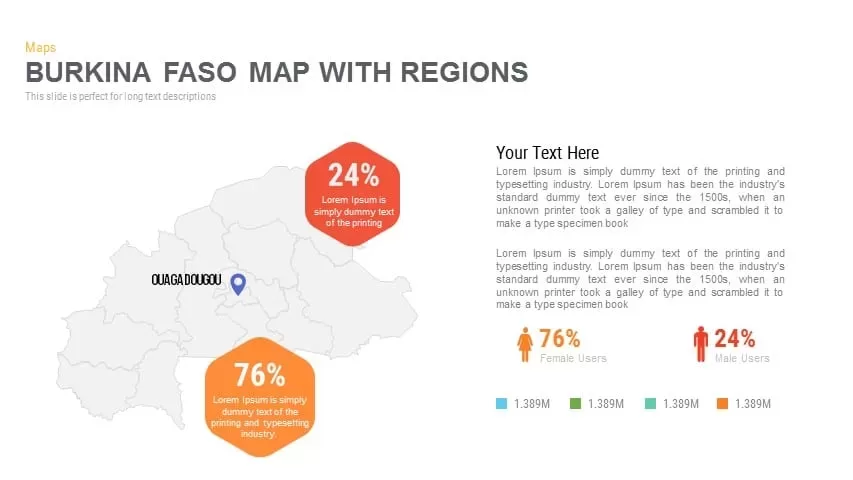
Burkina Faso Map with Regions Slide Pack Template for PowerPoint & Google Slides
World Maps
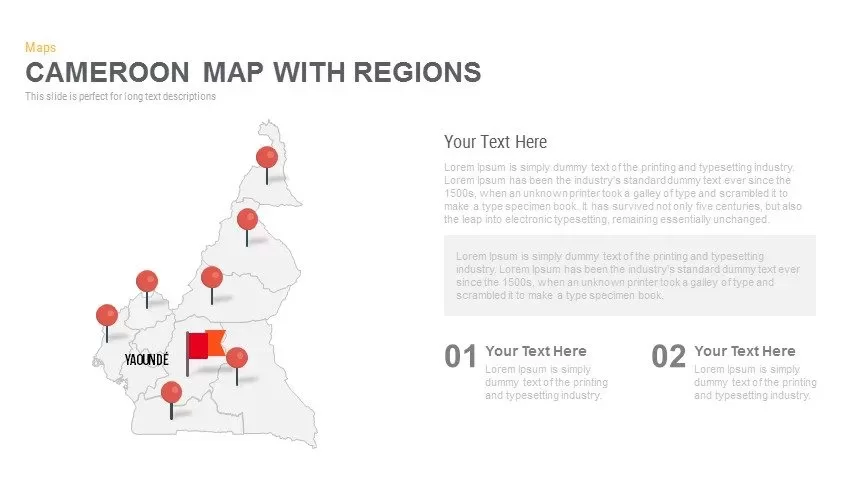
Cameroon Map with Regions Slide Pack Template for PowerPoint & Google Slides
World Maps
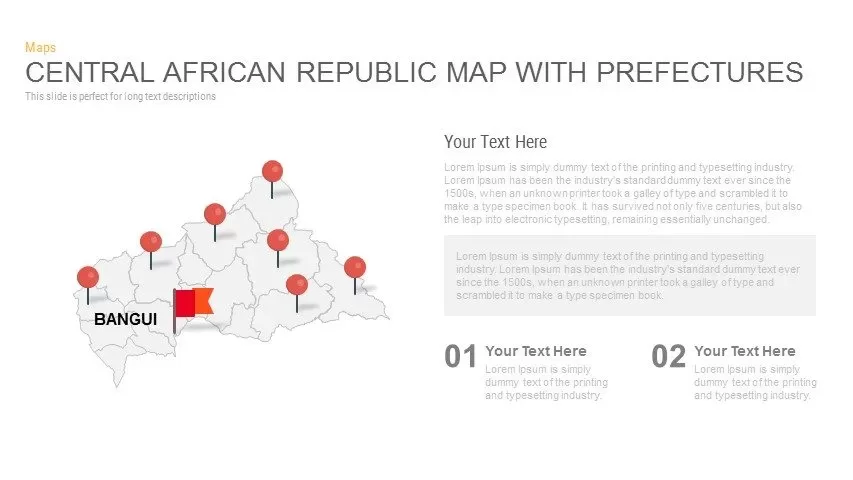
Central African Republic Prefectures Map Template for PowerPoint & Google Slides
World Maps
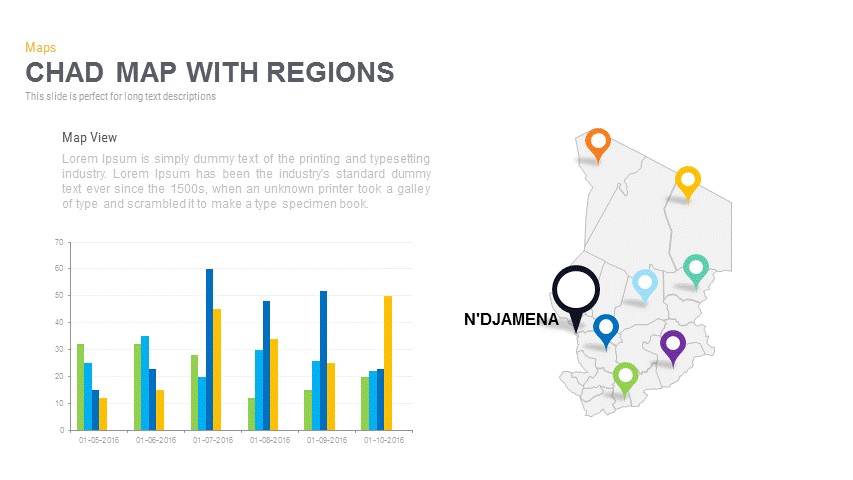
Chad Map with Regions Slide Pack Template for PowerPoint & Google Slides
World Maps
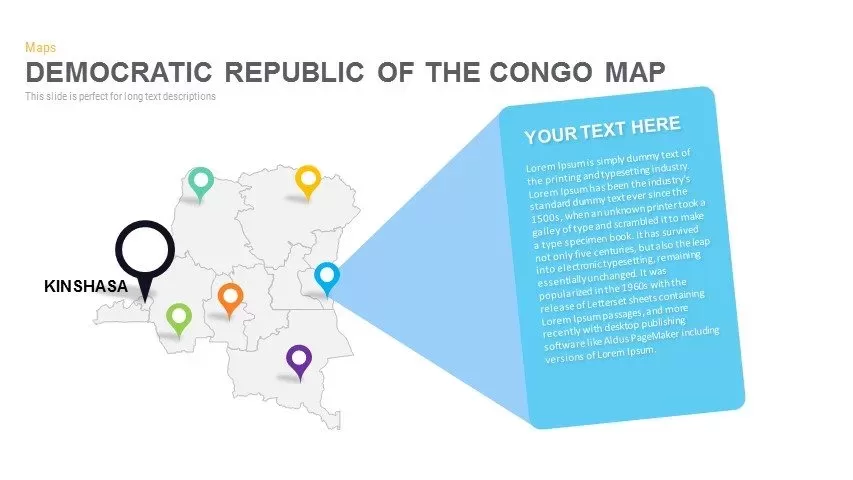
DR Congo Prefecture Map Slide Pack Template for PowerPoint & Google Slides
World Maps

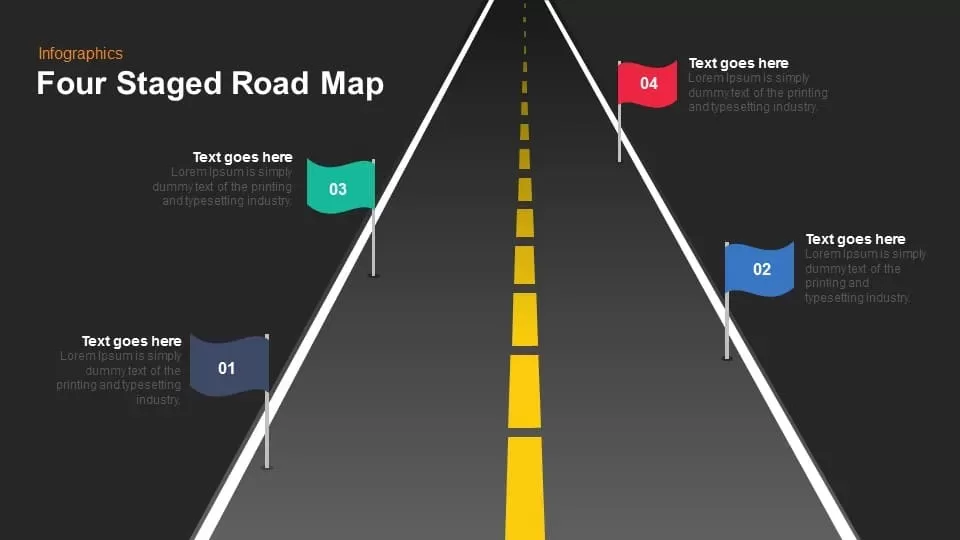
Four Staged Road Map template for PowerPoint & Google Slides
Roadmap

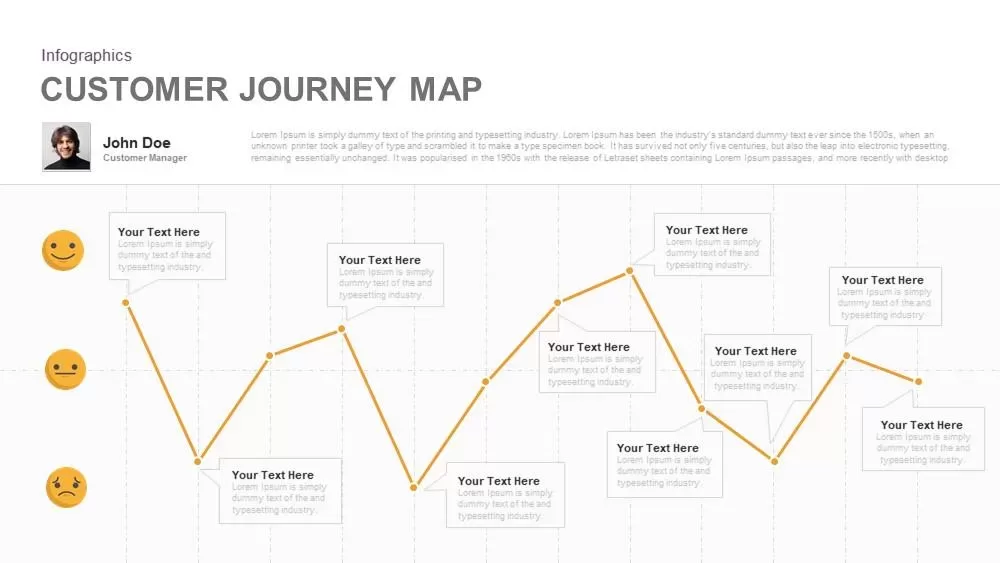
Emotional Customer Journey Map Template for PowerPoint & Google Slides
Customer Journey
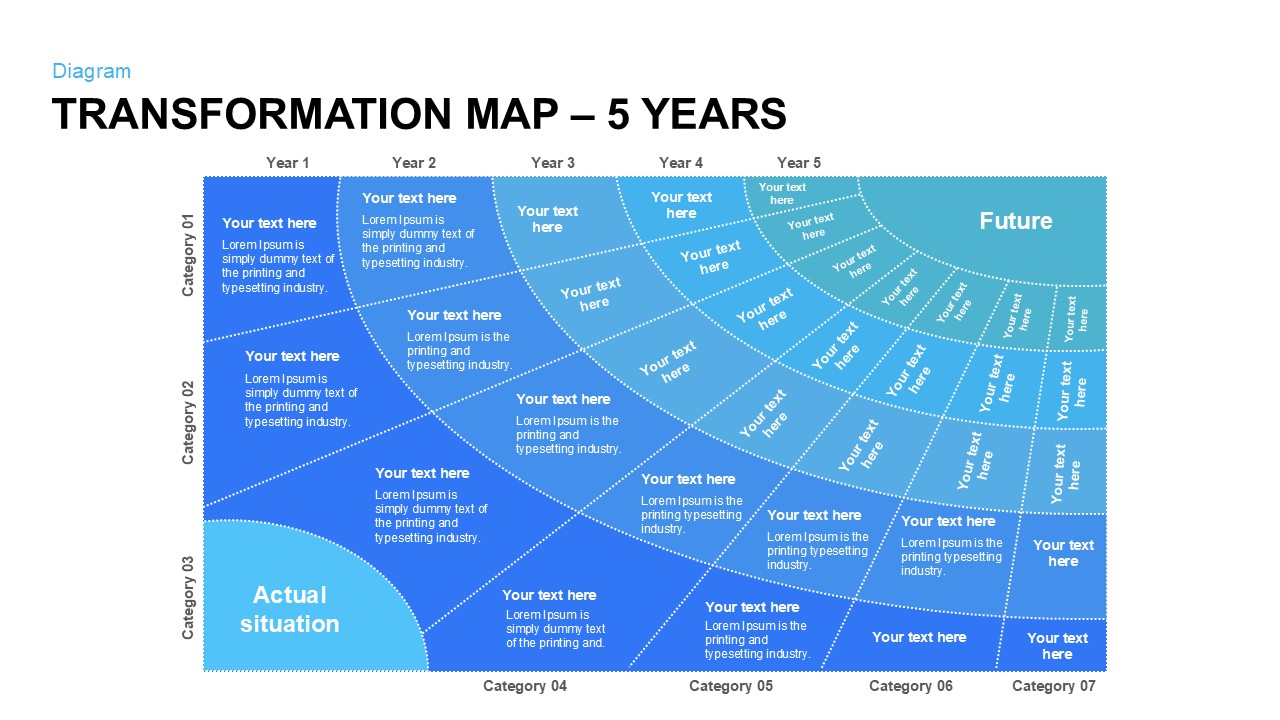
Five-Year Transformation Map Diagram Template for PowerPoint & Google Slides
Process
Interactive Empathy Map Diagram Template for PowerPoint & Google Slides
Process
Fully Editable World Map Infographic Template for PowerPoint & Google Slides
World Maps
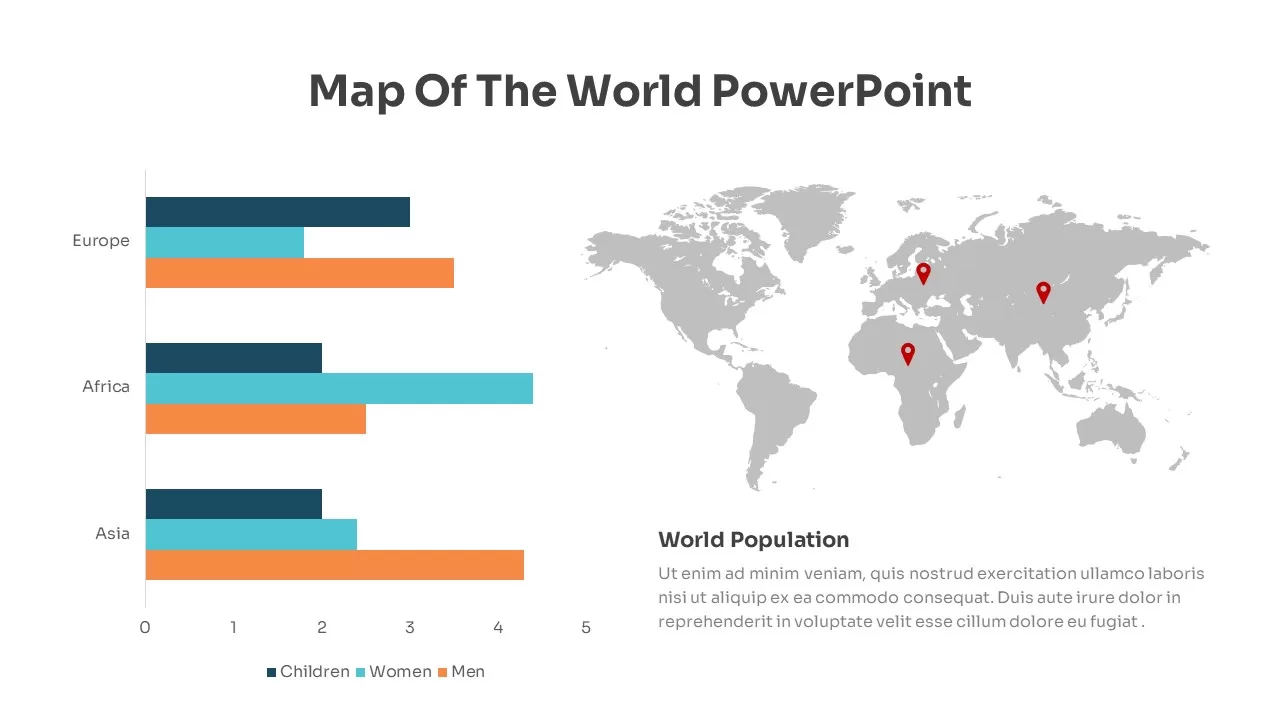
Global Population Demographics & Map Template for PowerPoint & Google Slides
Bar/Column
World Map Without Names Template for PowerPoint & Google Slides
World Maps
North America Percentage Map Infographic Template for PowerPoint & Google Slides
World Maps
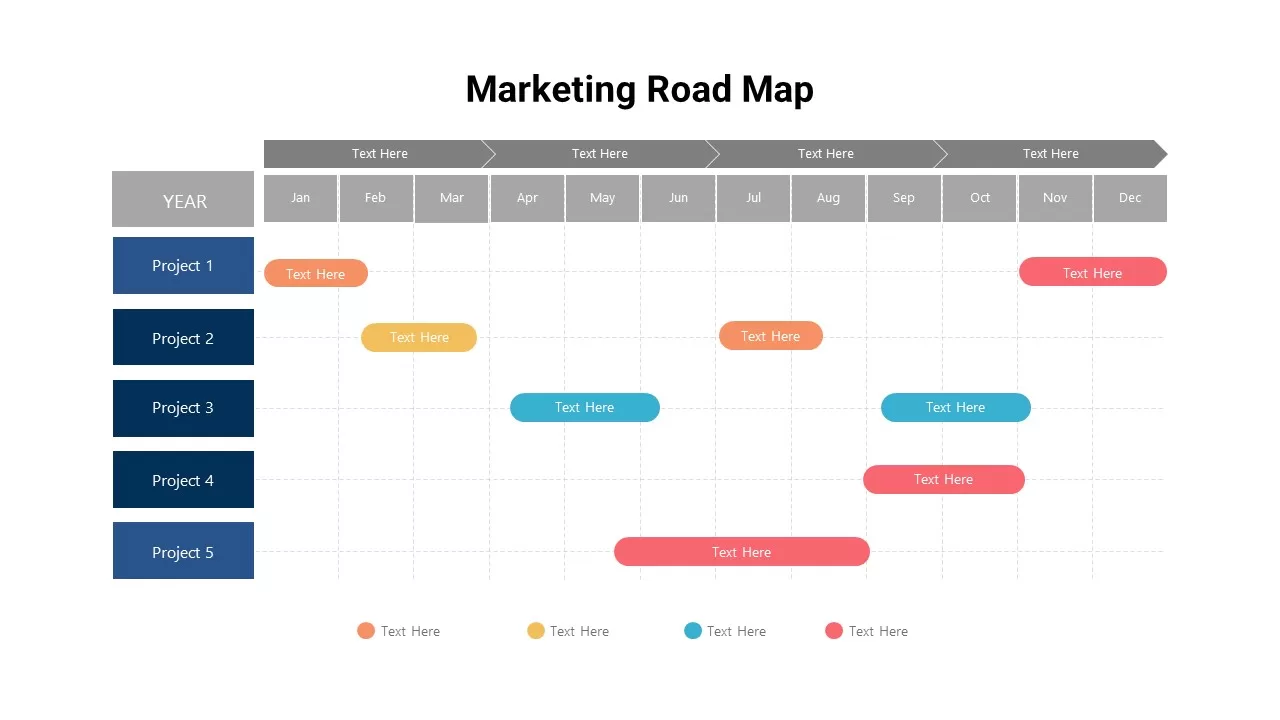
Detailed Marketing Road Map Timeline Template for PowerPoint & Google Slides
Timeline
North America Location Pin Map Overview Template for PowerPoint & Google Slides
World Maps
Marketing Projects Road Map Timeline Template for PowerPoint & Google Slides
Roadmap
North America Data Map Callouts Template for PowerPoint & Google Slides
World Maps
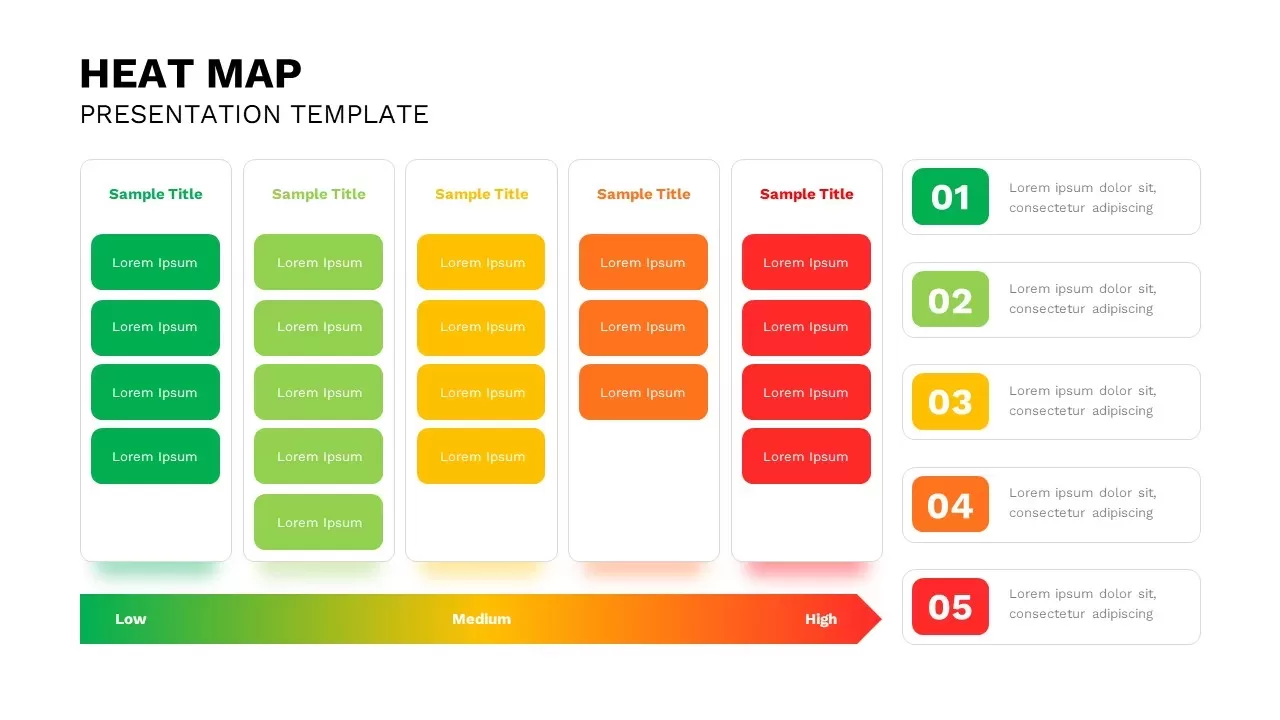
Heat Map Analysis Template for PowerPoint & Google Slides
Risk Management
Interactive Heat Map Template for PowerPoint & Google Slides
Bar/Column
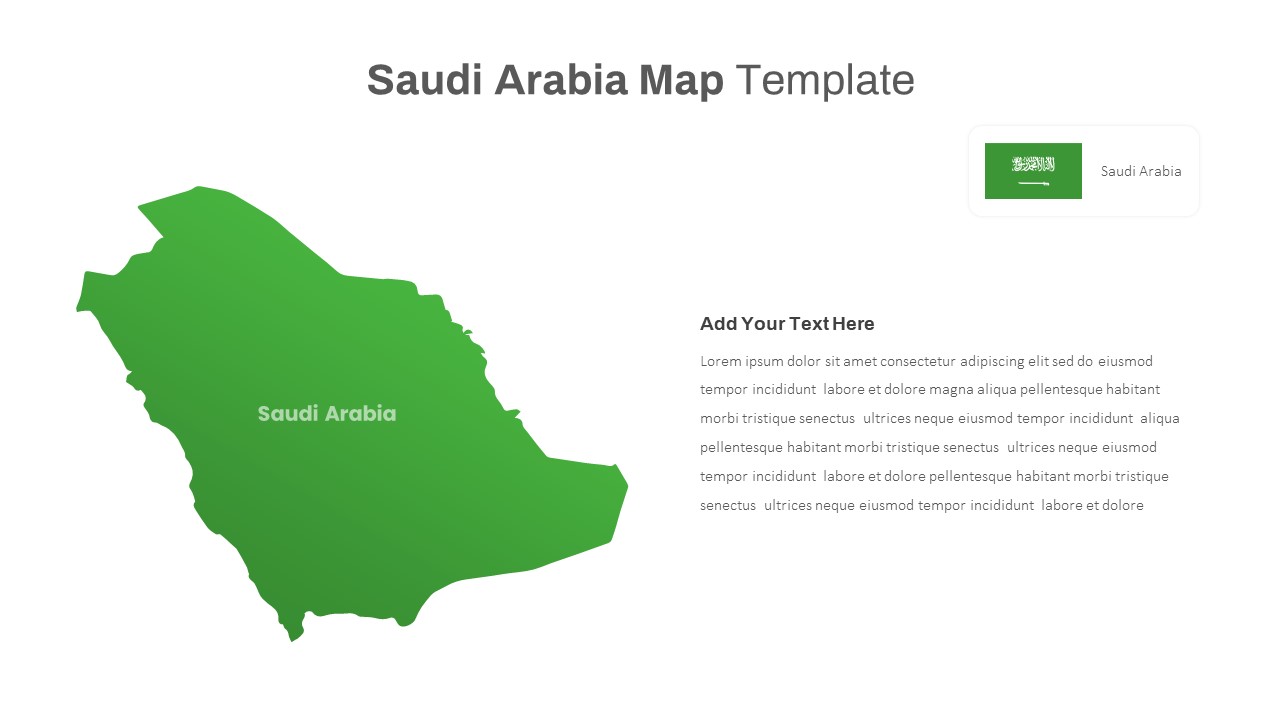
Free Editable Saudi Arabia Map Template for PowerPoint & Google Slides
World Maps
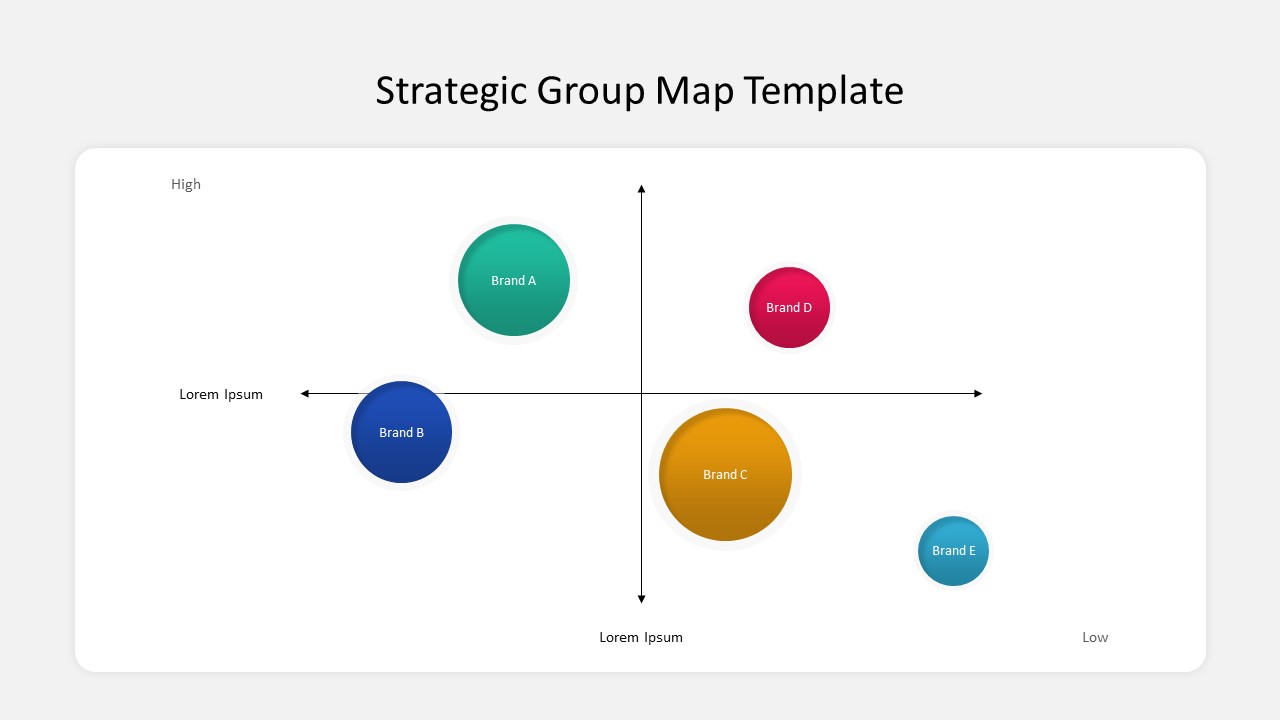
Business Strategic Group Map Analysis Template for PowerPoint & Google Slides
Competitor Analysis
Free
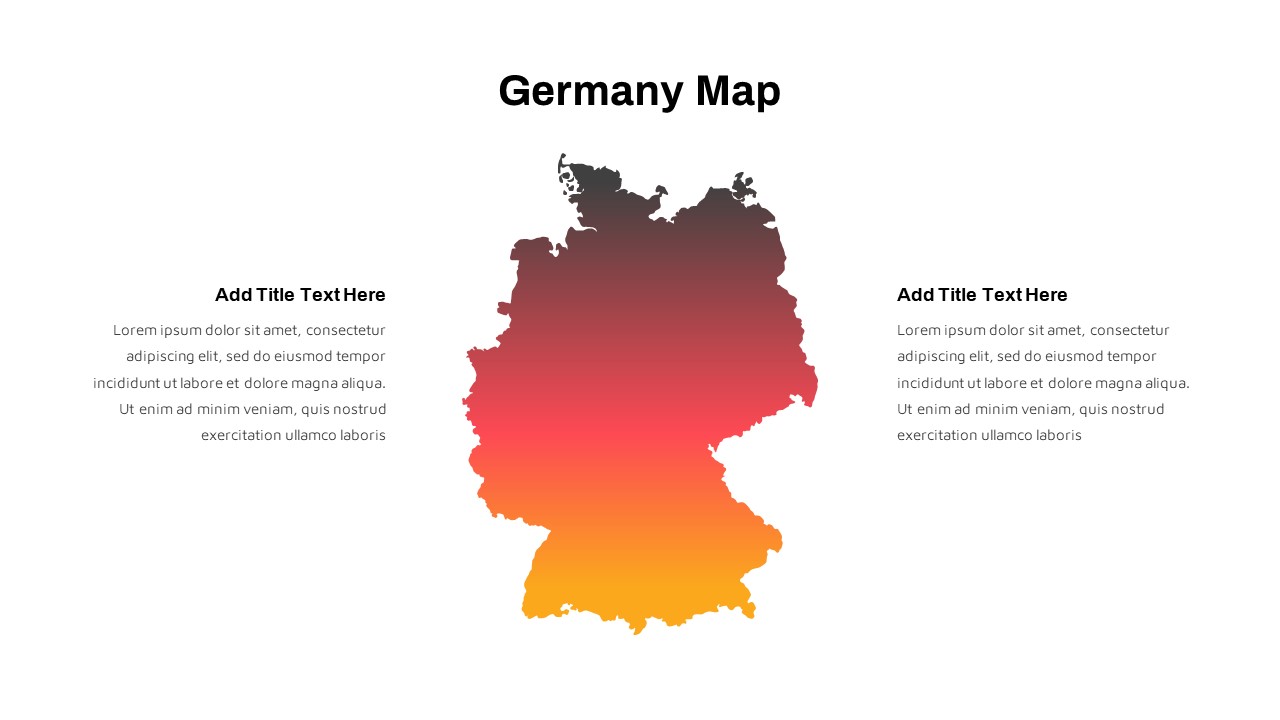
Germany Map with Regional Callouts Template for PowerPoint & Google Slides
World Maps
Editable Africa Map Infographic Data Template for PowerPoint & Google Slides
World Maps
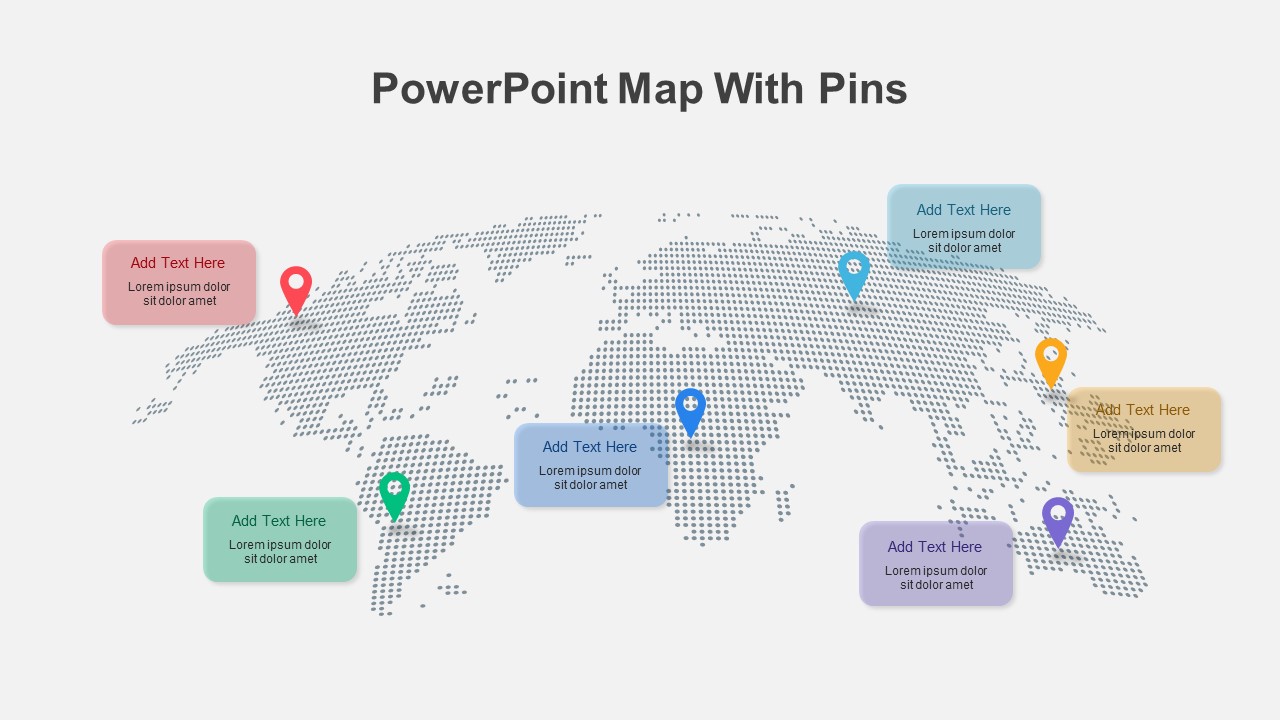
Colorful World Map with Location Pins Template for PowerPoint & Google Slides
World Maps
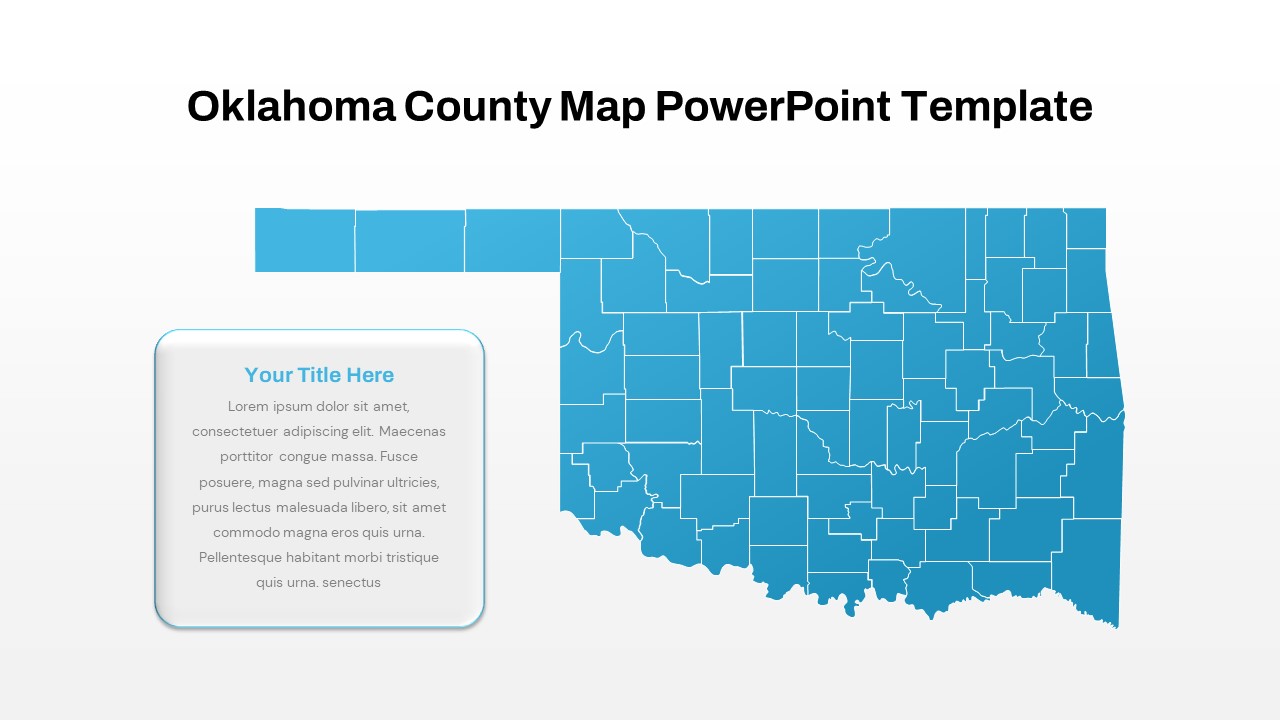
Interactive Oklahoma County Map Template for PowerPoint & Google Slides
World Maps
Kentucky County Map Visualization Template for PowerPoint & Google Slides
World Maps
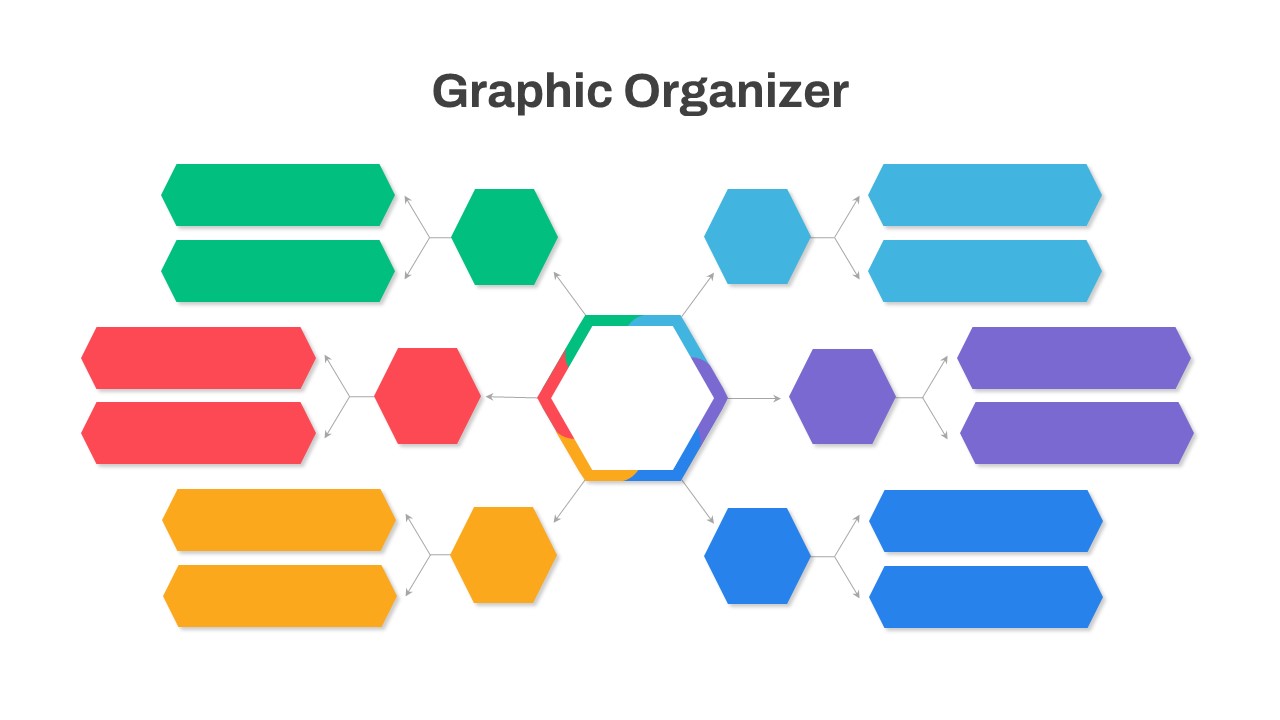
Graphic Organizer & Double Bubble Map Template for PowerPoint & Google Slides
Maps
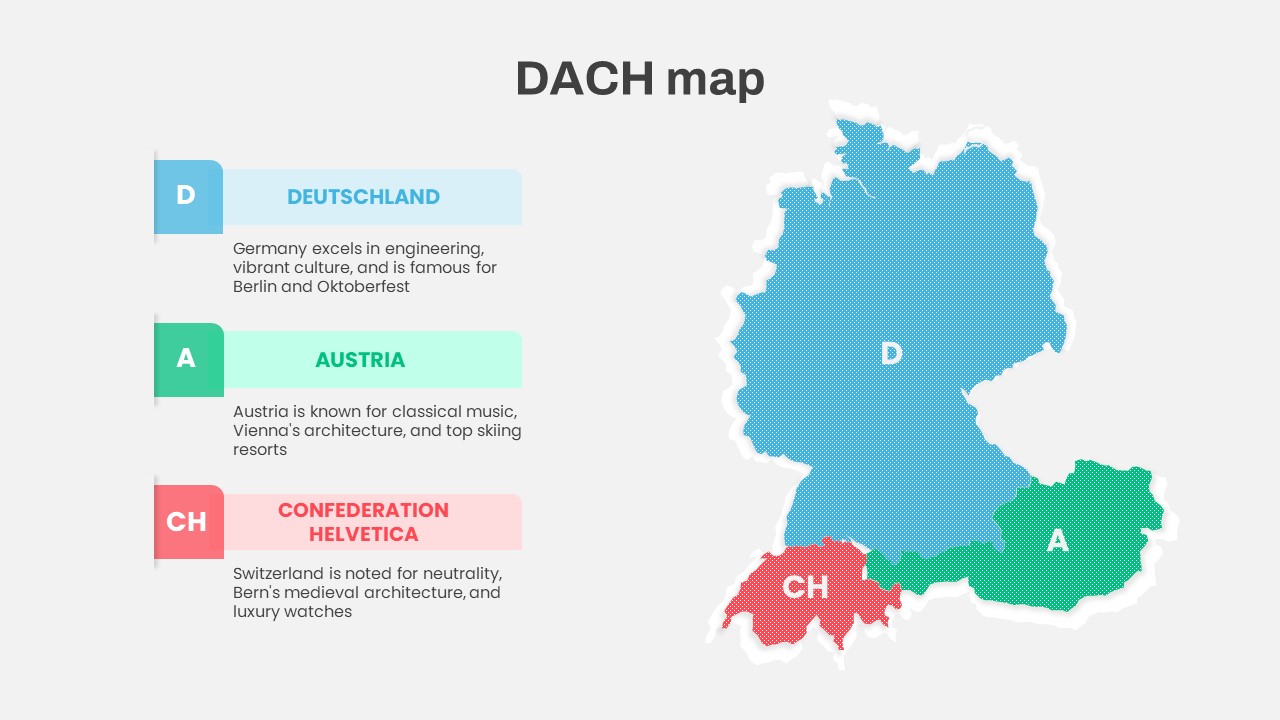
DACH Region Map with Country Highlights Template for PowerPoint & Google Slides
Maps
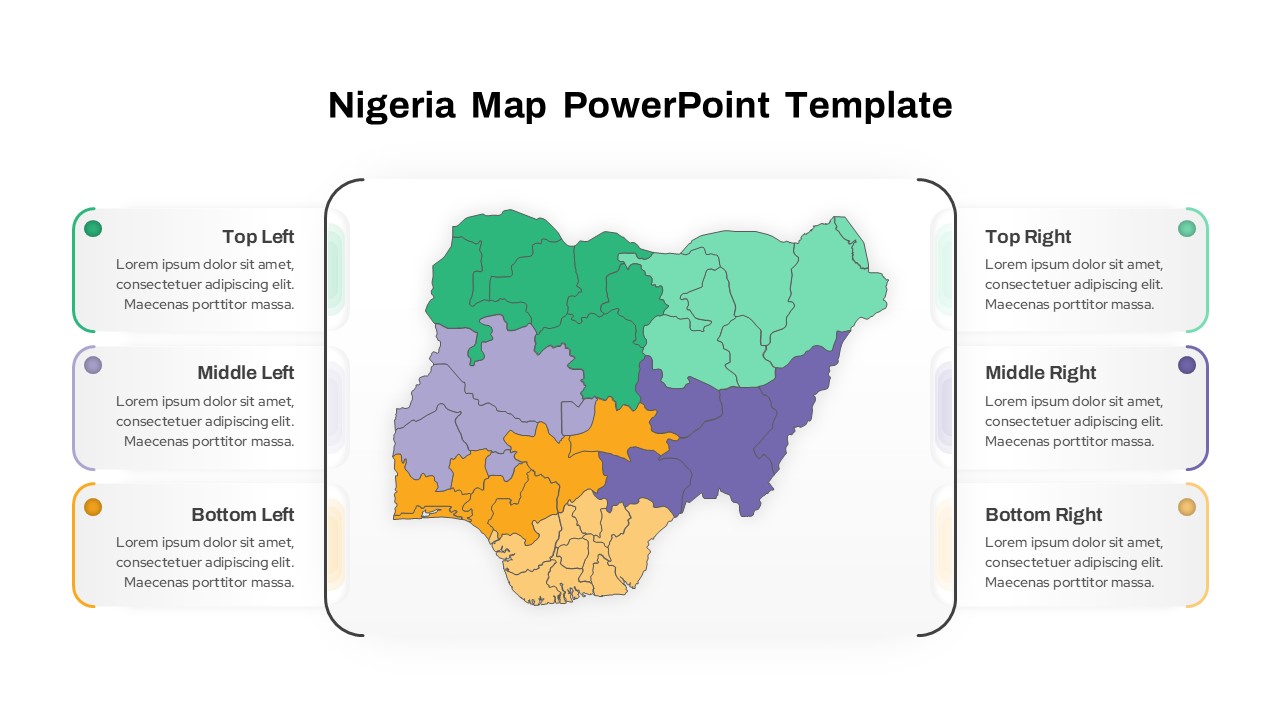
Nigeria Regional Callout Map Diagram Template for PowerPoint & Google Slides
Maps
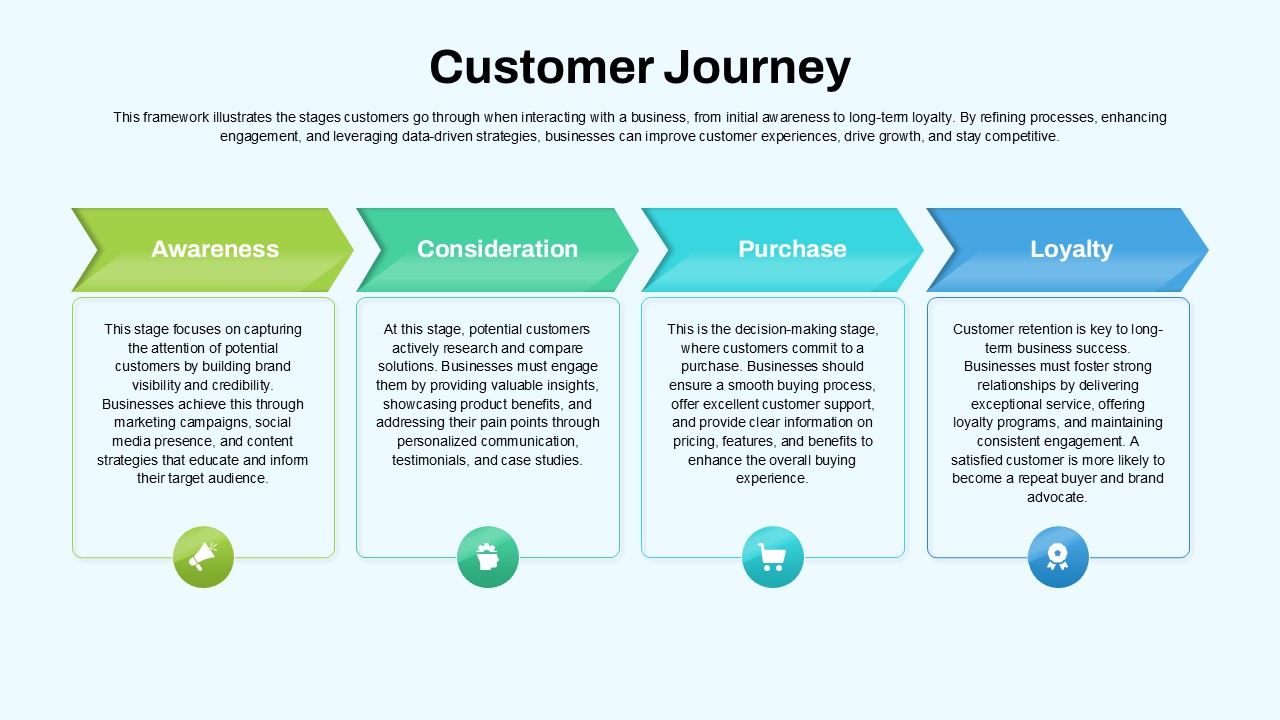
Customer Journey Process Map Infographic Template for PowerPoint & Google Slides
Customer Journey
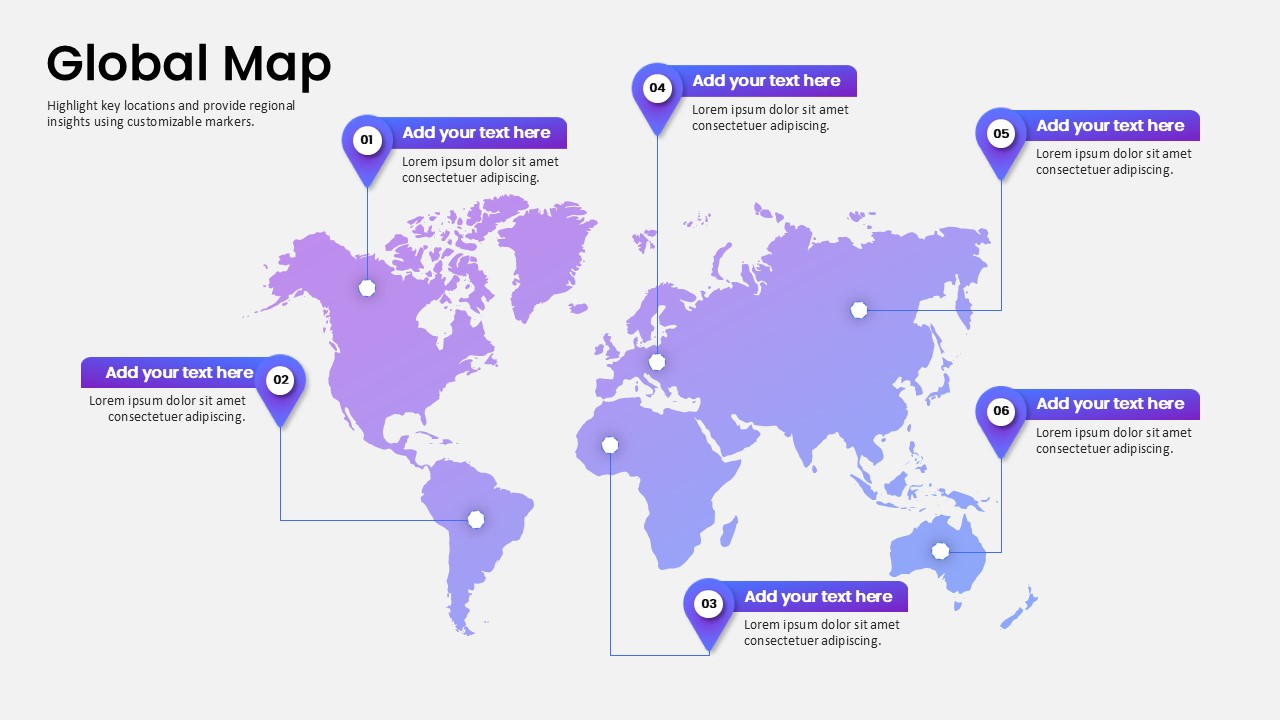
Global Map Highlighting Key Locations template for PowerPoint & Google Slides
World Maps
AI and Data Ecosystem Map Template for PowerPoint & Google Slides
AI
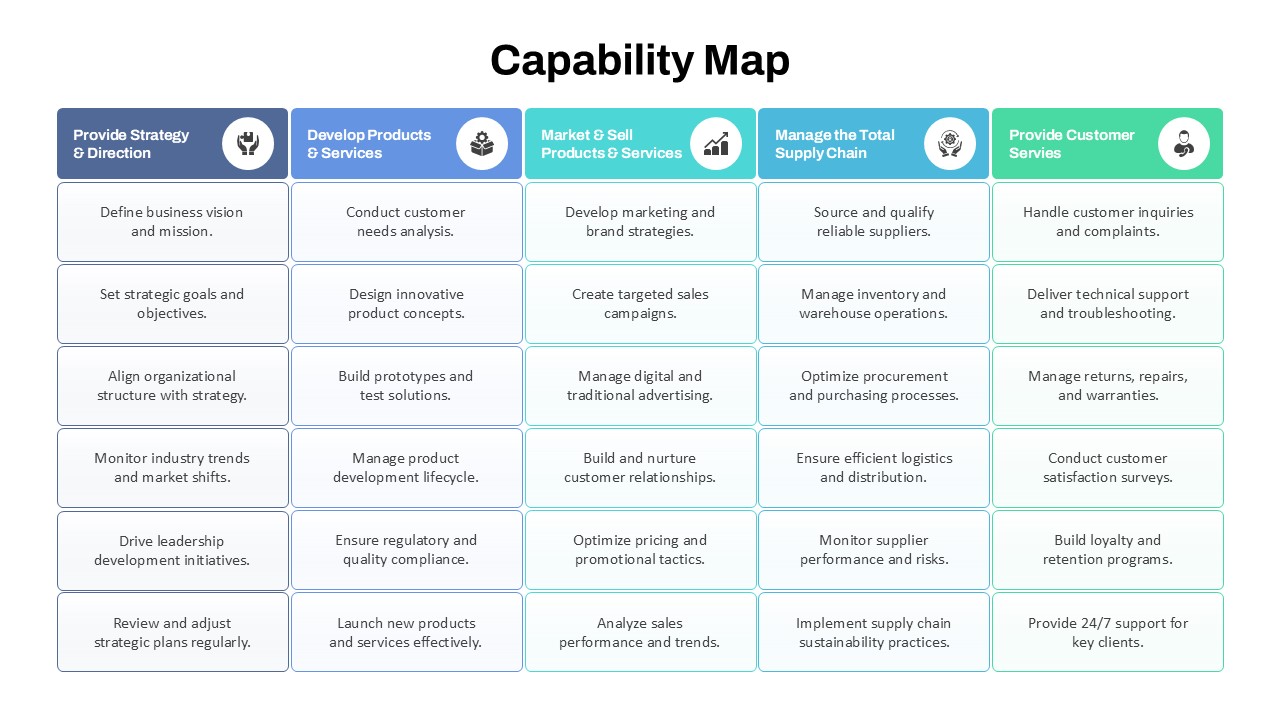
Capability Map Overview Template for PowerPoint & Google Slides
Business Strategy
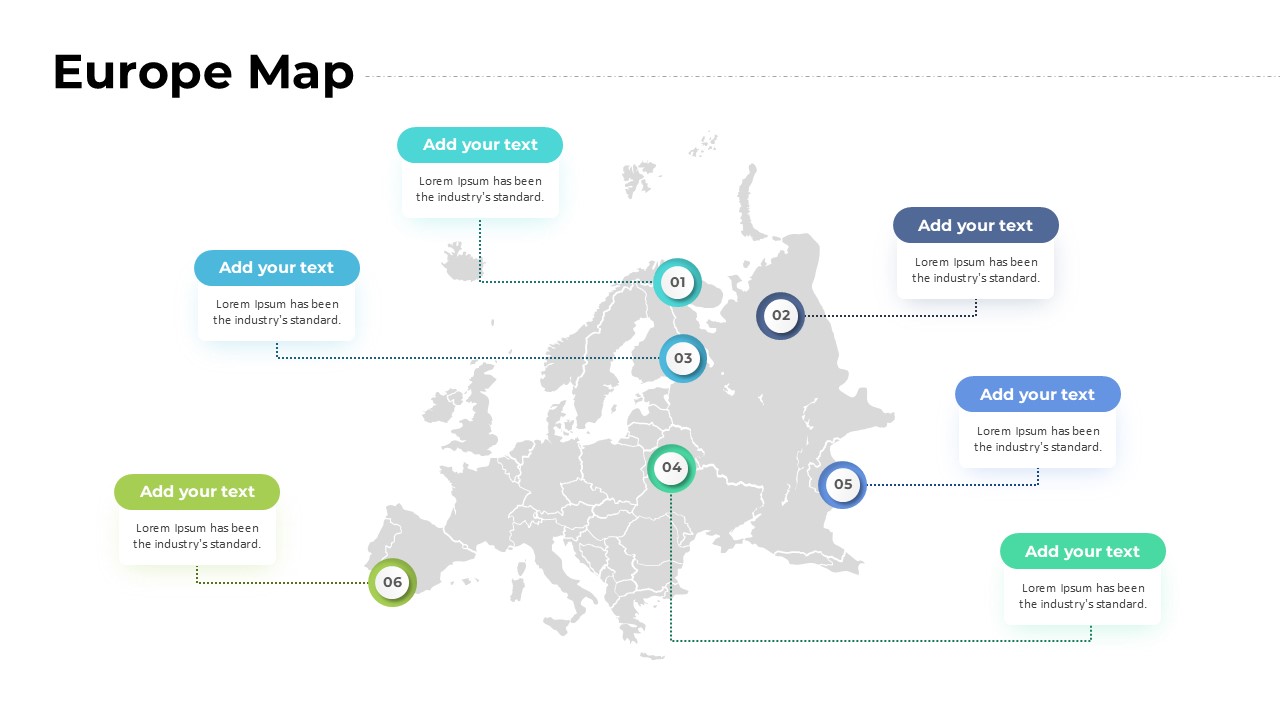
Europe Map with Six Editable Points Template for PowerPoint & Google Slides
World Maps
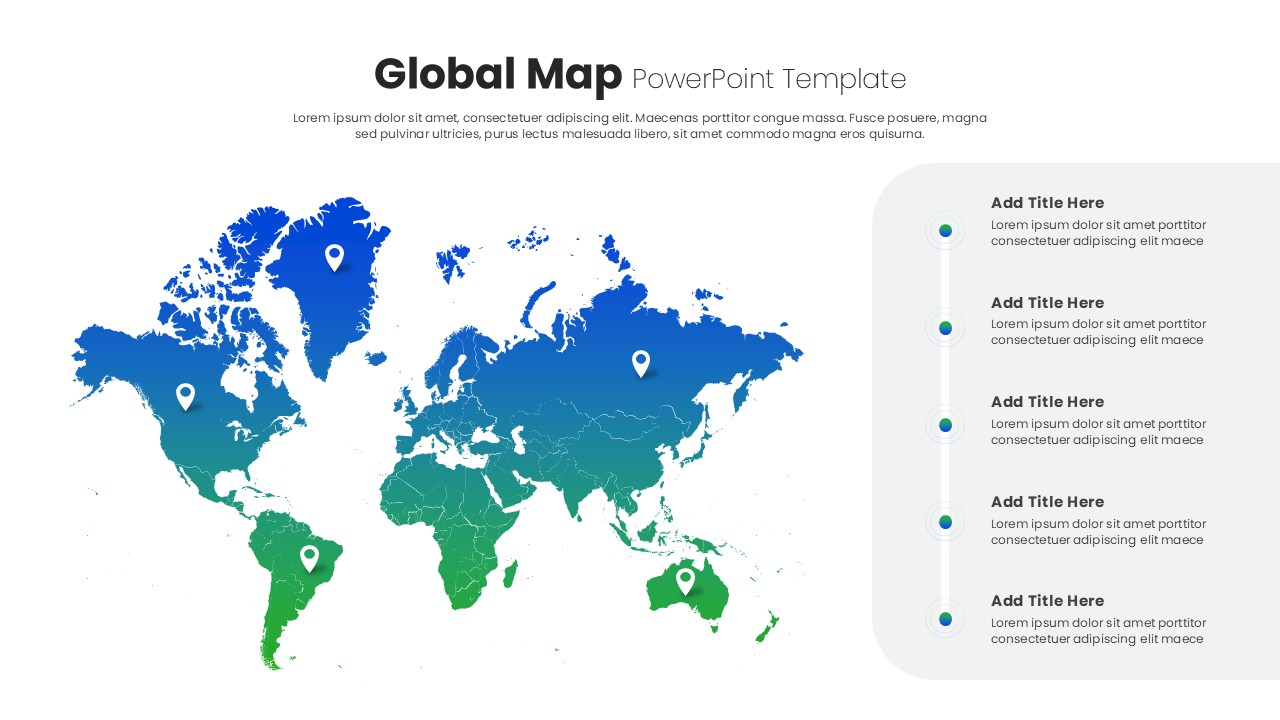
Global Map with Pinpoint Markers template for PowerPoint & Google Slides
Business
USA Map with Bar Chart Template for PowerPoint & Google Slides
World Maps
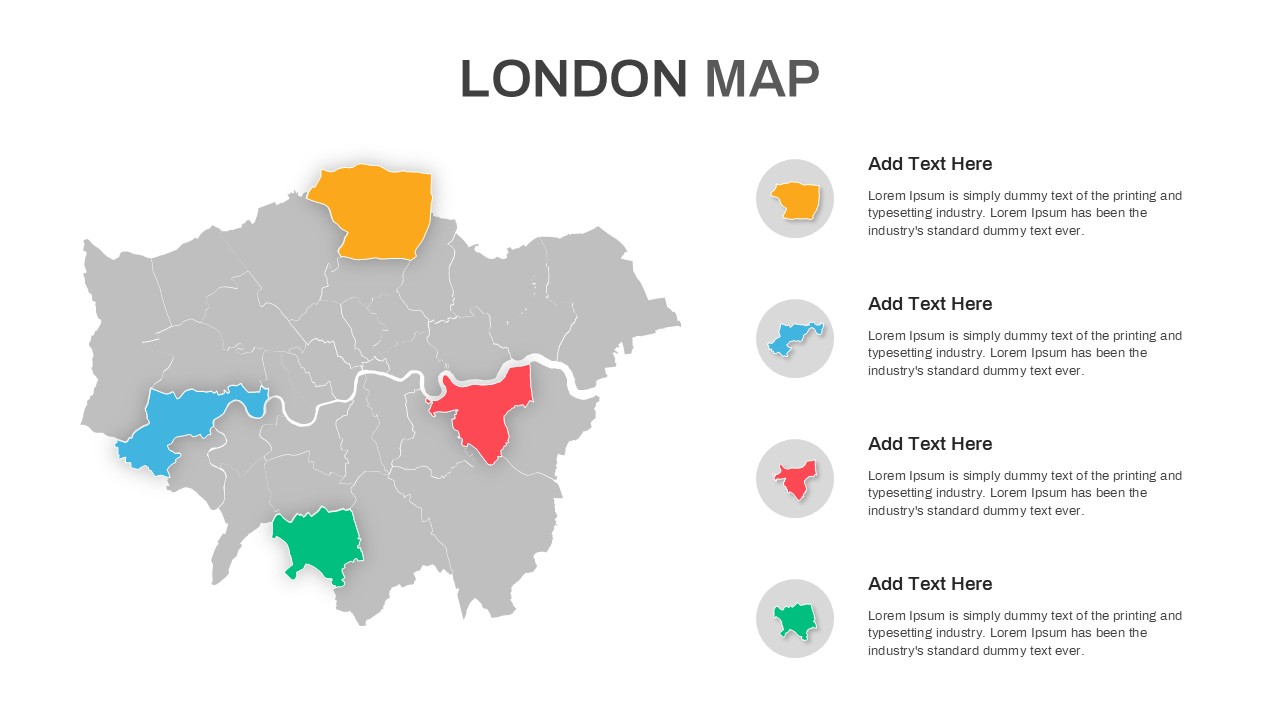
London Map with Highlighted Boroughs Template for PowerPoint & Google Slides
World Maps
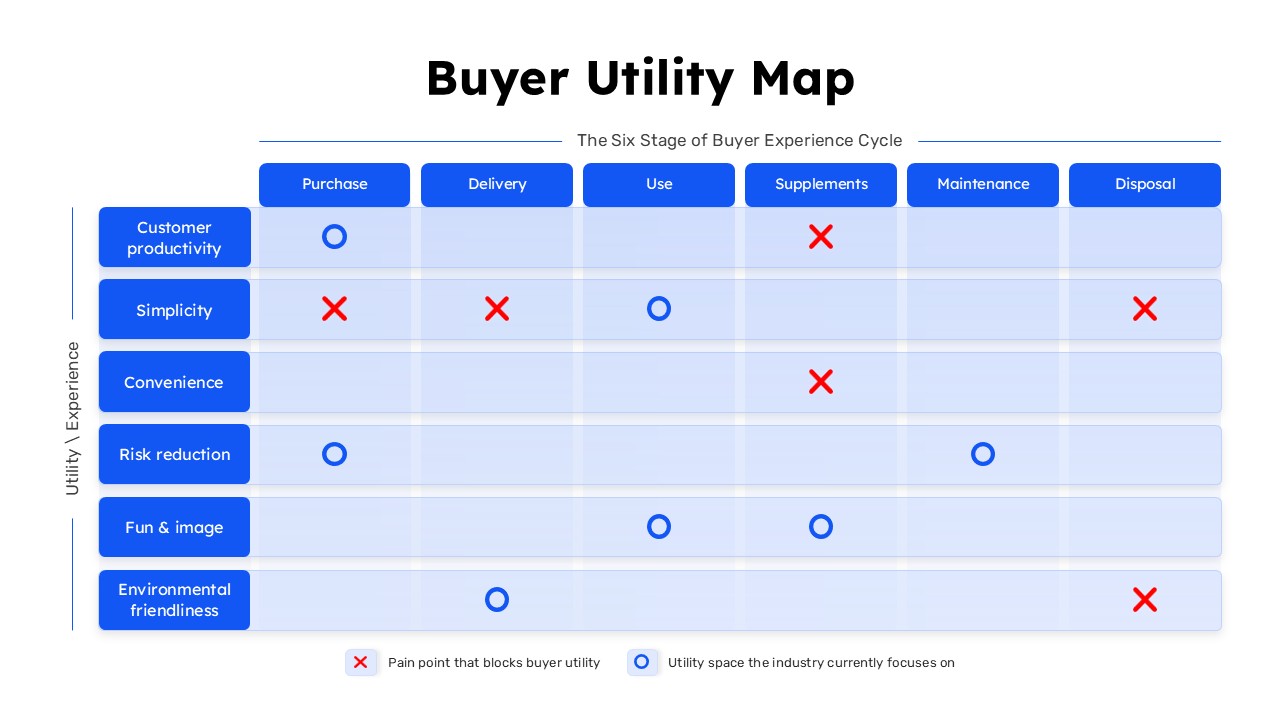
Buyer Utility Map Strategy Matrix Template for PowerPoint & Google Slides
Customer Journey