Cone Data Chart for PowerPoint & Google Slides


Description
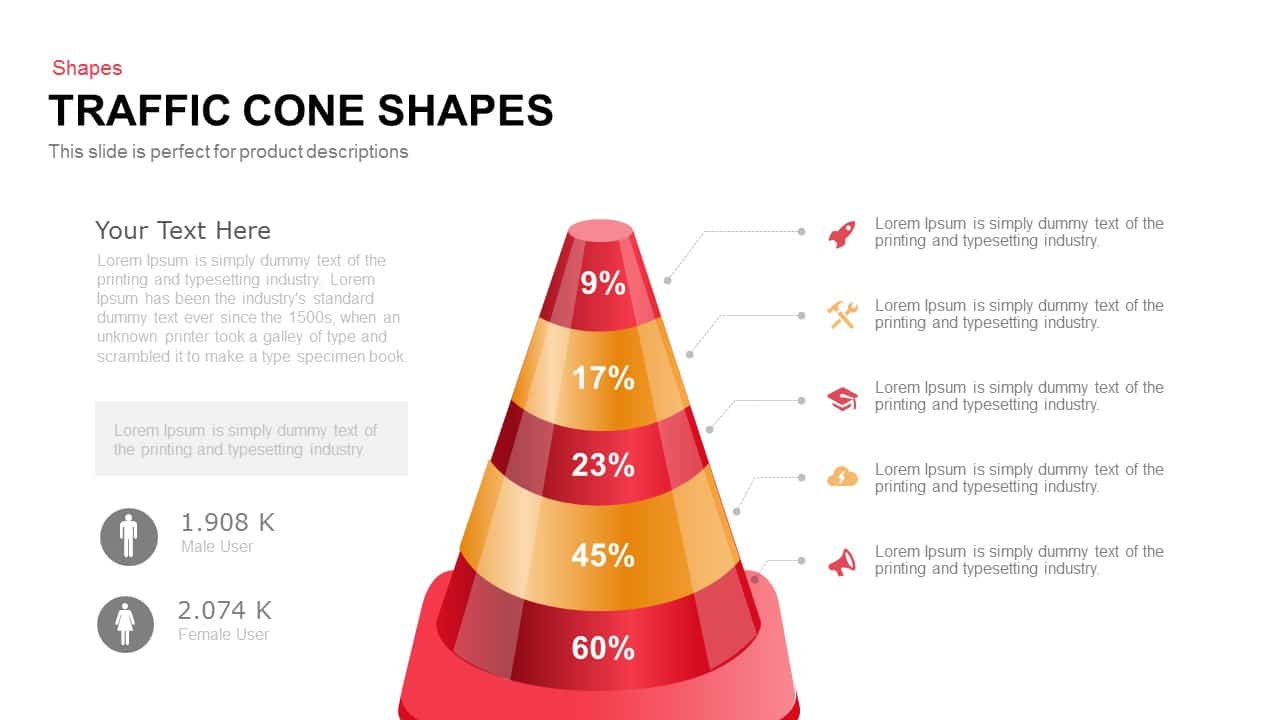
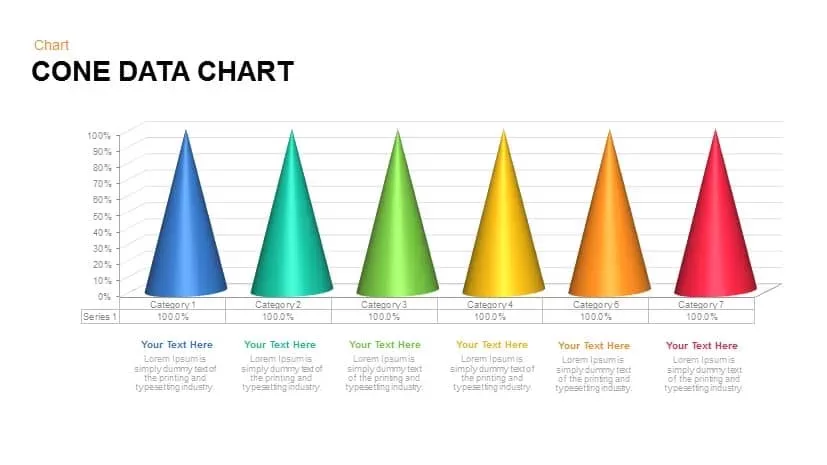
This vibrant cone data chart is an engaging way to visualize categorical data in a 3D format. The cones represent different categories, each with a percentage value at the top, giving a clear and visually appealing comparison between categories. The colors—ranging from blue and green to yellow, orange, and red—are easily distinguishable, making it ideal for highlighting differences in data points.
Each cone is paired with a text placeholder at the base where additional information or context can be added. This feature makes the diagram useful for explaining the significance of the data or adding details such as trends, insights, or comments. The 3D nature of the chart adds depth, making it visually striking while still being easy to interpret.
Fully customizable in both PowerPoint and Google Slides, you can adjust the colors, icons, and text to fit your needs, whether you’re presenting sales data, market research, or performance metrics. It’s an excellent tool for business presentations, marketing campaigns, and data-driven discussions.
Who is it for
This diagram is ideal for business analysts, marketers, sales teams, and project managers who need to present data comparisons clearly and effectively. It’s also perfect for educators or anyone looking to illustrate categorical data in a more engaging way.
Other Uses
Besides comparing categories, this chart can be used for visualizing budgets, resource allocations, product performance, or any other set of data that can be grouped into distinct categories. It’s also useful for illustrating survey results, customer preferences, or key performance indicators (KPIs).
Login to download this file

Item ID
SB00800
Related Templates

3D Cone Chart Data Visualization template for PowerPoint & Google Slides
Bar/Column
Traffic Cone Funnel Diagram Slide Template for PowerPoint & Google Slides
Funnel
5 Stage Cone Agenda Infographic Template for PowerPoint & Google Slides
Agenda

3-Part Strategic Planning Cone Diagram Template for PowerPoint & Google Slides
Process
Cone of Uncertainty Process Diagram Template for PowerPoint & Google Slides
Process

Creative data chart analytics template for PowerPoint & Google Slides
Charts
Mobile Data Analysis Chart template for PowerPoint & Google Slides
Charts
Circle Chart Data template for PowerPoint & Google Slides
Pie/Donut
Creative Data Analysis Bar Chart template for PowerPoint & Google Slides
Bar/Column
3D Bar Chart Data Infographics Template for PowerPoint & Google Slides
Bar/Column
Pencil Bar Chart Data Analysis Template for PowerPoint & Google Slides
Bar/Column
Bar Data Chart Slide for PowerPoint & Google Slides
Bar/Column
Weekly Data Chart Slide for PowerPoint & Google Slides
Comparison Chart

3D Column Chart with Data Table for PowerPoint & Google Slides
Bar/Column
Tornado Chart Data Comparison Slide Template for PowerPoint & Google Slides
Bar/Column
Donut Chart Data Breakdown template for PowerPoint & Google Slides
Pie/Donut
Waffle Chart Data Visualization Template for PowerPoint & Google Slides
Comparison Chart
Free Stacked Column Chart Data Visualization Template for PowerPoint & Google Slides
Bar/Column
Free
Simple Bar Chart Data Visualization Template for PowerPoint & Google Slides
Bar/Column
XY Bubble Chart Data Visualization Template for PowerPoint & Google Slides
Comparison Chart
Simple Area Chart Data Trends Analysis Template for PowerPoint & Google Slides
Comparison Chart
Data Over Time Line Chart template for PowerPoint & Google Slides
Charts
Waterfall Chart Data Visualization Template for PowerPoint & Google Slides
Comparison Chart
Multipurpose Spline Chart Data Trend Template for PowerPoint & Google Slides
Bar/Column
Interactive Jump Line Data Chart Template for PowerPoint & Google Slides
Comparison Chart
Segmented Scatter Chart Data Visualization Template for PowerPoint & Google Slides
Business Strategy
Data Analysis Bar Chart with Insights Template for PowerPoint & Google Slides
Bar/Column
Free
Data-Driven Line Chart Diagram Template for PowerPoint
Comparison Chart
Clustered Column Chart Data Analysis Template for PowerPoint
Bar/Column
Data Science PowerPoint Presentation Template for PowerPoint & Google Slides
Pitch Deck
Data Center PowerPoint Template for PowerPoint & Google Slides
Information Technology
World Map Data template for PowerPoint & Google Slides
World Maps

Smartphone Data User template for PowerPoint & Google Slides
Charts
Interactive US Population Data Map Slide Template for PowerPoint & Google Slides
World Maps
3D Stacked Infographic Layers Data Template for PowerPoint & Google Slides
Pyramid
Circle Graph Data Visualization Template for PowerPoint & Google Slides
Circular
Creative Lab Beakers Data Infographic template for PowerPoint & Google Slides
Infographics

Dynamic Data Dashboard Infographic Template for PowerPoint & Google Slides
Bar/Column
Data Analytics Dashboard Design template for PowerPoint & Google Slides
Bar/Column
Mobile User Data Analysis Infographic for PowerPoint & Google Slides
Process
Gear Pie Diagram Data Visualization Template for PowerPoint & Google Slides
Pie/Donut
Data-Driven Marketing Cycle Diagram Template for PowerPoint & Google Slides
Customer Journey
Bottle Data Percentage Infographic Template for PowerPoint & Google Slides
Infographics
Immigration Data Dashboard Template for PowerPoint & Google Slides
Bar/Column
Leaf Infographic Data Visualization Template for PowerPoint & Google Slides
Infographics
Mobile Infographics Data Visualization Template for PowerPoint & Google Slides
Infographics
Data Management and Analytics Diagram Template for PowerPoint & Google Slides
Circular
Data Migration Life Cycle Curved Diagram Template for PowerPoint & Google Slides
Process
Medical Infographics Data Visualization Template for PowerPoint & Google Slides
Health
4 Business Data Infographics Diagram for PowerPoint & Google Slides
Process
DIKW Data to Wisdom Pyramid Model Template for PowerPoint & Google Slides
Pyramid
Data-driven GDP Growth Infographic Pack Template for PowerPoint & Google Slides
Infographics
KPI Dashboard Data Visualization Template for PowerPoint & Google Slides
Bar/Column
KPI Dashboard Data Overview Slide Template for PowerPoint & Google Slides
Bar/Column
North America Data Map Callouts Template for PowerPoint & Google Slides
World Maps
Professional Heatmap Data Visualization Template for PowerPoint & Google Slides
Infographics

Modern Big Data Infographic Deck Template for PowerPoint & Google Slides
Decks
Layered Data Governance Maturity Model Template for PowerPoint & Google Slides
Process
Editable Africa Map Infographic Data Template for PowerPoint & Google Slides
World Maps
UK Counties Map Data Visualization Template for PowerPoint & Google Slides
World Maps
Advanced Data Flow Diagram Pack Template for PowerPoint & Google Slides
Flow Charts
Free Big Data Network Visualization Template for PowerPoint & Google Slides
Circular
Free
Syria Regional Data Map Infographic Template for PowerPoint & Google Slides
World Maps
Data Lake Hub-and-Spoke Diagram Template for PowerPoint & Google Slides
Cloud Computing
ETL Data Pipeline Workflow Diagram Template for PowerPoint & Google Slides
Process
Data Privacy template for PowerPoint & Google Slides
Information Technology
Data Protection Strategies template for PowerPoint & Google Slides
Information Technology
Comprehensive Data & AI Capability Model Template for PowerPoint & Google Slides
AI
Data Flywheel Strategy template for PowerPoint & Google Slides
Business
Data Privacy and Compliance in ML template for PowerPoint & Google Slides
Technology
Data-Driven AI in Insurance Infographic Template for PowerPoint & Google Slides
Circular
AI and Data Ecosystem Map Template for PowerPoint & Google Slides
AI
Data Studio Insights template for PowerPoint & Google Slides
Business Report
Data Protection & Encryption in the Cloud Overview template for PowerPoint & Google Slides
Cloud Computing
Customer Data Platform Workflow Diagram Template for PowerPoint & Google Slides
Information Technology
Data-Driven Marketing Lifecycle Diagram Template for PowerPoint & Google Slides
Process
Data-Driven Decision Making overview template for PowerPoint & Google Slides
Business
First Party Data Overview Template for PowerPoint & Google Slides
Business
Data Governance Roles Pyramid Diagram Template for PowerPoint & Google Slides
Pyramid
Business Data Table Template for PowerPoint & Google Slides
Table
Colorful Business Data Comparison Table Template for PowerPoint & Google Slides
Table
Six Column Data Table Template for PowerPoint & Google Slides
Table
Data Gap Analysis Template for PowerPoint & Google Slides
Business
Free Data Analytics Dashboard Template for PowerPoint
Charts
Free
Quad Chart Infographic Pack of 8 Slides Template for PowerPoint & Google Slides
Comparison Chart
Free Professional Gantt Chart Pack – 4 Slides Template for PowerPoint & Google Slides
Gantt Chart
Free
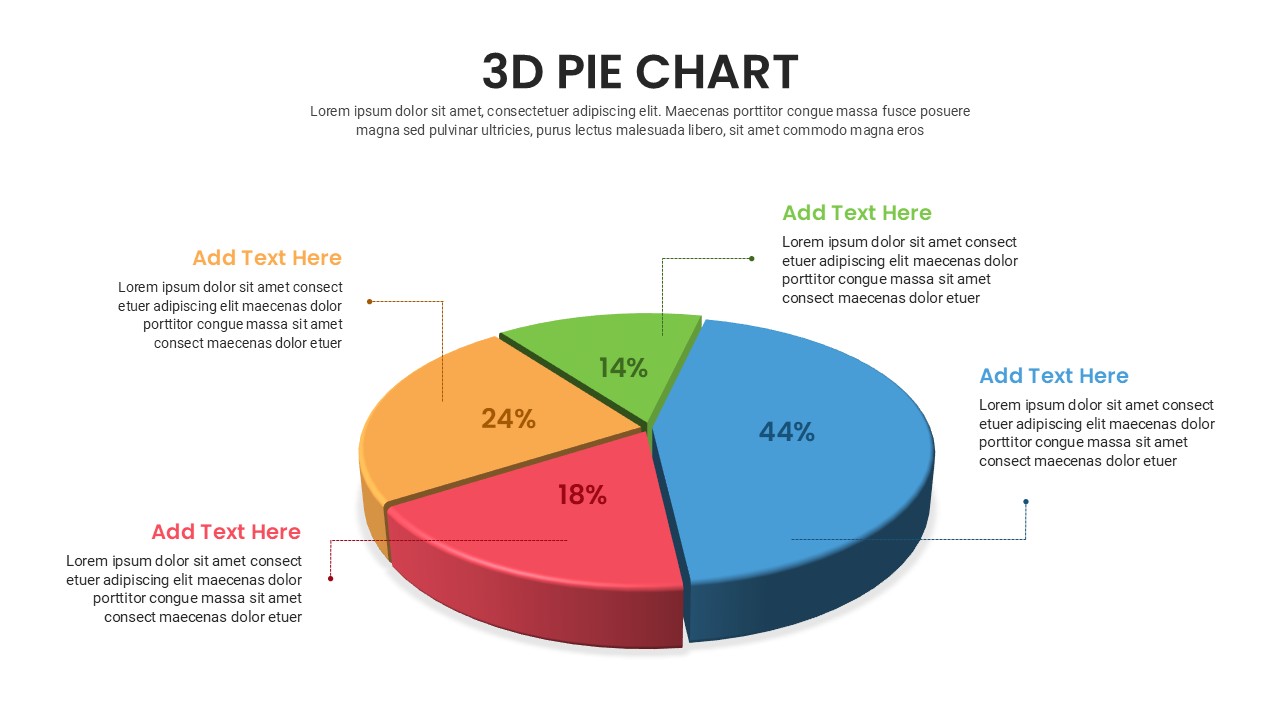
Free 3D Pie Chart template for PowerPoint & Google Slides
Pie/Donut
Free
Donut Chart Split Template for PowerPoint & Google Slides
Charts
3D Cylinder Bar Chart Template for PowerPoint & Google Slides
Bar/Column
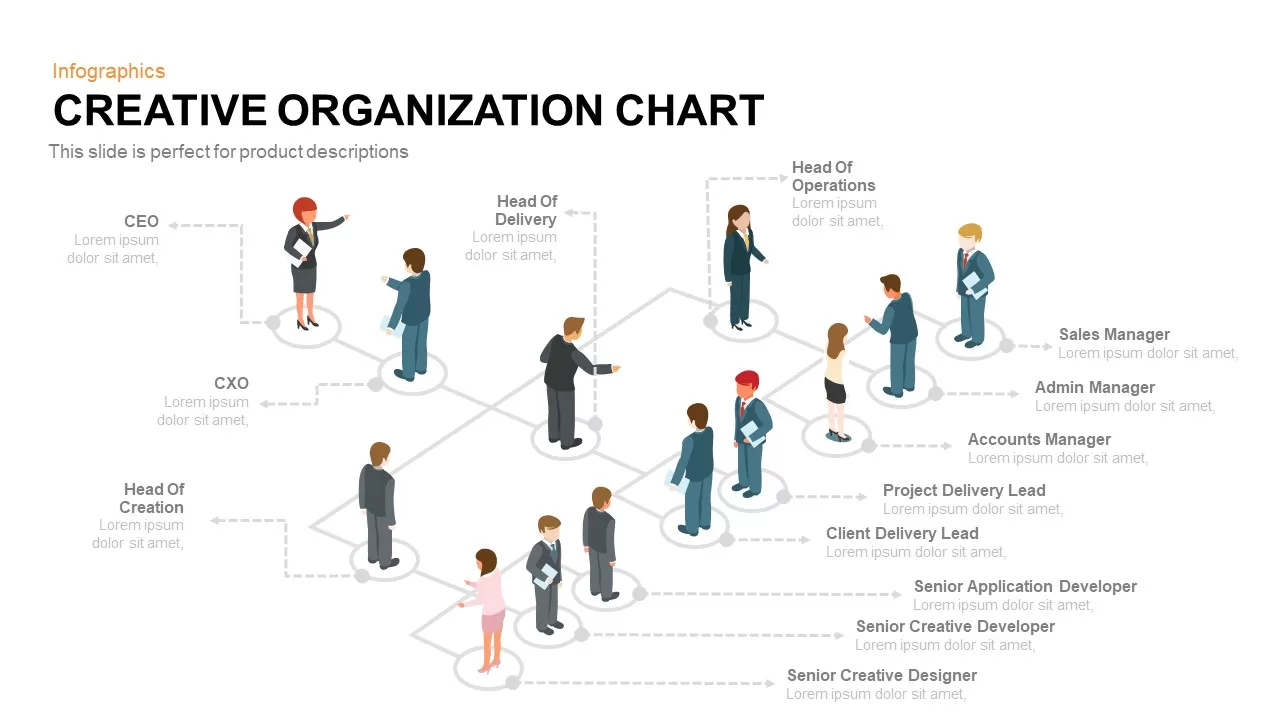
Isometric Organization Chart Diagram Template for PowerPoint & Google Slides
Org Chart
Success Key Diagram with Donut Chart Template for PowerPoint & Google Slides
Pie/Donut
3D Line Chart for PowerPoint & Google Slides
Charts
Corporate Organizational Chart Hierarchy Template for PowerPoint & Google Slides
Org Chart
Entertainment Industry Revenue Bar Chart Template for PowerPoint & Google Slides
Bar/Column
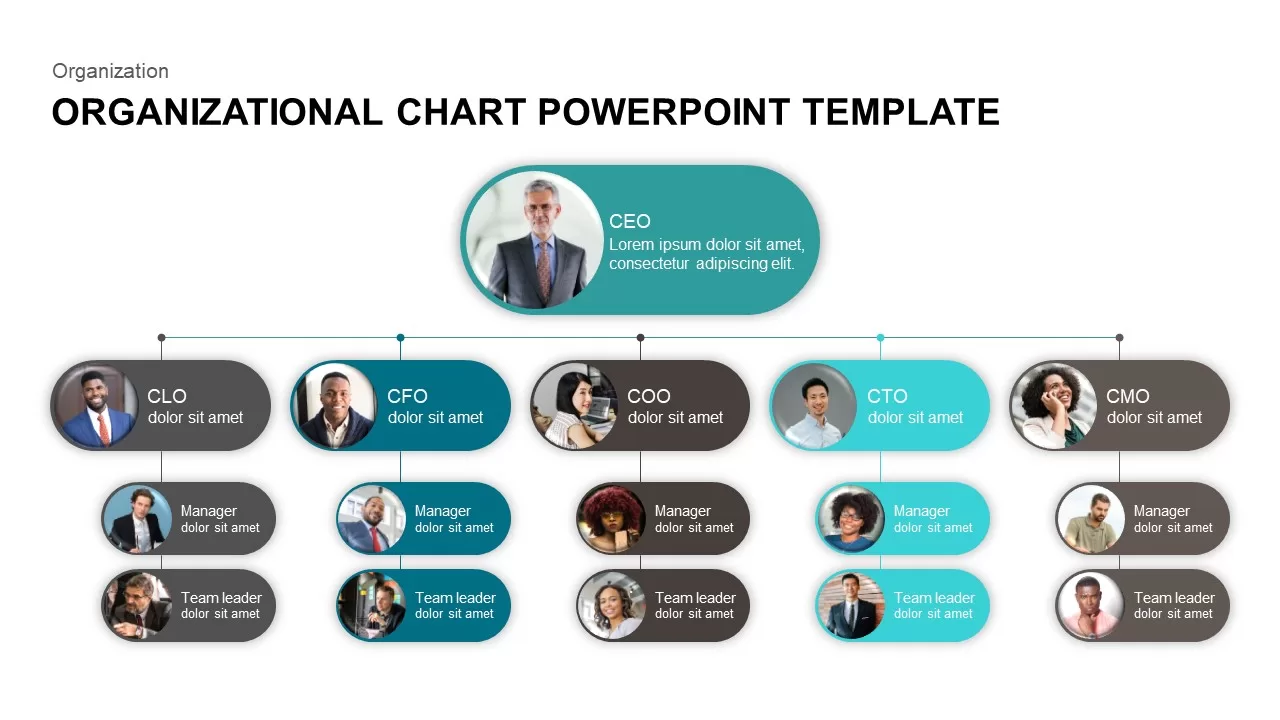
Modern Photo-Based Organizational Chart Template for PowerPoint & Google Slides
Org Chart
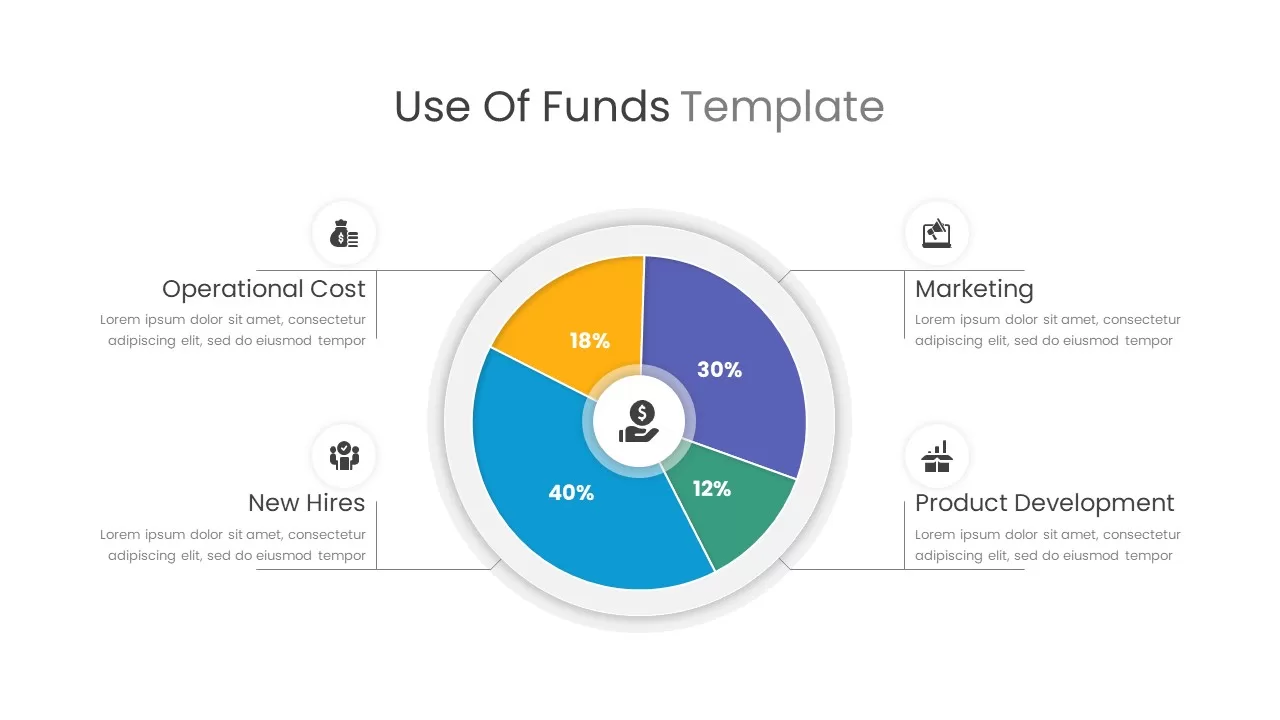
Use of Funds Donut Chart Infographic Template for PowerPoint & Google Slides
Circular
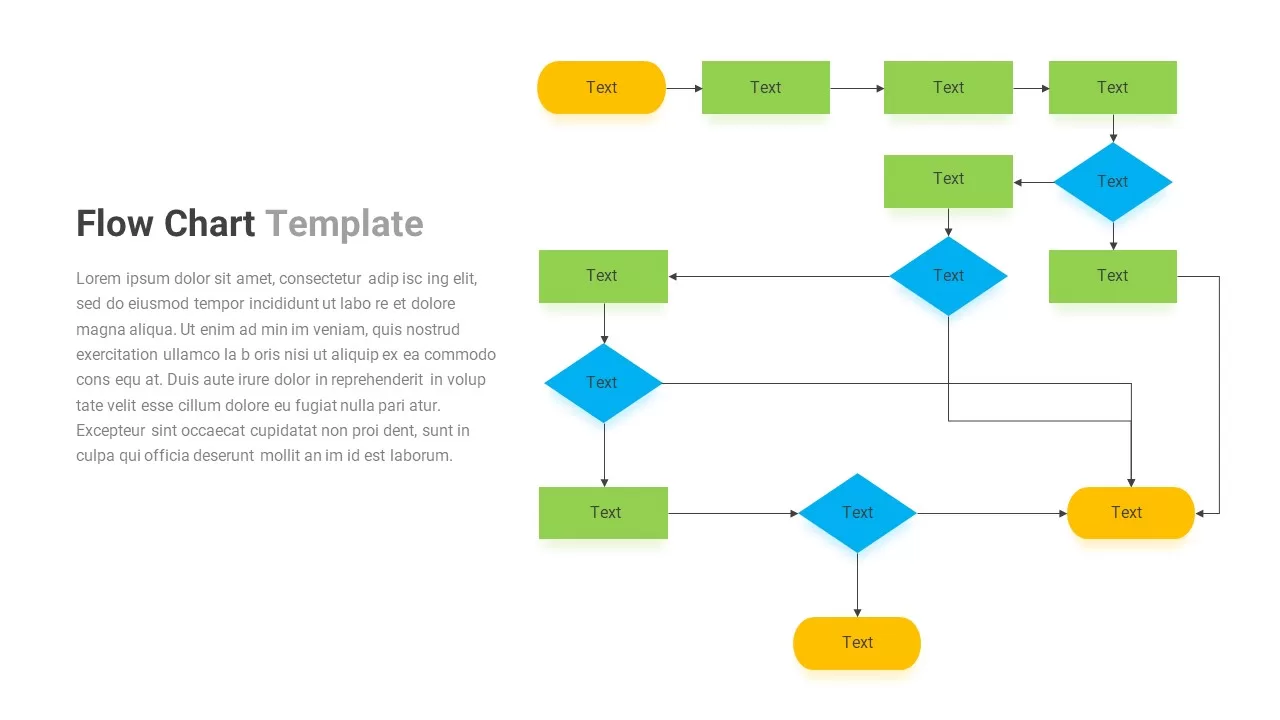
Flow Chart template for PowerPoint & Google Slides
Flow Charts
Population Pyramid Chart Analysis Template for PowerPoint & Google Slides
Bar/Column
Animated Clustered Bar Chart Template for PowerPoint & Google Slides
Bar/Column
Free Editable Simple Column Chart Slide Template for PowerPoint & Google Slides
Bar/Column
Free