Circle Segment Sales Metrics Infographic Template for PowerPoint & Google Slides


Description
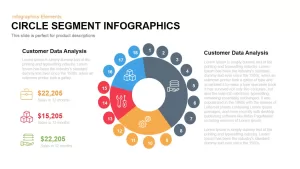
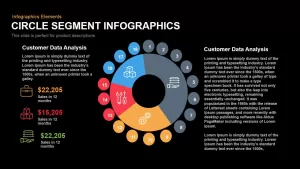
Download this dynamic circle segment infographic slide to visualize segmented data across eighteen discrete nodes arranged around a clean donut chart. The design features four distinct color-coded segments—light gray for foundational frameworks, orange for process stages, red for performance metrics, and blue for analysis categories—each occupying proportional spans within the ring. A central green core anchors the composition, while matching numbered dots (1–18) encircle the chart to denote stages, milestones, or category divisions.
On the left, a customizable legend pairs briefcase, cube, and stack icons with editable sales figures and descriptive text placeholders, enabling instant comparison of annual performance metrics. Semi-transparent gradient arrows on the slide margins suggest interactive carousel navigation or step-by-step walkthroughs. Subtle grid lines and minimalist typography ensure clarity and focus, while ample white space balances visual elements for a polished, professional look.
Built on master slide layouts with fully editable vector shapes, this template empowers you to adjust segment angles, swap color palettes, replace icons, and update text in seconds. The high-resolution graphics scale seamlessly across PowerPoint and Google Slides, maintaining pixel-perfect fidelity on any display. Whether mapping customer segments, KPI dashboards, or process workflows, this slide streamlines complex data storytelling and accelerates slide creation with consistent formatting and intuitive placeholders.
Who is it for
Data analysts, marketing strategists, business consultants, and project managers will leverage this infographic when presenting sales breakdowns, customer segmentation, process mapping, or KPI dashboards in boardroom briefings, stakeholder reports, or investor presentations.
Other Uses
Beyond sales analysis, repurpose this slide for timeline segmentation, risk assessment models, organizational structures, or educational modules. Expand the node count, adjust segment sizes, or repurpose the legend to map survey results, feature prioritization, strategy roadmaps, or comparative metrics across any domain.
Login to download this file

Item ID
SB00121
Related Templates

Multi-Segment Circle Split Diagram template for PowerPoint & Google Slides
Circular
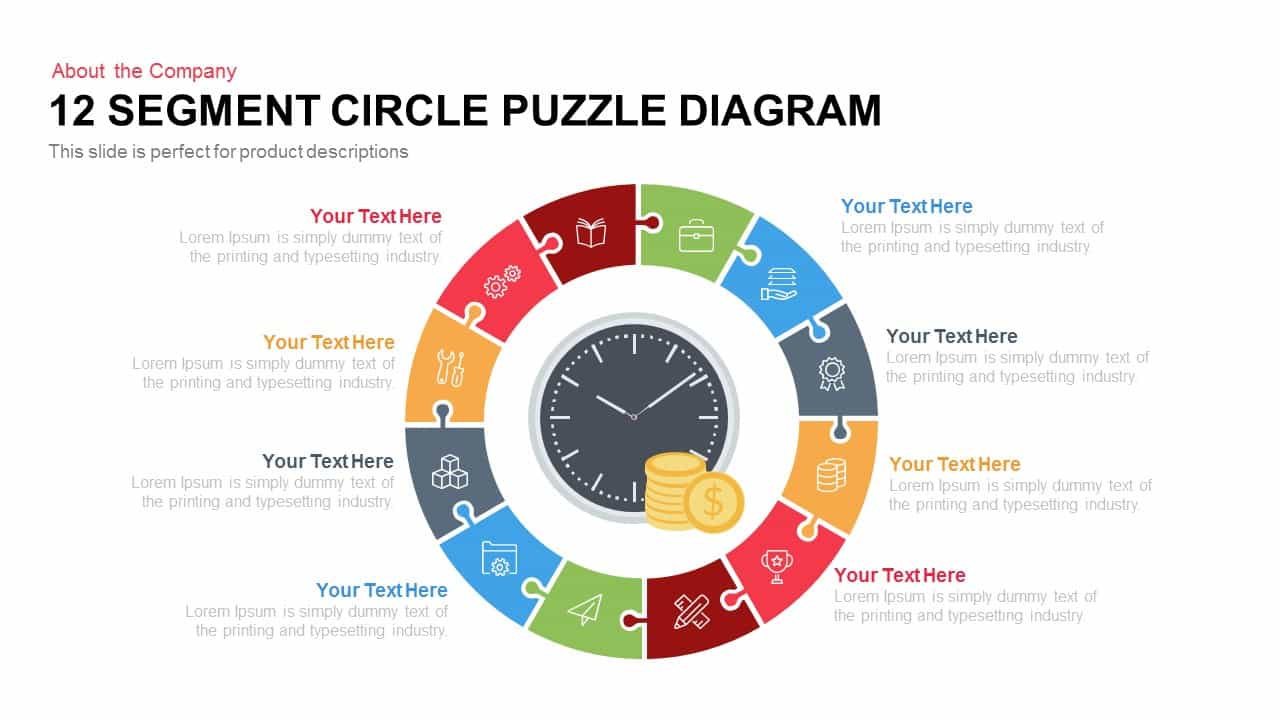
12 Segment Circle Puzzle Diagram Template for PowerPoint and Keynote
Circular
Bubble Head Metrics Infographic Template for PowerPoint & Google Slides
Circular
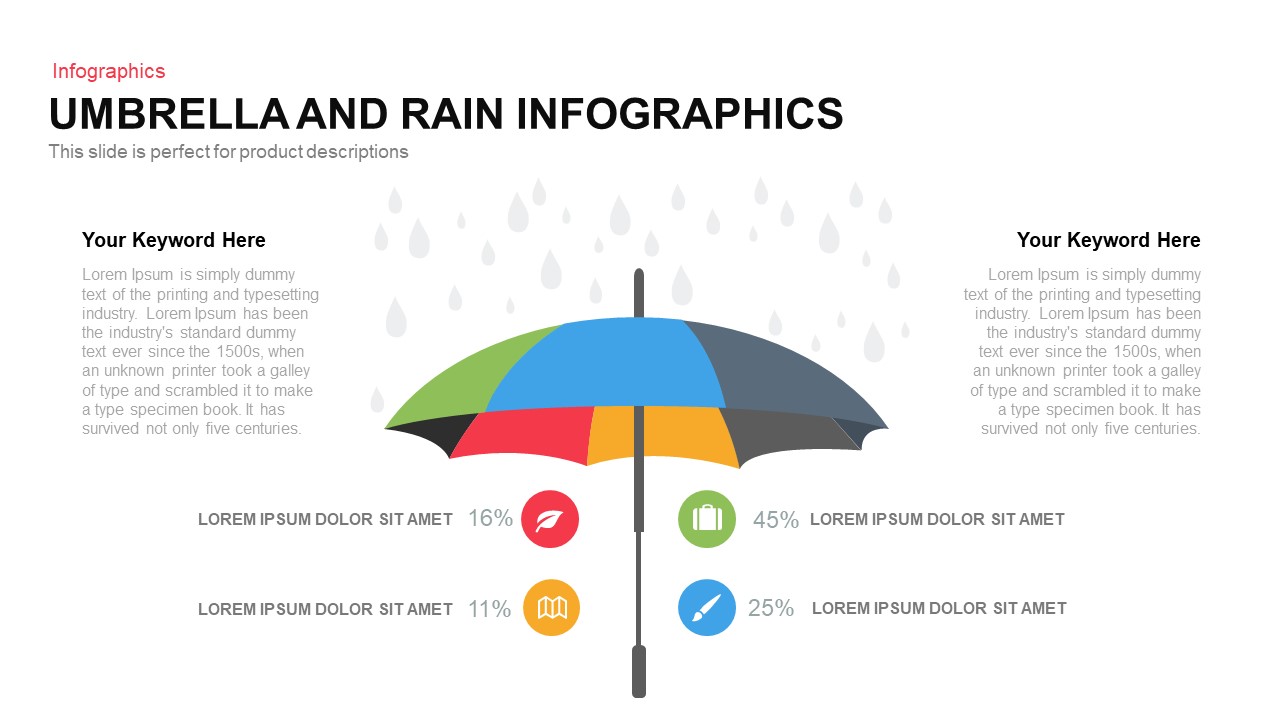
Umbrella and Rain Infographic Metrics Template for PowerPoint & Google Slides
Comparison
Colorful Block Infographic Metrics Slide Template for PowerPoint & Google Slides
Infographics
Statistics & Global Metrics Infographic Template for PowerPoint & Google Slides
Bar/Column
LinkedIn Metrics Infographic Slide Template for PowerPoint & Google Slides
Digital Marketing
Facebook Social Metrics Infographic Template for PowerPoint & Google Slides
Graphics
Instagram Infographic Metrics Slide Template for PowerPoint & Google Slides
Marketing
Mastodon Metrics Infographic Dashboard Template for PowerPoint & Google Slides
Business Report

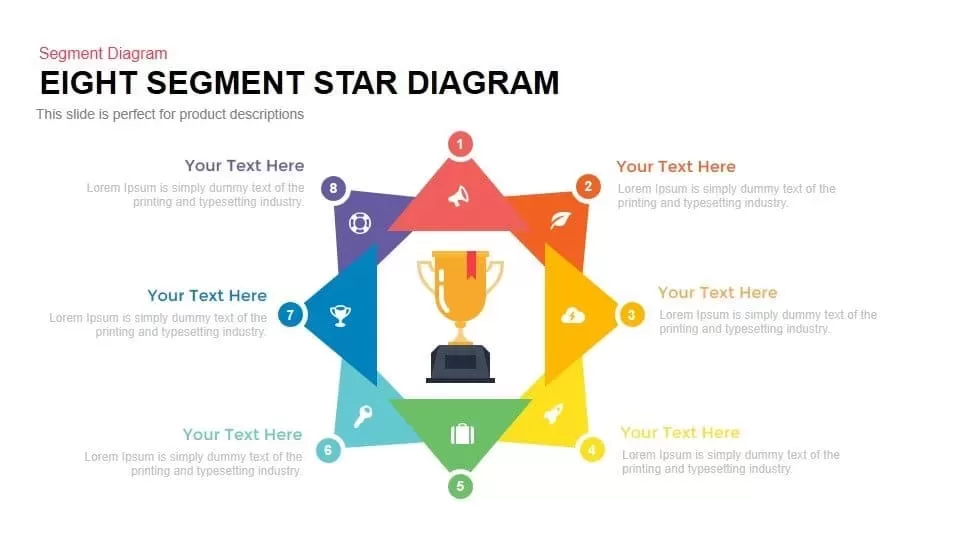
Eight Segment Star Diagram Infographic Template for PowerPoint & Google Slides
Process
Six-Segment Circular Hub Infographic Template for PowerPoint & Google Slides
Circular
Six-Segment Circular Arrow Infographic Template for PowerPoint & Google Slides
Circular
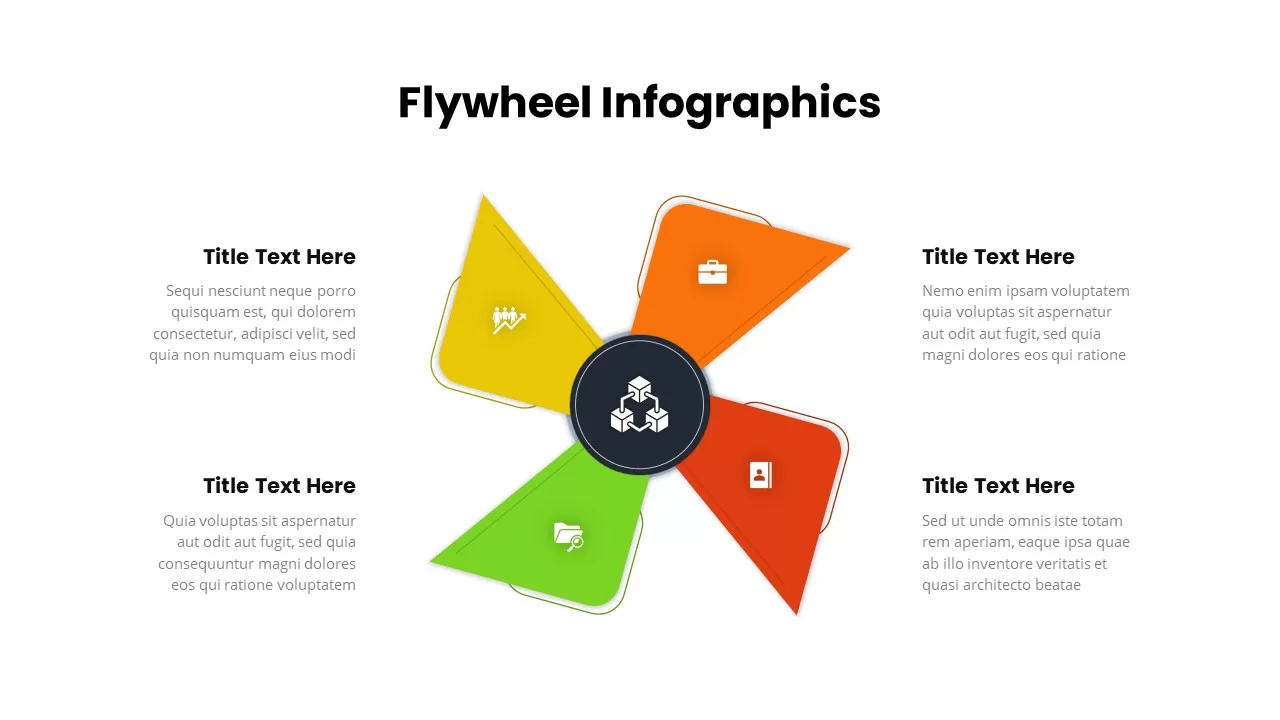
Four-Segment Flywheel Infographic Model Template for PowerPoint & Google Slides
Process
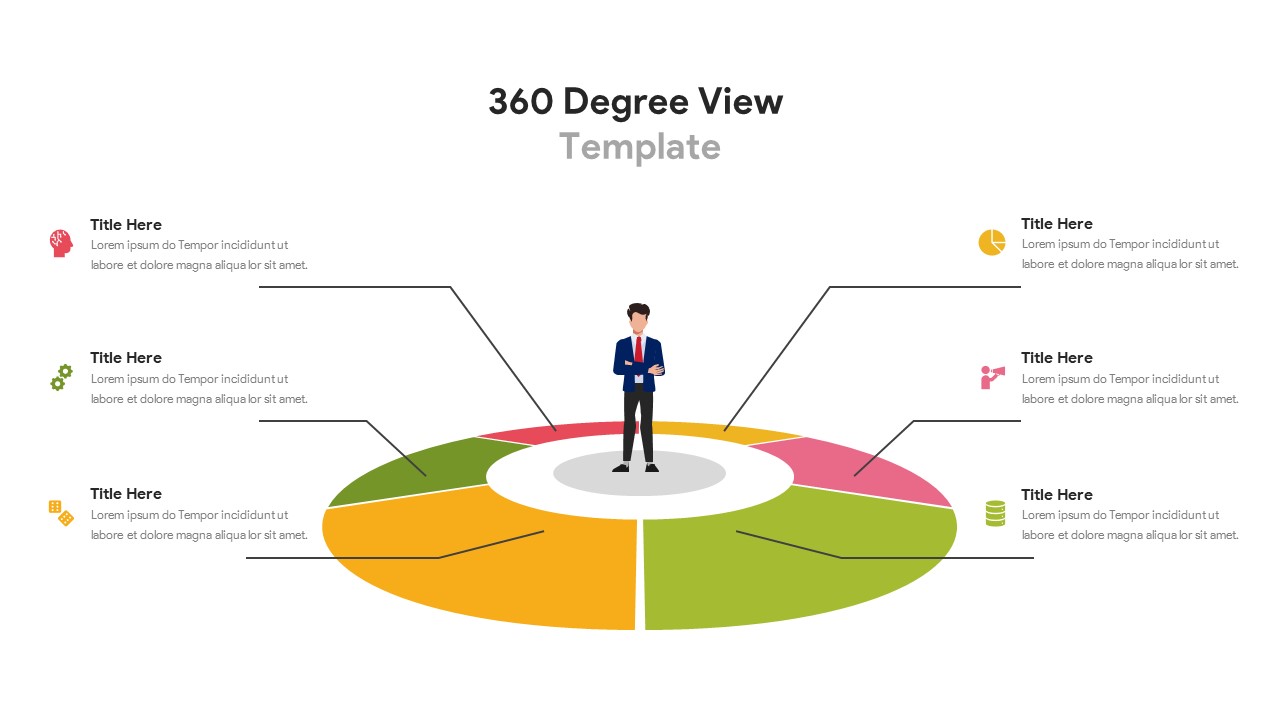
Six-Segment 360 Degree View Infographic Template for PowerPoint & Google Slides
Circular
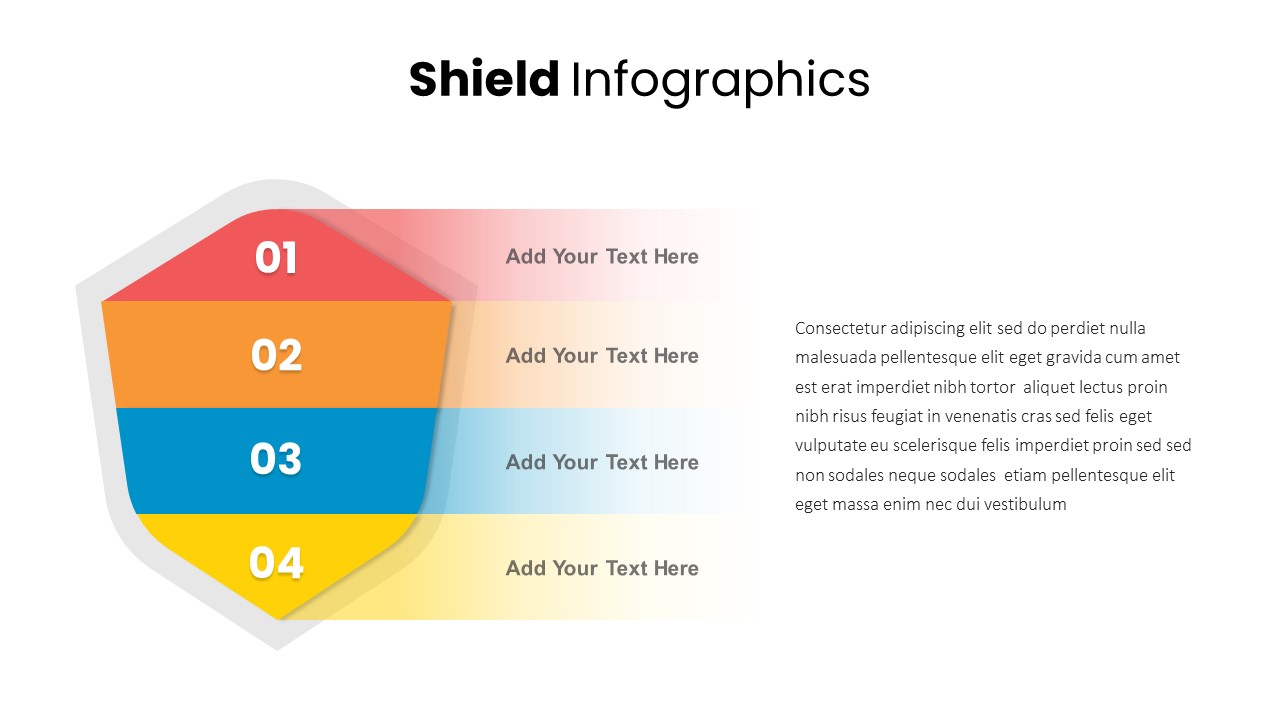
Shield Four-Segment Infographic Template for PowerPoint & Google Slides
Process
Three Segment Donut Chart KPI Infographic Template for PowerPoint & Google Slides
Pie/Donut
iPad App Mockup with Progress Metrics Template for PowerPoint & Google Slides
Bar/Column
Asia Map with KPI Metrics and Legend Template for PowerPoint & Google Slides
World Maps
Social Media Metrics template for PowerPoint & Google Slides
Comparison Chart
Mobile Usage Metrics template for PowerPoint & Google Slides
Comparison Chart
Scale Metaphor Metrics Comparison Template for PowerPoint & Google Slides
Charts
Comprehensive Recruitment Metrics Report Template for PowerPoint & Google Slides
Recruitment
Benchmarking Metrics Comparison Slide Template for PowerPoint & Google Slides
Pie/Donut
Project Status Dashboard with Metrics Template for PowerPoint & Google Slides
Project Status
Circular Image Gallery & KPI Metrics Template for PowerPoint & Google Slides
Pie/Donut
Agriculture Infographics Slide with Progress Rings & Metrics Template for PowerPoint & Google Slides
Pie/Donut
Annual Recurring Revenue Metrics Template for PowerPoint & Google Slides
Bar/Column
Social Media Analysis Metrics Slide Deck Template for PowerPoint & Google Slides
Digital Marketing
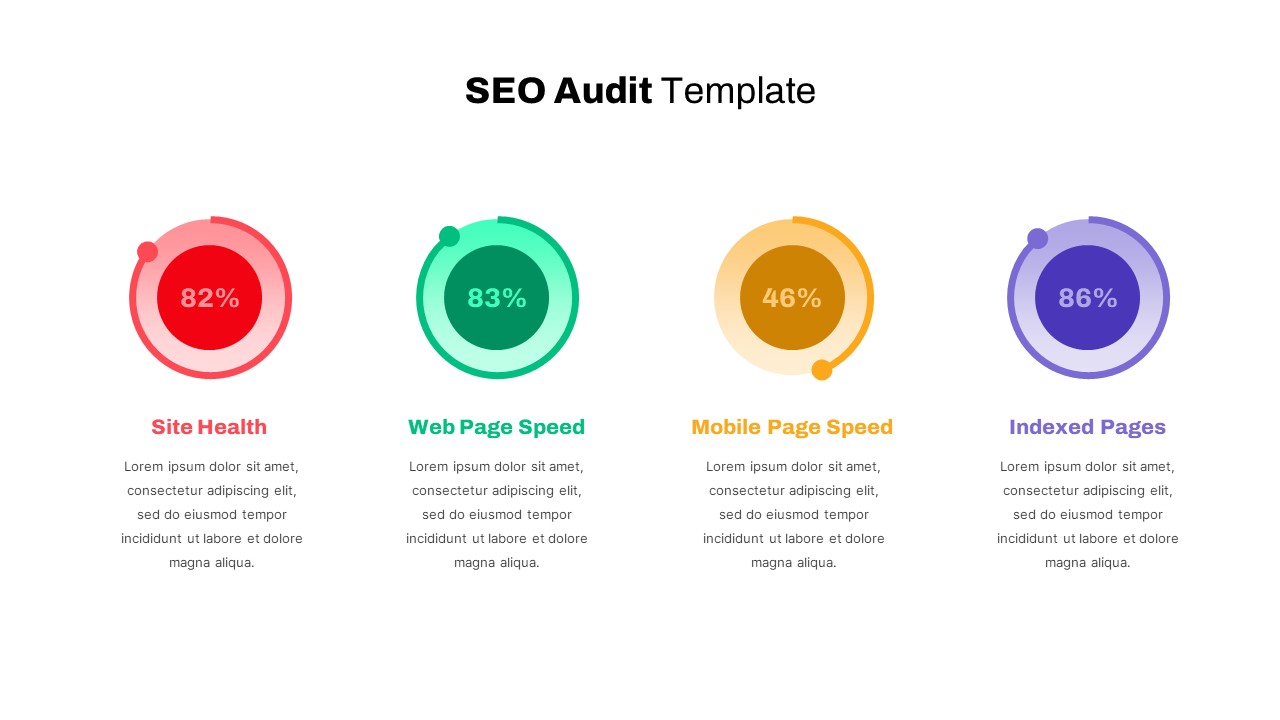
Detailed SEO Audit Metrics Overview Template for PowerPoint & Google Slides
Circular
Free Editable U.S. Map with Regional Metrics Template for PowerPoint & Google Slides
World Maps
Free
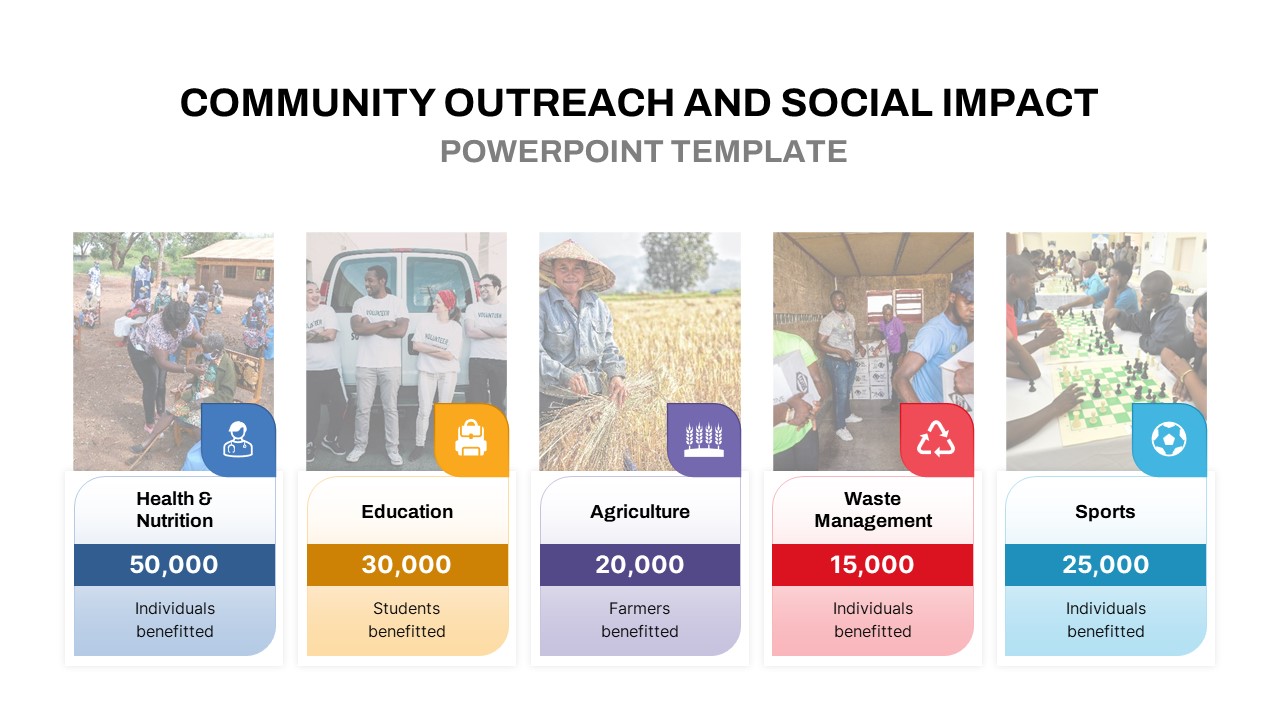
Community Outreach Impact Metrics Template for PowerPoint & Google Slides
Accomplishment
DevOps KPI Dashboard Performance Metrics Template for PowerPoint & Google Slides
Software Development
Purchasing KPI Metrics Dashboard Template for PowerPoint & Google Slides
Business Report
Financial Snapshot & Metrics Overview Template for PowerPoint & Google Slides
Finance
Procurement KPI Dashboard & Metrics Template for PowerPoint & Google Slides
Business Report
Market Validation Metrics Overview Template for PowerPoint & Google Slides
Business
Employee Performance Metrics Dashboard Template for PowerPoint & Google Slides
Employee Performance
Pirate Metrics AARRR Funnel Framework Template for PowerPoint & Google Slides
Funnel
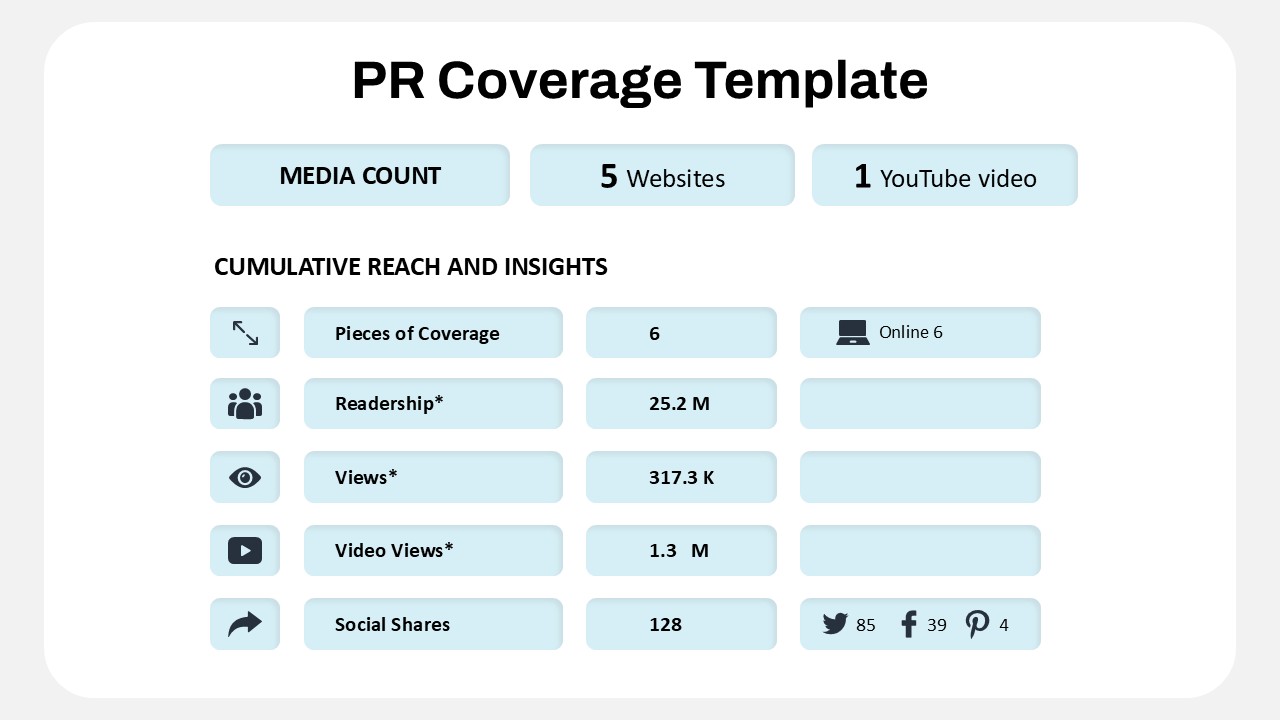
Public Relations Coverage Metrics Template for PowerPoint & Google Slides
Business Report
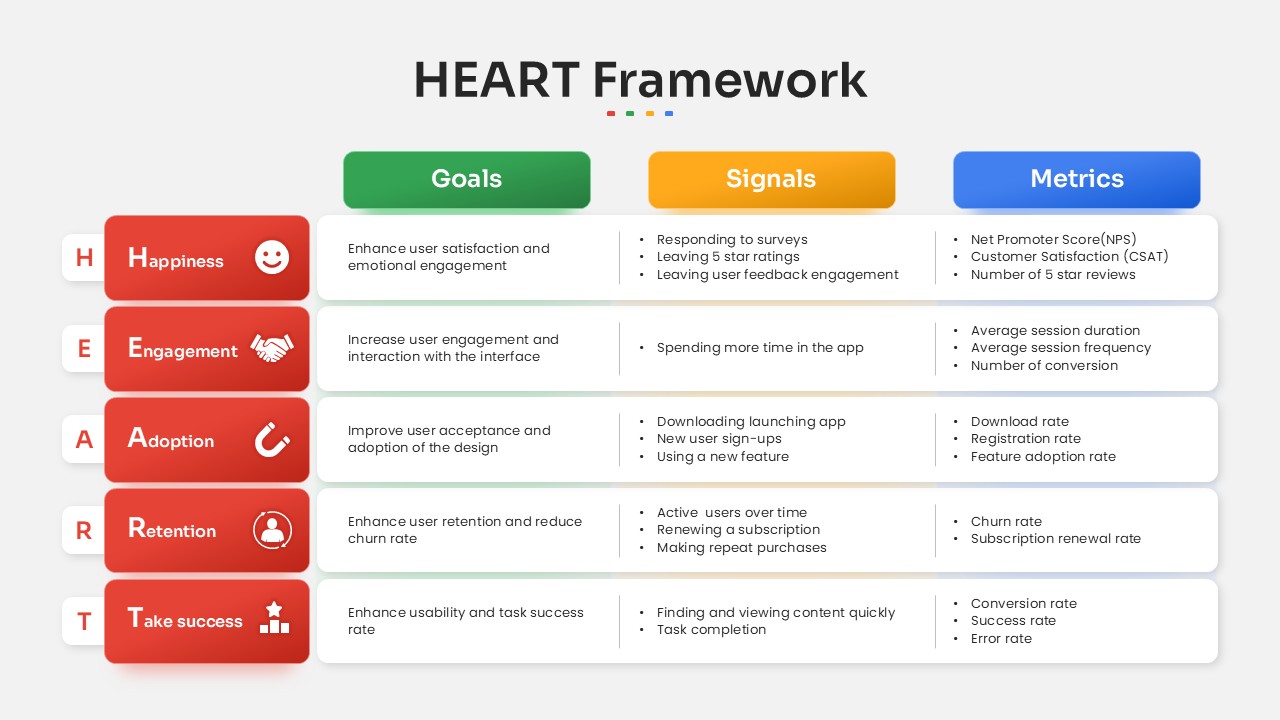
HEART Framework Goals, Signals & Metrics Template for PowerPoint & Google Slides
Process

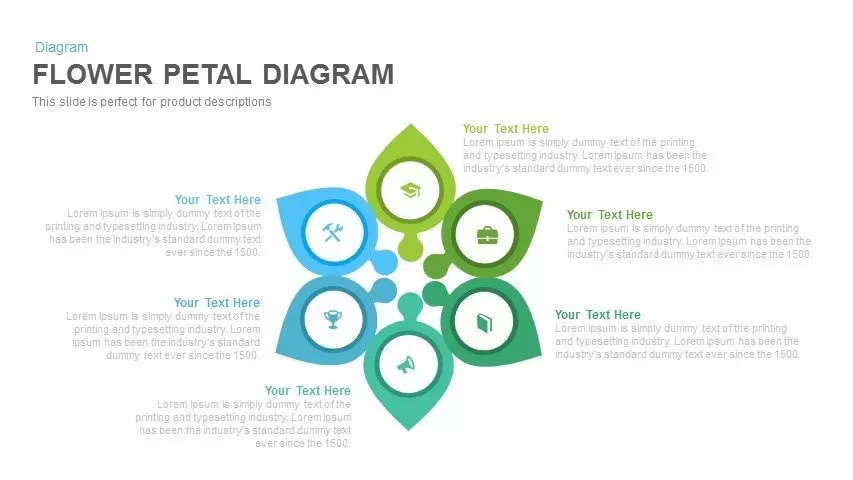
Six-Segment Flower Petal Diagram Template for PowerPoint & Google Slides
Circular
Pie Segment Diagram Four-Step Process Template for PowerPoint & Google Slides
Pie/Donut
Eight-Segment 3D Arrow Infographics Template for PowerPoint & Google Slides
Arrow
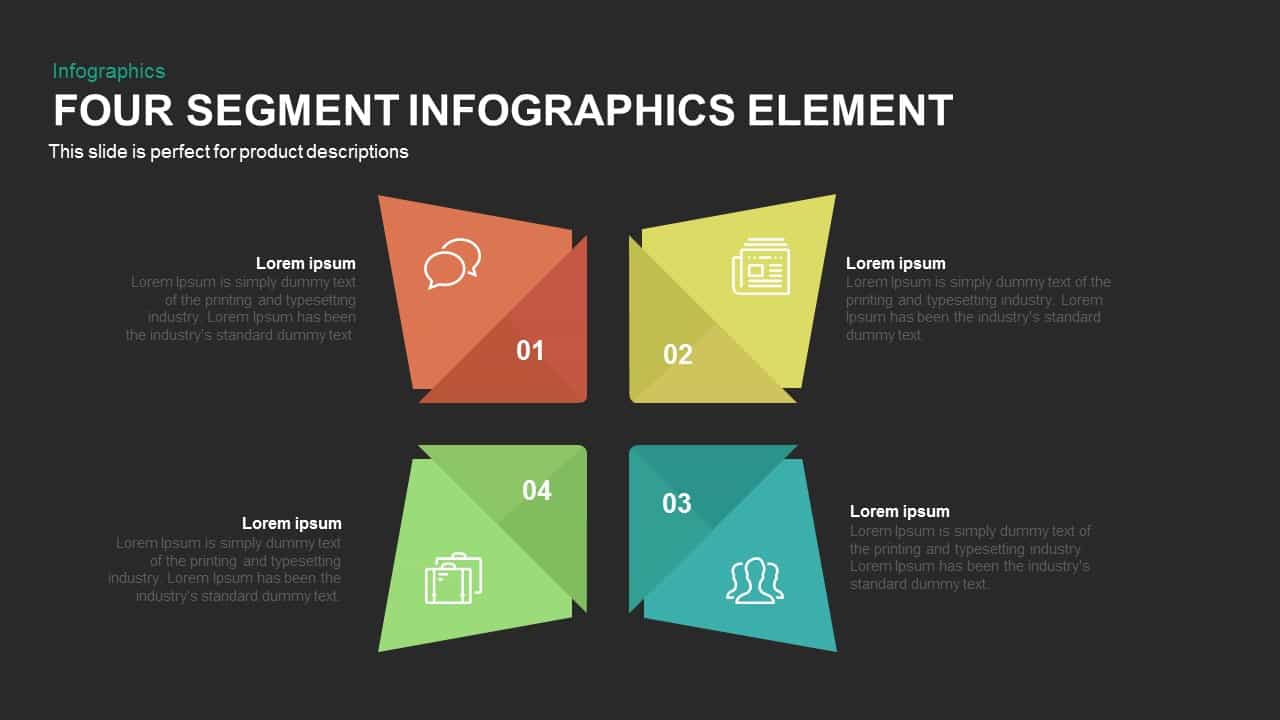
Four Segment Infographics Element Template for PowerPoint & Google Slides
Comparison
Seven-Segment Circular Arrow Diagram Template for PowerPoint & Google Slides
Arrow
Six Segment Hexagon Circular Diagram Template for PowerPoint & Google Slides
Circular
4-Segment Business Project Diamond Diagram Template for PowerPoint & Google Slides
Process
Circular 3D Cube Six-Segment Diagram Template for PowerPoint & Google Slides
Infographics
Eight-Segment Direct Marketing Wheel Template for PowerPoint & Google Slides
Circular
Three-Segment Circular Arrow Cycle Template for PowerPoint & Google Slides
Circular
Four-Segment Circular Arrow Cycle Template for PowerPoint & Google Slides
Circular
Six-Segment Circular Arrow Cycle Template for PowerPoint & Google Slides
Circular
Colorful Four-Segment Wheel Chart Template for PowerPoint & Google Slides
Circular
Five-Segment Pentagon Digital Journey Template for PowerPoint & Google Slides
Process
Eight-Segment Key Strengths Diagram Template for PowerPoint & Google Slides
Circular
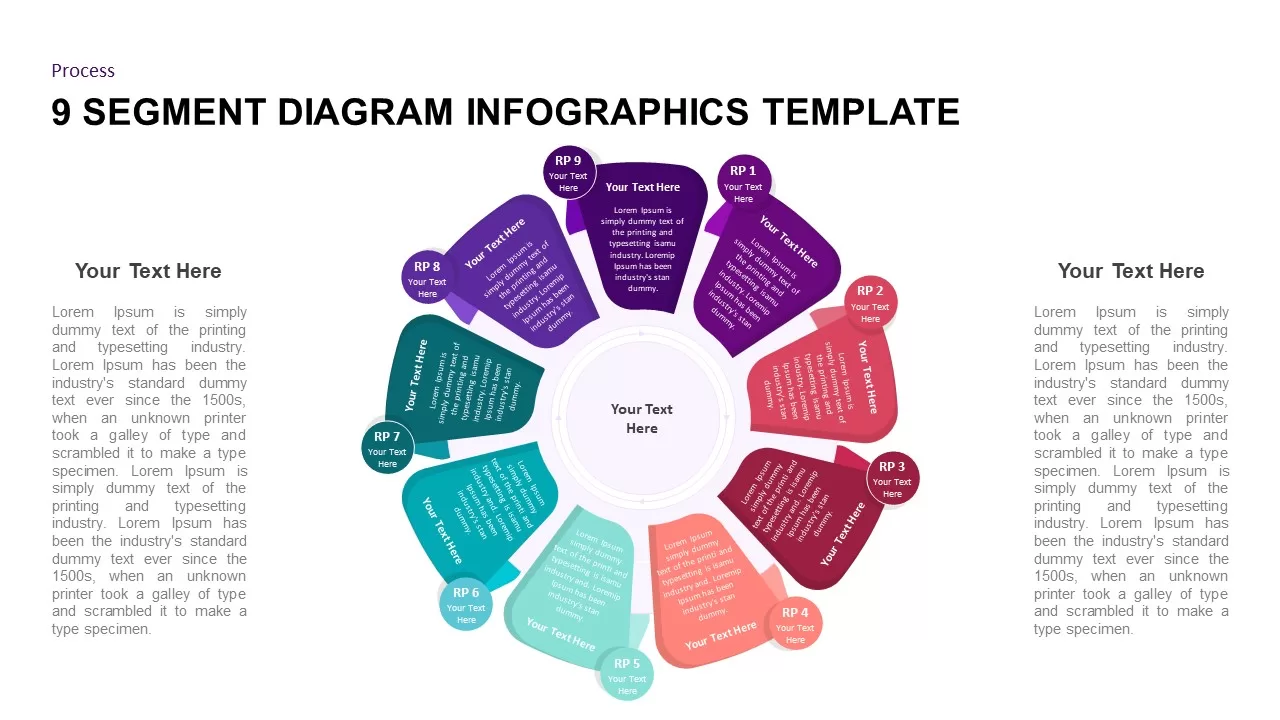
9 Segment Diagram Infographics for PowerPoint & Google Slides
Process
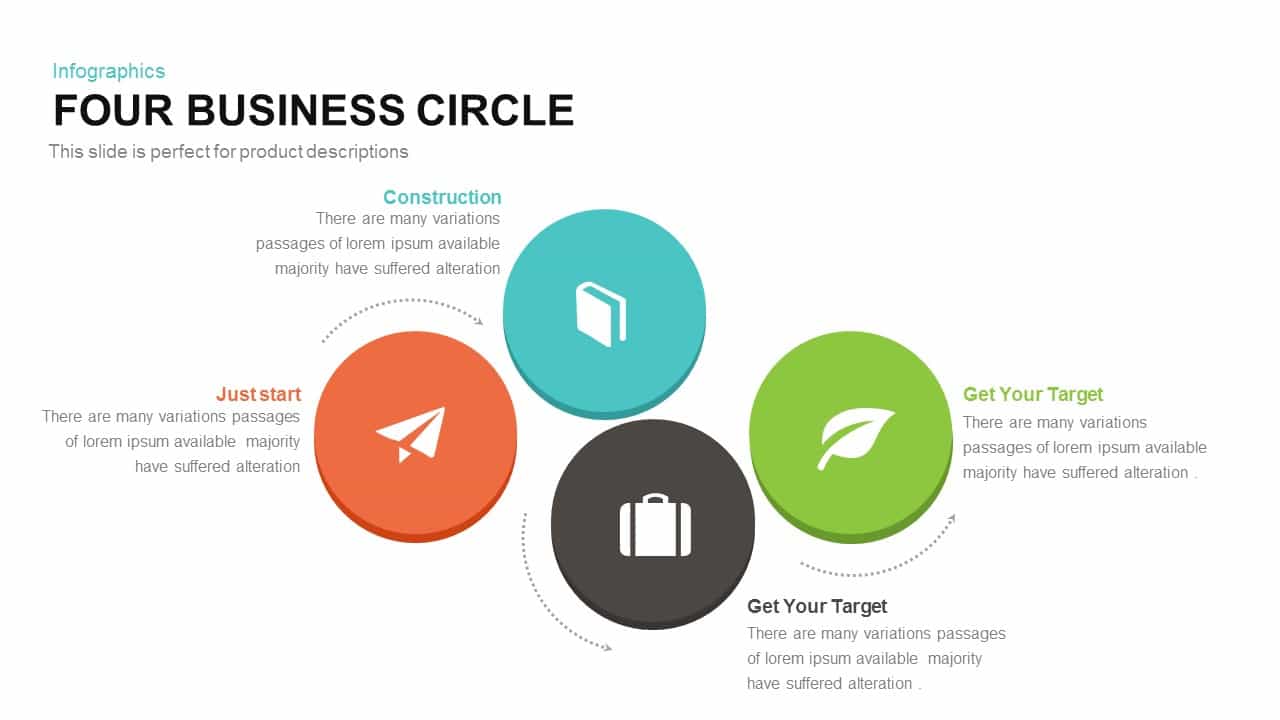
Four-Circle Business Process Infographic Template for PowerPoint & Google Slides
Circular
Three-Circle Diagram Infographic Template for PowerPoint & Google Slides
Circular
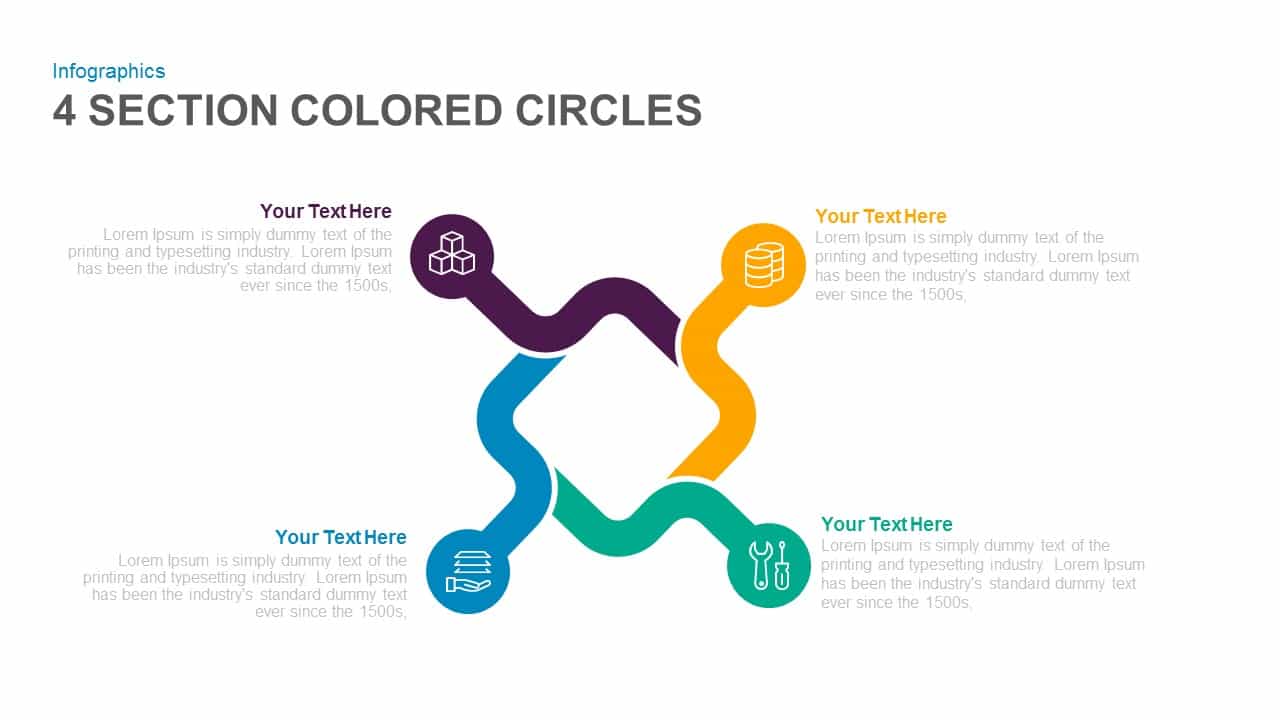
Four-Section Colored Circle Infographic Template for PowerPoint & Google Slides
Circular

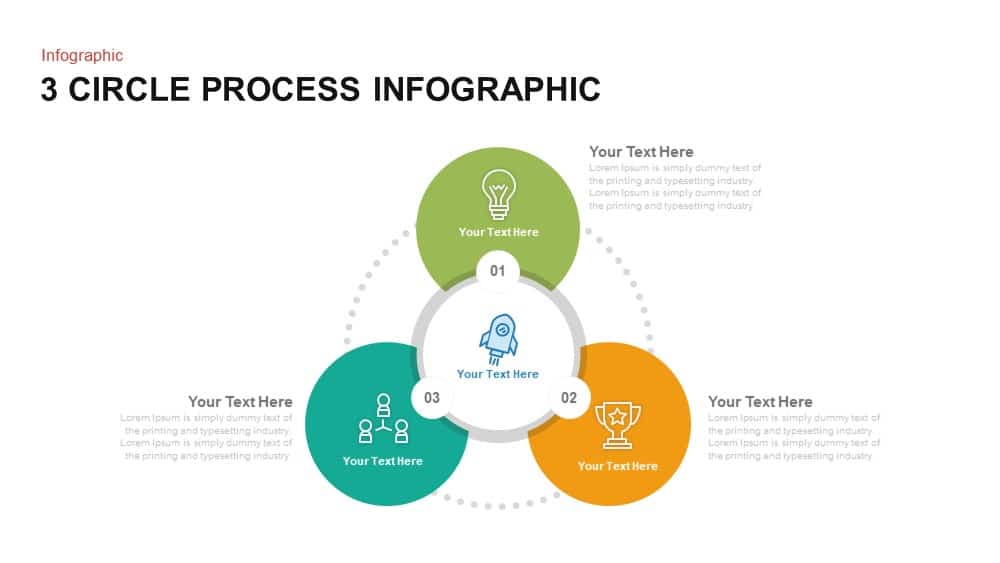
Three-Circle Process Infographic Template for PowerPoint & Google Slides
Circular
Six-Circle Process Infographic Diagram Template for PowerPoint & Google Slides
Circular
Four-Stage Circle Arrow Infographic Template for PowerPoint & Google Slides
Circular
Four-Stage Circle Arrow Infographic Template for PowerPoint & Google Slides
Circular
8 Circle Venn Diagram Infographic Design Template for PowerPoint & Google Slides
Circular
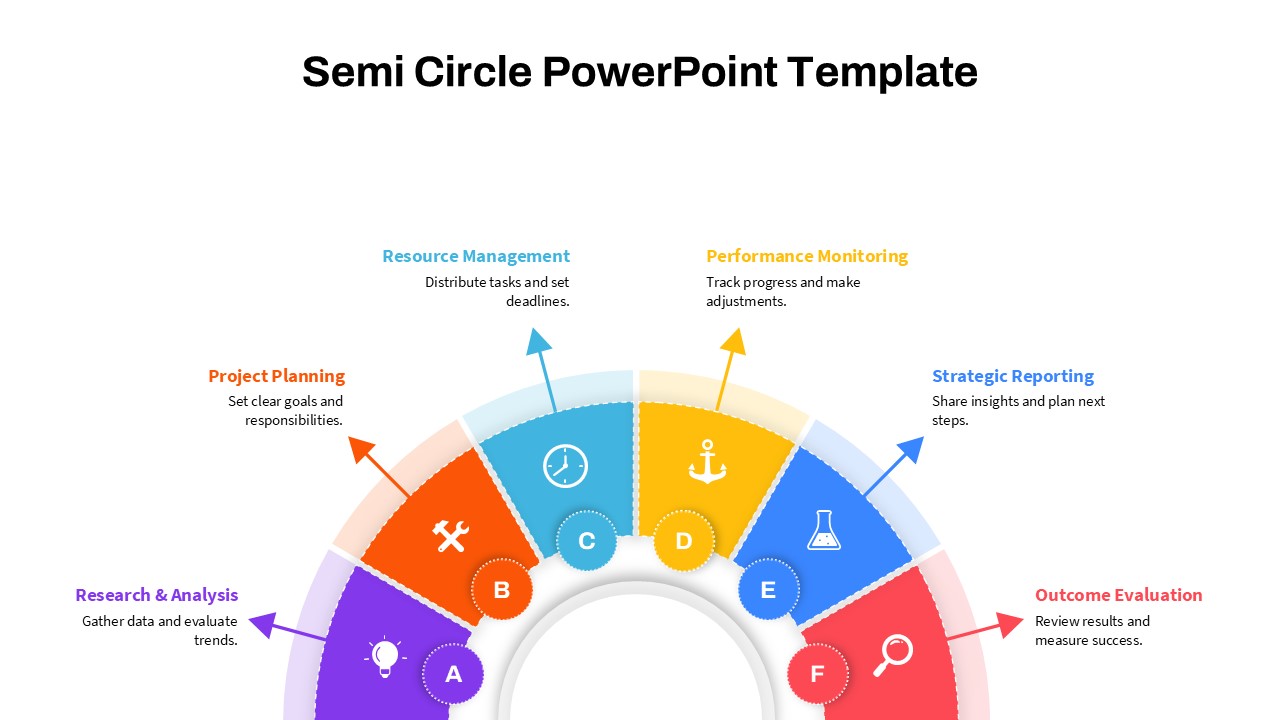
Modern Semi Circle Infographic Template for PowerPoint & Google Slides
Circular

Sales Process Infographic Slides Pack Template for PowerPoint & Google Slides
Process
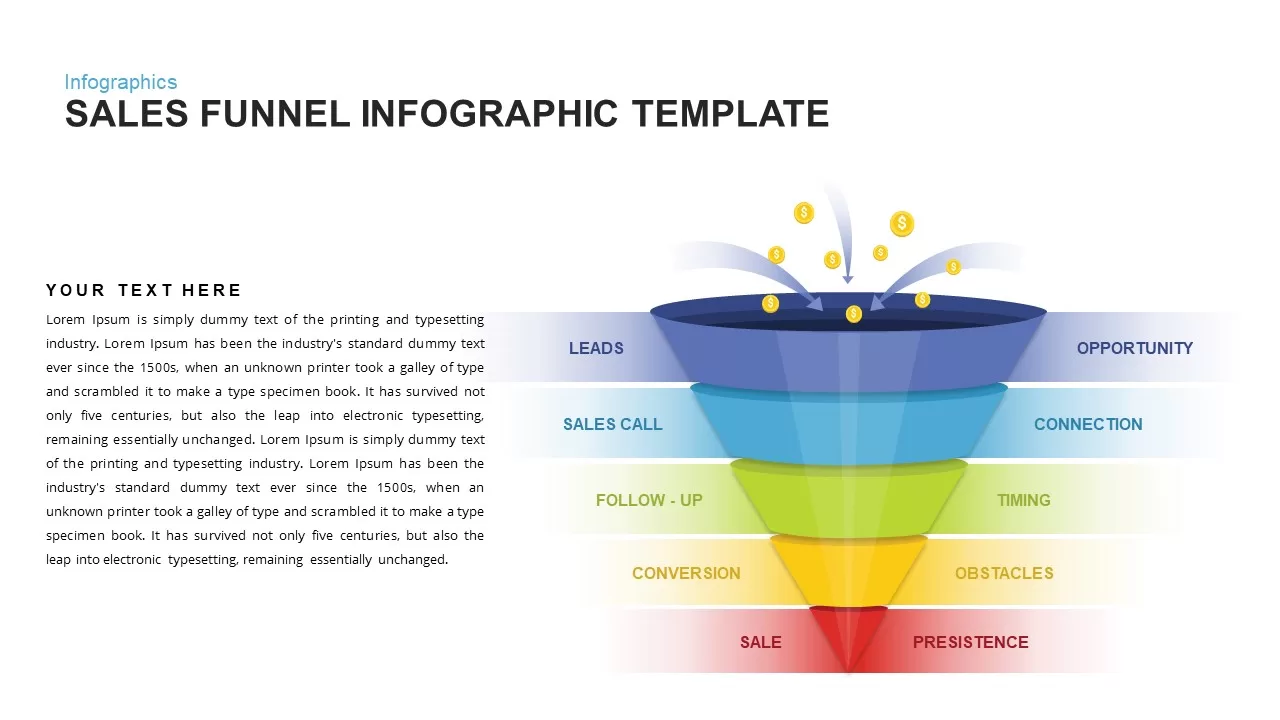
Sales Funnel Infographic Diagram Template for PowerPoint & Google Slides
Funnel
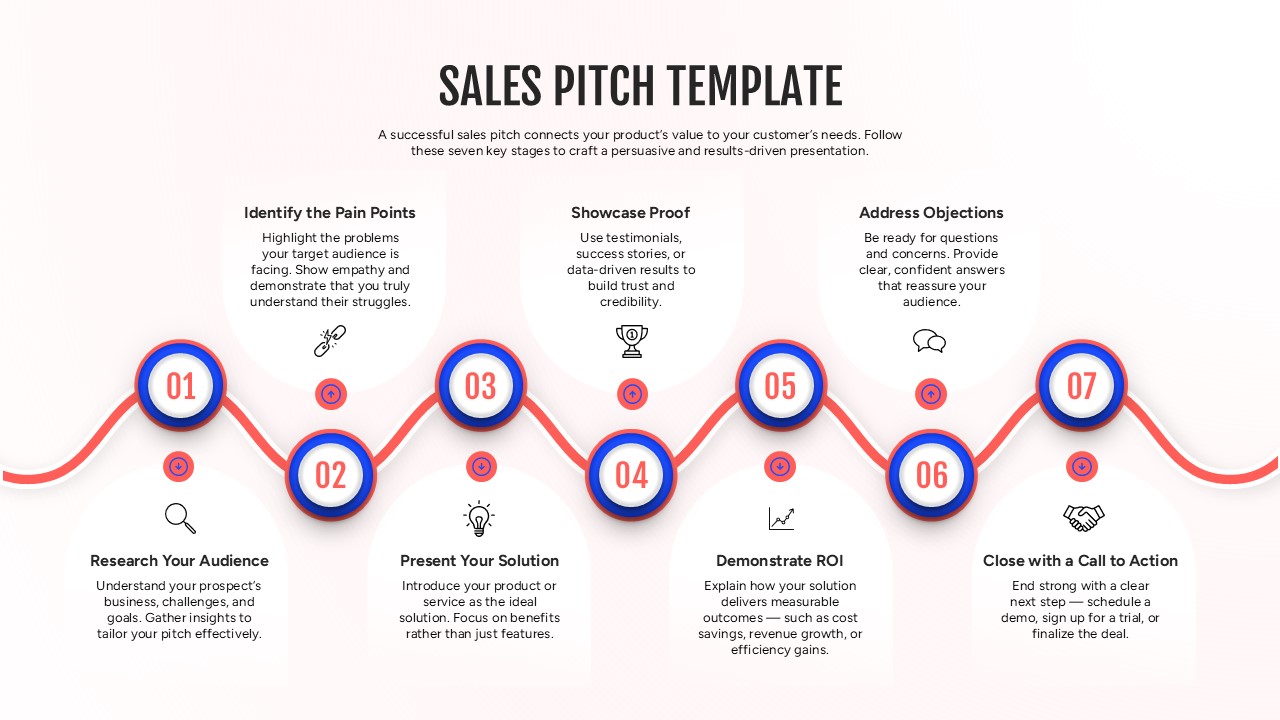
Sales Pitch Roadmap Infographic Template for PowerPoint & Google Slides
Marketing
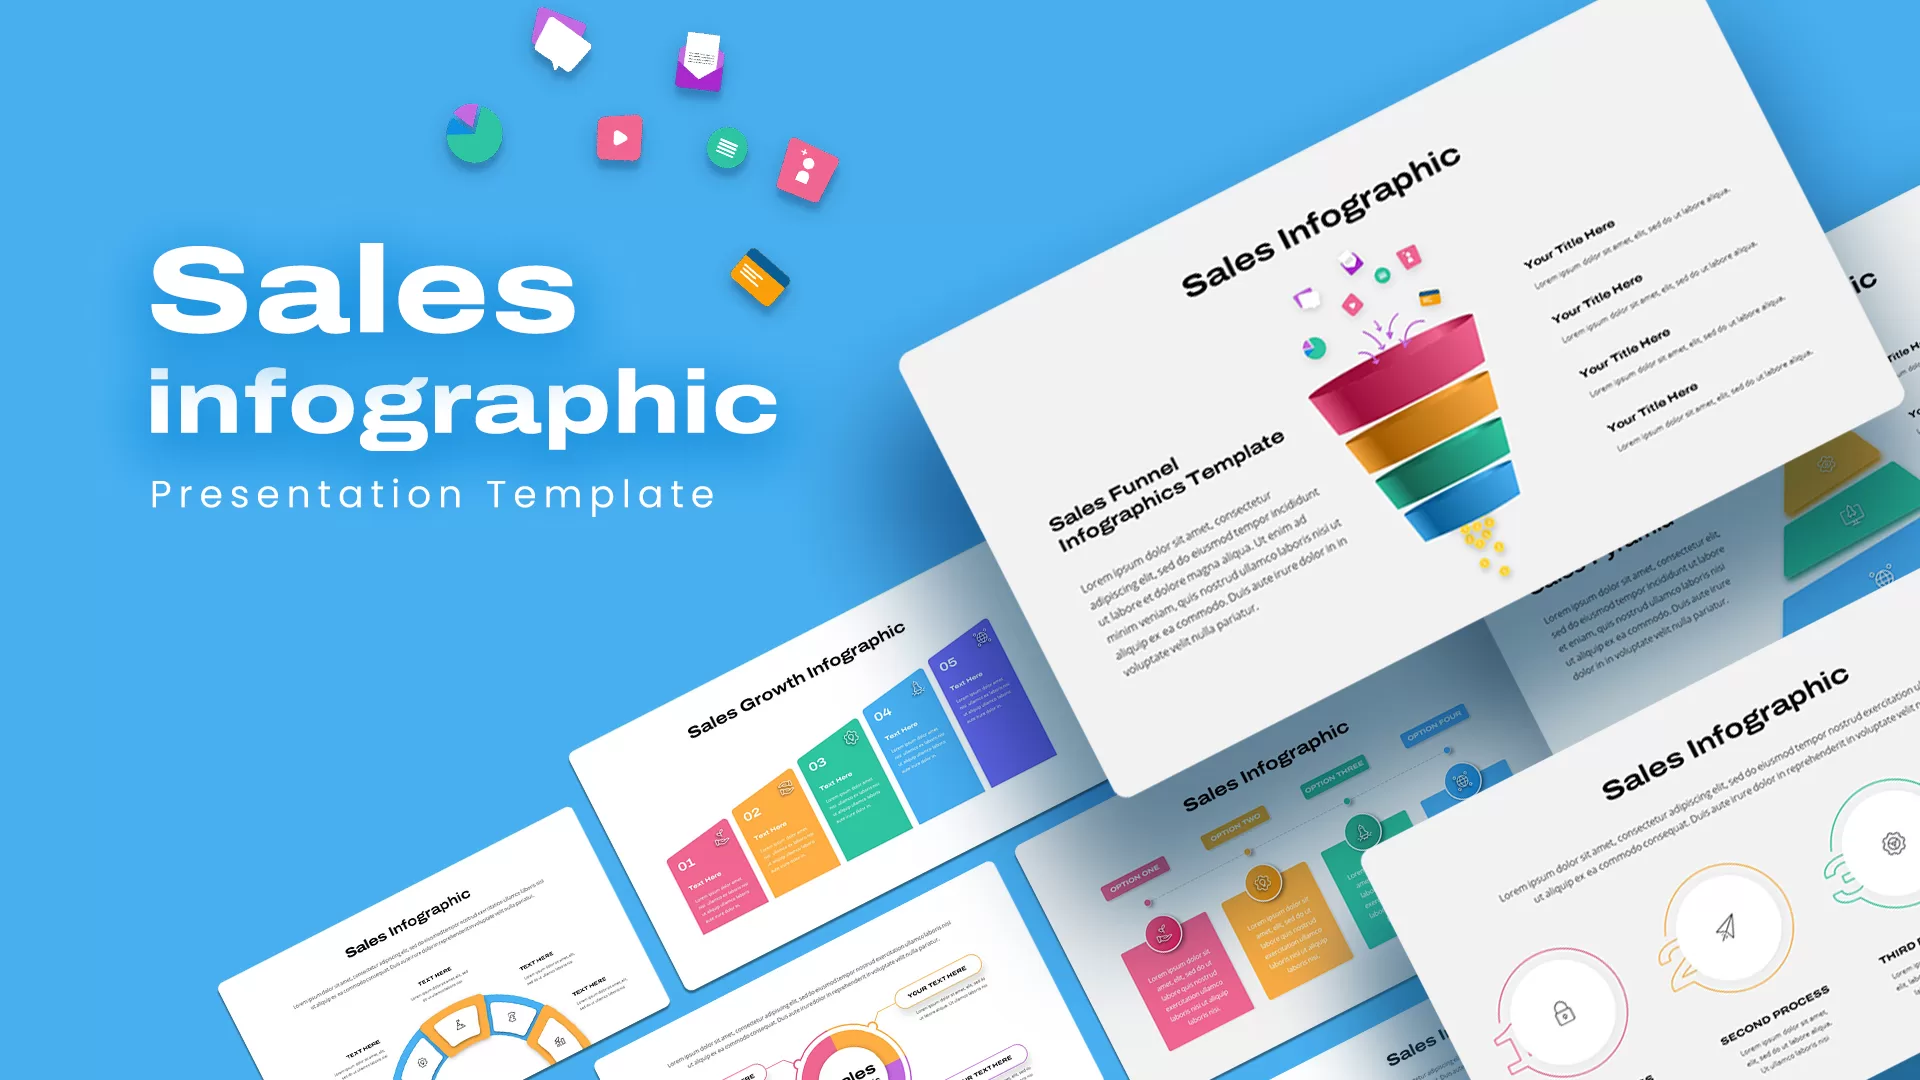
Sales Infographic pack for PowerPoint & Google Slides
Business
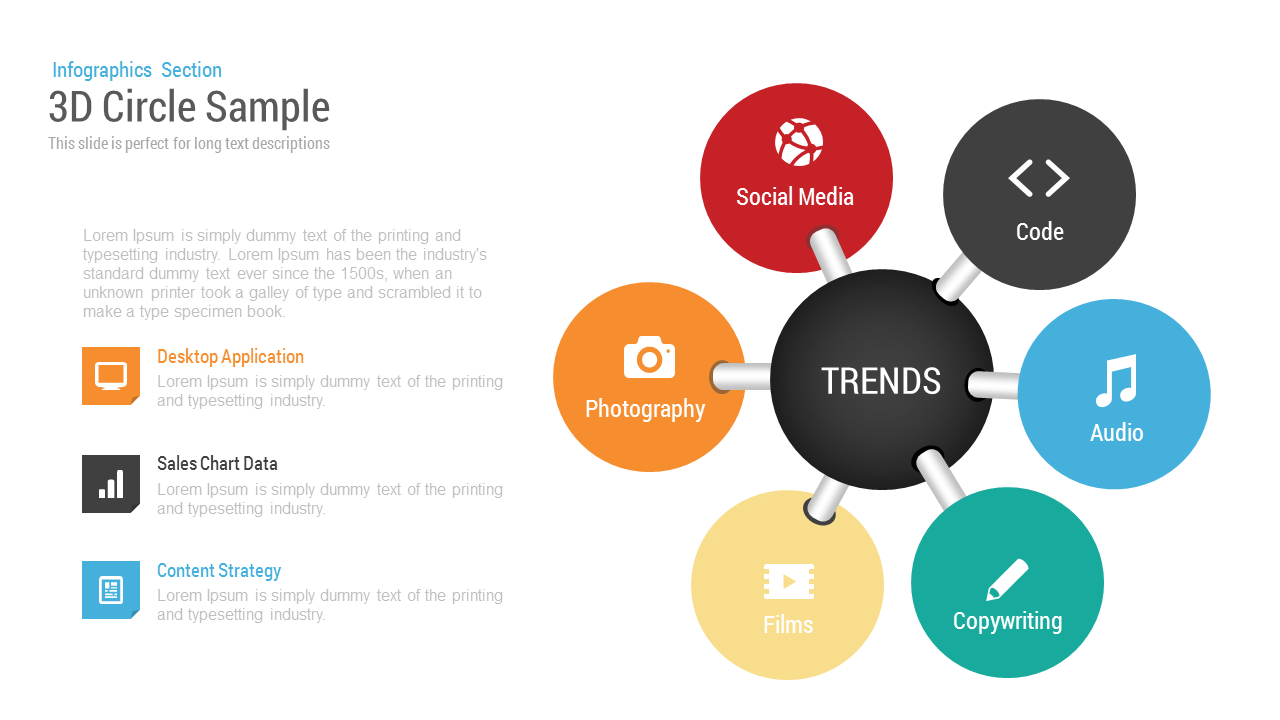
3D Circle Sample template for PowerPoint & Google Slides
Circular
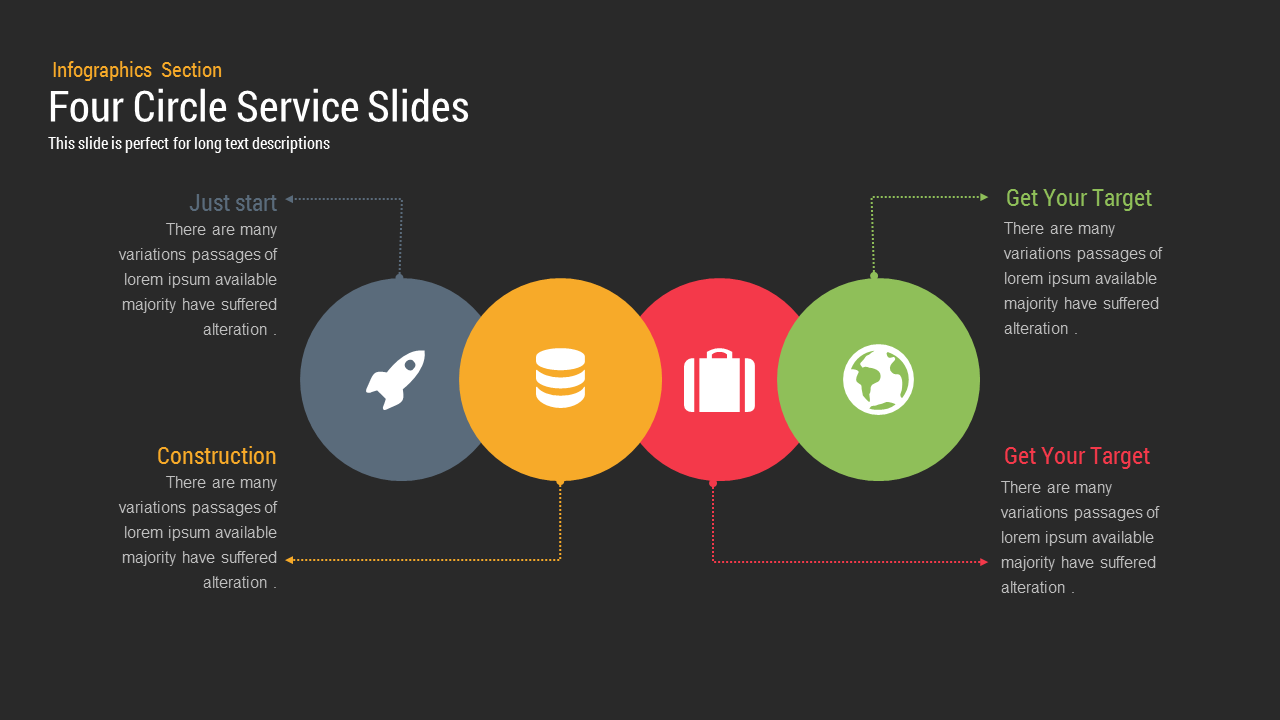
Four Circle Service template for PowerPoint & Google Slides
Process
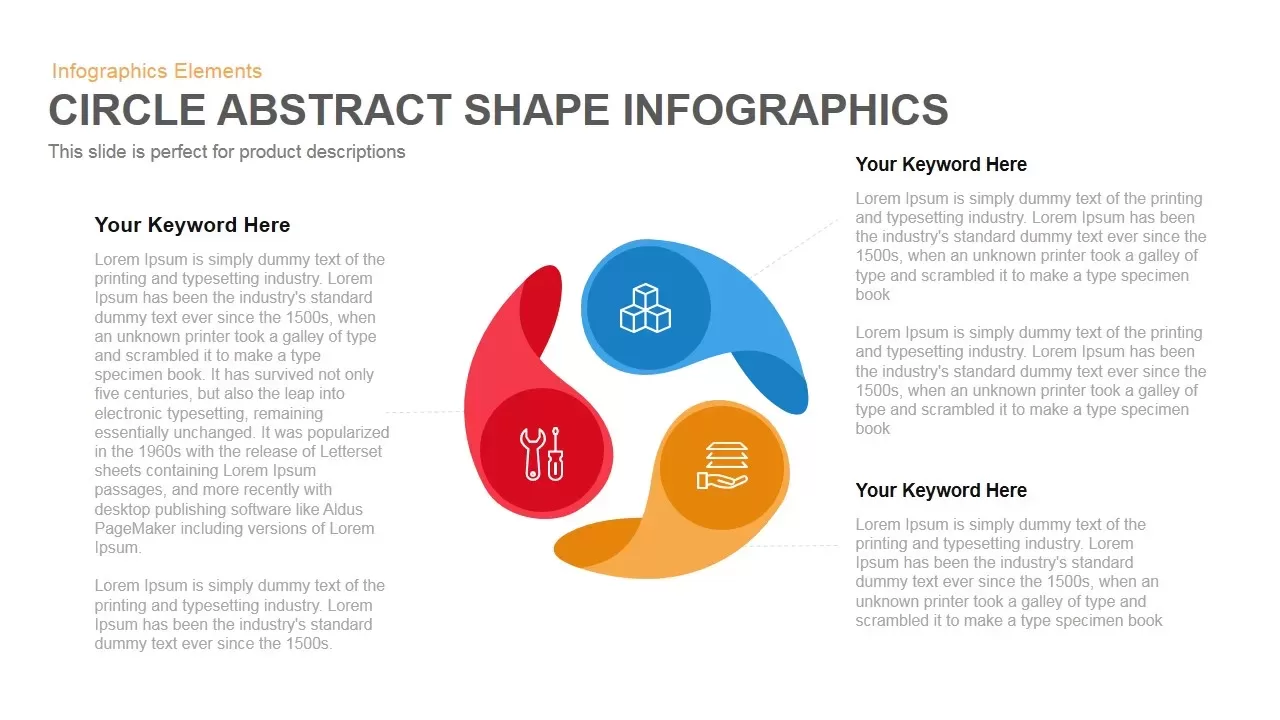
Circle Abstract Shape Infographics Template for PowerPoint & Google Slides
Circular
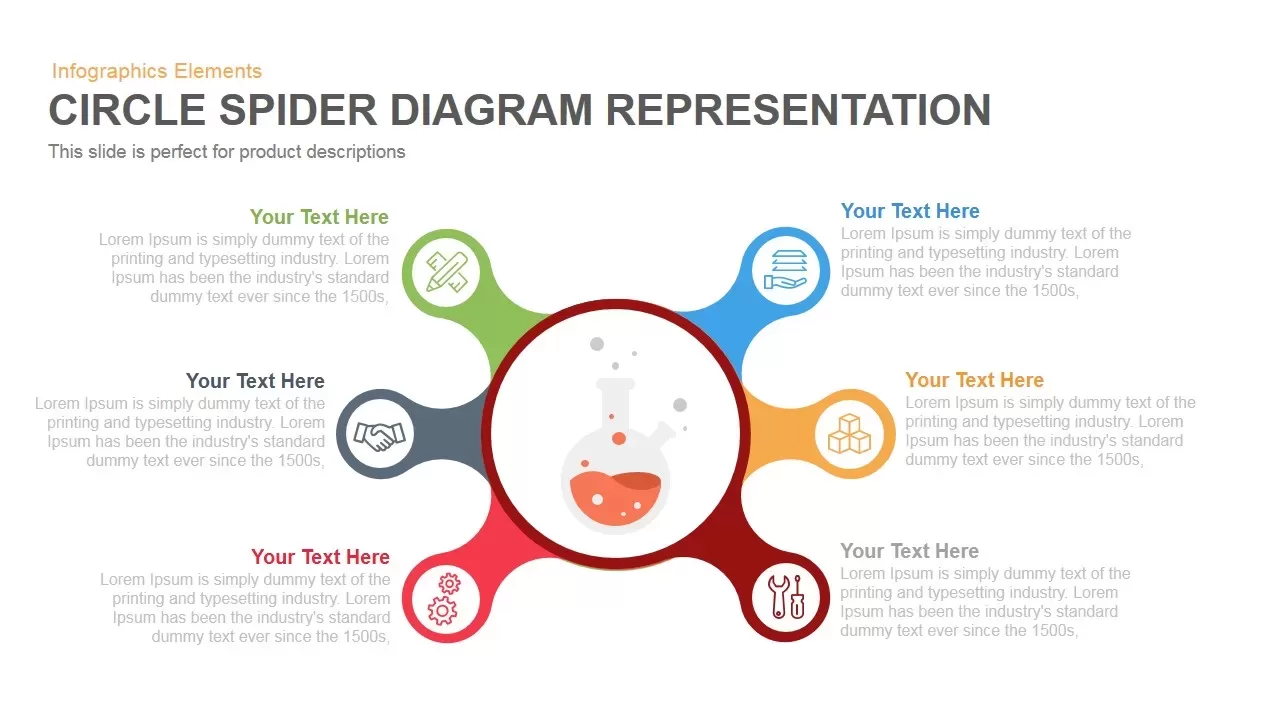
Circle Spider Diagram Representation Template for PowerPoint & Google Slides
Circular
Circle Graph Data Visualization Template for PowerPoint & Google Slides
Circular
Modern Circle SWOT Analysis Diagram Template for PowerPoint & Google Slides
SWOT
Three Circle Arrow Process Diagram template for PowerPoint & Google Slides
Circular
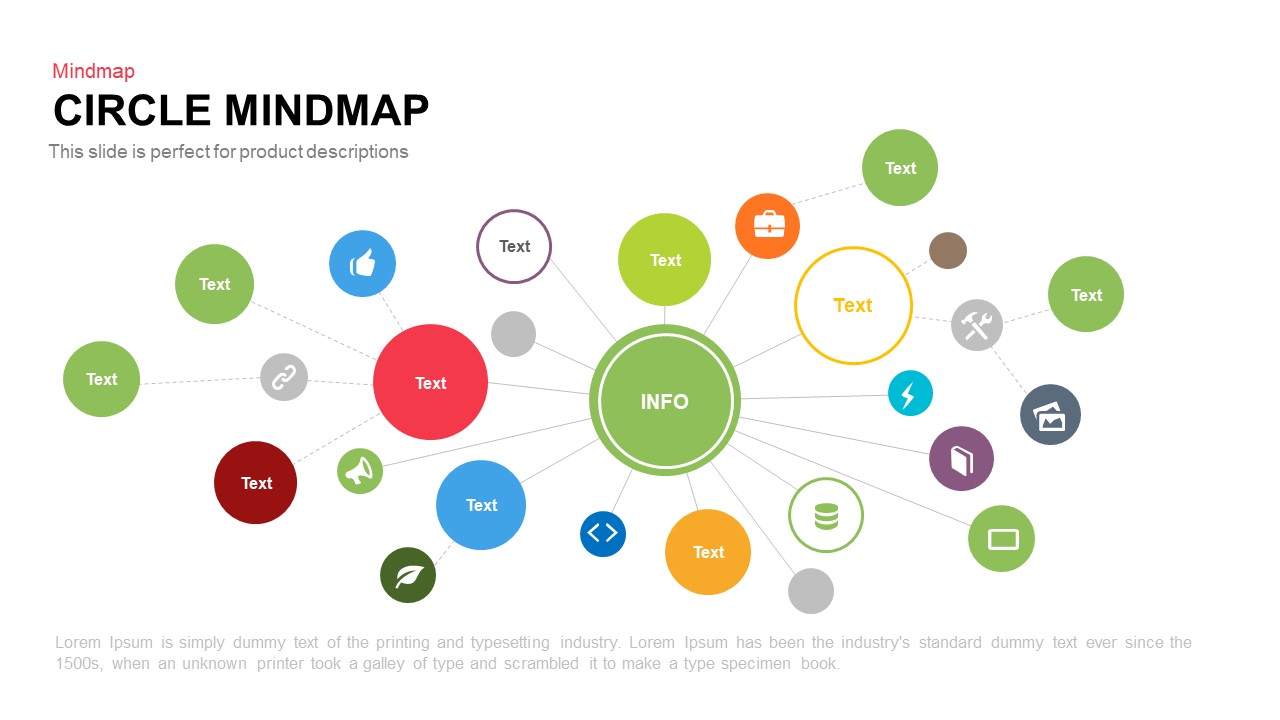
Circle Mindmap template for PowerPoint & Google Slides
Mind Maps

Dynamic Circle Timeline Infographics template for PowerPoint & Google Slides
Timeline
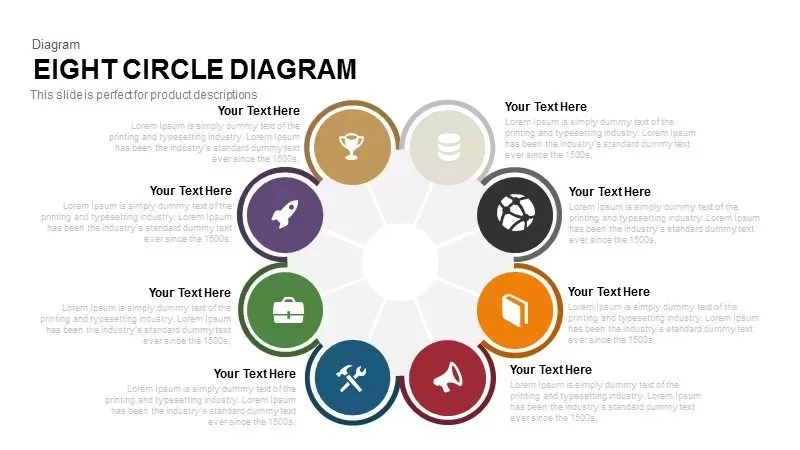
Eight Circle Diagram Template for PowerPoint & Google Slides
Circular
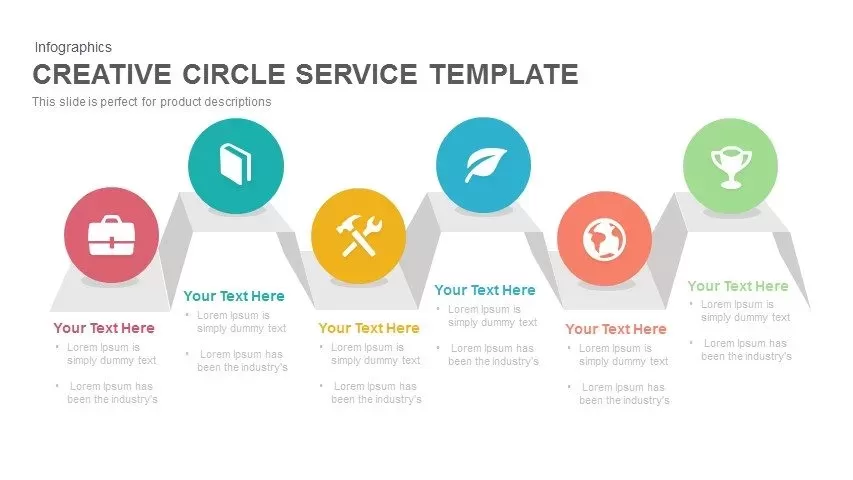
Creative Zigzag Circle Service Steps Template for PowerPoint & Google Slides
Process
Four-Circle Venn Process Diagram template for PowerPoint & Google Slides
Process
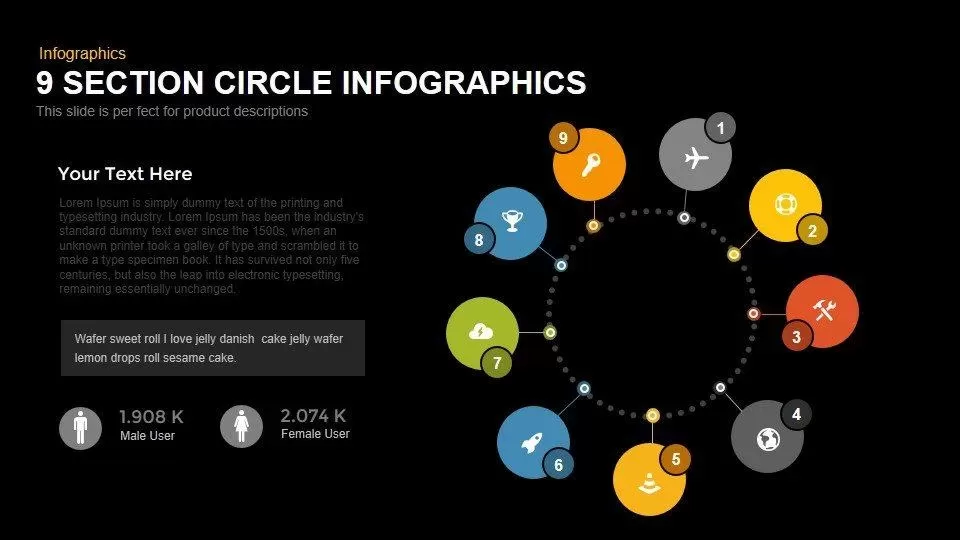
Modern 9-Section Circle Infographics Template for PowerPoint & Google Slides
Circular
Three-Level Sequence Circle Diagram Template for PowerPoint & Google Slides
Circular
Five-Staged Circle Sections Diagram Template for PowerPoint & Google Slides
Circular
Five-Stage Circle Arrow Diagram Template for PowerPoint & Google Slides
Circular
Two-Stage Semi-Circle Diagram Overview Template for PowerPoint & Google Slides
Circular
Modern Multi-Section Circle Diagram Template for PowerPoint & Google Slides
Circular
Four-Circle Hub and Spoke Diagram Template for PowerPoint & Google Slides
Process
Five-Point Circle Timeline Diagram Template for PowerPoint & Google Slides
Timeline
Six-Stage Circle Process Diagram Template for PowerPoint & Google Slides
Process
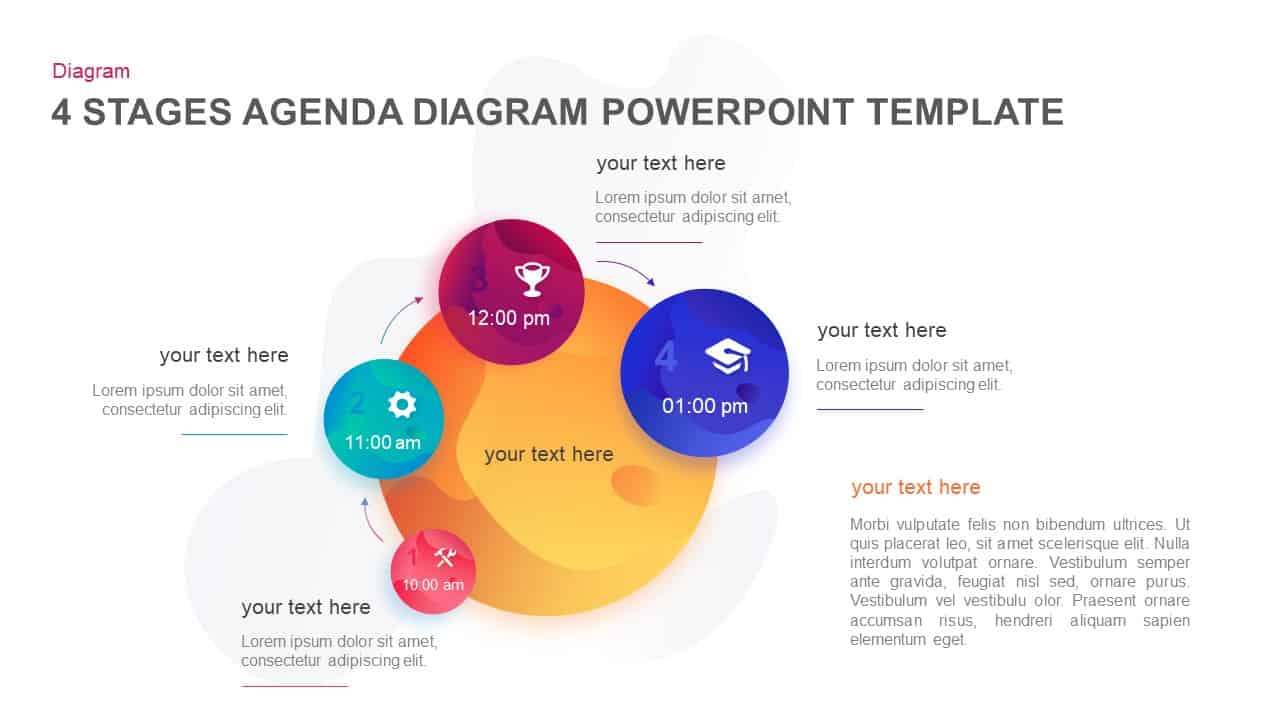
Four-Stage Agenda Circle Diagram Slide Template for PowerPoint & Google Slides
Agenda
Creative Three-Circle Venn Diagram Template for PowerPoint & Google Slides
Comparison
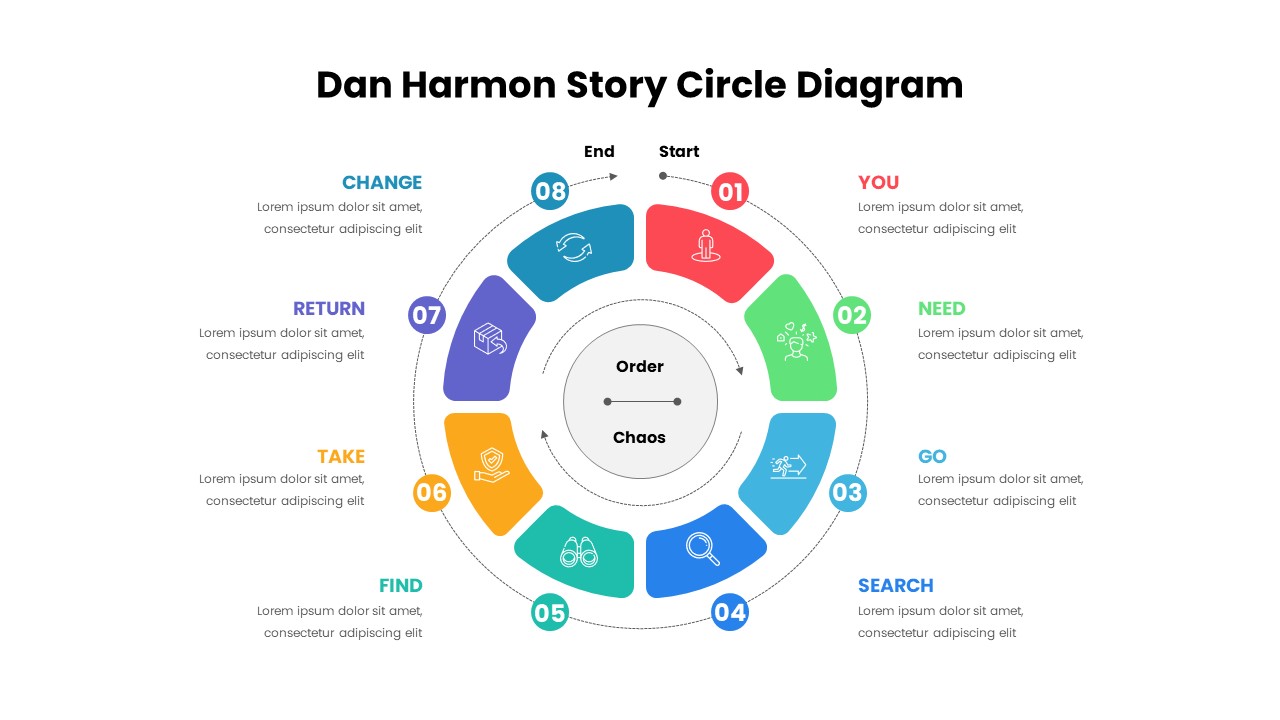
Dan Harmon Story Circle Diagram Template for PowerPoint & Google Slides
Circular
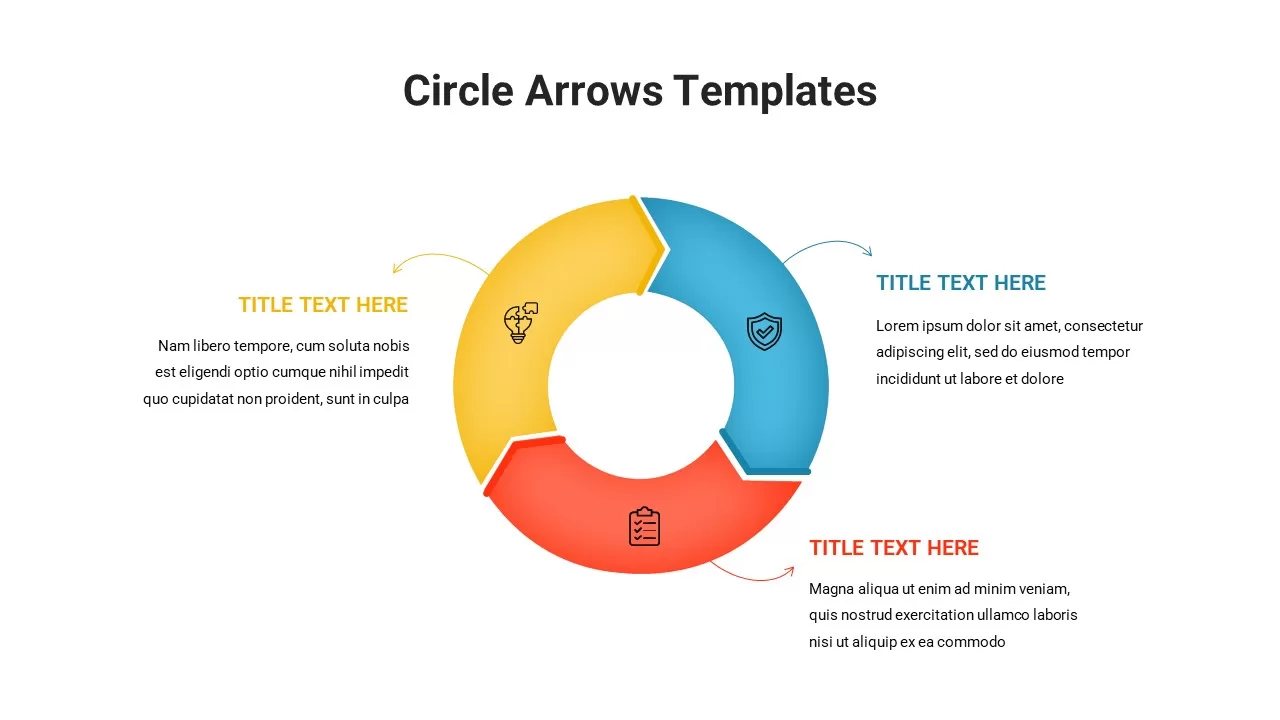
Circle Arrows Diagram template for PowerPoint & Google Slides
Process
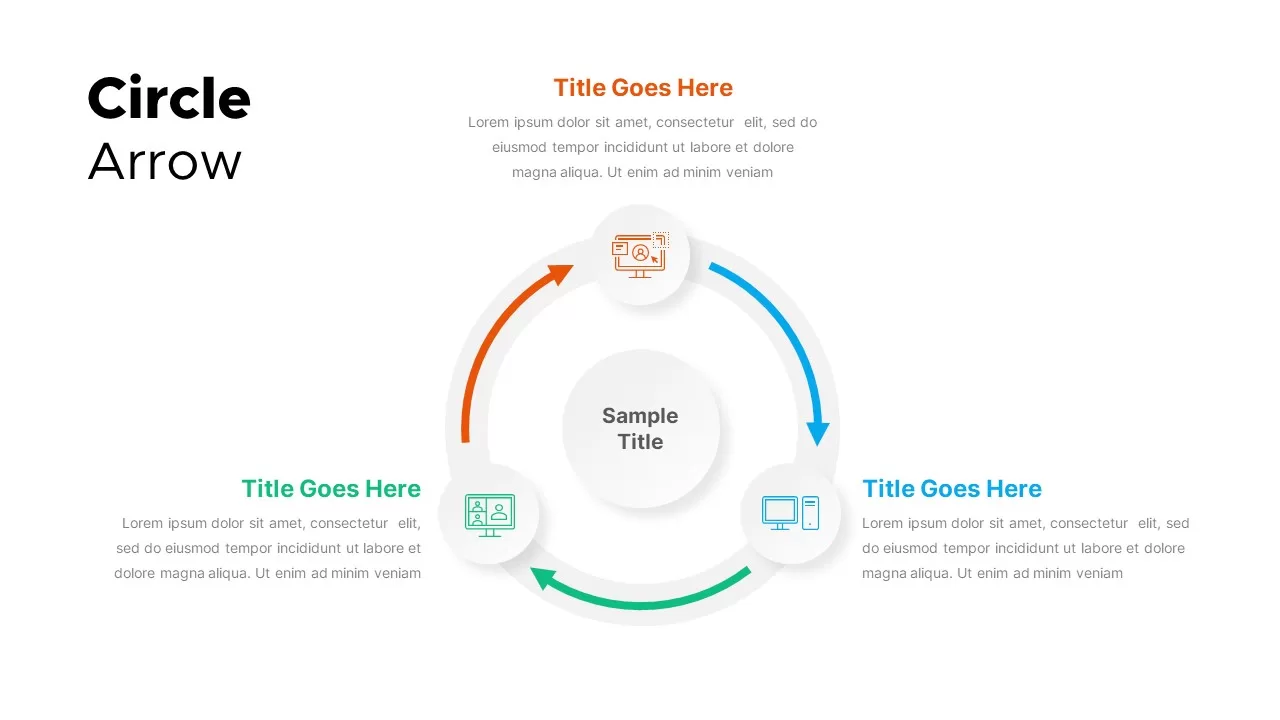
Circle Arrow Process Flow template for PowerPoint & Google Slides
Process
Five Circle Venn Diagram for Template for PowerPoint & Google Slides
Circular
Free Graduation Photo Collage Circle Slide Template for PowerPoint & Google Slides
Decks
Free
Blue Circle Mobile Apps Presentation Template for PowerPoint & Google Slides
Information Technology
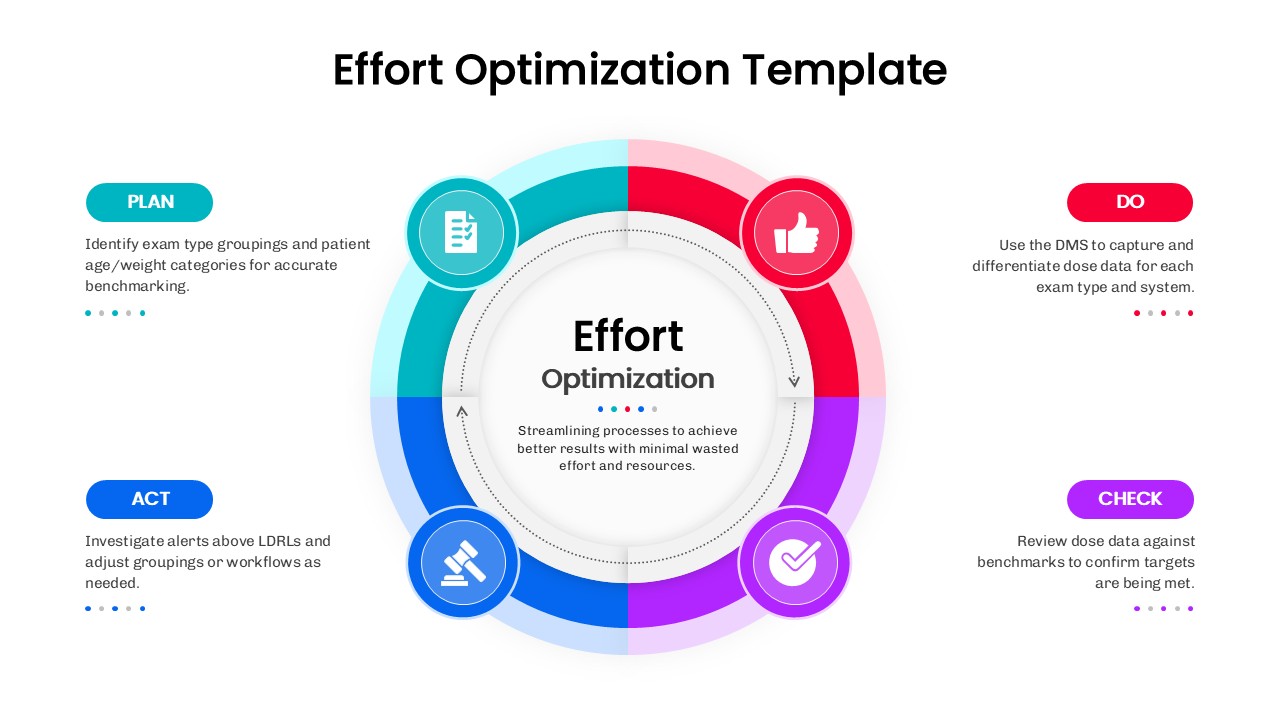
Effort Optimization PDCA Circle Diagram Template for PowerPoint & Google Slides
Circular