
Description
Showcase team performance with a striking circular-image layout paired with clear KPI metrics. A dominant central portrait sits atop a faded collage of supporting imagery in circular masks, creating visual depth and context. To the right, a clean white panel houses three half-donut charts—70%, 85%, and 95%—alongside headline and body text placeholders for concise commentary. Fully built on master slides with vector masks and smart guides, this design lets you swap photos, recolor donut segments, and update text blocks without disturbing alignment. The bright yellow accent unifies the metrics and overlay effects, while the minimalist backdrop ensures your data remains front and center. Optimized for both PowerPoint and Google Slides, the slide maintains pixel-perfect spacing, crisp typography, and seamless responsiveness across devices.
Who is it for
Project managers, marketing leaders, and HR professionals needing to present performance data alongside team visuals. Client-facing consultants, executive sponsors, and dashboard owners can also leverage this layout for stakeholder updates, quarterly reviews, or board presentations.
Other Uses
Beyond performance reporting, repurpose this format for product feature highlights, executive introductions, case-study snapshots, or training progress charts. Swap the donut metrics for conversion rates, survey scores, or budget utilization to adapt the slide across any department or industry.
Login to download this file
No. of Slides
1Item ID
SB03014Rating
0.0
(0 reviews)
Related Templates

Asia Map with KPI Metrics and Legend Template for PowerPoint & Google Slides
World Maps

DevOps KPI Dashboard Performance Metrics Template for PowerPoint & Google Slides
Software Development

Purchasing KPI Metrics Dashboard Template for PowerPoint & Google Slides
Business Report

Procurement KPI Dashboard & Metrics Template for PowerPoint & Google Slides
Business Report

Photo Gallery Team Introduction Layout Template for PowerPoint & Google Slides
Graphics

Dark Photo Collage Gallery Layout Template for PowerPoint & Google Slides
Graphics

iPad App Mockup with Progress Metrics Template for PowerPoint & Google Slides
Bar/Column

Bubble Head Metrics Infographic Template for PowerPoint & Google Slides
Circular

Circle Segment Sales Metrics Infographic Template for PowerPoint & Google Slides
Circular

Social Media Metrics template for PowerPoint & Google Slides
Comparison Chart

Mobile Usage Metrics template for PowerPoint & Google Slides
Comparison Chart

Scale Metaphor Metrics Comparison Template for PowerPoint & Google Slides
Charts

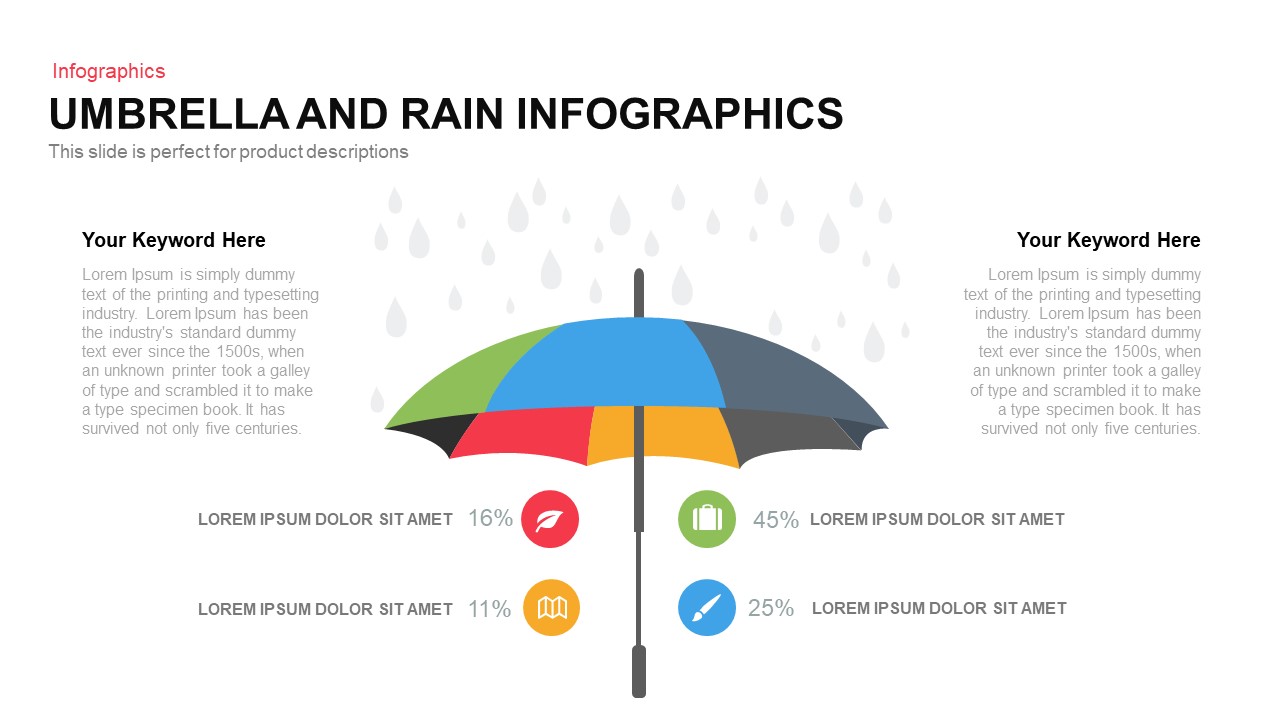
Umbrella and Rain Infographic Metrics Template for PowerPoint & Google Slides
Comparison

Comprehensive Recruitment Metrics Report Template for PowerPoint & Google Slides
Recruitment

Colorful Block Infographic Metrics Slide Template for PowerPoint & Google Slides
Infographics

Benchmarking Metrics Comparison Slide Template for PowerPoint & Google Slides
Pie/Donut

Project Status Dashboard with Metrics Template for PowerPoint & Google Slides
Project Status

Statistics & Global Metrics Infographic Template for PowerPoint & Google Slides
Bar/Column

Agriculture Infographics Slide with Progress Rings & Metrics Template for PowerPoint & Google Slides
Pie/Donut

Annual Recurring Revenue Metrics Template for PowerPoint & Google Slides
Bar/Column

Social Media Analysis Metrics Slide Deck Template for PowerPoint & Google Slides
Digital Marketing

LinkedIn Metrics Infographic Slide Template for PowerPoint & Google Slides
Digital Marketing

Facebook Social Metrics Infographic Template for PowerPoint & Google Slides
Graphics

Instagram Infographic Metrics Slide Template for PowerPoint & Google Slides
Marketing

Mastodon Metrics Infographic Dashboard Template for PowerPoint & Google Slides
Business Report

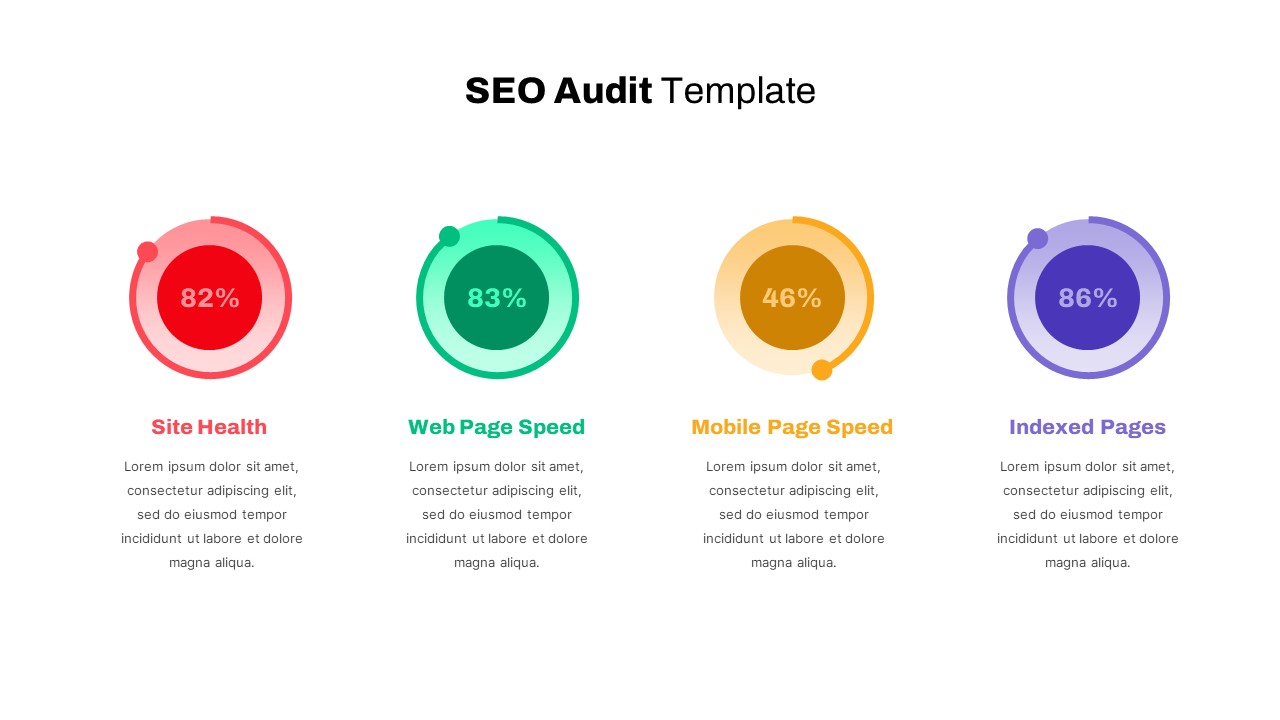
Detailed SEO Audit Metrics Overview Template for PowerPoint & Google Slides
Circular

Free Editable U.S. Map with Regional Metrics Template for PowerPoint & Google Slides
World Maps
Free

Community Outreach Impact Metrics Template for PowerPoint & Google Slides
Accomplishment

Financial Snapshot & Metrics Overview Template for PowerPoint & Google Slides
Finance

Market Validation Metrics Overview Template for PowerPoint & Google Slides
Business

Employee Performance Metrics Dashboard Template for PowerPoint & Google Slides
Employee Performance

Pirate Metrics AARRR Funnel Framework Template for PowerPoint & Google Slides
Funnel

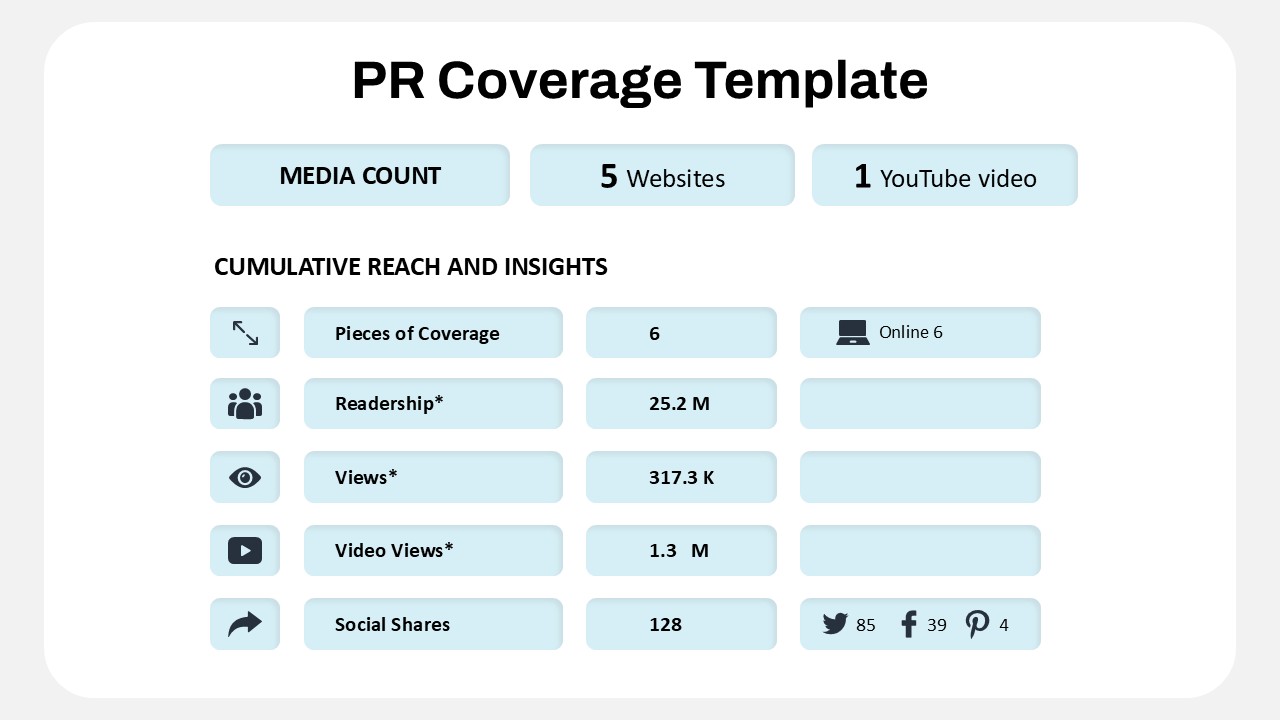
Public Relations Coverage Metrics Template for PowerPoint & Google Slides
Business Report

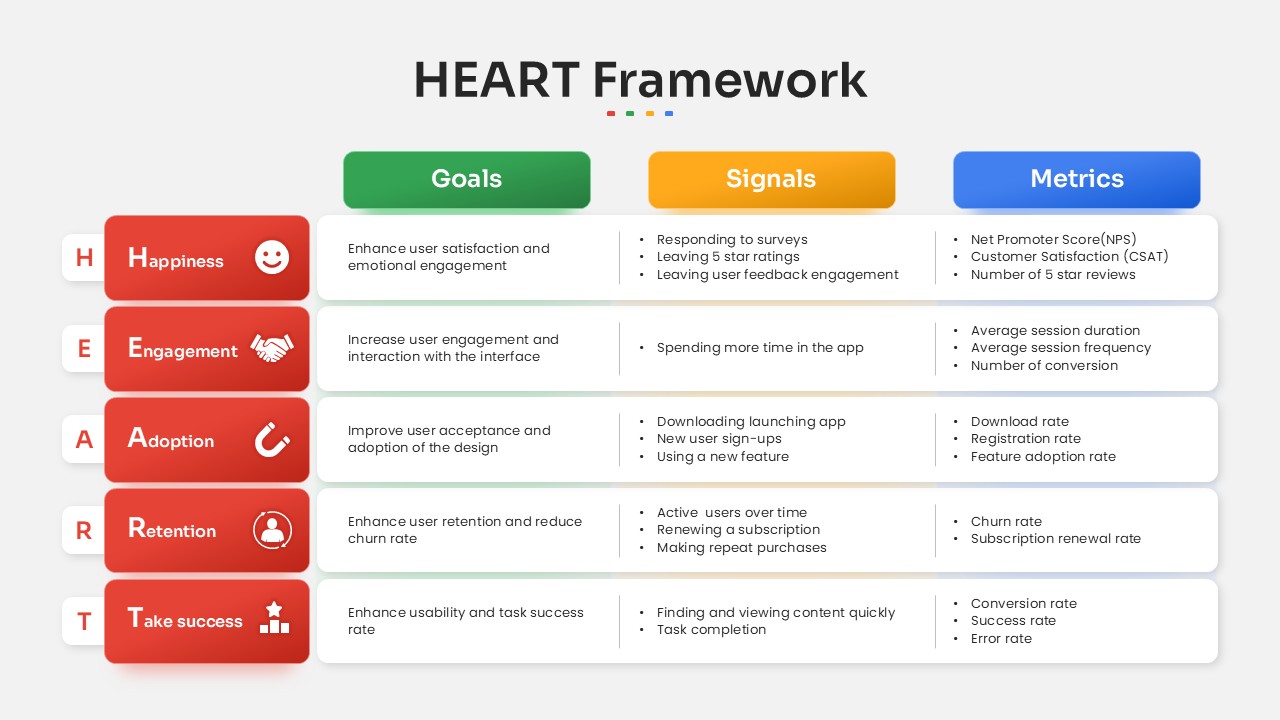
HEART Framework Goals, Signals & Metrics Template for PowerPoint & Google Slides
Process

Free KPI Dashboard PowerPoint Template for PowerPoint & Google Slides
Charts
Free

Efficiency KPI Dashboard Metaphor Template for PowerPoint & Google Slides
Infographics

Application Revenue Line Chart KPI Template for PowerPoint & Google Slides
Revenue

Sales Growth Dashboard: KPI Gauge & Line Template for PowerPoint & Google Slides
Revenue

Performance KPI Dashboard Slide Template for PowerPoint & Google Slides
Business Report

KPI Dashboard template for PowerPoint & Google Slides
Business Report

KPI Dashboard Overview template for PowerPoint & Google Slides
Finance

KPI Dashboard Data Visualization Template for PowerPoint & Google Slides
Bar/Column

KPI Dashboard Data Overview Slide Template for PowerPoint & Google Slides
Bar/Column

Professional Team Collage & KPI Slide Template for PowerPoint & Google Slides
Business

Statistics Infographic & KPI Bar Chart Template for PowerPoint & Google Slides
Bar/Column

Monthly Recurring Revenue KPI Bar Chart Template for PowerPoint & Google Slides
Bar/Column

Customer Satisfaction KPI Dashboard Template for PowerPoint & Google Slides
Customer Experience

Free Balanced Scorecard Quadrant KPI Layout Template for PowerPoint & Google Slides
Employee Performance
Free

Michigan County Map with KPI Dashboard Template for PowerPoint & Google Slides
World Maps

Comprehensive Release & Deployment KPI Template for PowerPoint & Google Slides
Software Development

Three Segment Donut Chart KPI Infographic Template for PowerPoint & Google Slides
Pie/Donut

4DX Scoreboard KPI Gauge Dashboard Template for PowerPoint & Google Slides
Business Strategy

KPI Tree OEE Breakdown Template for PowerPoint & Google Slides Presentations
Infographics

Year in Review KPI Highlights Slide for PowerPoint & Google Slides
Business Report

Patient-Satisfaction KPI Dashboard for PowerPoint & Google Slides
Business

Creative Brush Stroke Image Layouts Template for PowerPoint & Google Slides
Decks

Modern Image-Based Organizational Chart Template for PowerPoint & Google Slides
Infographics

Wavy Timeline with Image Highlights Template for PowerPoint & Google Slides
Timeline

Top 10 Step-by-Step Image & Text Layouts Template for PowerPoint & Google Slides
Graphics

8 Steps Circular Process Diagram Template for PowerPoint & Google Slides
Process

Light Bulb Idea Circular Diagram Template for PowerPoint & Google Slides
Infographics

Eight-Stage Circular Process Infographic Template for PowerPoint & Google Slides
Circular

Circular Improvement Process Diagram Template for PowerPoint & Google Slides
Process

Six-Stage Circular Cycle Diagram Template for PowerPoint & Google Slides
Process

8-Step Circular Arrow Diagram Template for PowerPoint & Google Slides
Arrow

PEST Analysis Circular Diagram Template for PowerPoint & Google Slides
PEST

Four-Stage Circular Process Flow Template for PowerPoint & Google Slides
Process

4 Staged Circular Business Process Diagram template for PowerPoint & Google Slides
Process

3, 4 & 5 Circular Stages Cycle Diagram Deck Template for PowerPoint & Google Slides
Circular

Three to Six Staged Circular Diagram Template for PowerPoint & Google Slides
Process

Industry 4.0 Roadmap Circular Ring Template for PowerPoint & Google Slides
Roadmap

Modern Colorful Circular Org Chart Template for PowerPoint & Google Slides
Org Chart

Six-Stage Circular Diagram Process Template for PowerPoint & Google Slides
Circular

Five Stage Circular Arrow Diagram Template for PowerPoint & Google Slides
Process

Five-Step Circular Process Diagram Template for PowerPoint & Google Slides
Circular

Circular CRM Process Diagram Infographic Template for PowerPoint & Google Slides
Circular

Circular Market Drivers Infographic Template for PowerPoint & Google Slides
Circular

8-Stage Chevron Circular Diagram Template for PowerPoint & Google Slides
Process

Agile Lifecycle Circular Diagram Template for PowerPoint & Google Slides
Circular

3 & 4 Step Circular Process Infographic Template for PowerPoint & Google Slides
Process

Circular Product Comparison Chart Template for PowerPoint & Google Slides
Comparison Chart

Circular Balanced Scorecard Infographic Template for PowerPoint & Google Slides
Business Strategy

Circular SWOT Analysis Infographic Template for PowerPoint & Google Slides
SWOT

Free Five-Step Circular Timeline Infographic Template for PowerPoint & Google Slides
Timeline
Free

Six-Segment Circular Arrow Cycle Template for PowerPoint & Google Slides
Circular

Circular Arrows Process Flow template for PowerPoint & Google Slides
Process

Circular Arrows Process Flow template for PowerPoint & Google Slides
Process

Ten-Step Circular Process Infographic Template for PowerPoint & Google Slides
Circular

10-Step Colorful Circular Diagram Template for PowerPoint & Google Slides
Circular

Circular Organizational Structure Layout Template for PowerPoint & Google Slides
Org Chart

Circular Revenue Generation Diagram Template for PowerPoint & Google Slides
Revenue

Circular Timeline Infographic Template for PowerPoint & Google Slides
Timeline

Free Cloud Computing Six-Step Circular Template for PowerPoint & Google Slides
Cloud Computing
Free

HROps Hub and Spoke Circular Diagram Template for PowerPoint & Google Slides
Circular

Circular Service Offering Diagram Template for PowerPoint & Google Slides
Circular

Impact Assessment Circular Diagram Template for PowerPoint & Google Slides
Circular

Core Competency Analysis Circular Template for PowerPoint & Google Slides
Circular

AI in E-Commerce Circular Infographic Template for PowerPoint & Google Slides
AI

Omnichannel Strategy Circular Diagram Template for PowerPoint & Google Slides
Digital Marketing

Strategy Development Process Circular Diagram Template for PowerPoint & Google Slides
Business Strategy


