Asia Map with KPI Metrics and Legend Template for PowerPoint & Google Slides


Description
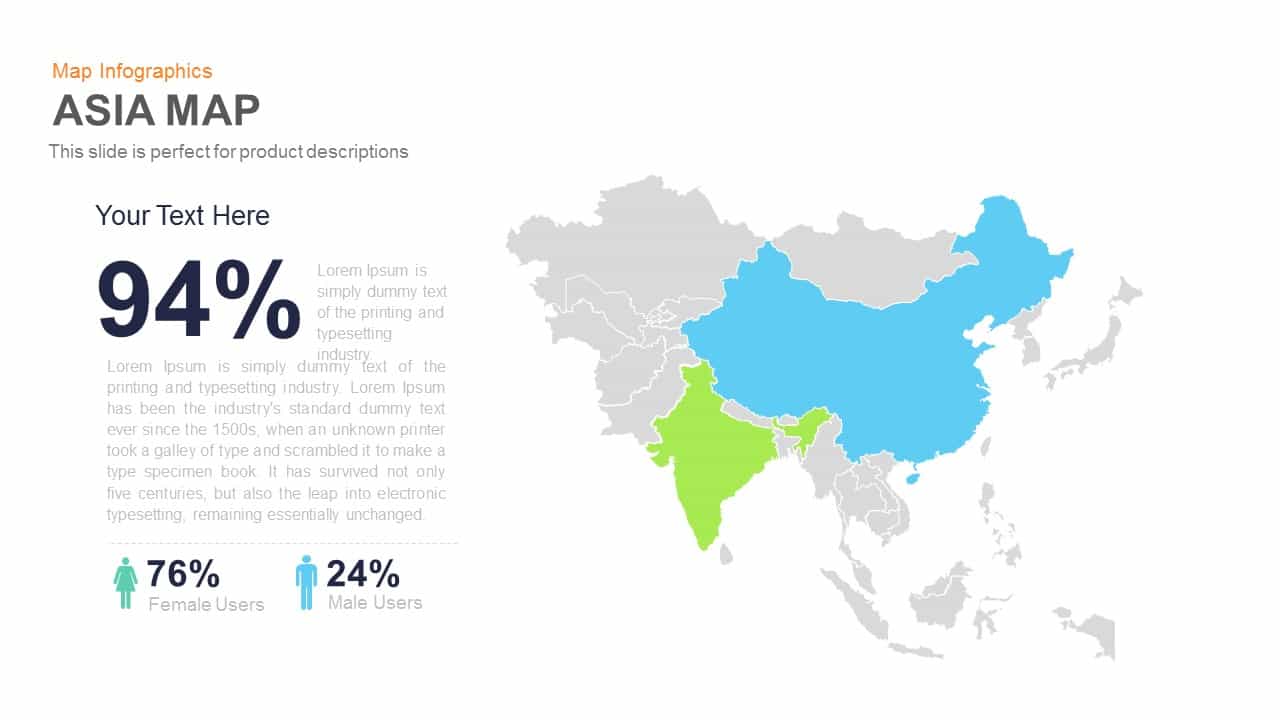
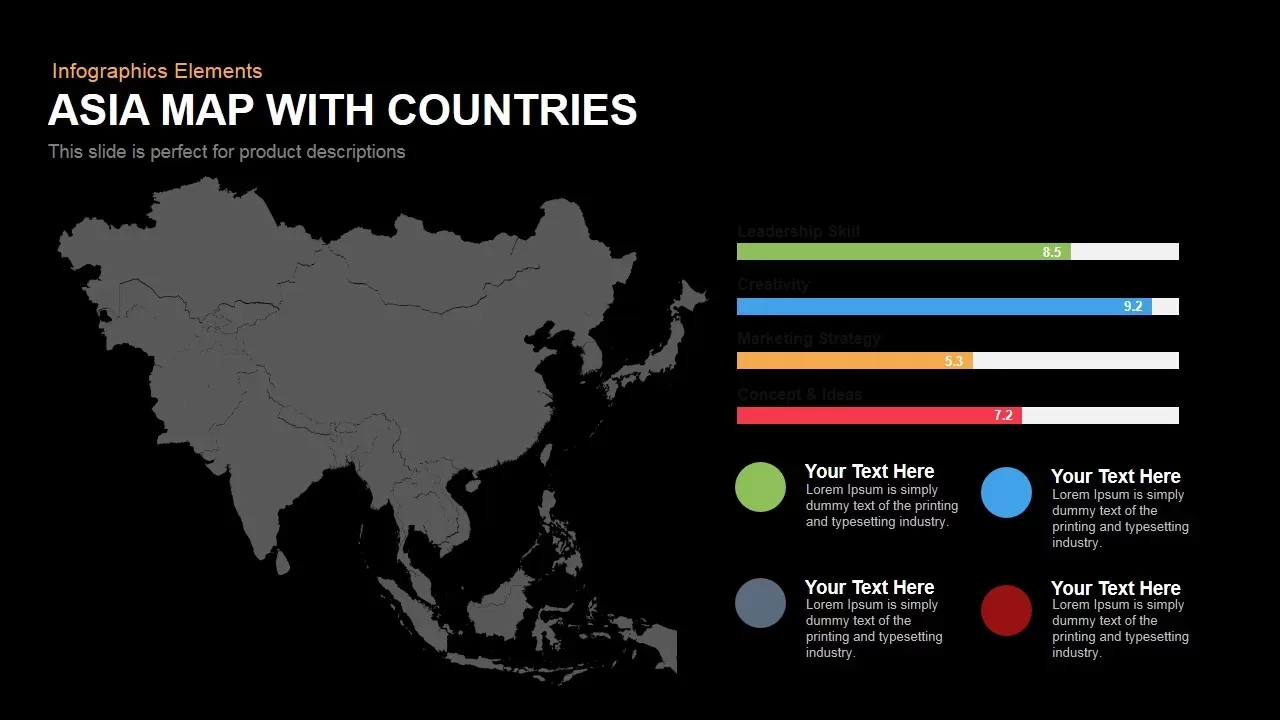
Leverage this versatile Asia map infographic slide to highlight regional performance and insights with clarity and style. On the left, a high-resolution grayscale map of Asia with subtle country boundaries sets a geographic context, while semi-transparent circular navigation arrows on the margins hint at carousel-style walkthroughs. To the right, four horizontal progress bars present essential metrics—Leadership Skill (8.5), Creativity (9.2), Marketing Strategy (5.3), and Concept & Ideas (7.2)—each accentuated in green, blue, orange, and red against light gray tracks for immediate visual comparison across dimensions.
Directly below the metrics, four matching colored circles serve as a customizable legend. Pair each accent hue with descriptive text placeholders to identify data segments, service categories, or regional highlights. The flat design aesthetic, combined with balanced white space and clean typography, ensures readability and a professional appearance on any display size.
Built for rapid customization, this slide leverages master slide functionality and fully editable vector shapes, allowing you to adjust map details, bar percentages, color palettes, and text labels within seconds. Drag-and-drop placement, intuitive placeholders, and scalable graphics guarantee consistent output across PowerPoint and Google Slides, streamlining your workflow and eliminating formatting issues.
Whether you’re delivering executive briefings, investor updates, or academic presentations, this infographic empowers you to convey data-driven stories that connect metrics to geographic context. The modern layout enhances audience engagement, supports interactive navigation, and fosters strategic discussions. With this slide in your toolkit, you can spotlight regional trends, compare market opportunities, or visualize performance benchmarks—all in a single, polished asset optimized for seamless deployment across platforms.
Who is it for
Corporate executives, data analysts, product managers, and marketing strategists will benefit from this slide when presenting geographic insights, performance metrics, or market entry strategies in executive briefings, stakeholder meetings, or academic lectures.
Other Uses
Aside from performance overviews, this slide can illustrate market share distribution, sales territory planning, demographic segmentation, or training session highlights. Use the legend markers to denote product portfolios, risk zones, or strategic initiatives, adapting the map and metrics for competitive analyses, regional reports, or educational modules.
Login to download this file

Item ID
SB00112
Related Templates

Value Stream Mapping Symbol Legend Template for PowerPoint & Google Slides
Charts
Free
Project Status Dashboard with RAG Legend Template for PowerPoint & Google Slides
Project Status
Asia Map Infographic with Demographics template for PowerPoint & Google Slides
World Maps
Circular Image Gallery & KPI Metrics Template for PowerPoint & Google Slides
Pie/Donut
DevOps KPI Dashboard Performance Metrics Template for PowerPoint & Google Slides
Software Development
Purchasing KPI Metrics Dashboard Template for PowerPoint & Google Slides
Business Report
Procurement KPI Dashboard & Metrics Template for PowerPoint & Google Slides
Business Report
Free Editable U.S. Map with Regional Metrics Template for PowerPoint & Google Slides
World Maps
Free
Michigan County Map with KPI Dashboard Template for PowerPoint & Google Slides
World Maps
iPad App Mockup with Progress Metrics Template for PowerPoint & Google Slides
Bar/Column
Bubble Head Metrics Infographic Template for PowerPoint & Google Slides
Circular
Circle Segment Sales Metrics Infographic Template for PowerPoint & Google Slides
Circular
Social Media Metrics template for PowerPoint & Google Slides
Comparison Chart
Mobile Usage Metrics template for PowerPoint & Google Slides
Comparison Chart

Scale Metaphor Metrics Comparison Template for PowerPoint & Google Slides
Charts
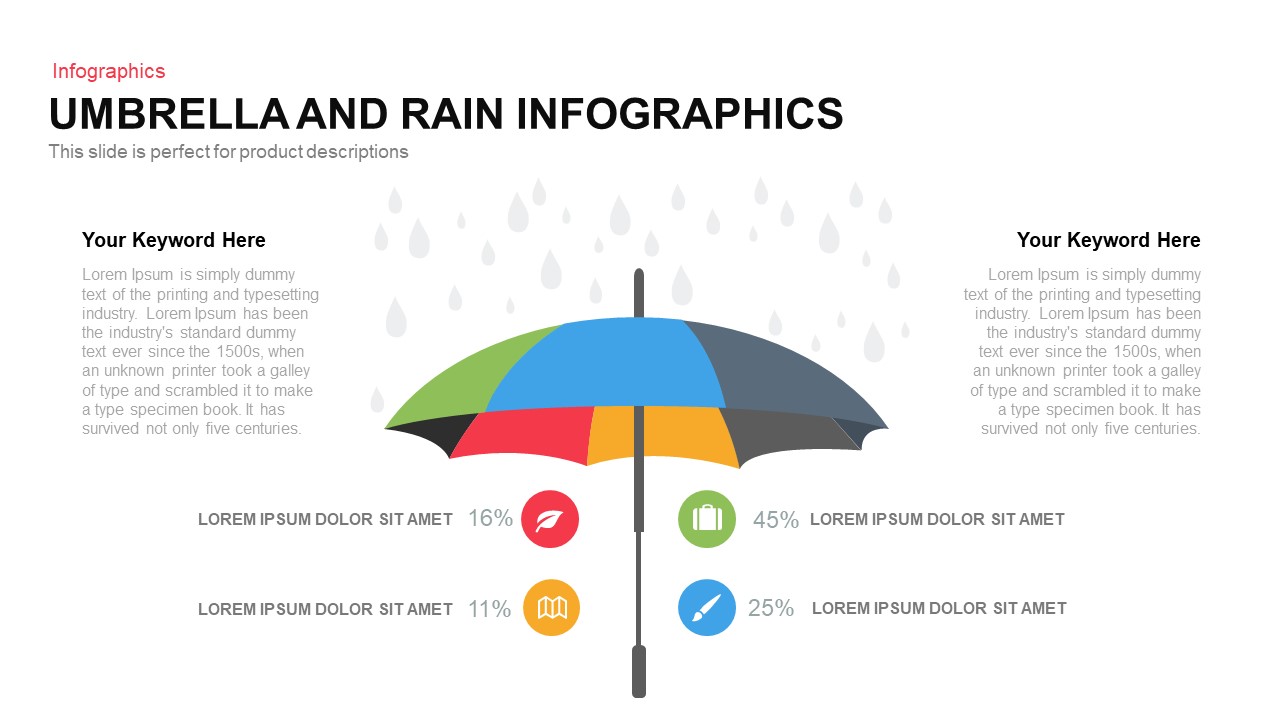
Umbrella and Rain Infographic Metrics Template for PowerPoint & Google Slides
Comparison
Comprehensive Recruitment Metrics Report Template for PowerPoint & Google Slides
Recruitment
Colorful Block Infographic Metrics Slide Template for PowerPoint & Google Slides
Infographics
Benchmarking Metrics Comparison Slide Template for PowerPoint & Google Slides
Pie/Donut
Project Status Dashboard with Metrics Template for PowerPoint & Google Slides
Project Status
Statistics & Global Metrics Infographic Template for PowerPoint & Google Slides
Bar/Column
Agriculture Infographics Slide with Progress Rings & Metrics Template for PowerPoint & Google Slides
Pie/Donut
Annual Recurring Revenue Metrics Template for PowerPoint & Google Slides
Bar/Column
Social Media Analysis Metrics Slide Deck Template for PowerPoint & Google Slides
Digital Marketing
LinkedIn Metrics Infographic Slide Template for PowerPoint & Google Slides
Digital Marketing
Facebook Social Metrics Infographic Template for PowerPoint & Google Slides
Graphics
Instagram Infographic Metrics Slide Template for PowerPoint & Google Slides
Marketing
Mastodon Metrics Infographic Dashboard Template for PowerPoint & Google Slides
Business Report
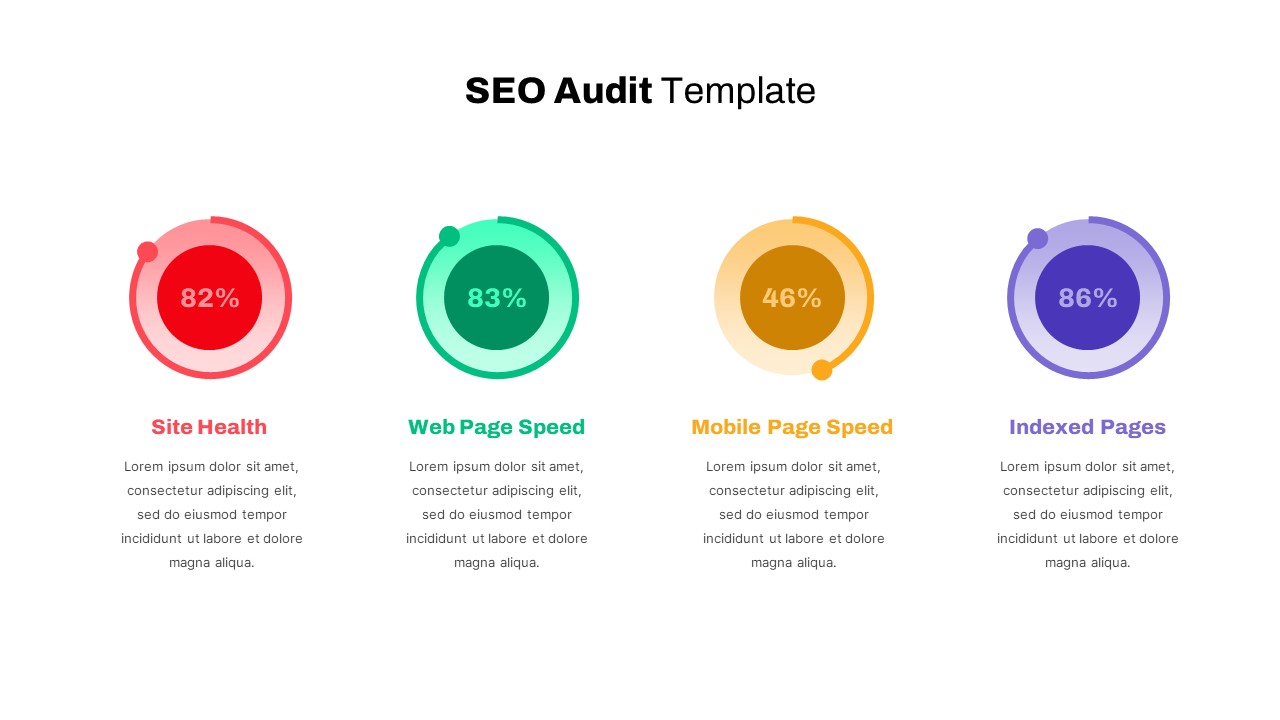
Detailed SEO Audit Metrics Overview Template for PowerPoint & Google Slides
Circular
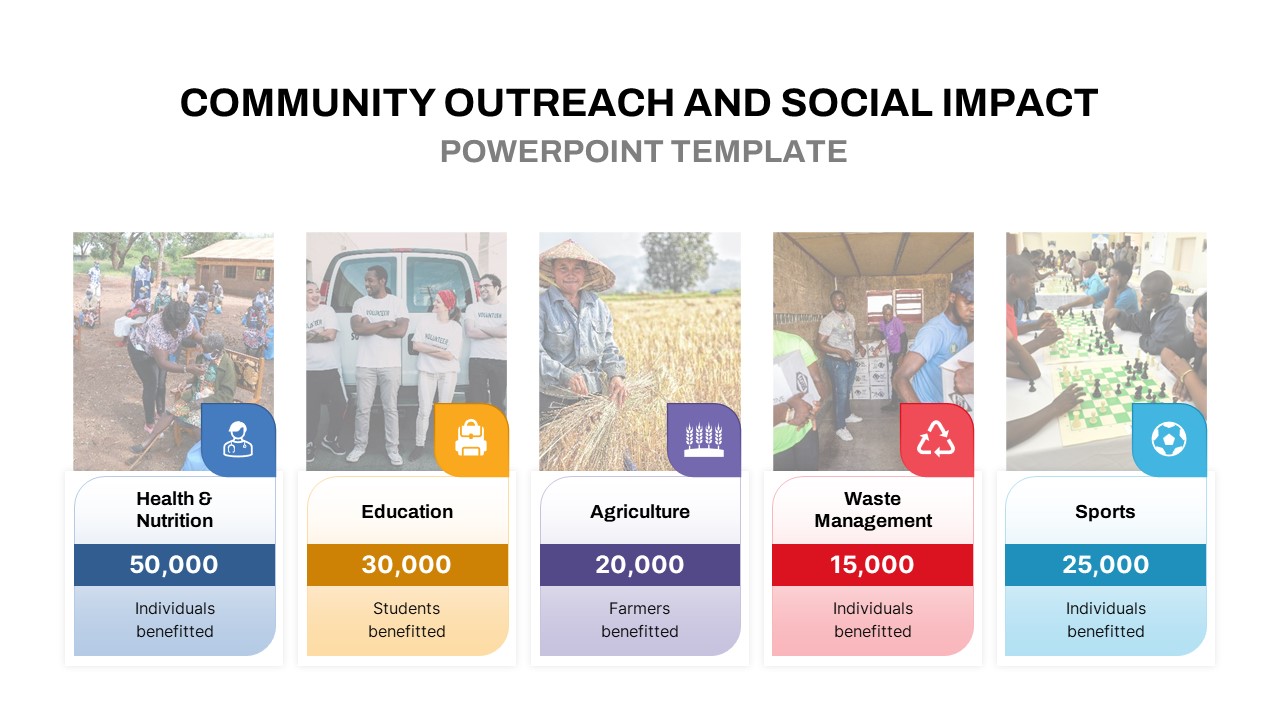
Community Outreach Impact Metrics Template for PowerPoint & Google Slides
Accomplishment
Financial Snapshot & Metrics Overview Template for PowerPoint & Google Slides
Finance
Market Validation Metrics Overview Template for PowerPoint & Google Slides
Business
Employee Performance Metrics Dashboard Template for PowerPoint & Google Slides
Employee Performance
Pirate Metrics AARRR Funnel Framework Template for PowerPoint & Google Slides
Funnel
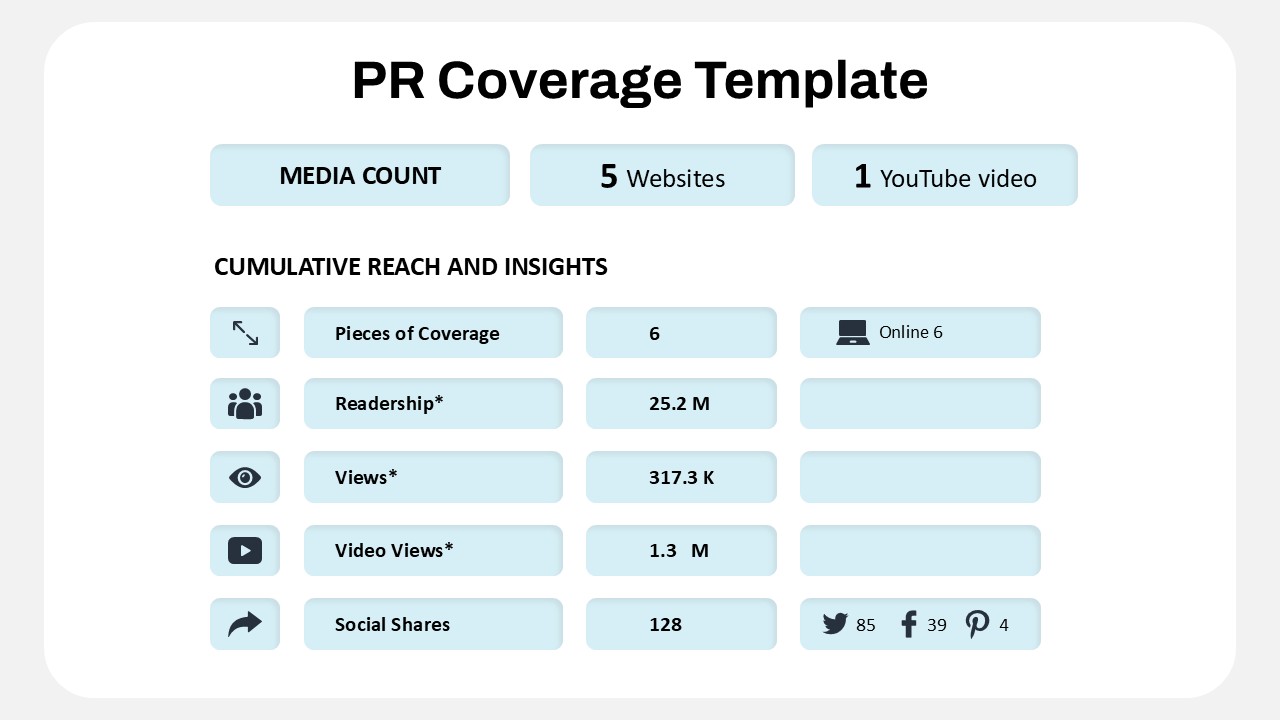
Public Relations Coverage Metrics Template for PowerPoint & Google Slides
Business Report
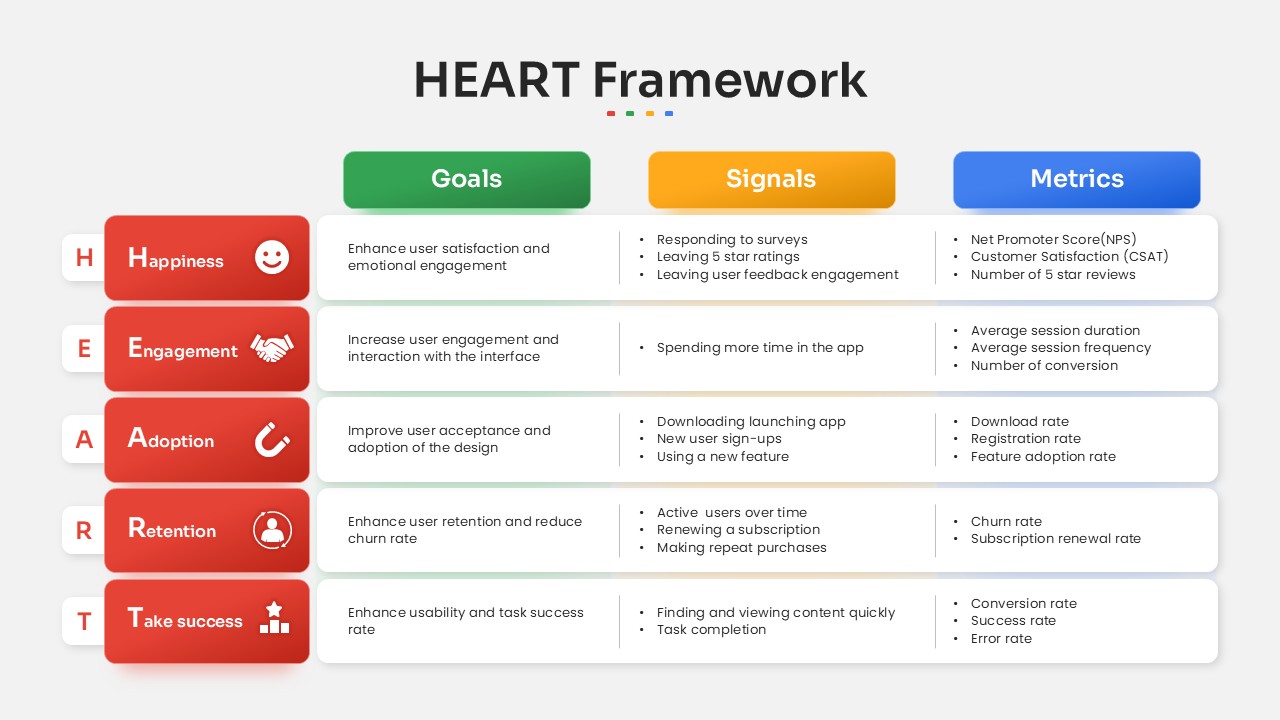
HEART Framework Goals, Signals & Metrics Template for PowerPoint & Google Slides
Process
Free KPI Dashboard PowerPoint Template for PowerPoint & Google Slides
Charts
Free

Efficiency KPI Dashboard Metaphor Template for PowerPoint & Google Slides
Infographics

Application Revenue Line Chart KPI Template for PowerPoint & Google Slides
Revenue
Sales Growth Dashboard: KPI Gauge & Line Template for PowerPoint & Google Slides
Revenue
Performance KPI Dashboard Slide Template for PowerPoint & Google Slides
Business Report
KPI Dashboard template for PowerPoint & Google Slides
Business Report
KPI Dashboard Overview template for PowerPoint & Google Slides
Finance
KPI Dashboard Data Visualization Template for PowerPoint & Google Slides
Bar/Column
KPI Dashboard Data Overview Slide Template for PowerPoint & Google Slides
Bar/Column
Professional Team Collage & KPI Slide Template for PowerPoint & Google Slides
Business
Statistics Infographic & KPI Bar Chart Template for PowerPoint & Google Slides
Bar/Column
Monthly Recurring Revenue KPI Bar Chart Template for PowerPoint & Google Slides
Bar/Column
Customer Satisfaction KPI Dashboard Template for PowerPoint & Google Slides
Customer Experience
Free Balanced Scorecard Quadrant KPI Layout Template for PowerPoint & Google Slides
Employee Performance
Free
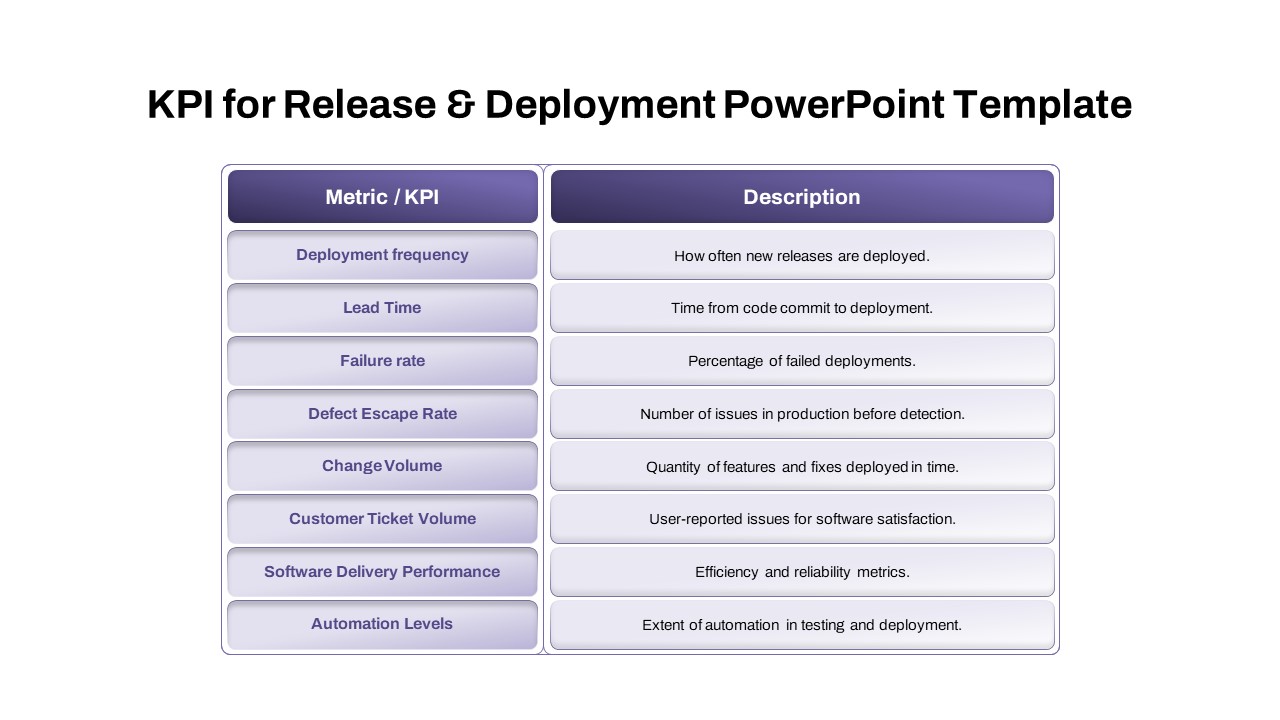
Comprehensive Release & Deployment KPI Template for PowerPoint & Google Slides
Software Development
Three Segment Donut Chart KPI Infographic Template for PowerPoint & Google Slides
Pie/Donut
4DX Scoreboard KPI Gauge Dashboard Template for PowerPoint & Google Slides
Business Strategy
Year in Review KPI Highlights Slide for PowerPoint & Google Slides
Business Report
Patient-Satisfaction KPI Dashboard for PowerPoint & Google Slides
Business
Mind Map PowerPoint template for PowerPoint & Google Slides
Mind Maps
Editable Colombia Map PowerPoint Template for PowerPoint & Google Slides
Business Models
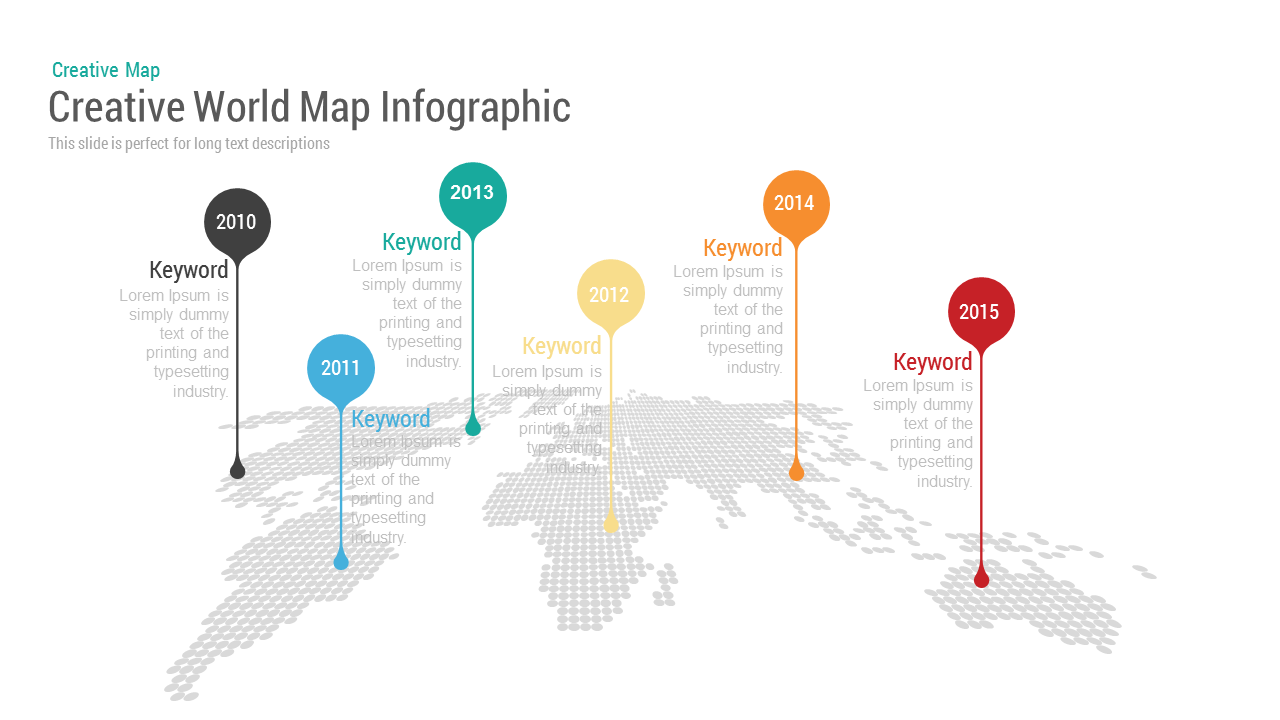
Creative World Map template for PowerPoint & Google Slides
World Maps

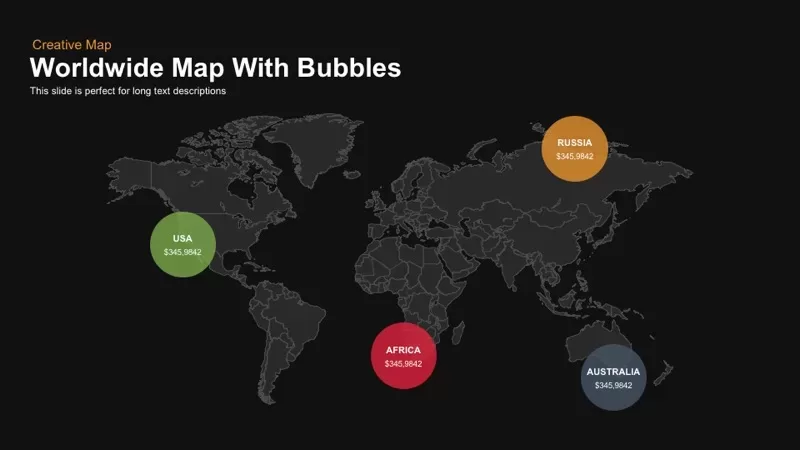
Worldwide Map with Bubbles template for PowerPoint & Google Slides
World Maps
Interactive US Population Data Map Slide Template for PowerPoint & Google Slides
World Maps
Diamond Mind Map Diagram Four Branches Template for PowerPoint & Google Slides
Mind Maps

Simple Multi-Branch Mind Map Template for PowerPoint & Google Slides
Mind Maps
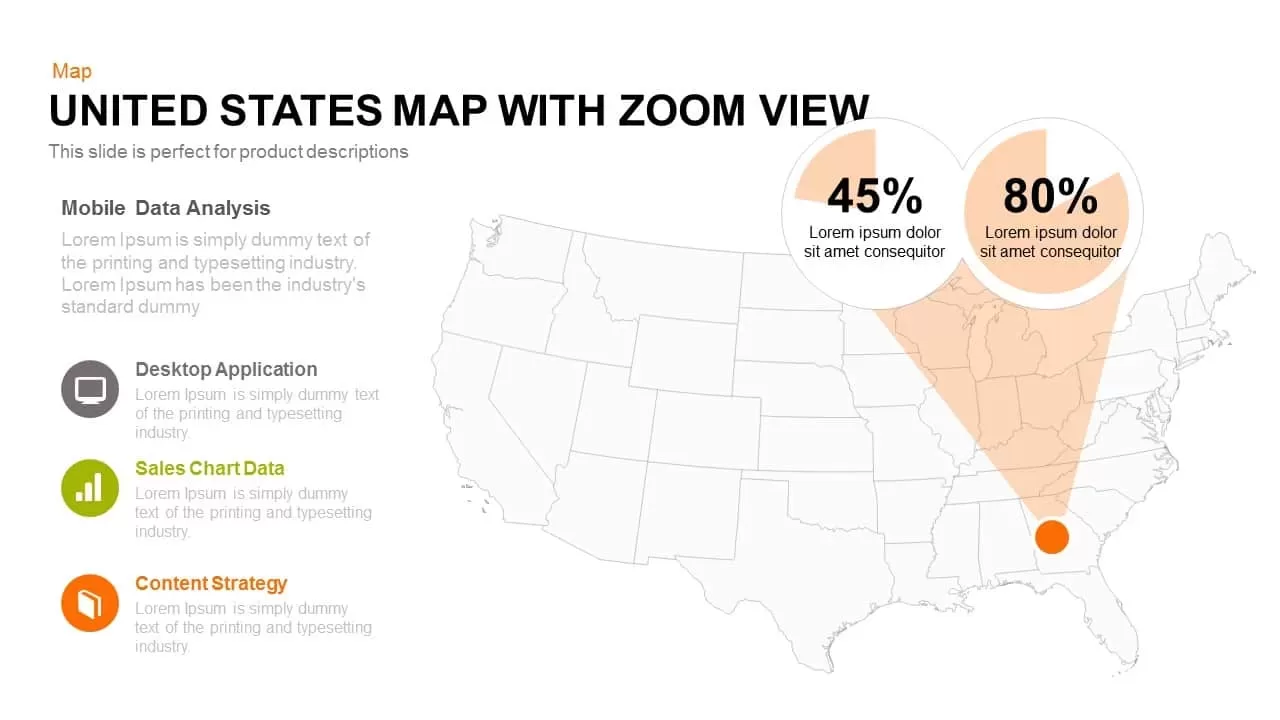
United States Map with Zoom View template for PowerPoint & Google Slides
World Maps
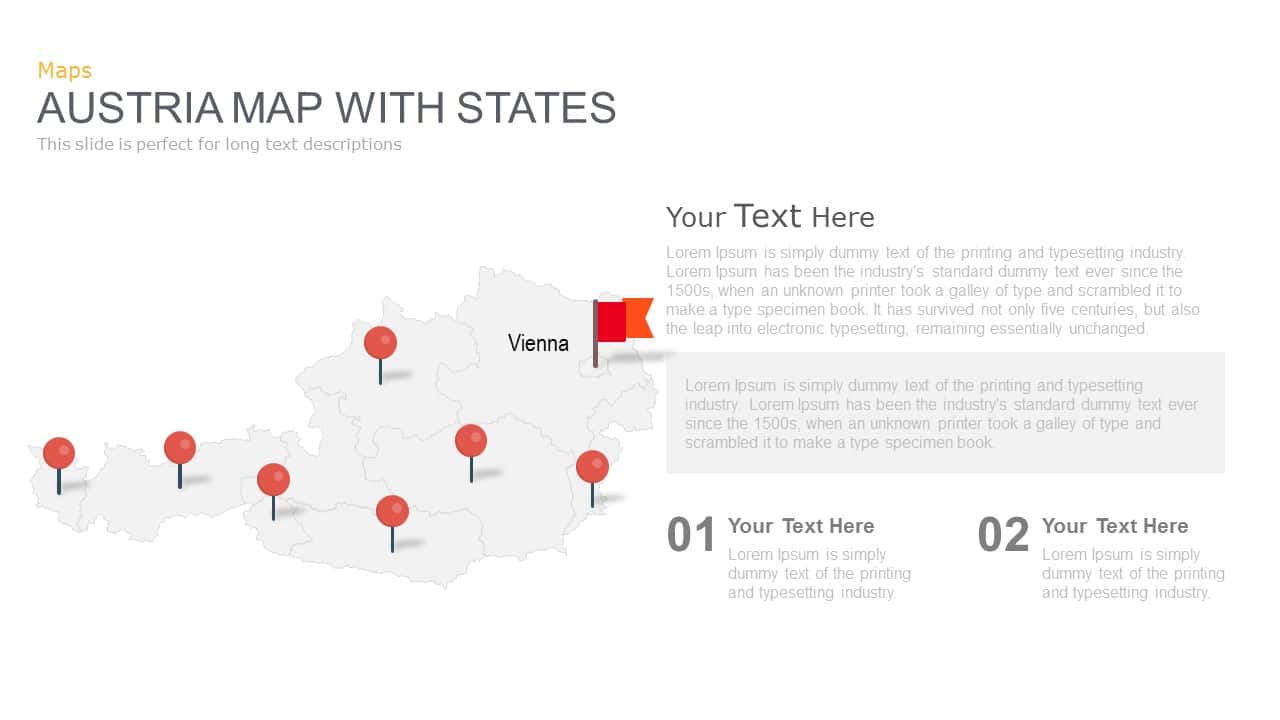
Austria Map With State Markers Template for PowerPoint & Google Slides
World Maps
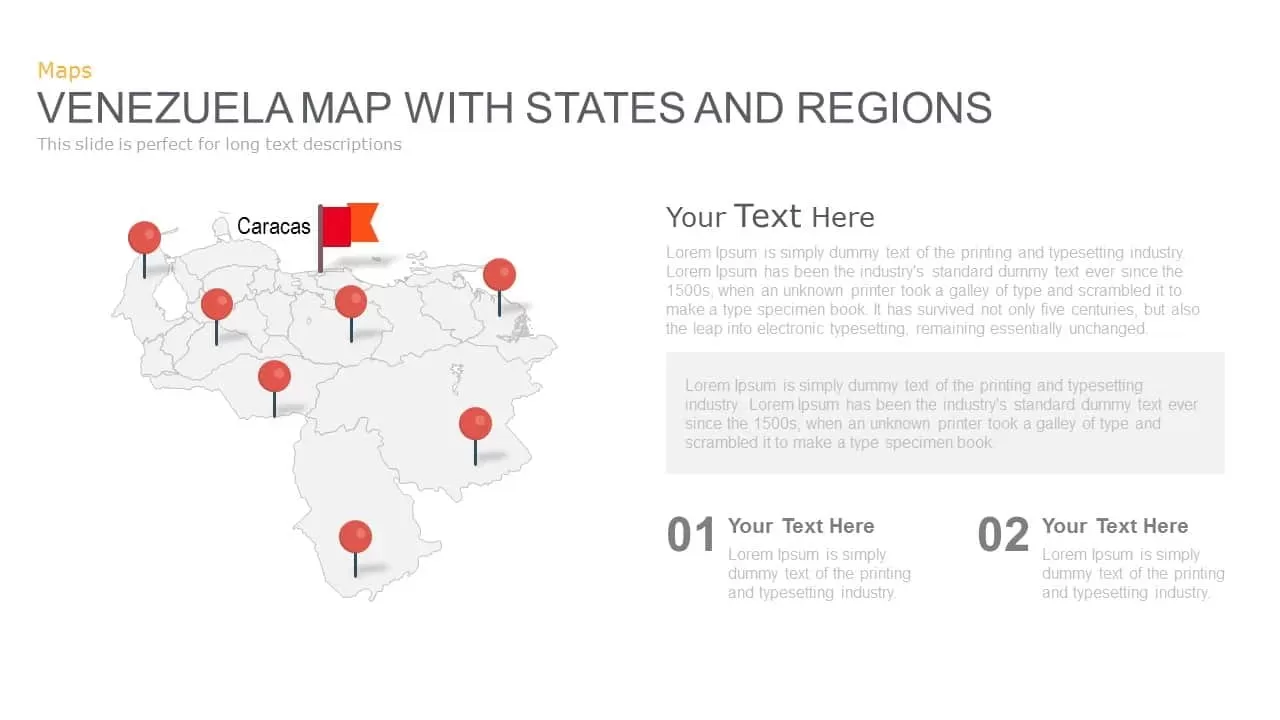
Venezuela Map with States and Regions Template for PowerPoint & Google Slides
World Maps
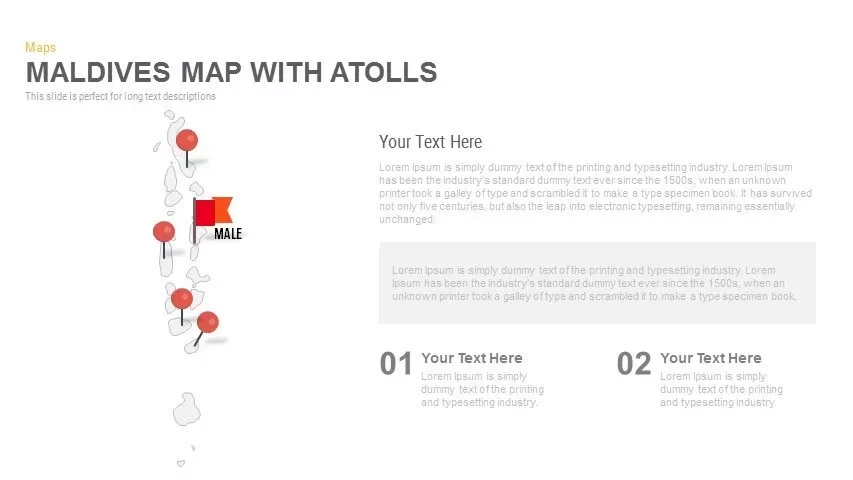
Maldives Map Infographic Template for PowerPoint & Google Slides
Maps
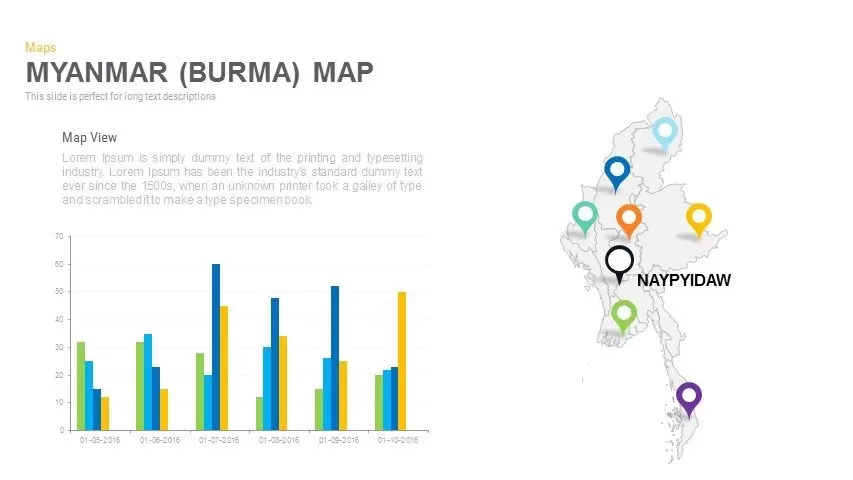
Myanmar (Burma) Provincial Map Infographic Template for PowerPoint & Google Slides
Maps
Thailand Provinces Map Infographic Pack Template for PowerPoint & Google Slides
Maps
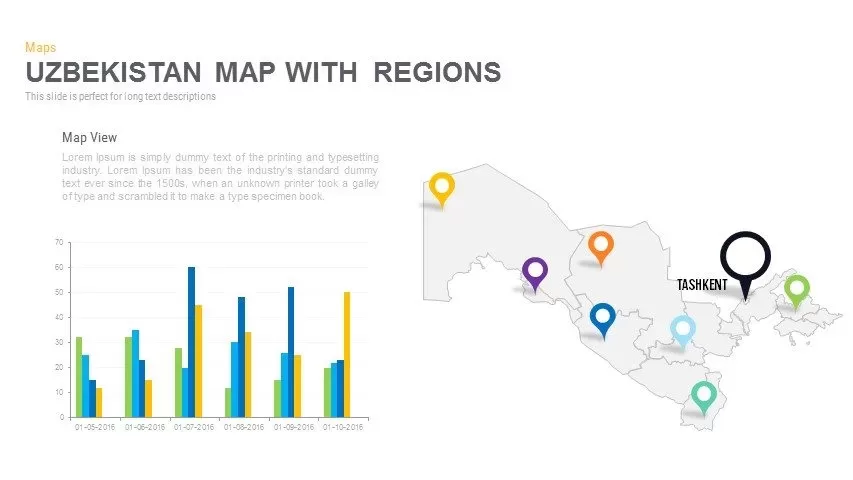
Uzbekistan Map with Regions Pack Template for PowerPoint & Google Slides
Maps
Vietnam Provinces Map Infographic Pack Template for PowerPoint & Google Slides
Maps
Chad Map with Regions Slide Pack Template for PowerPoint & Google Slides
World Maps
DR Congo Prefecture Map Slide Pack Template for PowerPoint & Google Slides
World Maps
Egypt Regional Map Slide Pack Template for PowerPoint & Google Slides
World Maps
Colorful Mind Map Infographic Template with Icons for PowerPoint & Google Slides
Mind Maps
Mind Map Infographic Slide Template for PowerPoint & Google Slides
Mind Maps
Mind Map Diagram Template for PowerPoint & Google Slides
Mind Maps
Versatile Mind Map Infographic Template for PowerPoint & Google Slides
Mind Maps
Concept Map Presentation Template for PowerPoint & Google Slides
Mind Maps
Structured Mind Map Infographic Diagram Template for PowerPoint & Google Slides
Mind Maps
Dual Topic Mind Map Infographic Template for PowerPoint & Google Slides
Mind Maps
Editable World Map Callout Infographic Template for PowerPoint & Google Slides
World Maps
Mind Map Template for PowerPoint & Google Slides
Mind Maps
Stakeholder Map Template for PowerPoint & Google Slides
Business
Colorful Mind Map with Icons Template for PowerPoint & Google Slides
Mind Maps
Detailed Marketing Road Map Timeline Template for PowerPoint & Google Slides
Timeline
North America Map Infographic Slide Template for PowerPoint & Google Slides
World Maps
Heat Map Analysis Template for PowerPoint & Google Slides
Risk Management
Professional Risk Heat Map Visualization Template for PowerPoint & Google Slides
Risk Management
Heat Map Risk Matrix Dashboard Template for PowerPoint & Google Slides
Comparison Chart
Free Global Market Distribution Map Template for PowerPoint & Google Slides
World Maps
Free
Modern Custom Eight-Branch Mind Map Template for PowerPoint & Google Slides
Mind Maps
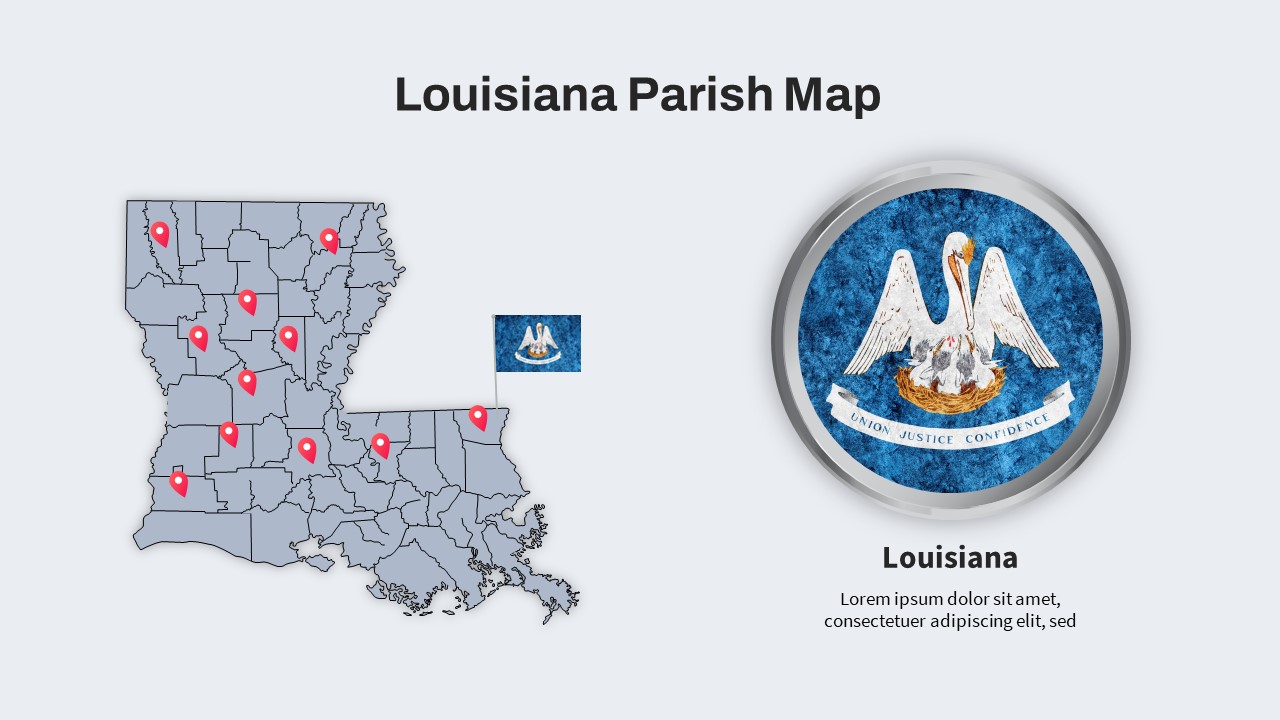
Louisiana Parish Map with Markers Template for PowerPoint & Google Slides
Maps
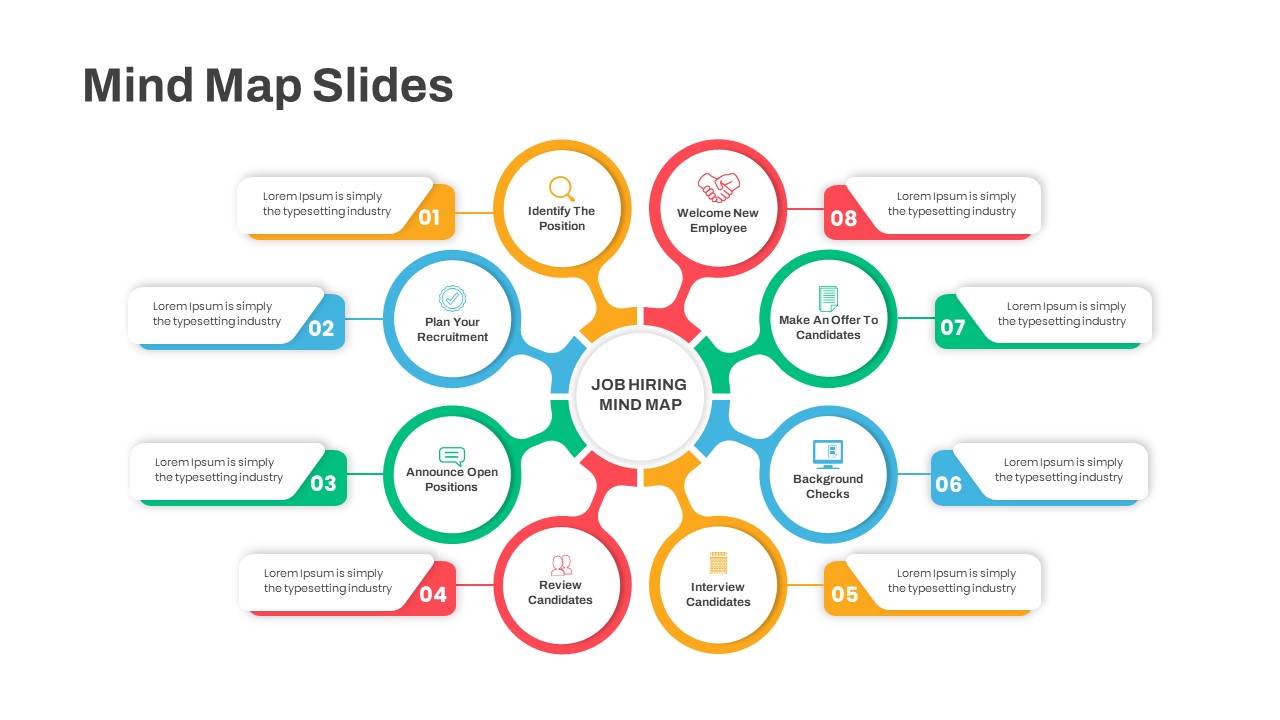
Eight-Step Job Hiring Mind Map Template for PowerPoint & Google Slides
Mind Maps
Red Brain Mind Map Diagram Template for PowerPoint & Google Slides
Mind Maps
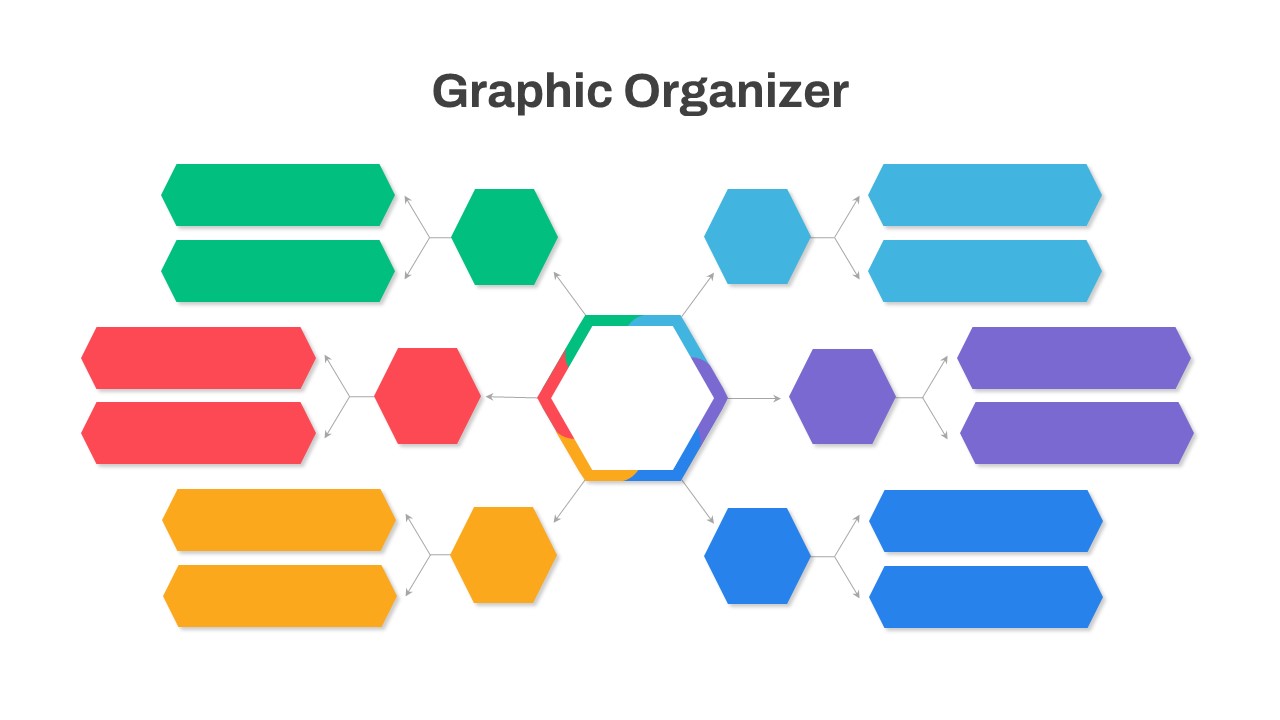
Graphic Organizer & Double Bubble Map Template for PowerPoint & Google Slides
Maps
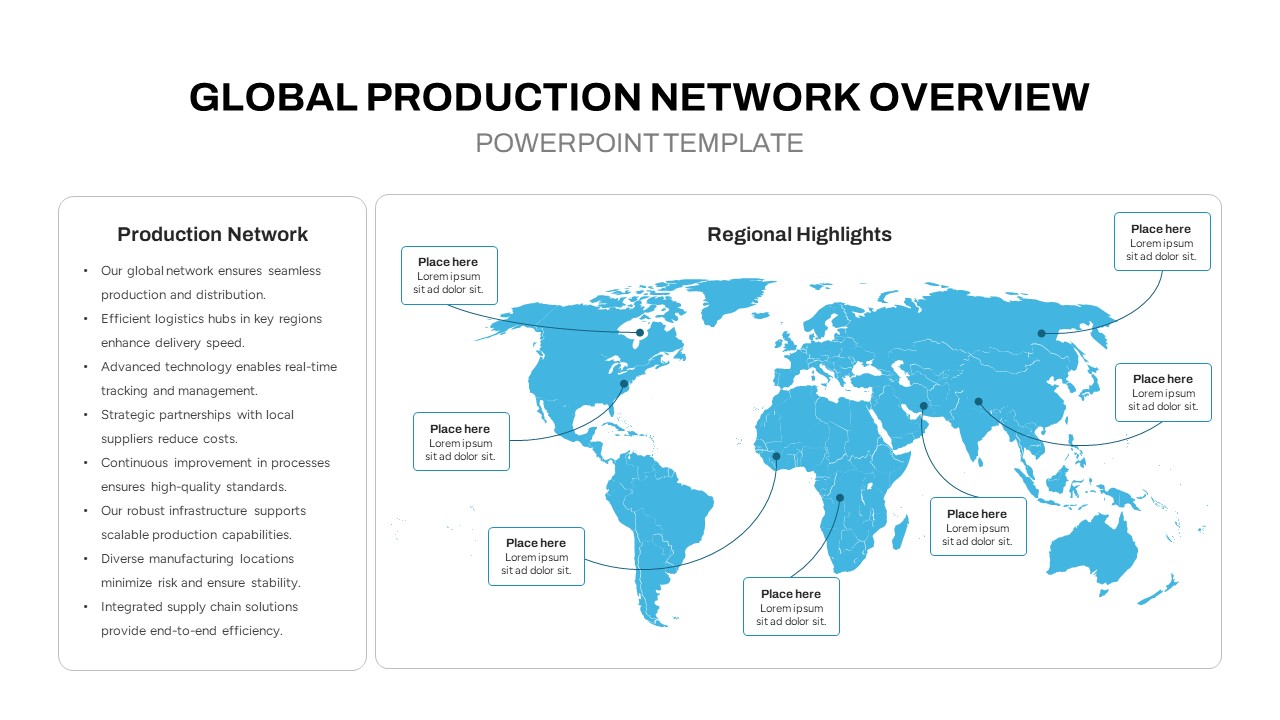
Global Production Network Overview Map Template for PowerPoint & Google Slides
World Maps
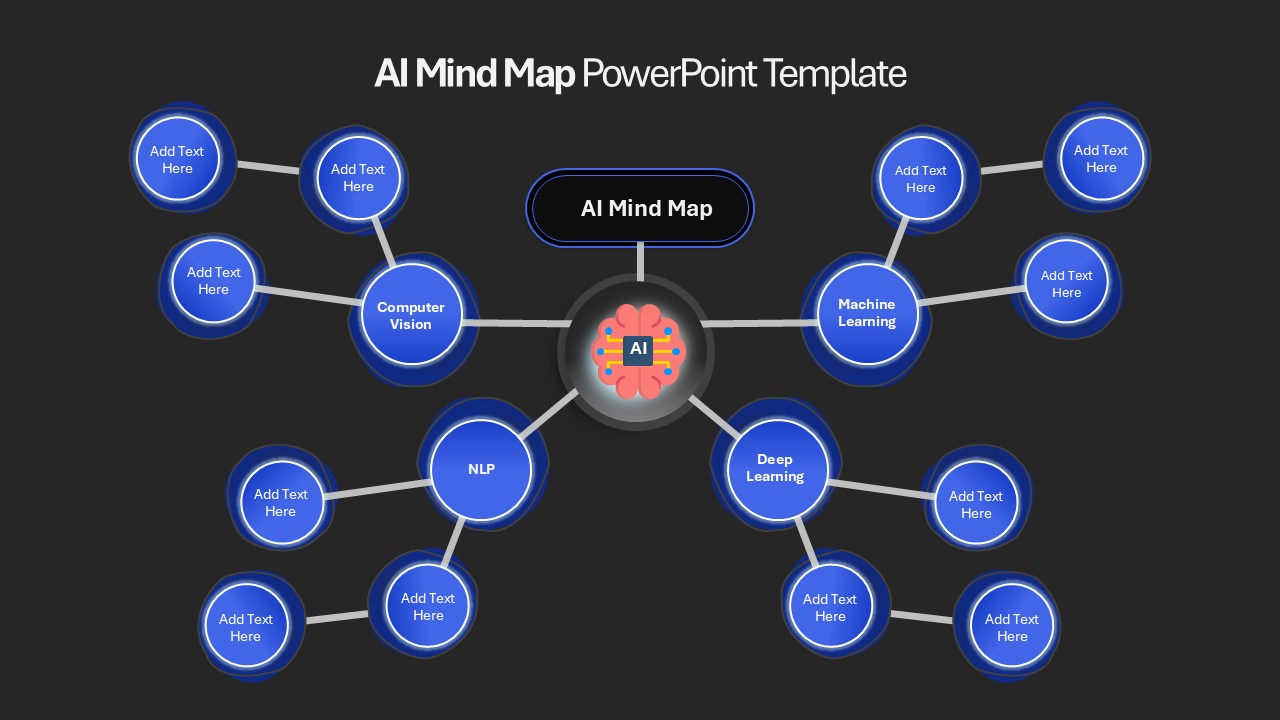
AI Mind Map & Hub-and-Spoke Diagram Template for PowerPoint & Google Slides
Mind Maps
AI and Data Ecosystem Map Template for PowerPoint & Google Slides
AI
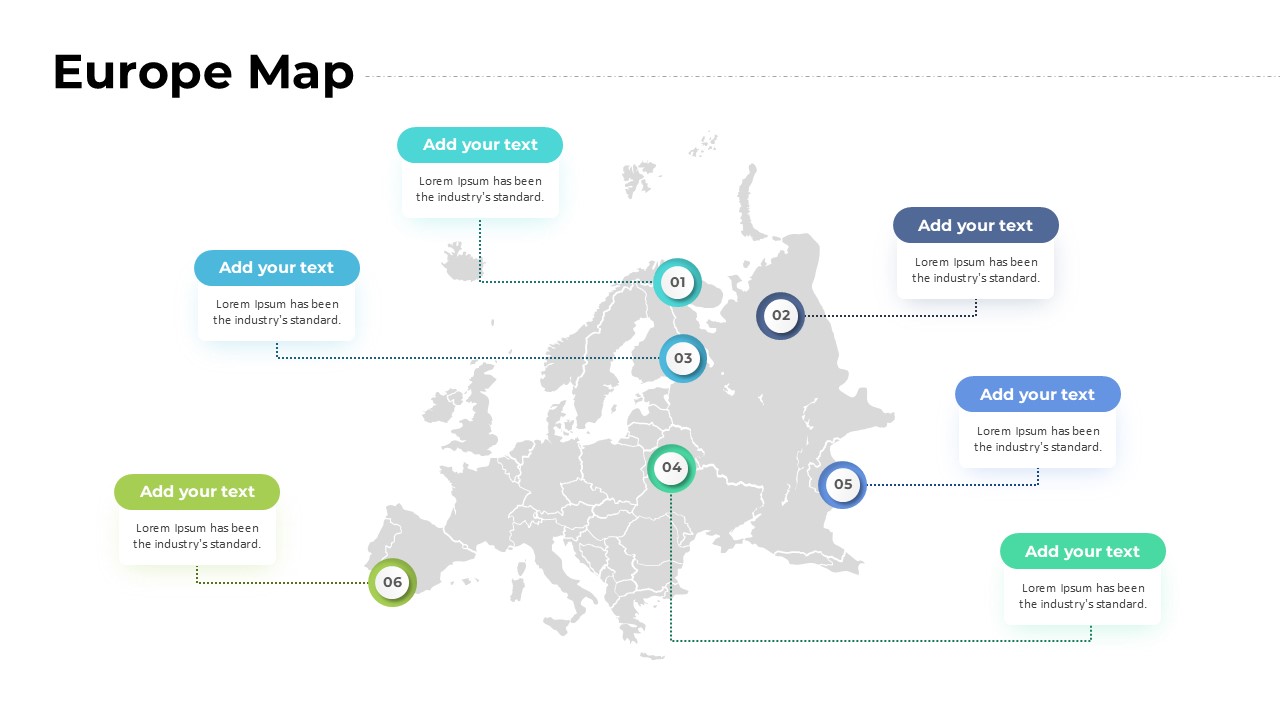
Europe Map with Six Editable Points Template for PowerPoint & Google Slides
World Maps
USA Map with Bar Chart Template for PowerPoint & Google Slides
World Maps