Perceptual Map infographic for PowerPoint & Google Slides

Description
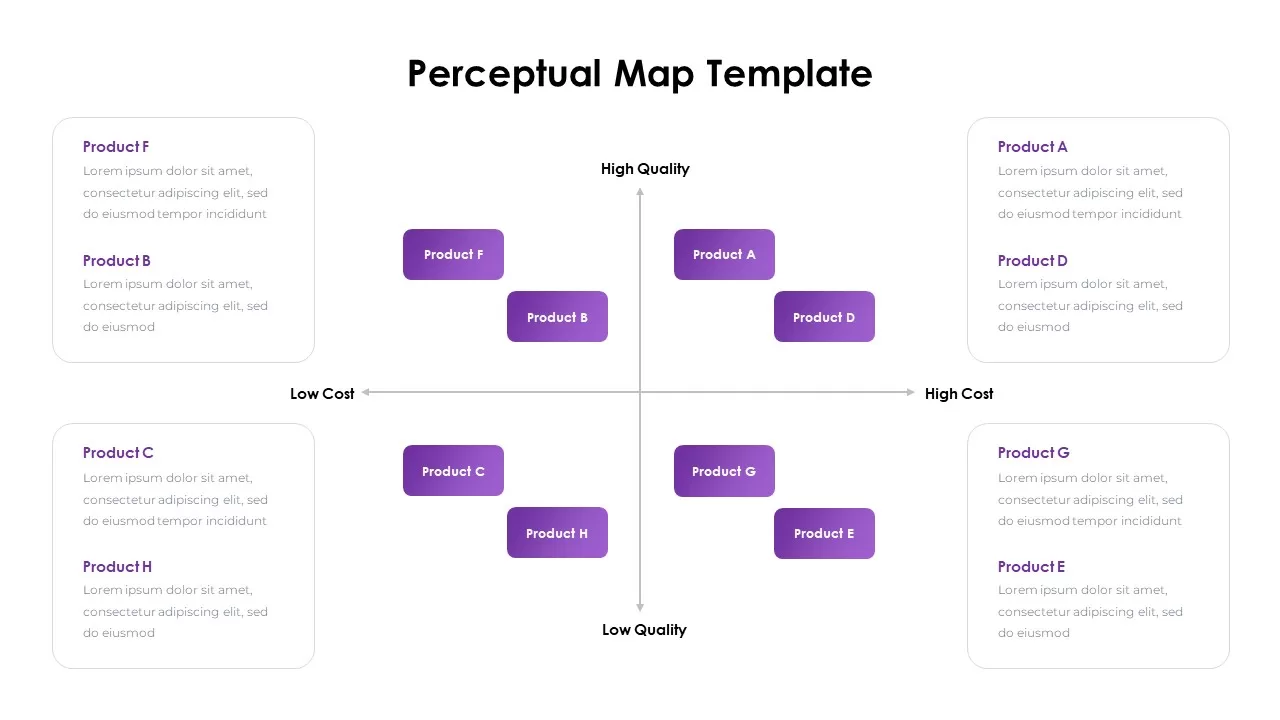
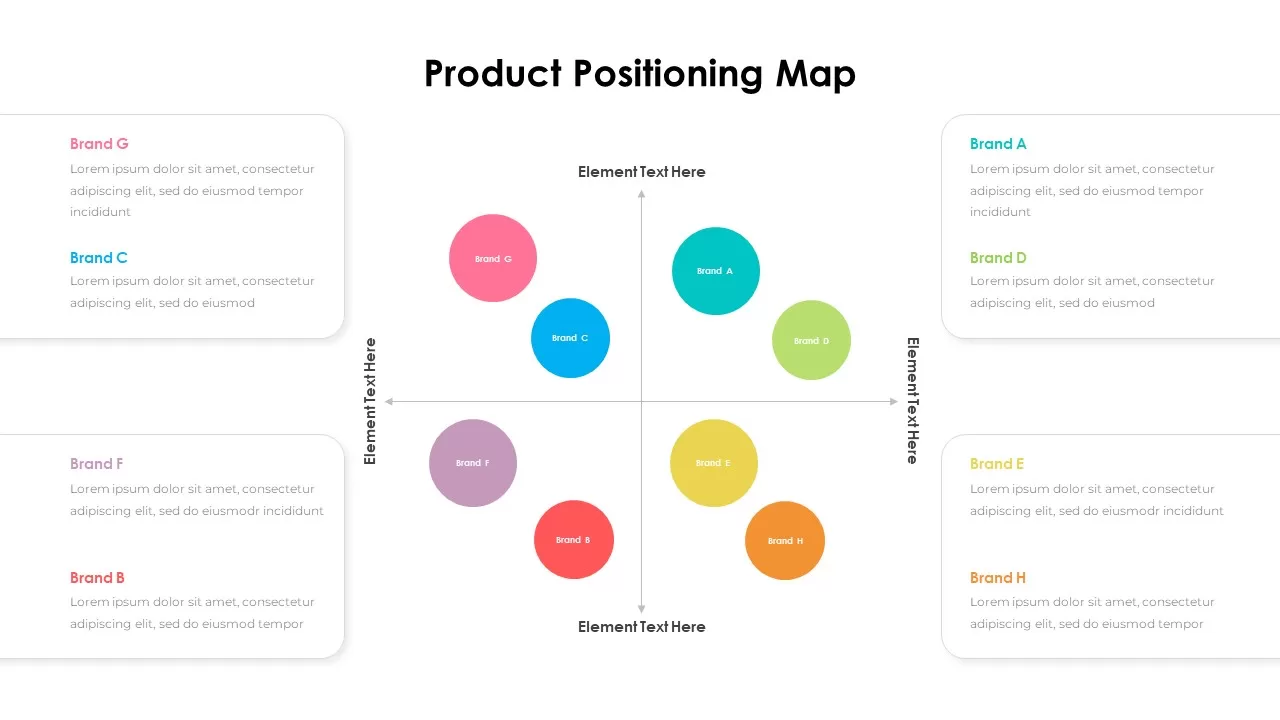
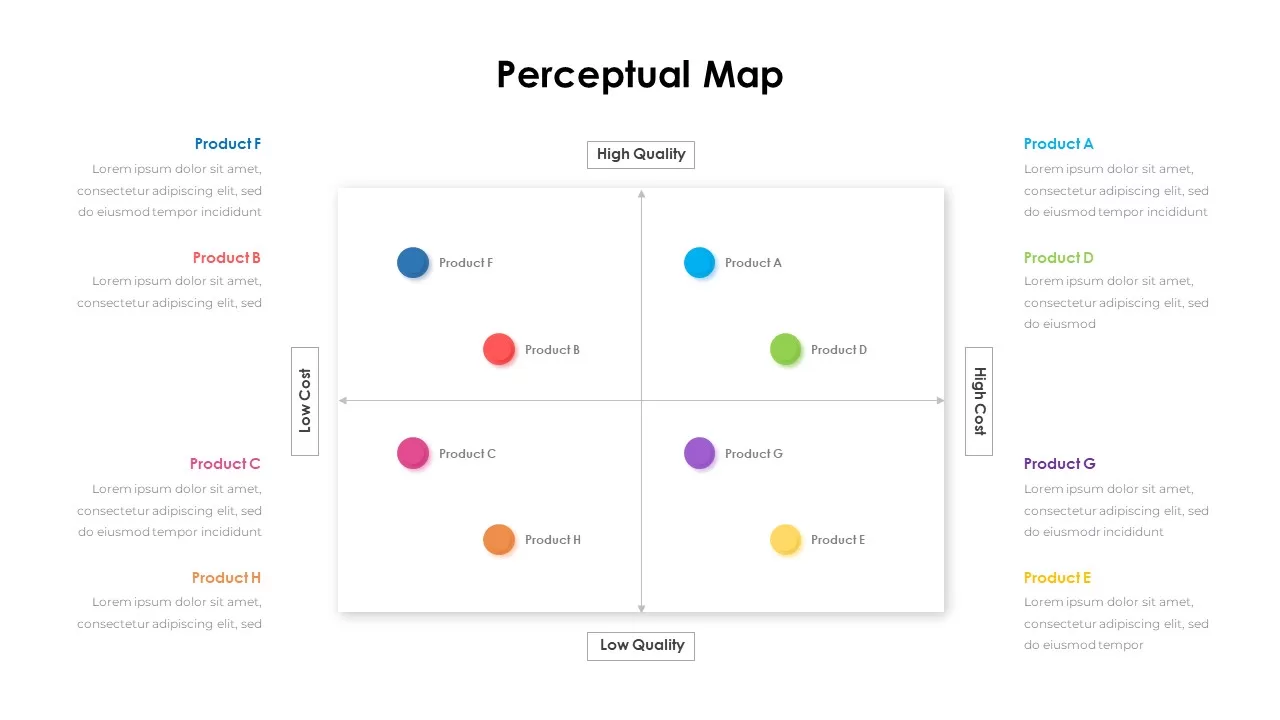
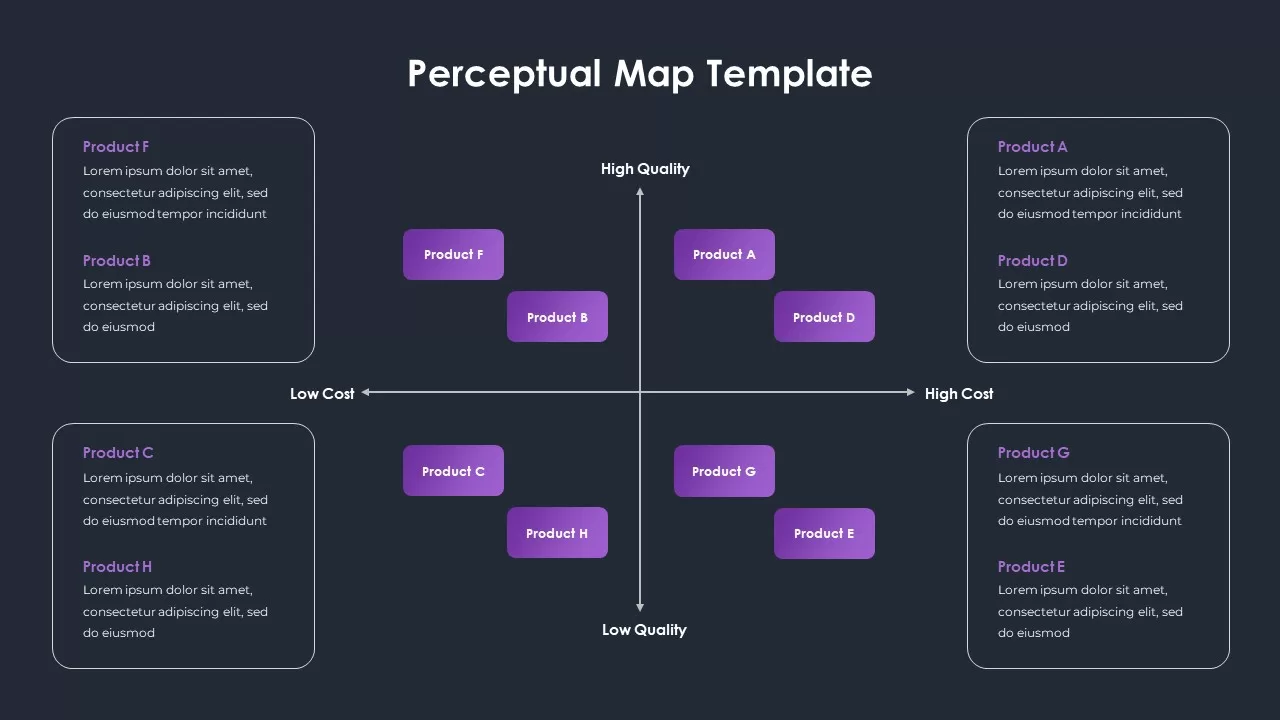
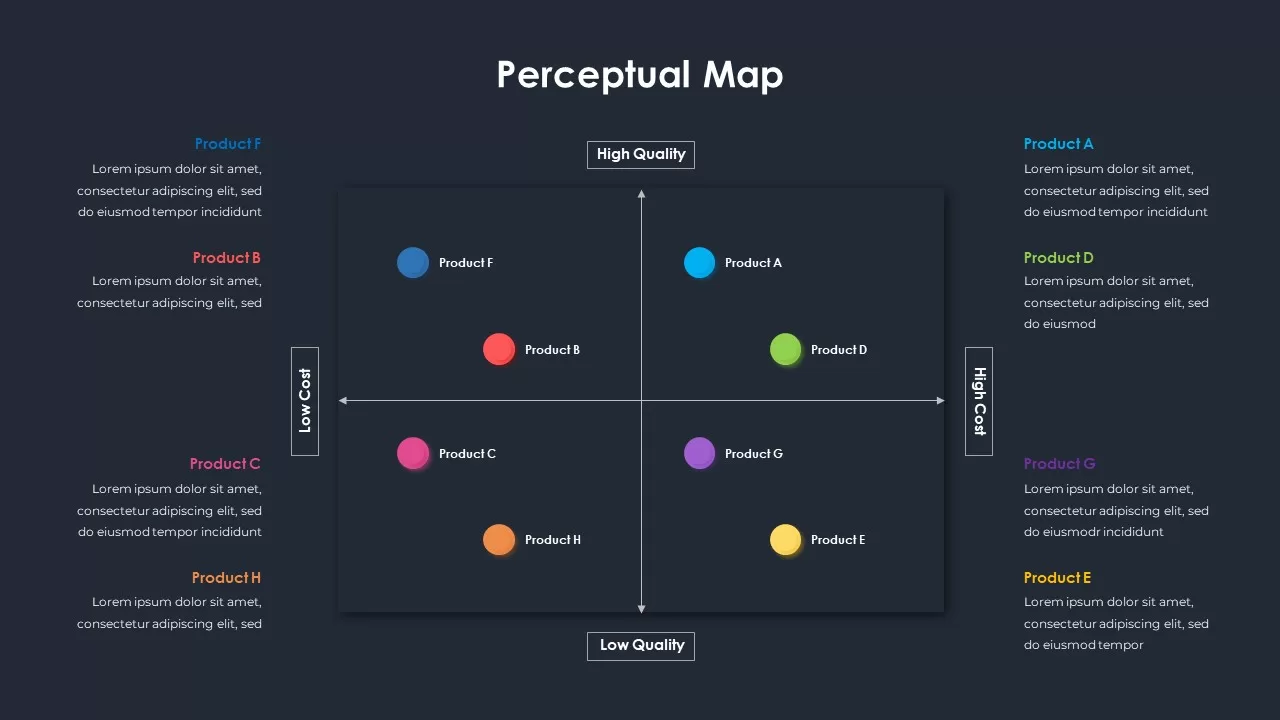
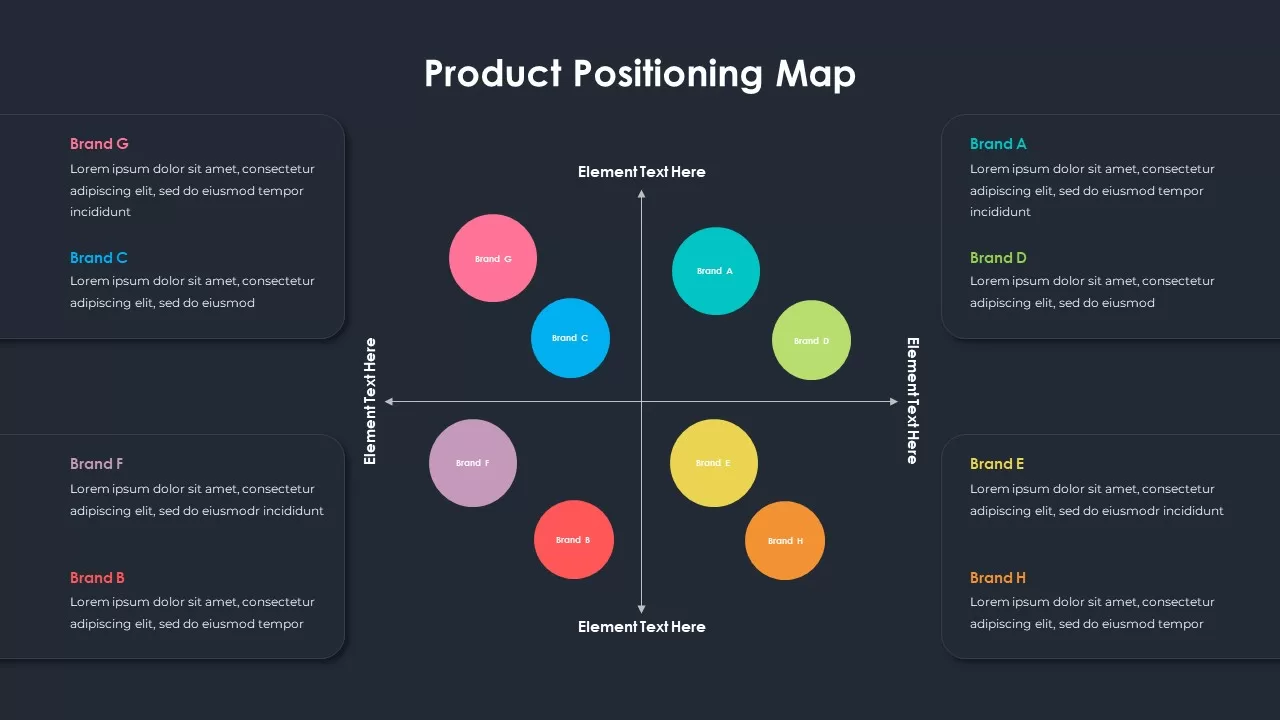
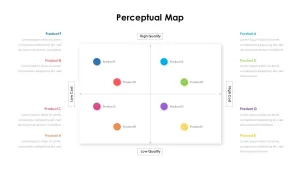
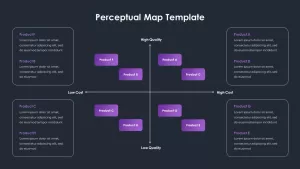
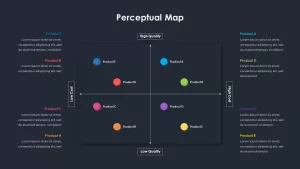
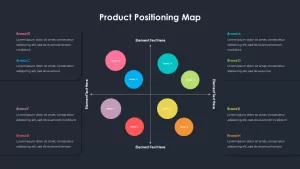
This Perceptual Map infographic template helps to illustrate the positioning of products or brands in relation to two variables, such as cost and quality. With a clean, intuitive layout, this slide visualizes how different products or brands compare across these dimensions. The four quadrants allow for the categorization of products from low cost and low quality to high cost and high quality, providing a quick overview of a competitive landscape.
The products are represented with colorful circles or boxes, clearly labeled for ease of understanding. Customizable sections next to each product offer space for detailed descriptions, features, or additional data points. Ideal for market analysis, product comparison, and competitive intelligence, this template is a flexible tool to showcase strategic decisions in business, marketing, or project management.
Who is it for
Marketers, business analysts, product managers, and strategists who need to compare products, services, or brands based on key attributes like cost and quality. This template is especially useful for positioning exercises, brand analysis, and competitive assessments.
Other Uses
The perceptual map template can also be adapted for use in customer satisfaction surveys, service level comparisons, or when evaluating multiple strategies in terms of effectiveness and investment. It can also be customized for SWOT analysis, competitive analysis in various industries, or for visualizing product portfolio positioning.
Login to download this file

Item ID
SB02451
Related Templates

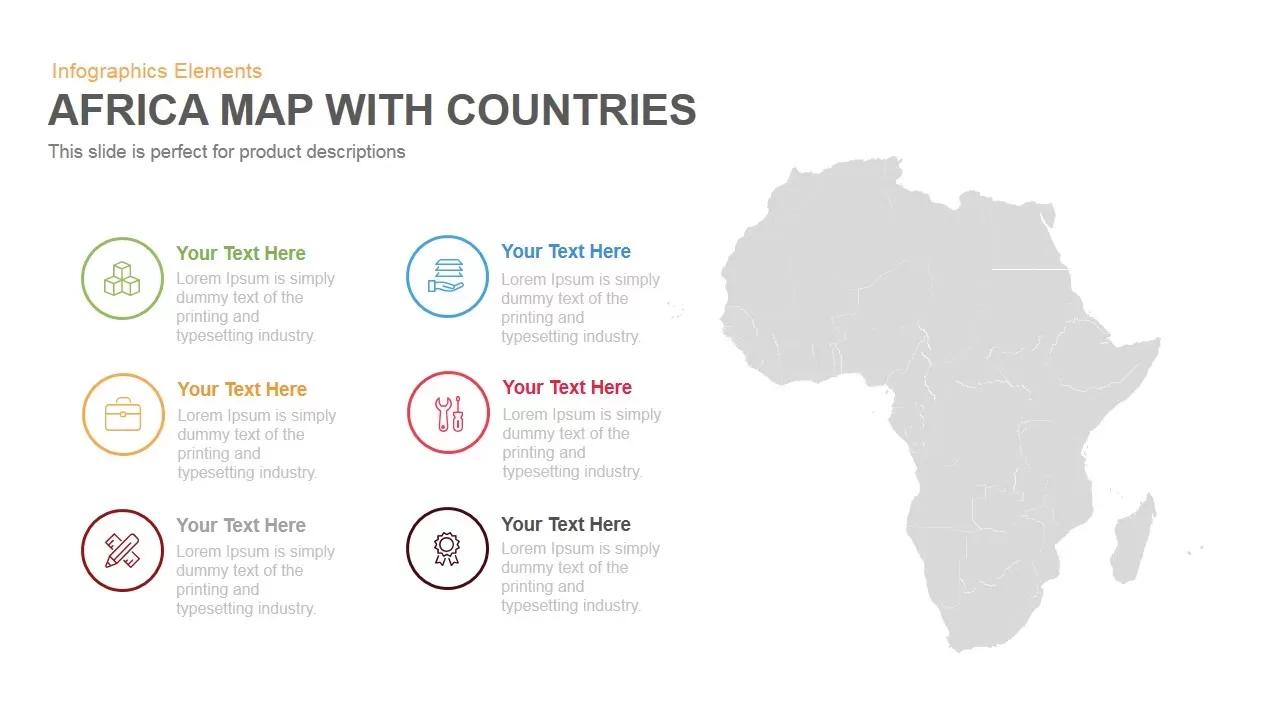
Africa Country Map Infographic Template for PowerPoint & Google Slides
World Maps
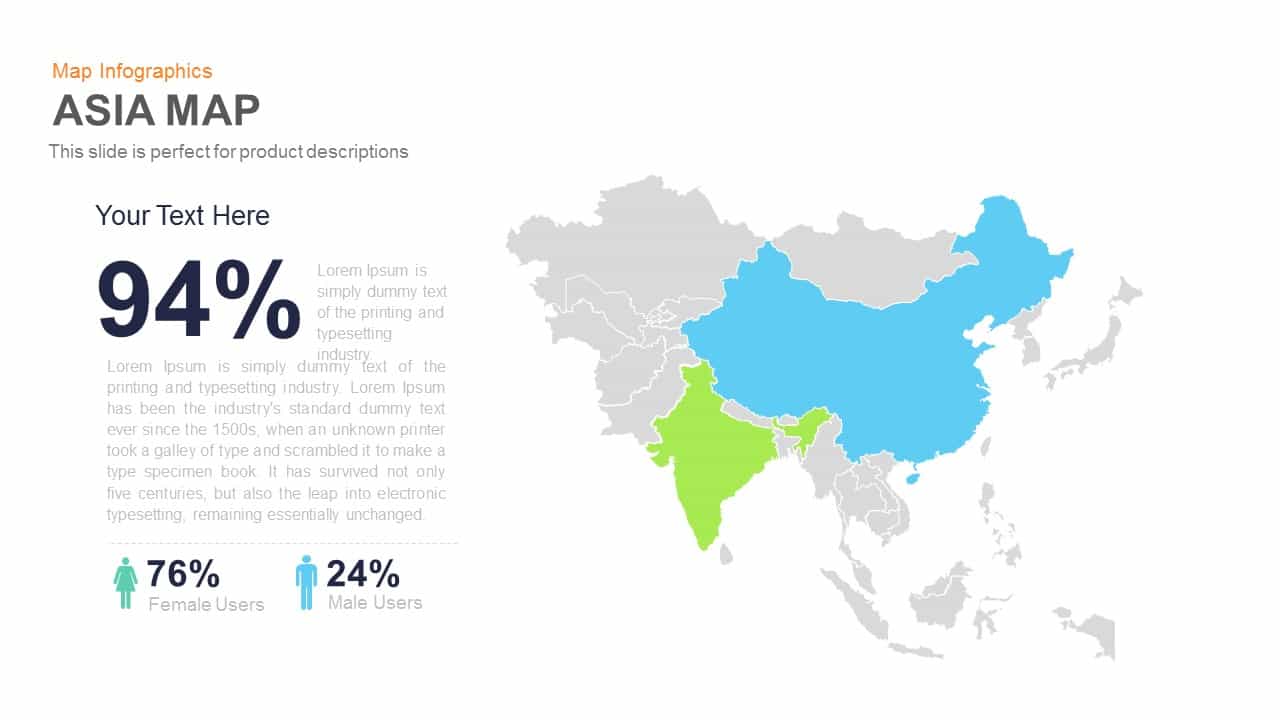
Asia Map Infographic with Demographics template for PowerPoint & Google Slides
World Maps

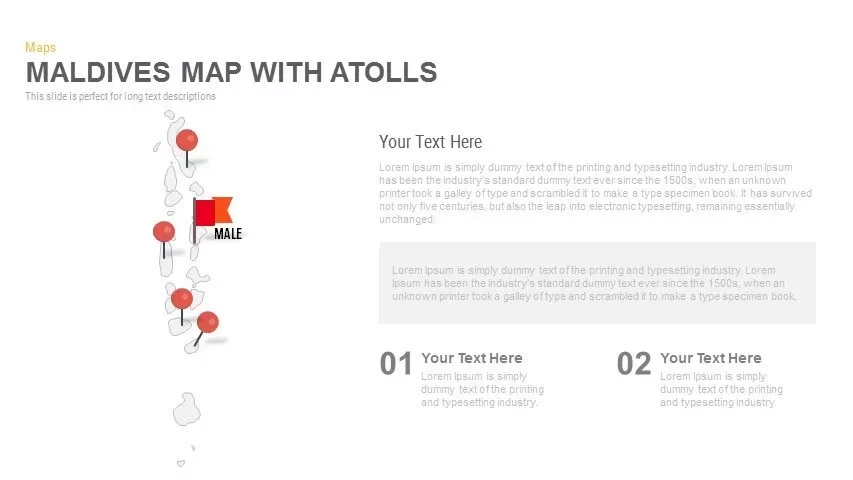
Maldives Map Infographic Template for PowerPoint & Google Slides
Maps
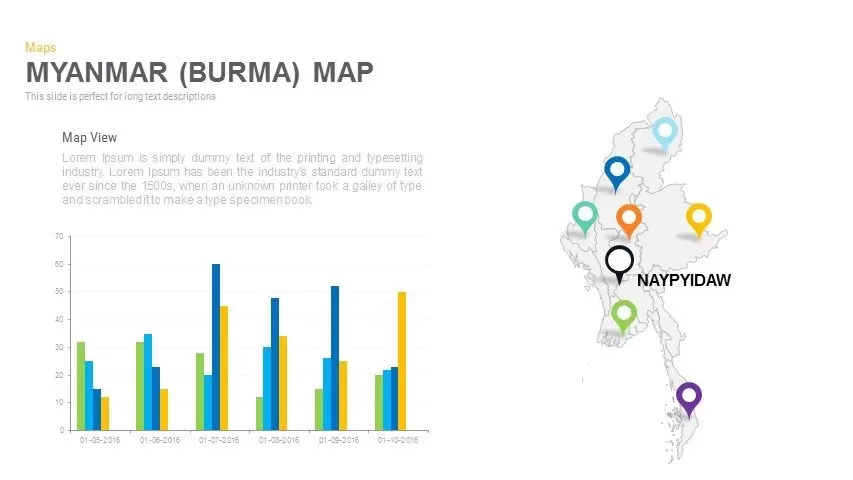
Myanmar (Burma) Provincial Map Infographic Template for PowerPoint & Google Slides
Maps
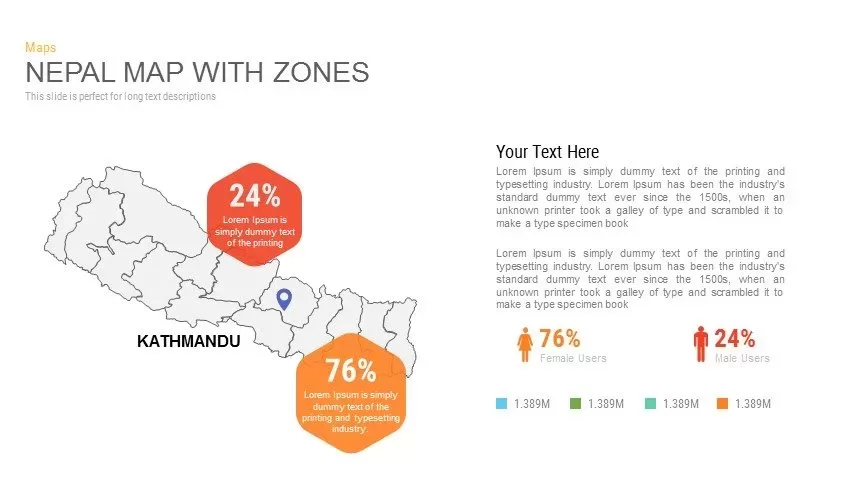
Nepal Map with Zones Infographic Template for PowerPoint & Google Slides
Maps
North Korea Map with Provinces Infographic Pack Template for PowerPoint & Google Slides
Maps
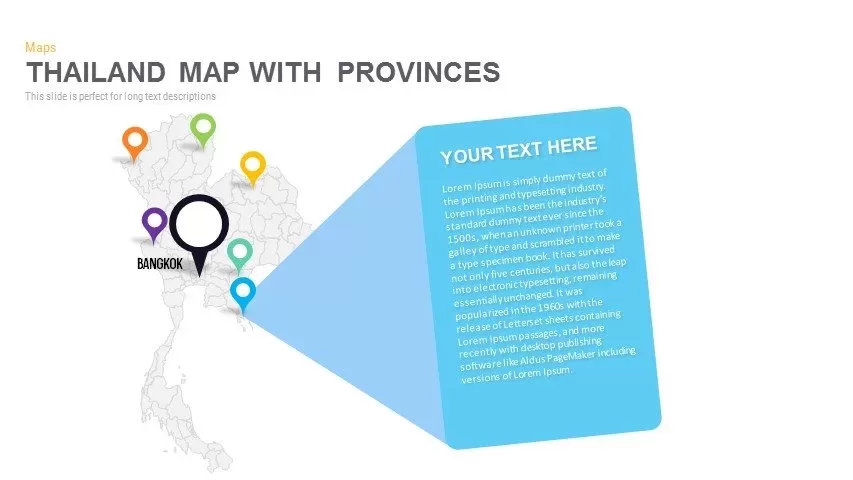
Thailand Provinces Map Infographic Pack Template for PowerPoint & Google Slides
Maps
Vietnam Provinces Map Infographic Pack Template for PowerPoint & Google Slides
Maps
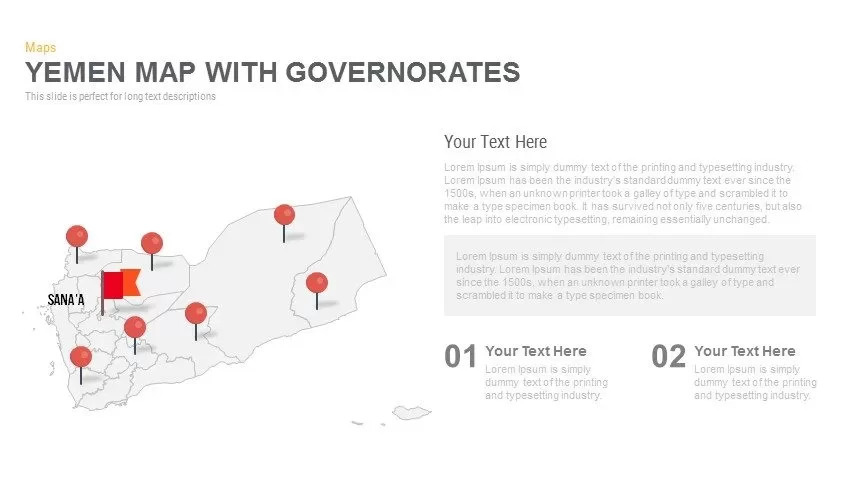
Yemen Governorates Infographic Map Template for PowerPoint & Google Slides
Maps
Colorful Mind Map Infographic Template for PowerPoint & Google Slides
Mind Maps
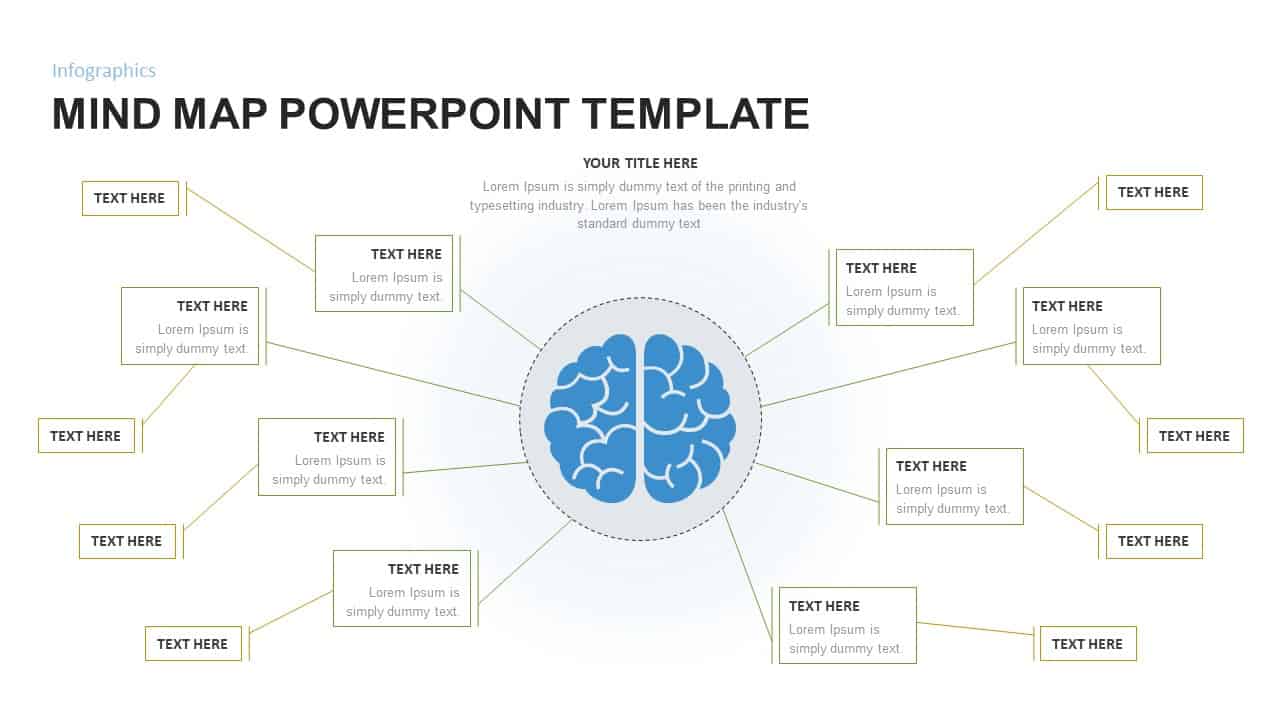
Mind Map Infographic Slide Template for PowerPoint & Google Slides
Mind Maps
Versatile Mind Map Infographic Template for PowerPoint & Google Slides
Mind Maps
Structured Mind Map Infographic Diagram Template for PowerPoint & Google Slides
Mind Maps
Dual Topic Mind Map Infographic Template for PowerPoint & Google Slides
Mind Maps
Fully Editable World Map Infographic Template for PowerPoint & Google Slides
World Maps
Editable World Map Callout Infographic Template for PowerPoint & Google Slides
World Maps
North America Percentage Map Infographic Template for PowerPoint & Google Slides
World Maps
Editable Ireland Map Infographic Slide Template for PowerPoint & Google Slides
World Maps
Free
Syria Regional Data Map Infographic Template for PowerPoint & Google Slides
World Maps

Iberian Peninsula Map Outline Infographic Template for PowerPoint & Google Slides
World Maps