Data Analysis Bar Chart with Insights Template for PowerPoint & Google Slides


Description
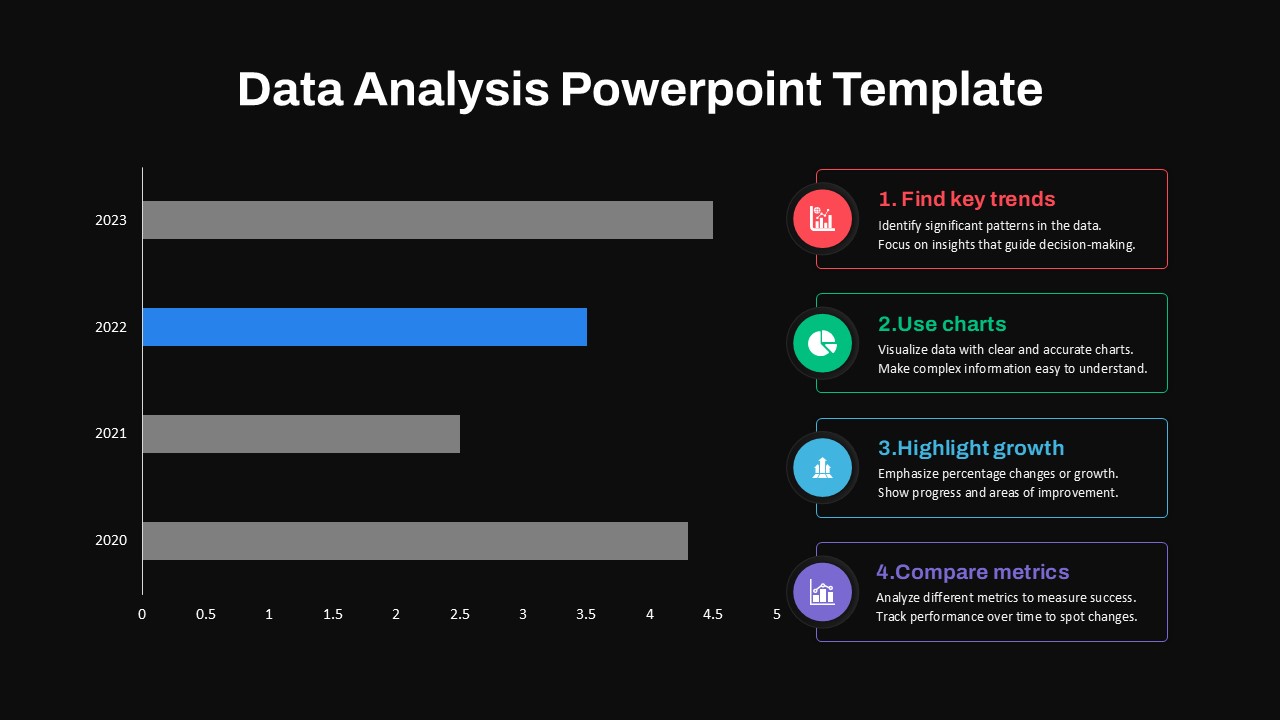
Utilize this data analysis slide to present annual metrics with clarity and step-by-step guidance. The left side showcases a horizontal bar chart illustrating values for 2020 through 2023, with a highlighted blue bar accent to draw attention to key data points. On the right, four color-coded modules—Find key trends, Use charts, Highlight growth, Compare metrics—combine intuitive icons and concise text to guide audience focus and reinforce best practices in analytic storytelling. The clean layout balances data visualization with instructional callouts, using grayscale bars and vibrant accents to maintain visual hierarchy and ensure readability.
This fully-editable template features vector shapes, customizable color schemes, and master layouts optimized for both PowerPoint and Google Slides. Resize charts, swap icons, or adjust text placeholders in seconds without compromising aspect ratios or slide proportions. The modular design supports rapid content updates, making it ideal for regular reporting cycles or ad-hoc deep dives into emerging trends.
Whether preparing a quarterly business review, executive briefing, or training workshop, this slide streamlines the communication of performance insights and action items. The combination of chart-driven analytics and structured process steps helps audiences quickly identify patterns, understand data contexts, and make informed decisions.
Beyond illustrating numerical trends, the slide’s four-step modules double as a framework for guiding analytic workflows—ideal for consulting deliverables, investor presentations, and academic lectures on data literacy. Leverage the numbered sections to align teams on methodology, highlight critical insights, and maintain narrative flow. Use color styles to match corporate branding, or switch to monochrome for formal reports. With support for high-resolution exports and widescreen formats, this asset ensures your data stories remain crisp on both large conference screens and web-based platforms.
Who is it for
Data analysts, business intelligence teams, and project managers will benefit from this slide when presenting annual metrics, highlighting key insights, and guiding audiences through analytic workflows. Consulting firms, strategy teams, and training facilitators can leverage the structured chart and step modules to standardize reporting and foster data-driven decision-making.
Other Uses
Use this template to illustrate sales trends, performance reviews, KPI reporting, or educational workshops. Adapt the modular callouts for process overviews, strategic planning sessions, or interactive e-learning modules focusing on methodology and best practices.
Login to download this file

Item ID
SB04617
Related Templates

Creative Data Analysis Bar Chart template for PowerPoint & Google Slides
Bar/Column
Pencil Bar Chart Data Analysis Template for PowerPoint & Google Slides
Bar/Column
Data Studio Insights template for PowerPoint & Google Slides
Business Report
3D Bar Chart Data Infographics Template for PowerPoint & Google Slides
Bar/Column
Simple Bar Chart Data Visualization Template for PowerPoint & Google Slides
Bar/Column
Bar Data Chart Slide for PowerPoint & Google Slides
Bar/Column
Waterfall Bar Chart Analysis Template for PowerPoint & Google Slides
Bar/Column
Expanding Margins Analysis Bar Chart Template for PowerPoint & Google Slides
Charts
Checkmate Slide for Strategic Insights Template for PowerPoint & Google Slides
Accomplishment
Finance AI Strategy & Insights Template for PowerPoint & Google Slides
AI
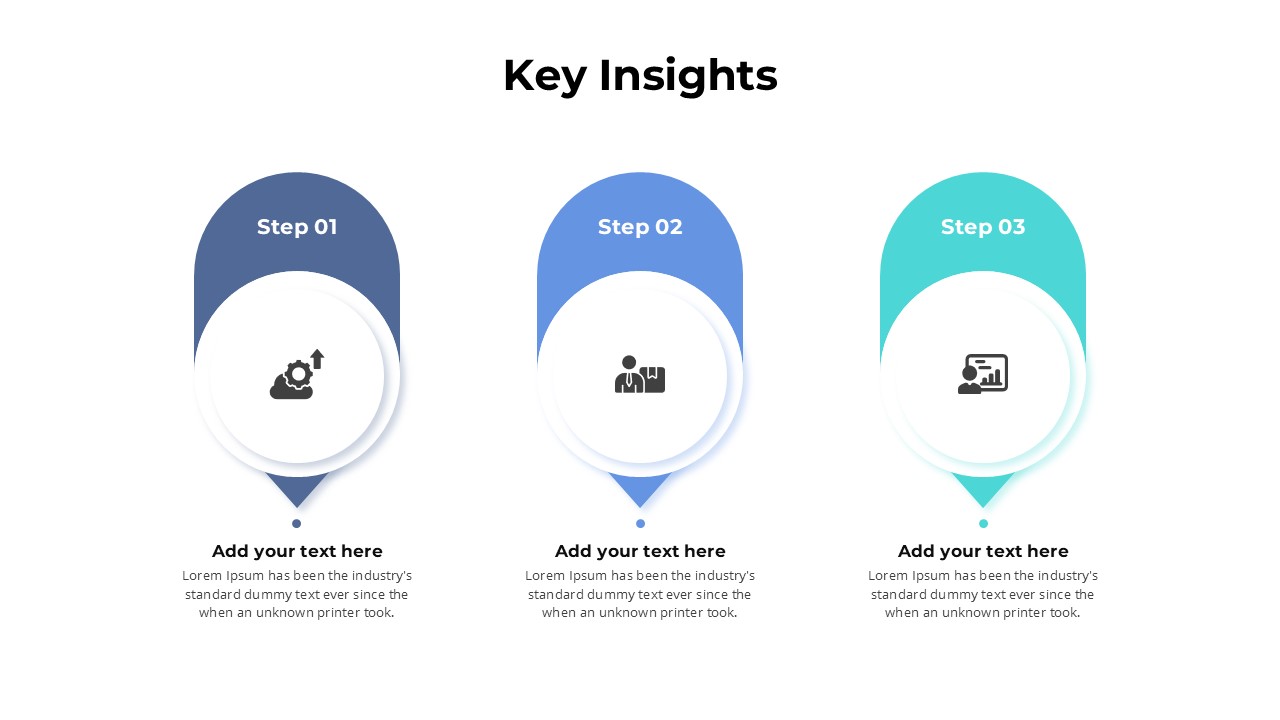
Key Insights Process Template for PowerPoint & Google Slides
Process
Landing Pages Optimization Insights Template for PowerPoint & Google Slides
Marketing Funnel
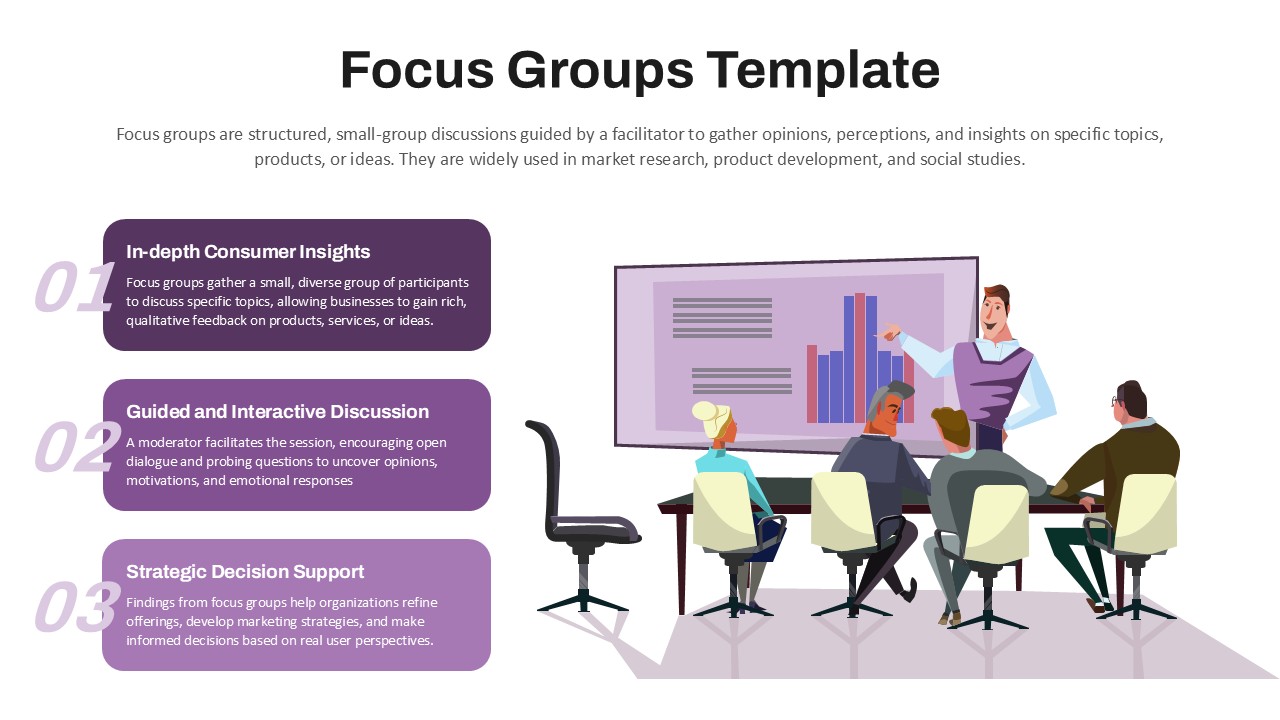
Focus Group Discussion and Insights Template for PowerPoint & Google Slides
Customer Experience
Customer Interview Insights Dashboard Template for PowerPoint & Google Slides
Customer Experience
Mobile Data Analysis Chart template for PowerPoint & Google Slides
Charts
Simple Area Chart Data Trends Analysis Template for PowerPoint & Google Slides
Comparison Chart

Clustered Column Chart Data Analysis Template for PowerPoint
Bar/Column
Bar Chart Sample template for PowerPoint & Google Slides
Bar/Column
Creative Bar Chart template for PowerPoint & Google Slides
Charts
Comparison Bar Chart template for PowerPoint & Google Slides
Comparison Chart
Three-Year Bar Chart template for PowerPoint & Google Slides
Charts
3D Cylinder Bar Chart Template for PowerPoint & Google Slides
Bar/Column

Monthly Reports Bar Chart template for PowerPoint & Google Slides
Bar/Column

Colorful Radial Bar Chart Template for PowerPoint & Google Slides
Bar/Column
Interactive Product Comparison Bar Chart Template for PowerPoint & Google Slides
Bar/Column
For and Against Vote Count Bar Chart Template for PowerPoint & Google Slides
Bar/Column
Entertainment Industry Revenue Bar Chart Template for PowerPoint & Google Slides
Bar/Column
Distracting Factors at Work Bar Chart Template for PowerPoint & Google Slides
Bar/Column
Statistics Infographic & KPI Bar Chart Template for PowerPoint & Google Slides
Bar/Column
Multi-Series Stacked Bar Chart Template for PowerPoint & Google Slides
Bar/Column
Monthly Recurring Revenue KPI Bar Chart Template for PowerPoint & Google Slides
Bar/Column
Combination Bar and Line Chart Template for PowerPoint & Google Slides
Bar/Column
Animated Clustered Bar Chart Template for PowerPoint & Google Slides
Bar/Column
Animated Stacked Bar Chart Template for PowerPoint & Google Slides
Bar/Column
Clustered Bar Chart Comparison Template for PowerPoint & Google Slides
Bar/Column
Business Timeline Comparison Bar Chart Template for PowerPoint & Google Slides
Comparison Chart
Year-over-Year Stacked Gender Bar Chart Template for PowerPoint & Google Slides
Bar/Column
Mirror Bar Chart Comparison Template for PowerPoint & Google Slides
Bar/Column
Dynamic Bar-of-Pie Chart Comparison Template for PowerPoint & Google Slides
Pie/Donut
Quarterly Revenue Comparison Bar Chart Template for PowerPoint & Google Slides
Bar/Column
Quarterly Sales Review Bar Chart Template for PowerPoint & Google Slides
Bar/Column
Horizontal Bar Chart Slide with Icons Template for PowerPoint & Google Slides
Bar/Column
Two-Option Bar Chart Comparison Table Template for PowerPoint & Google Slides
Comparison
Bar Gantt Chart Template for PowerPoint & Google Slides
Gantt Chart
USA Map with Bar Chart Template for PowerPoint & Google Slides
World Maps
Sales Bar Chart for PowerPoint & Google Slides
Bar/Column

Radial Bar Chart Diagram for PowerPoint & Google Slides
Bar/Column
Stacked Bar Chart for PowerPoint & Google Slides
Bar/Column
100% Stacked Bar Chart for PowerPoint & Google Slides
Bar/Column
Data Gap Analysis Template for PowerPoint & Google Slides
Business
Mobile User Data Analysis Infographic for PowerPoint & Google Slides
Process
Creative data chart analytics template for PowerPoint & Google Slides
Charts
Circle Chart Data template for PowerPoint & Google Slides
Pie/Donut
3D Cone Chart Data Visualization template for PowerPoint & Google Slides
Bar/Column
Tornado Chart Data Comparison Slide Template for PowerPoint & Google Slides
Bar/Column
Donut Chart Data Breakdown template for PowerPoint & Google Slides
Pie/Donut
Waffle Chart Data Visualization Template for PowerPoint & Google Slides
Comparison Chart
Free Stacked Column Chart Data Visualization Template for PowerPoint & Google Slides
Bar/Column
Free
XY Bubble Chart Data Visualization Template for PowerPoint & Google Slides
Comparison Chart
Data Over Time Line Chart template for PowerPoint & Google Slides
Charts
Waterfall Chart Data Visualization Template for PowerPoint & Google Slides
Comparison Chart
Multipurpose Spline Chart Data Trend Template for PowerPoint & Google Slides
Bar/Column
Interactive Jump Line Data Chart Template for PowerPoint & Google Slides
Comparison Chart
Segmented Scatter Chart Data Visualization Template for PowerPoint & Google Slides
Business Strategy
Weekly Data Chart Slide for PowerPoint & Google Slides
Comparison Chart

3D Column Chart with Data Table for PowerPoint & Google Slides
Bar/Column
Cone Data Chart for PowerPoint & Google Slides
Charts
3D Cylinder Bar Chart Visualization Template for PowerPoint
Bar/Column
Data-Driven Line Chart Diagram Template for PowerPoint
Comparison Chart
3D Bar Graph Infographic Template for PowerPoint & Google Slides
Bar/Column
Five-Stage Vertical Bar Process Template for PowerPoint & Google Slides
Process
Timeline Roadmap with Progress Bar Template for PowerPoint & Google Slides
Timeline
Progress Bar and Milestone Visualization Template for PowerPoint & Google Slides
Timeline

Blank Bar Graph Template for PowerPoint & Google Slides
Bar/Column
Progress Bar Graph Layout Design for PowerPoint & Google Slides
Charts
Progress Bar Infographic for PowerPoint & Google Slides
Business
Progress Bar infographic pack for PowerPoint & Google Slides
Business
Five Options Business Bar Graph for PowerPoint & Google Slides
Business Report
Data Science PowerPoint Presentation Template for PowerPoint & Google Slides
Pitch Deck
Data Center PowerPoint Template for PowerPoint & Google Slides
Information Technology
Interactive US Population Data Map Slide Template for PowerPoint & Google Slides
World Maps
3D Stacked Infographic Layers Data Template for PowerPoint & Google Slides
Pyramid
Gear Pie Diagram Data Visualization Template for PowerPoint & Google Slides
Pie/Donut
Immigration Data Dashboard Template for PowerPoint & Google Slides
Bar/Column
Mobile Infographics Data Visualization Template for PowerPoint & Google Slides
Infographics
Data Management and Analytics Diagram Template for PowerPoint & Google Slides
Circular
Data Migration Life Cycle Curved Diagram Template for PowerPoint & Google Slides
Process
Medical Infographics Data Visualization Template for PowerPoint & Google Slides
Health
KPI Dashboard Data Visualization Template for PowerPoint & Google Slides
Bar/Column
North America Data Map Callouts Template for PowerPoint & Google Slides
World Maps
Professional Heatmap Data Visualization Template for PowerPoint & Google Slides
Infographics
Editable Africa Map Infographic Data Template for PowerPoint & Google Slides
World Maps
Advanced Data Flow Diagram Pack Template for PowerPoint & Google Slides
Flow Charts
Data Lake Hub-and-Spoke Diagram Template for PowerPoint & Google Slides
Cloud Computing
Data Protection Strategies template for PowerPoint & Google Slides
Information Technology
Data Flywheel Strategy template for PowerPoint & Google Slides
Business
Data Privacy and Compliance in ML template for PowerPoint & Google Slides
Technology
AI and Data Ecosystem Map Template for PowerPoint & Google Slides
AI
Data Governance Roles Pyramid Diagram Template for PowerPoint & Google Slides
Pyramid
Business Data Table Template for PowerPoint & Google Slides
Table