Cylinder Bar Chart PowerPoint Template and Keynote Slide
Cylinder Bar Chart PowerPoint Template
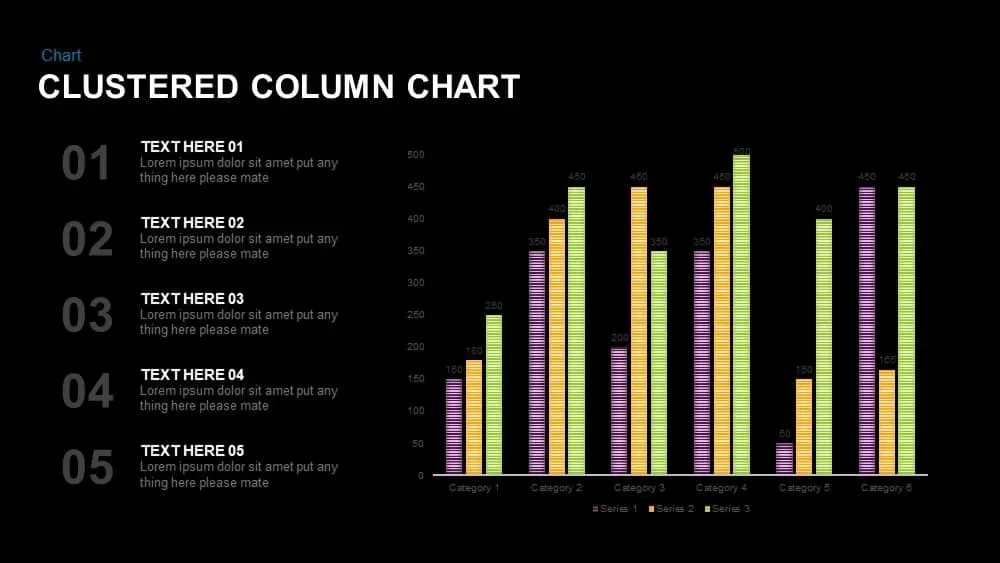
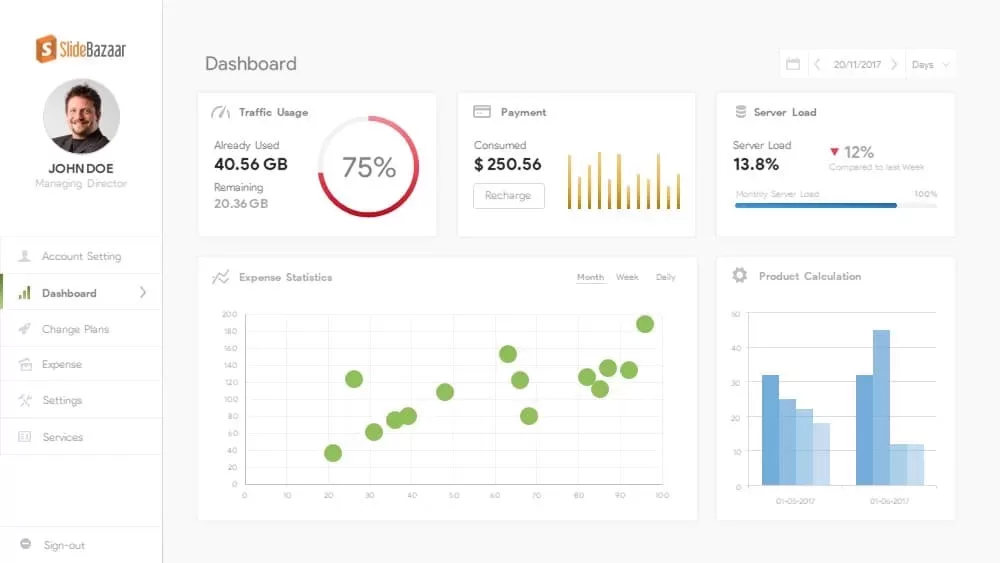
Clustered bar chart is a representation of a group of data. The cylinder bar chart PowerPoint template and keynote can be used to show the proportions of different values with different heights of the clustered bars. Bar charts are a commonly used statistical tools to monitor different data series. The diagram is useful for researchers and business professionals to show their concepts easily and impeccably. Typically, bar charts used rectangular bars to depict categorical data, but here the bars are shaped as cylinders, this style arouses the artistic sense of the audiences and they may give full attention to the presentation data. The editable bar chart PowerPoint and keynote template allow customization and modifications.
Bar charts and histograms are commonly used statistical languages to display the frequency distribution of an event or data. Cylinder bar chart PowerPoint template and keynote representing many clusters of groups which are systematically arranged with vertical bar charts. Different values of a data series can be categorized analyzed and interpreted with inferential statistics. Each cluster has three distinctive and non-symmetrical bars, quantitative values are generally proportional to the height of bars.
PowerPoint template is ideal to show the different ranges. Therefore the column has different heights and widths. The measurement of qualitative data can be transformed as quantitative; therefore cylinder bar chart template can be used to show both data series, the bars have different colours, such as light pink, grey and dark grey. The design makes them stand out against the white and black background; slides can be used to show either sales projections or historical sales data and also apply to monitor outflows of financial and capital markets. The PowerPoint objects, including the graph, are fully editable which allows the user to modify the presentation to allow maximum participation of the audience. The presenter can browse other PowerPoint Charts from the showcase Charts&Data Gallery.
You can access more Bar Chart PowerPoint Templates here Grab the free ppt now!
Login to download this file


