3D Cylinder Diagram Template for PowerPoint & Google Slides
3D Cylinder Diagram for PowerPoint and Google Slides
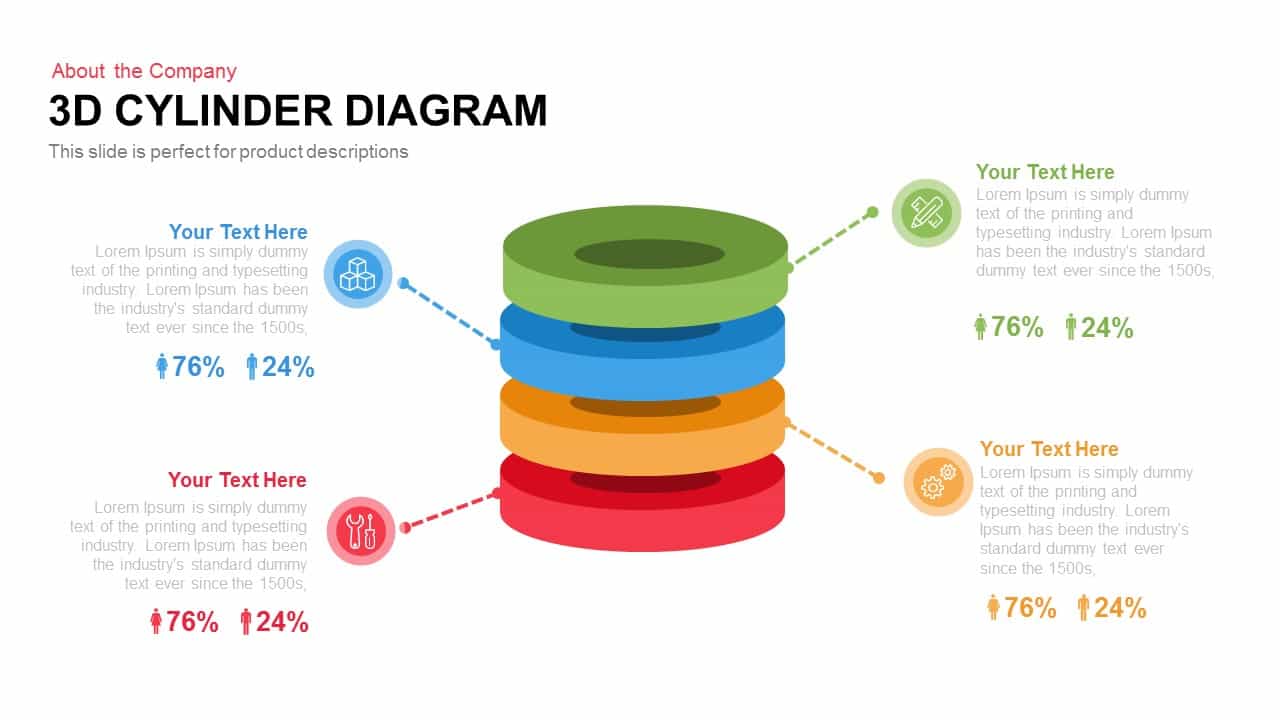
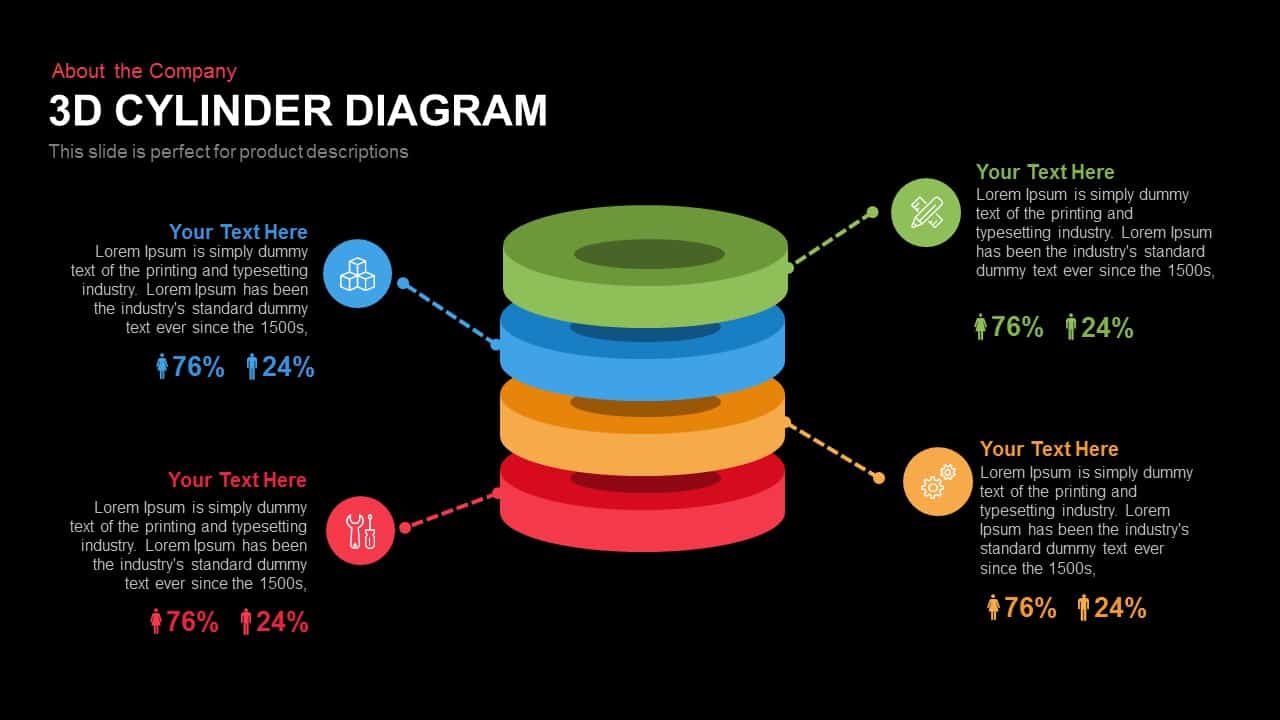
Breaking down layered operational structures, software stacks, resource allocations, or four-tier product tiers benefits from a clear volumetric model. This 3D cylinder diagram equips business analysts, product managers, and team leaders with an intuitive stacked-ring visualization to present hierarchical data and demographic ratios side by side. Set against a clean light background, the colorful cylindrical disks create immediate depth, helping your audience grasp multi-level concepts and statistical splits without getting bogged down in plain text tables.
Key highlights and features include:
- A centrally positioned four-tier 3D cylinder constructed from stacked, hollow circular disks.
- Four distinct accent colors establishing clear visual tiers across green, blue, orange, and red layers.
- Diagonal dashed connector lines linking each cylinder layer directly to dedicated left and right information blocks.
- Thematic circular icons highlighting core operational domains such as product design (ruler and pencil), inventory (stacked boxes), technical maintenance (tools), and process execution (gears).
- Built-in demographic split callouts displaying gender or user ratio indicators (76% to 24%) across all four quadrants.
- Generous text space alongside each tier for concise descriptive summaries, technical specifications, or divisional roles.
- Completely editable vector graphics allowing instant customization of colors, percentage metrics, icons, and layout proportions directly in PowerPoint or Google Slides.
- Versatile graphic asset suited for a 3D cylinder diagram PowerPoint template during corporate capability reviews, product roadmap briefings, and IT architecture presentations.
Login to download this file

Item ID
SB00195