XY Bubble Chart Data Visualization Template for PowerPoint & Google Slides


Description
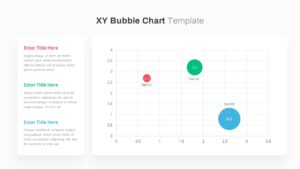
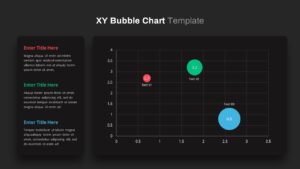
Leverage this versatile XY bubble chart slide to present complex three-dimensional data comparisons with clarity and visual appeal. The lightweight, minimal design features a crisp white background, a subtle grid layout, and evenly spaced tick marks along both axes to ensure precise readability. Each data point is represented by a colored bubble—red, green, or blue—with overlaid numeric labels that indicate magnitude at a glance. Beneath each bubble, customizable text labels enable concise annotation of categories or series names. The left-side panel includes three distinct title-and-text sections, each color-coded to correspond with its respective data series, allowing you to contextualize insights, define metrics, or highlight critical observations in a structured format.
Built with editable master slides and vector-based graphics, this asset offers seamless customization: resize or reposition bubbles, adjust axis scales, swap color hues, and modify typography instantly to align with your brand identity. The slide’s adaptable layout supports version control by preserving visual consistency across updates, while its compatibility with both PowerPoint and Google Slides guarantees flawless rendering on any device or platform.
Whether you’re analyzing market segmentation, evaluating product performance, or comparing project KPIs, this bubble chart template streamlines your data storytelling process. The slide’s structured format promotes data-driven discussions, enabling stakeholders to uncover correlations, outliers, and emerging trends without losing context. Beyond standard data analysis, repurpose this slide to illustrate resource allocation, risk assessment matrices, or scenario planning. By leveraging dynamic sizing and color coding, you can create impactful visualizations that resonate with executive teams, investors, and cross-functional collaborators. The intuitive layout reduces presentation prep time and enhances audience comprehension.
Who is it for
Business analysts, product managers, marketing strategists, and data scientists will find this bubble chart slide invaluable for communicating multi-dimensional metrics. Project leaders and executives can leverage its clear design to present performance comparisons, market positions, or KPI assessments effectively at stakeholder meetings, strategy sessions, and investor briefings.
Other Uses
Adapt this slide to showcase resource allocation models, risk vs. reward analyses, or scenario planning matrices. The dynamic bubble sizes and color coding also suit budget breakdowns, portfolio comparisons, or customer segmentation exercises. Simply modify axis labels and annotations to apply this framework across finance, operations, or research presentations.
Login to download this file

Item ID
SB03644
Related Templates

3D Cone Chart Data Visualization template for PowerPoint & Google Slides
Bar/Column
Waffle Chart Data Visualization Template for PowerPoint & Google Slides
Comparison Chart
Free Stacked Column Chart Data Visualization Template for PowerPoint & Google Slides
Bar/Column
Free
Simple Bar Chart Data Visualization Template for PowerPoint & Google Slides
Bar/Column
Waterfall Chart Data Visualization Template for PowerPoint & Google Slides
Comparison Chart
Segmented Scatter Chart Data Visualization Template for PowerPoint & Google Slides
Business Strategy
Circle Graph Data Visualization Template for PowerPoint & Google Slides
Circular
Gear Pie Diagram Data Visualization Template for PowerPoint & Google Slides
Pie/Donut
Leaf Infographic Data Visualization Template for PowerPoint & Google Slides
Infographics
Mobile Infographics Data Visualization Template for PowerPoint & Google Slides
Infographics
Medical Infographics Data Visualization Template for PowerPoint & Google Slides
Health
KPI Dashboard Data Visualization Template for PowerPoint & Google Slides
Bar/Column
Professional Heatmap Data Visualization Template for PowerPoint & Google Slides
Infographics
UK Counties Map Data Visualization Template for PowerPoint & Google Slides
World Maps
Free Big Data Network Visualization Template for PowerPoint & Google Slides
Circular
Free
Growth Curve Line Chart Visualization Template for PowerPoint & Google Slides
Charts
Dynamic Sunburst Chart Visualization Template for PowerPoint & Google Slides
Charts
3D Cylinder Bar Chart Visualization Template for PowerPoint
Bar/Column
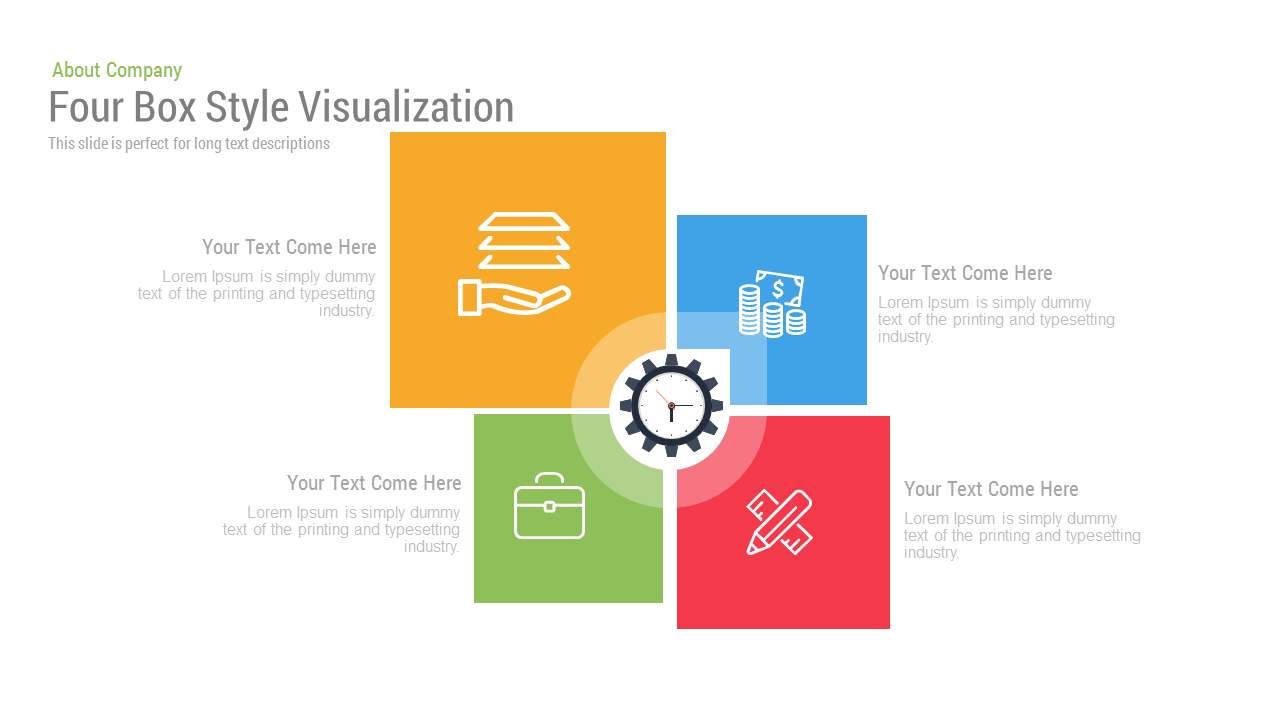
Free Four Box Style Visualization template for PowerPoint & Google Slides
Process
Free

Bold Diamond Risk Alert Visualization Template for PowerPoint & Google Slides
Risk Management
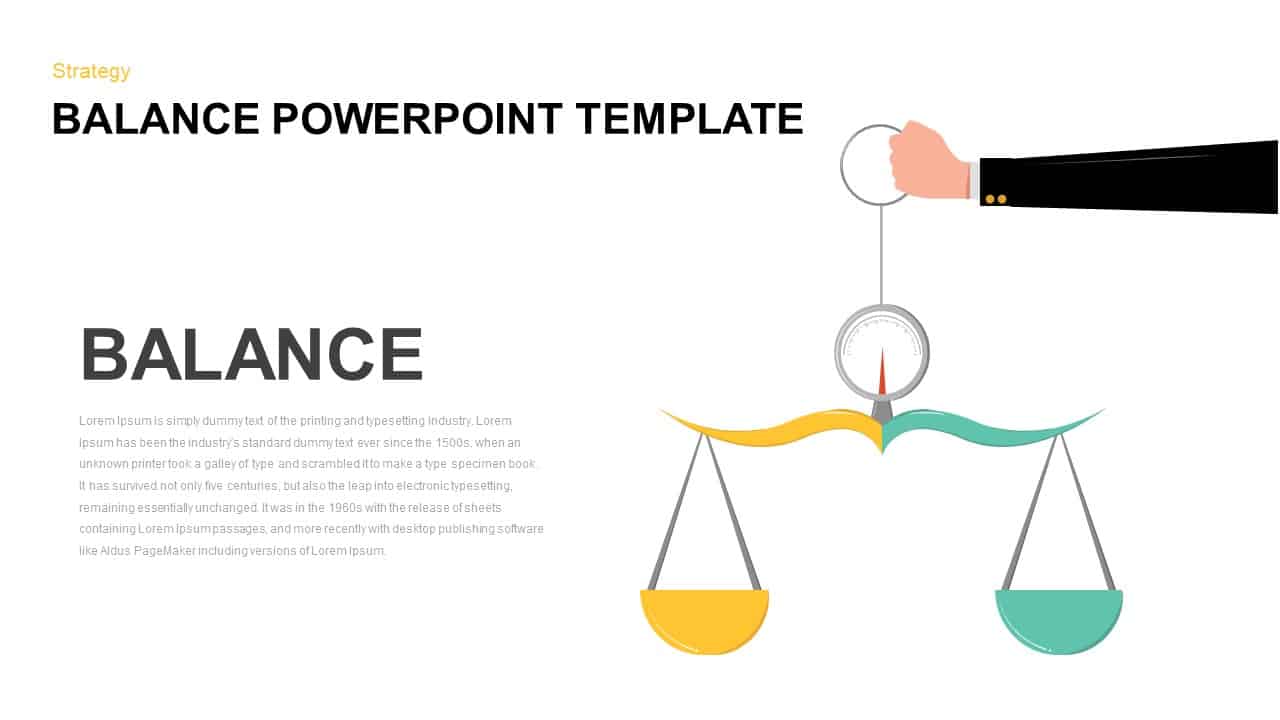
Balance Scale Visualization Infographic Template for PowerPoint & Google Slides
Comparison
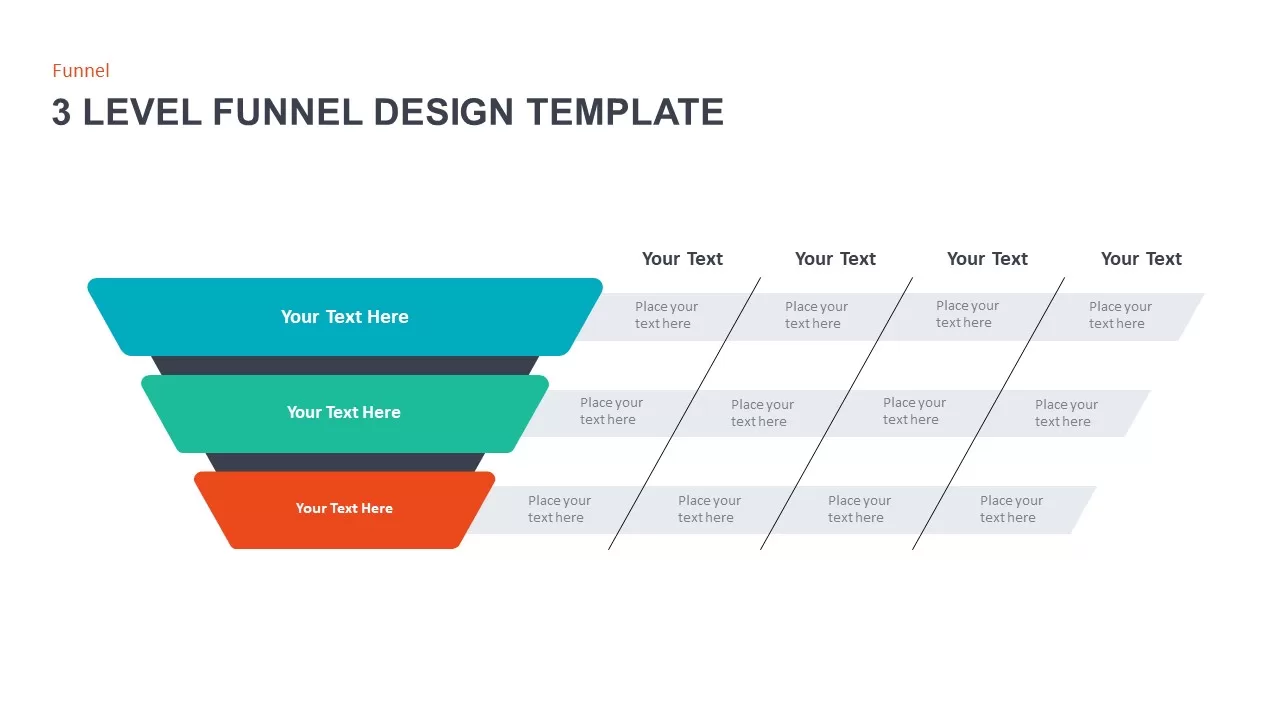
3 Level Funnel Design Visualization Template for PowerPoint & Google Slides
Funnel
Professional Risk Heat Map Visualization Template for PowerPoint & Google Slides
Risk Management
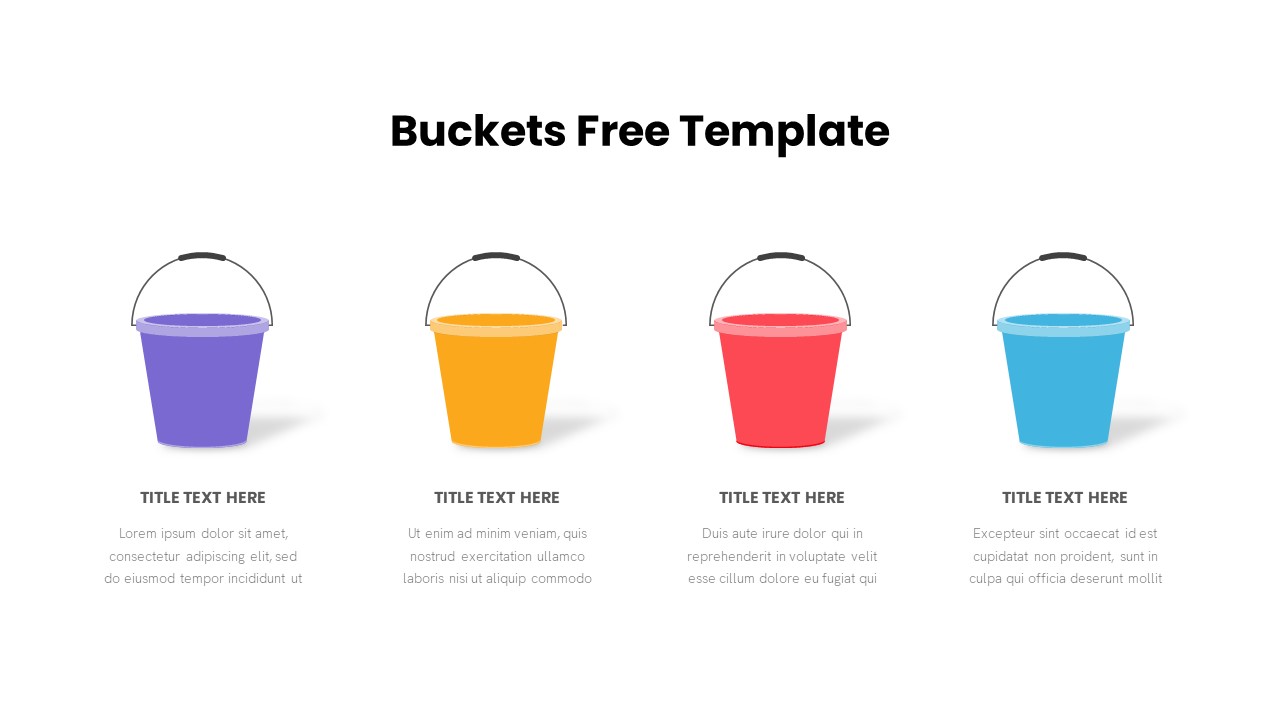
Free Bucket Process Visualization Template for PowerPoint & Google Slides
Process
Free
Animated Light Bulb Visualization Template for PowerPoint & Google Slides
Process
Progress Bar and Milestone Visualization Template for PowerPoint & Google Slides
Timeline
Kentucky County Map Visualization Template for PowerPoint & Google Slides
World Maps
Bubble Chart template for PowerPoint & Google Slides
Charts
Bubble Chart Scatter, Diagram & Matrix Template for PowerPoint & Google Slides
Comparison Chart
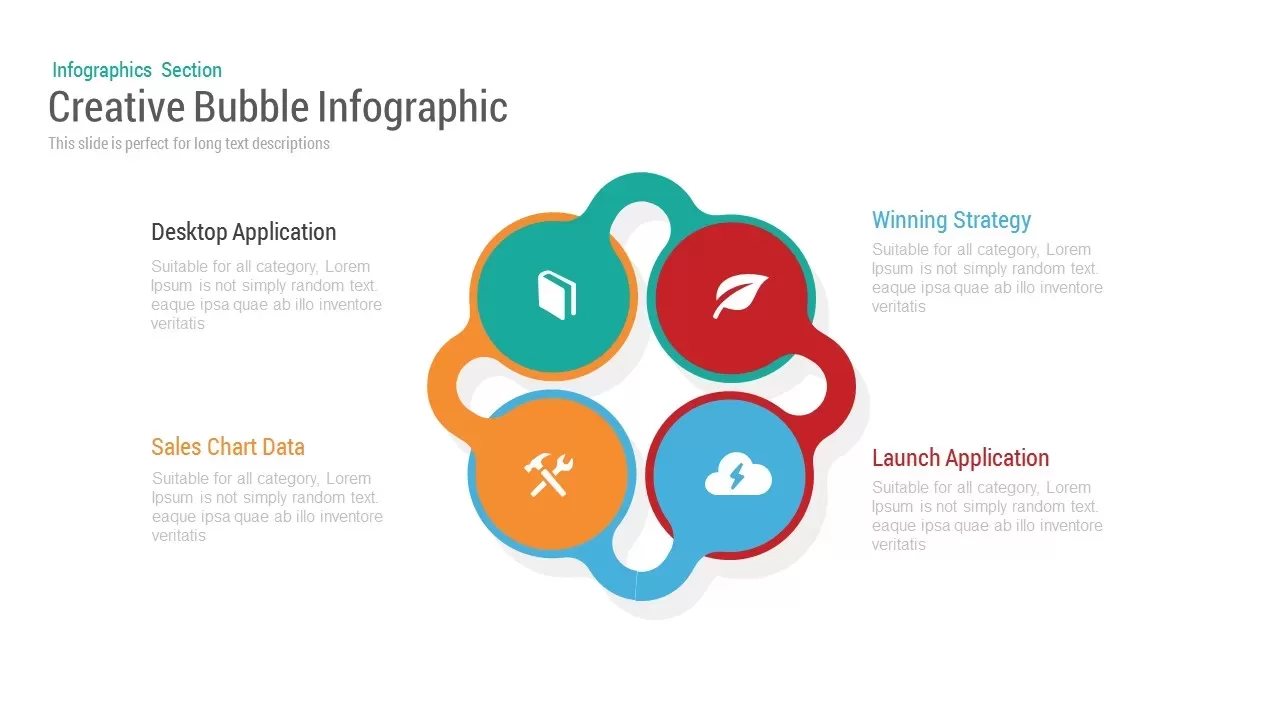
Bubble Infographic template for PowerPoint & Google Slides
Circular
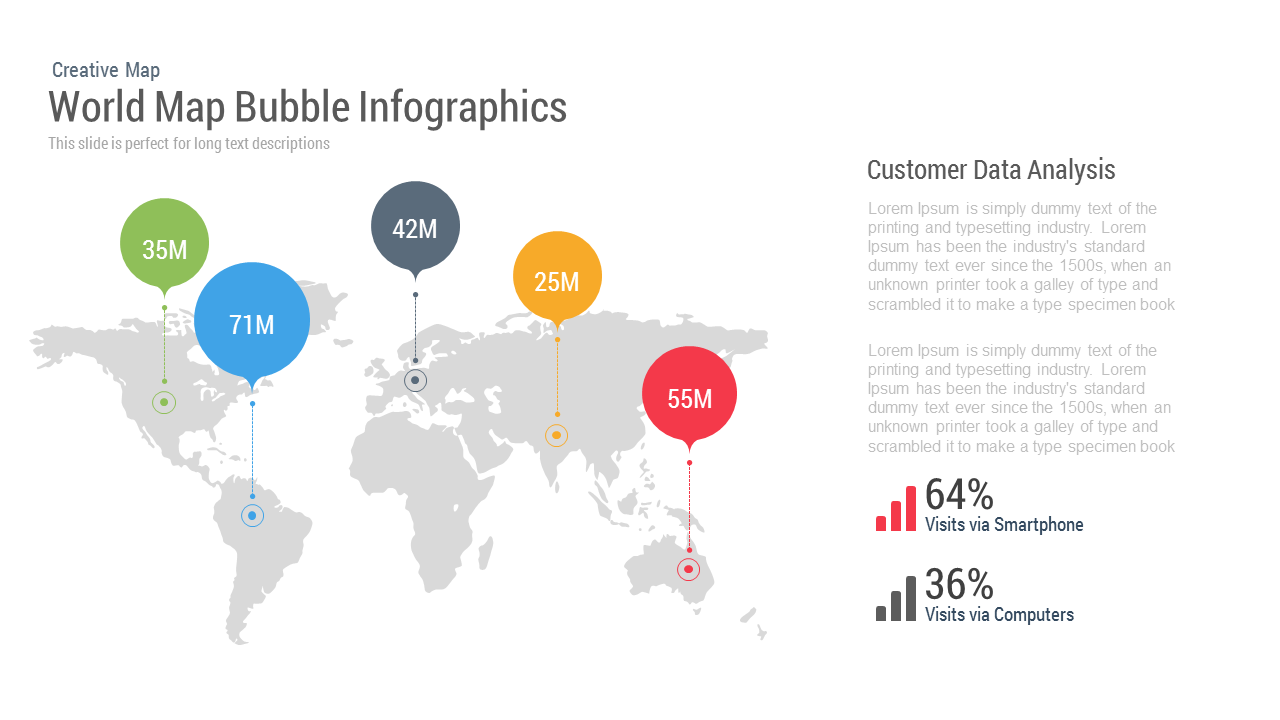
World Map Bubble template for PowerPoint & Google Slides
World Maps
Bubble Head Metrics Infographic Template for PowerPoint & Google Slides
Circular
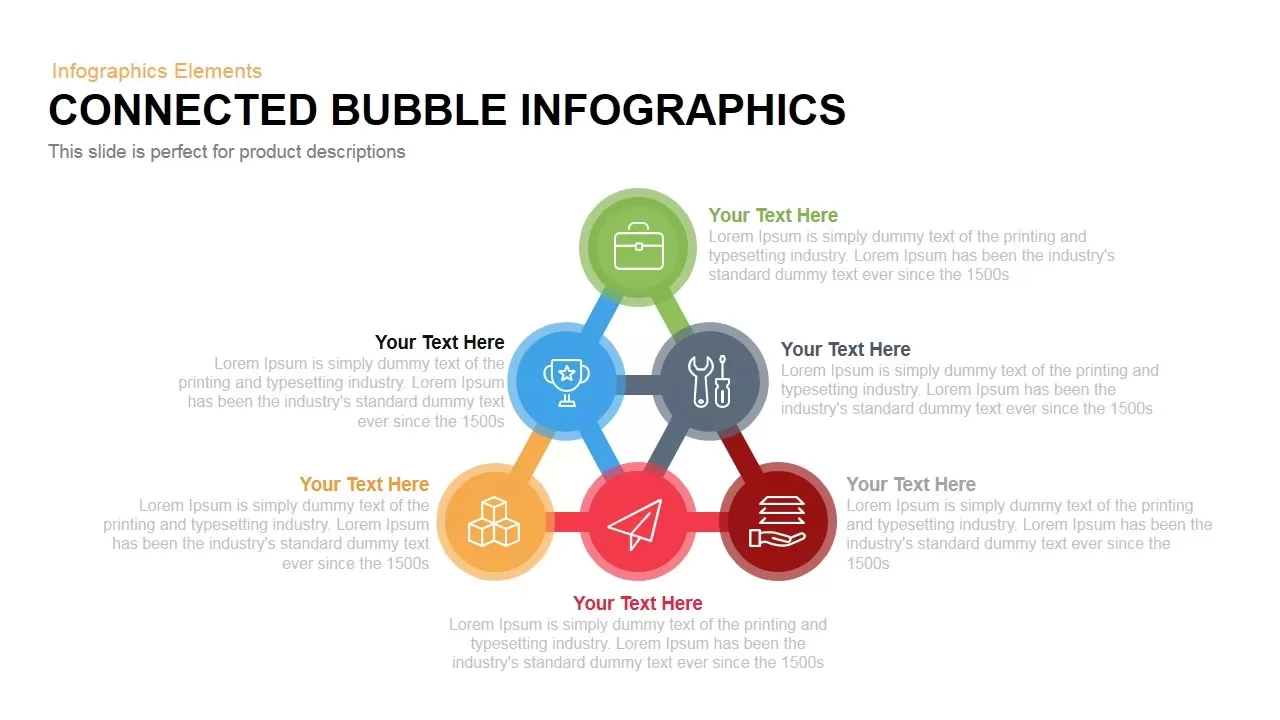
Connected Bubble Network Infographic Template for PowerPoint & Google Slides
Circular
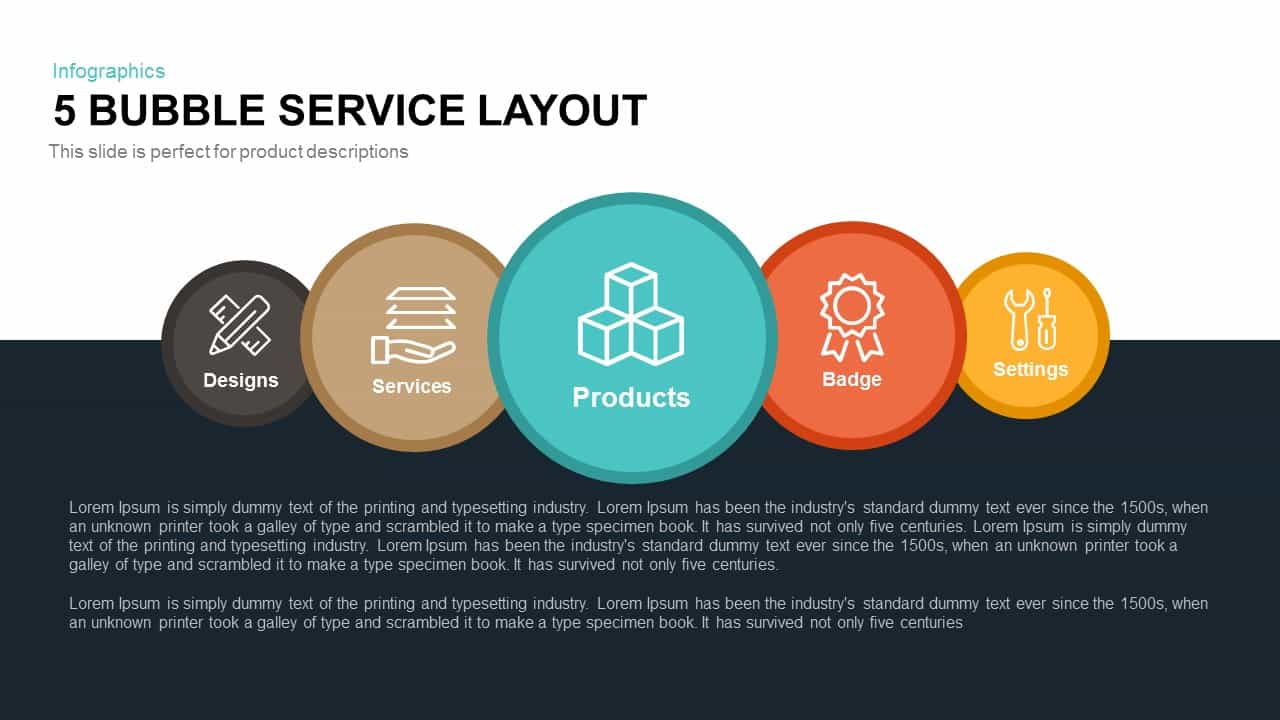
5 Bubble Service Layout Diagram Template for PowerPoint & Google Slides
Process
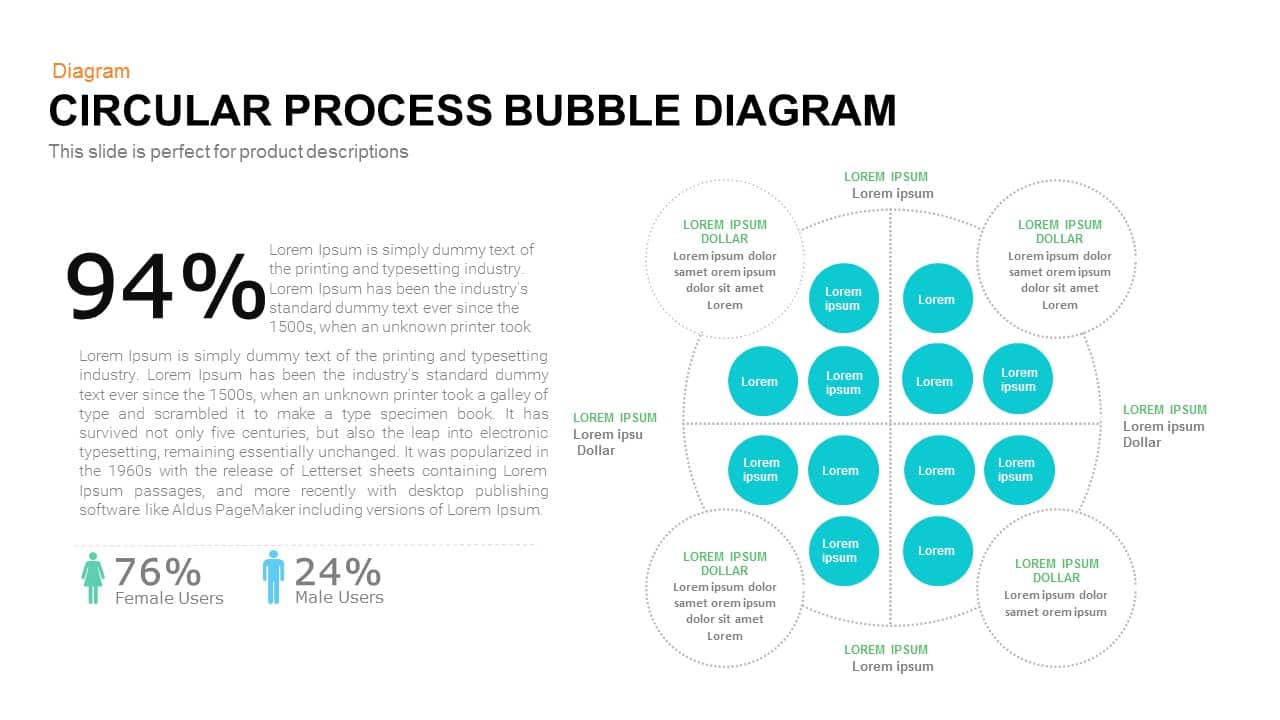
Bubble Circular Process Diagram Template for PowerPoint & Google Slides
Process

Editable Six-Step Bubble Process Diagram Template for PowerPoint & Google Slides
Process
Free Six Stage Bubble Process Diagram template for PowerPoint & Google Slides
Process
Free
Modern Bubble Timeline Infographic Template for PowerPoint & Google Slides
Timeline
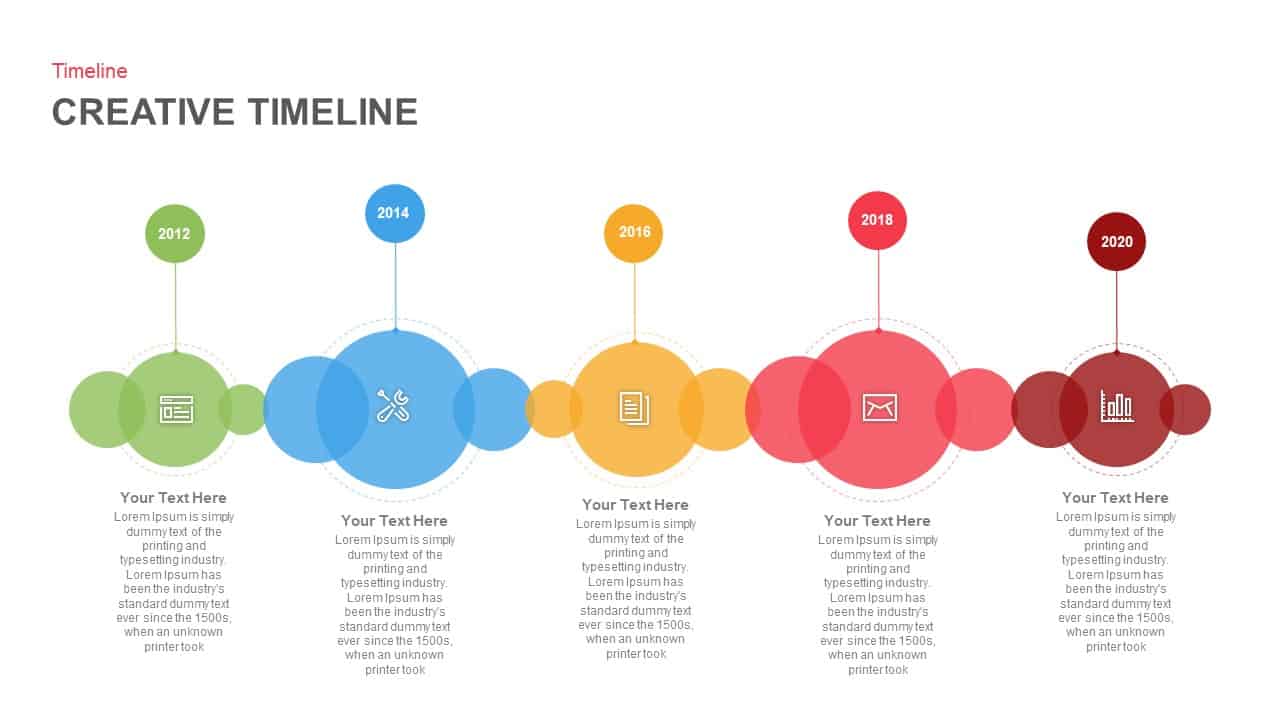
Creative Bubble Timeline Infographic Template for PowerPoint & Google Slides
Timeline
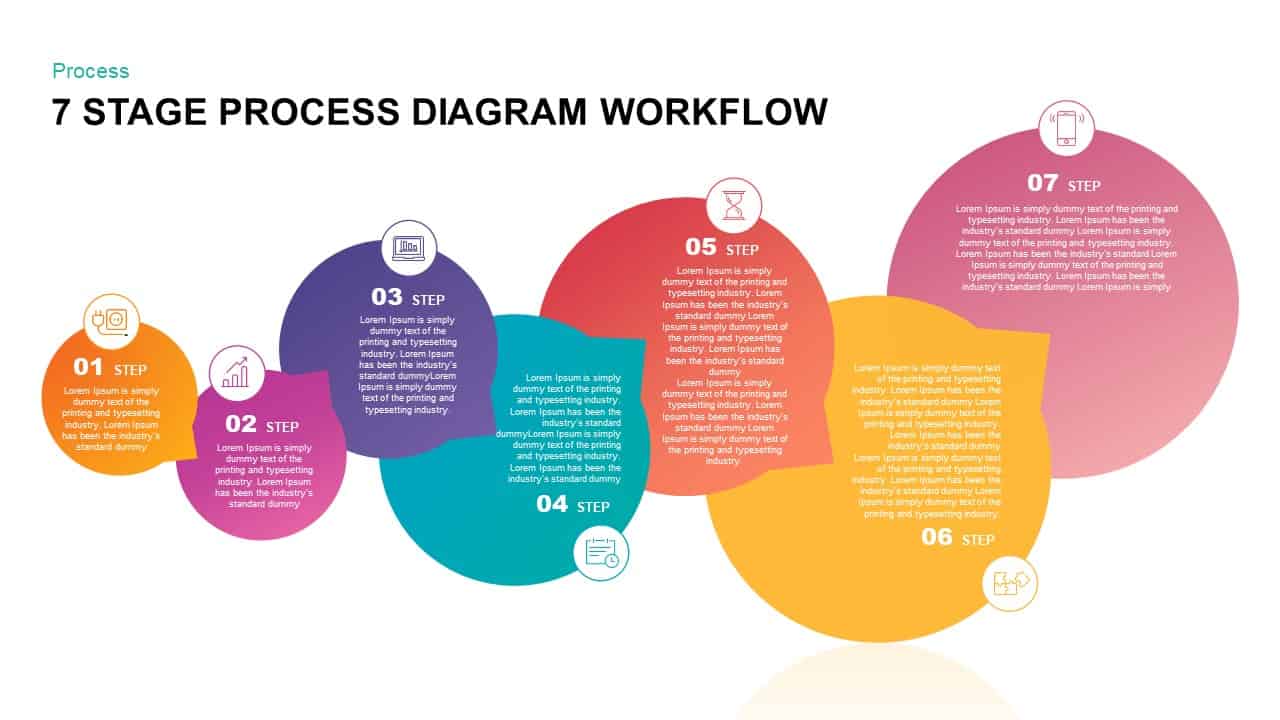
Gradient Seven-Stage Bubble Workflow Template for PowerPoint & Google Slides
Process
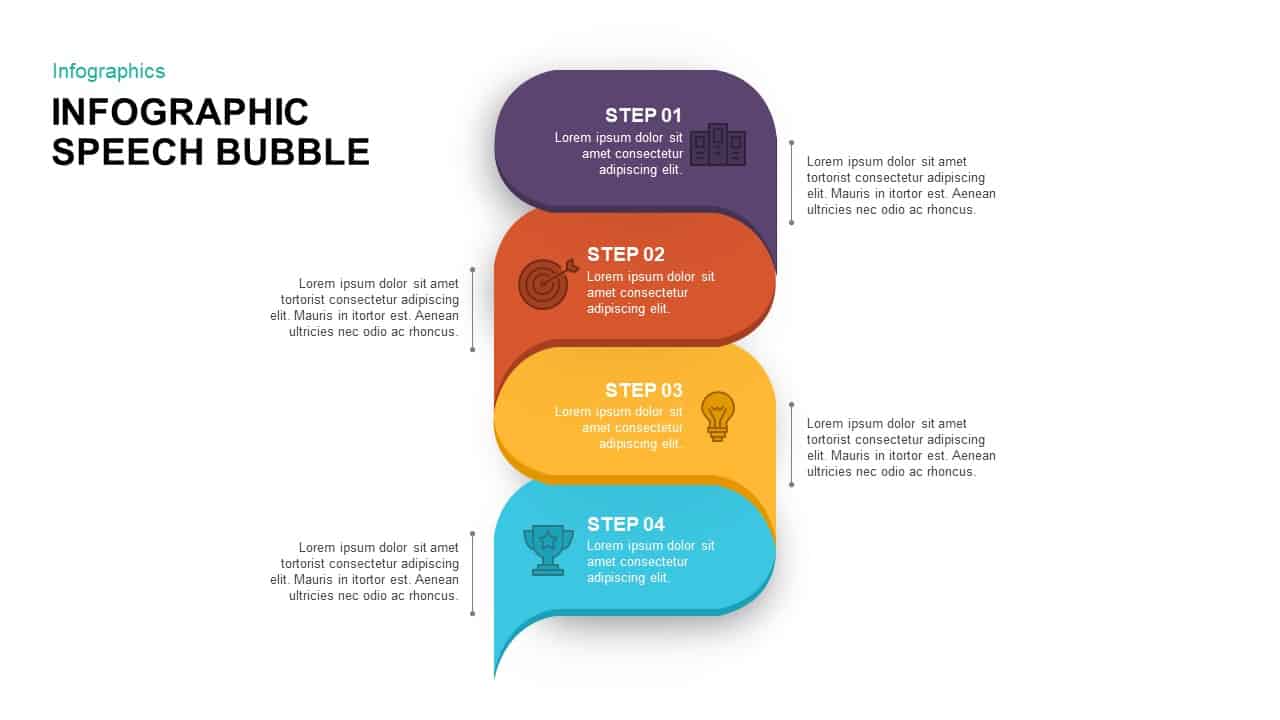
Four-Step Speech Bubble Diagram Template for PowerPoint & Google Slides
Process
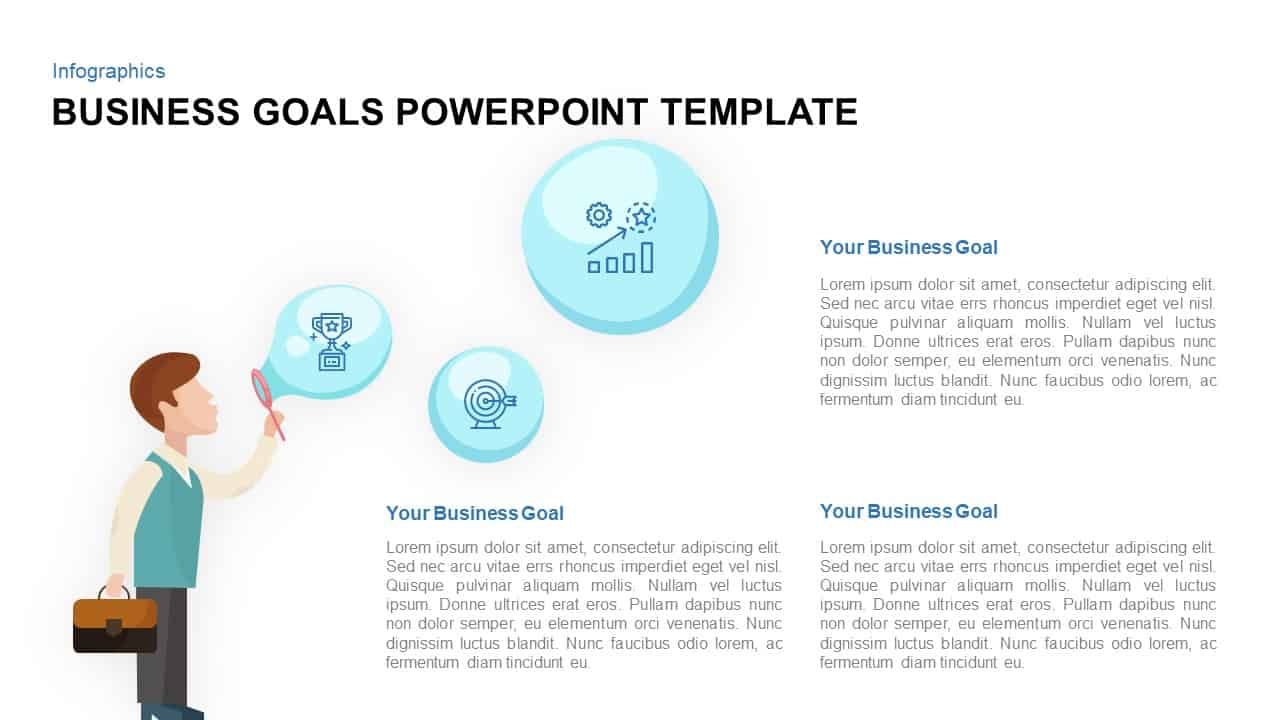
Business Goals Bubble Infographic Template for PowerPoint & Google Slides
Infographics

Team Testimonial Speech Bubble Slide Template for PowerPoint & Google Slides
Our Team
Bubble Photo Collage Template for PowerPoint & Google Slides
Graphics
Graphic Organizer & Double Bubble Map Template for PowerPoint & Google Slides
Maps
Creative Bubble Mind Map Template for PowerPoint & Google Slides
Mind Maps
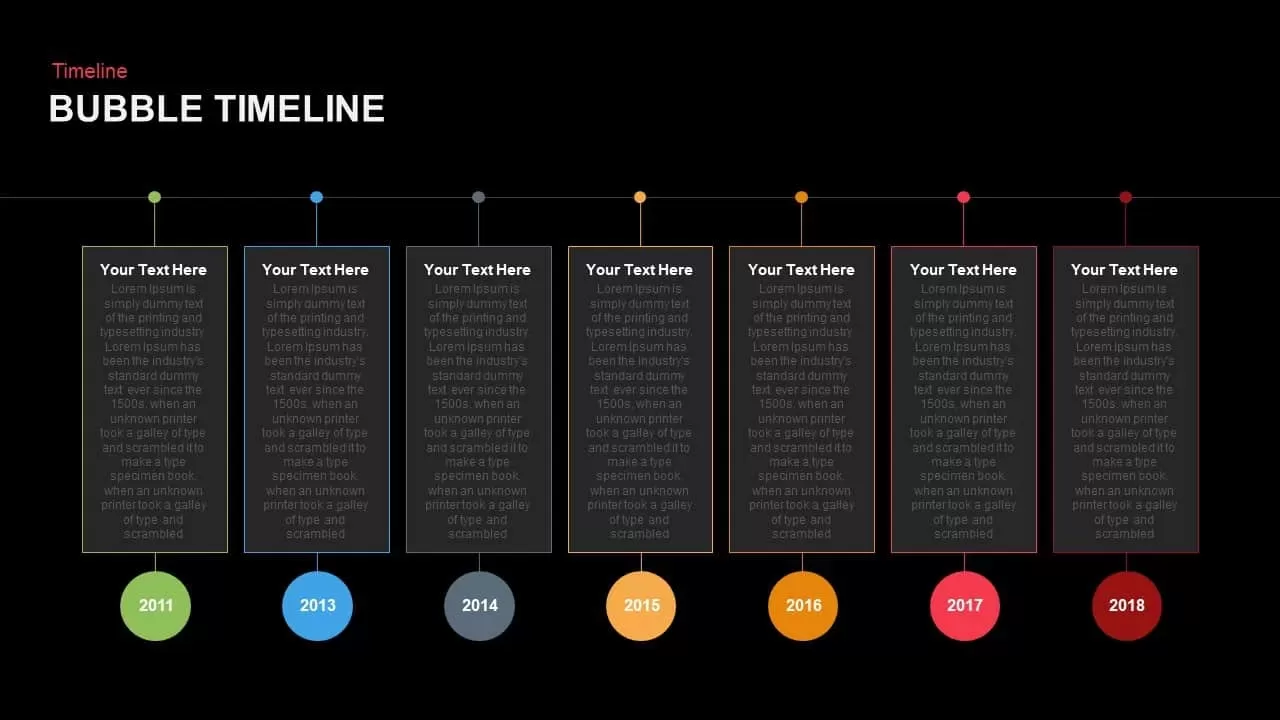
Bubble Timeline Infographics PowerPoint Template and Keynote
Business

Creative data chart analytics template for PowerPoint & Google Slides
Charts
Mobile Data Analysis Chart template for PowerPoint & Google Slides
Charts
Circle Chart Data template for PowerPoint & Google Slides
Pie/Donut
Creative Data Analysis Bar Chart template for PowerPoint & Google Slides
Bar/Column
3D Bar Chart Data Infographics Template for PowerPoint & Google Slides
Bar/Column
Pencil Bar Chart Data Analysis Template for PowerPoint & Google Slides
Bar/Column
Tornado Chart Data Comparison Slide Template for PowerPoint & Google Slides
Bar/Column
Donut Chart Data Breakdown template for PowerPoint & Google Slides
Pie/Donut
Simple Area Chart Data Trends Analysis Template for PowerPoint & Google Slides
Comparison Chart
Data Over Time Line Chart template for PowerPoint & Google Slides
Charts
Multipurpose Spline Chart Data Trend Template for PowerPoint & Google Slides
Bar/Column
Interactive Jump Line Data Chart Template for PowerPoint & Google Slides
Comparison Chart
Data Analysis Bar Chart with Insights Template for PowerPoint & Google Slides
Bar/Column
Free
Bar Data Chart Slide for PowerPoint & Google Slides
Bar/Column
Weekly Data Chart Slide for PowerPoint & Google Slides
Comparison Chart

3D Column Chart with Data Table for PowerPoint & Google Slides
Bar/Column

Cone Data Chart for PowerPoint & Google Slides
Charts
Data-Driven Line Chart Diagram Template for PowerPoint
Comparison Chart
Clustered Column Chart Data Analysis Template for PowerPoint
Bar/Column
Data Science PowerPoint Presentation Template for PowerPoint & Google Slides
Pitch Deck
Data Center PowerPoint Template for PowerPoint & Google Slides
Information Technology
World Map Data template for PowerPoint & Google Slides
World Maps

Smartphone Data User template for PowerPoint & Google Slides
Charts
Interactive US Population Data Map Slide Template for PowerPoint & Google Slides
World Maps
Data Analytics Dashboard Design template for PowerPoint & Google Slides
Bar/Column
Data-Driven Marketing Cycle Diagram Template for PowerPoint & Google Slides
Customer Journey
Bottle Data Percentage Infographic Template for PowerPoint & Google Slides
Infographics
Immigration Data Dashboard Template for PowerPoint & Google Slides
Bar/Column
Data Management and Analytics Diagram Template for PowerPoint & Google Slides
Circular
Data Migration Life Cycle Curved Diagram Template for PowerPoint & Google Slides
Process
Data-driven GDP Growth Infographic Pack Template for PowerPoint & Google Slides
Infographics
KPI Dashboard Data Overview Slide Template for PowerPoint & Google Slides
Bar/Column
North America Data Map Callouts Template for PowerPoint & Google Slides
World Maps
Editable Africa Map Infographic Data Template for PowerPoint & Google Slides
World Maps
Advanced Data Flow Diagram Pack Template for PowerPoint & Google Slides
Flow Charts
Syria Regional Data Map Infographic Template for PowerPoint & Google Slides
World Maps
ETL Data Pipeline Workflow Diagram Template for PowerPoint & Google Slides
Process
Data Privacy template for PowerPoint & Google Slides
Information Technology
Data Protection Strategies template for PowerPoint & Google Slides
Information Technology
Data Flywheel Strategy template for PowerPoint & Google Slides
Business
Data Privacy and Compliance in ML template for PowerPoint & Google Slides
Technology
Data-Driven AI in Insurance Infographic Template for PowerPoint & Google Slides
Circular
AI and Data Ecosystem Map Template for PowerPoint & Google Slides
AI
Data Studio Insights template for PowerPoint & Google Slides
Business Report
Data Protection & Encryption in the Cloud Overview template for PowerPoint & Google Slides
Cloud Computing
Customer Data Platform Workflow Diagram Template for PowerPoint & Google Slides
Information Technology
Data-Driven Marketing Lifecycle Diagram Template for PowerPoint & Google Slides
Process
Data-Driven Decision Making overview template for PowerPoint & Google Slides
Business
First Party Data Overview Template for PowerPoint & Google Slides
Business
Data Governance Roles Pyramid Diagram Template for PowerPoint & Google Slides
Pyramid
Business Data Table Template for PowerPoint & Google Slides
Table
Colorful Business Data Comparison Table Template for PowerPoint & Google Slides
Table
Six Column Data Table Template for PowerPoint & Google Slides
Table