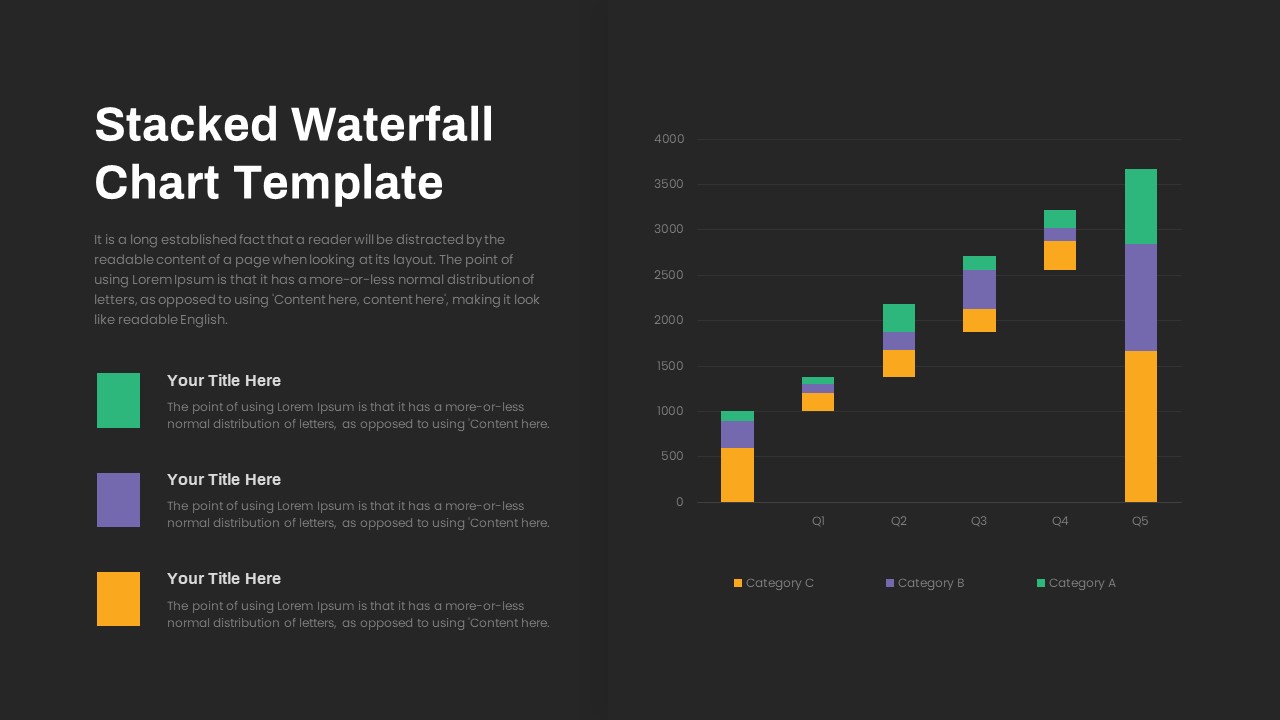
Stacked Waterfall Chart Template for PowerPoint & Google Slides

Description
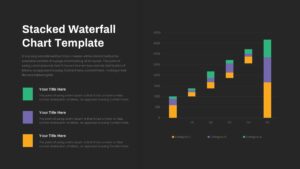
This slide features a three-series stacked waterfall chart built entirely with editable vector shapes on a clean white master slide. Five vertical columns (Q1–Q5) display cumulative values for Category C (orange), Category B (purple), and Category A (green), with precise data labels on each segment. A legend on the left uses matching color swatches, icon placeholders, and text blocks for each series, all linked via theme fonts. Hidden guide layers let you adjust category labels, add or remove series, switch between flat and gradient fills, or toggle gridlines in seconds. Subtle drop shadows add depth, while grouped objects ensure bulk formatting of colors and fonts. Fully compatible with both PowerPoint and Google Slides, this template preserves exact spacing, scaling, and formatting across platforms, making it ideal for illustrating cumulative data trends, financial waterfalls, or component breakdowns with professional polish.
Who is it for
Data analysts, financial planners, and marketing managers will leverage this stacked waterfall chart to present product revenue breakdowns, cost-component analyses, or cumulative performance metrics over time.
Other Uses
Repurpose this template for project budget waterfalls, ROI analyses, resource-allocation breakdowns, or any scenario requiring clear, stacked data visualization. Simply update labels, swap colors, or adjust segment heights to suit your narrative.
Login to download this file

Item ID
SB03772
Related Templates

Waterfall Column Chart Analysis Template for PowerPoint & Google Slides
Bar/Column
Waterfall Bar Chart Analysis Template for PowerPoint & Google Slides
Bar/Column
Waterfall Chart Data Visualization Template for PowerPoint & Google Slides
Comparison Chart
Multi-Series Stacked Bar Chart Template for PowerPoint & Google Slides
Bar/Column
Free Stacked Column Chart Data Visualization Template for PowerPoint & Google Slides
Bar/Column
Free
Animated Stacked Bar Chart Template for PowerPoint & Google Slides
Bar/Column
Professional 100% Stacked Column Chart Template for PowerPoint & Google Slides
Bar/Column
Year-over-Year Stacked Gender Bar Chart Template for PowerPoint & Google Slides
Bar/Column
Dynamic Three-Series Stacked Area Chart Template for PowerPoint & Google Slides
Comparison Chart
Stacked Gantt Chart Timeline Slide Template for PowerPoint & Google Slides
Gantt Chart
Stacked Bar Chart for PowerPoint & Google Slides
Bar/Column
100% Stacked Bar Chart for PowerPoint & Google Slides
Bar/Column
Stacked Area Chart with Financial Highlights for PowerPoint & Google Slides
Finance
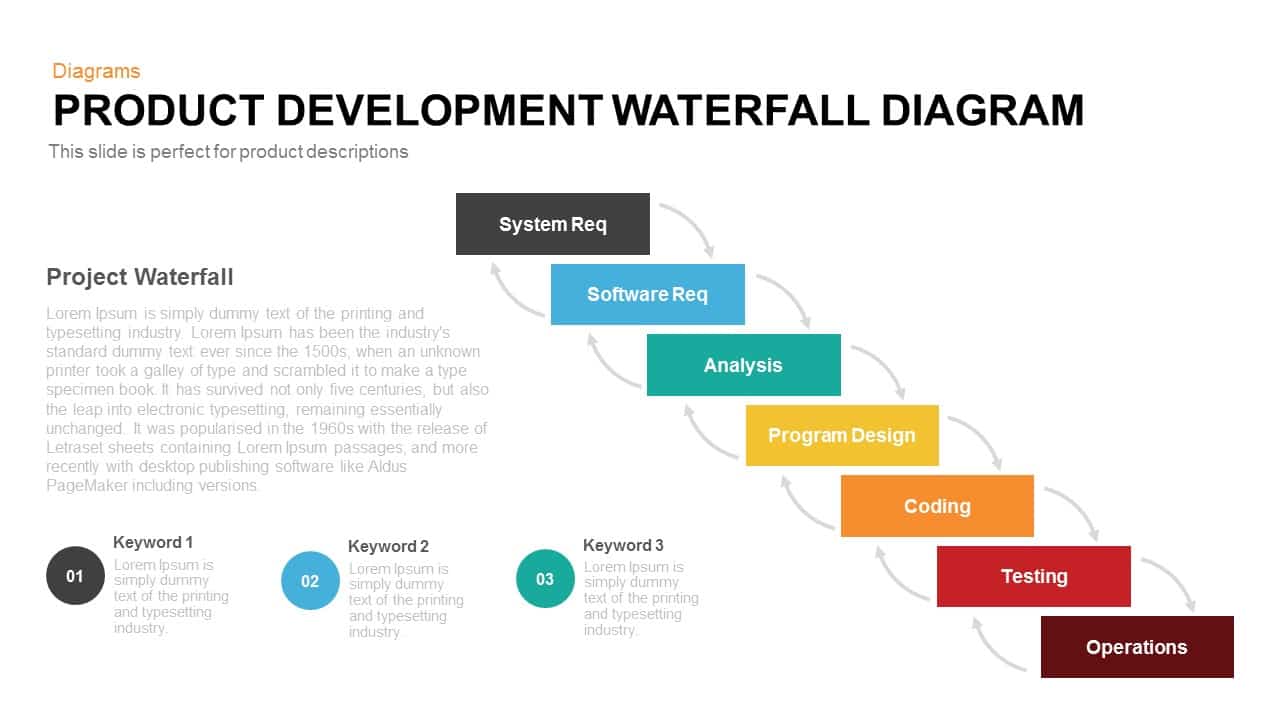
Product Development Waterfall Diagram Template for PowerPoint & Google Slides
Process
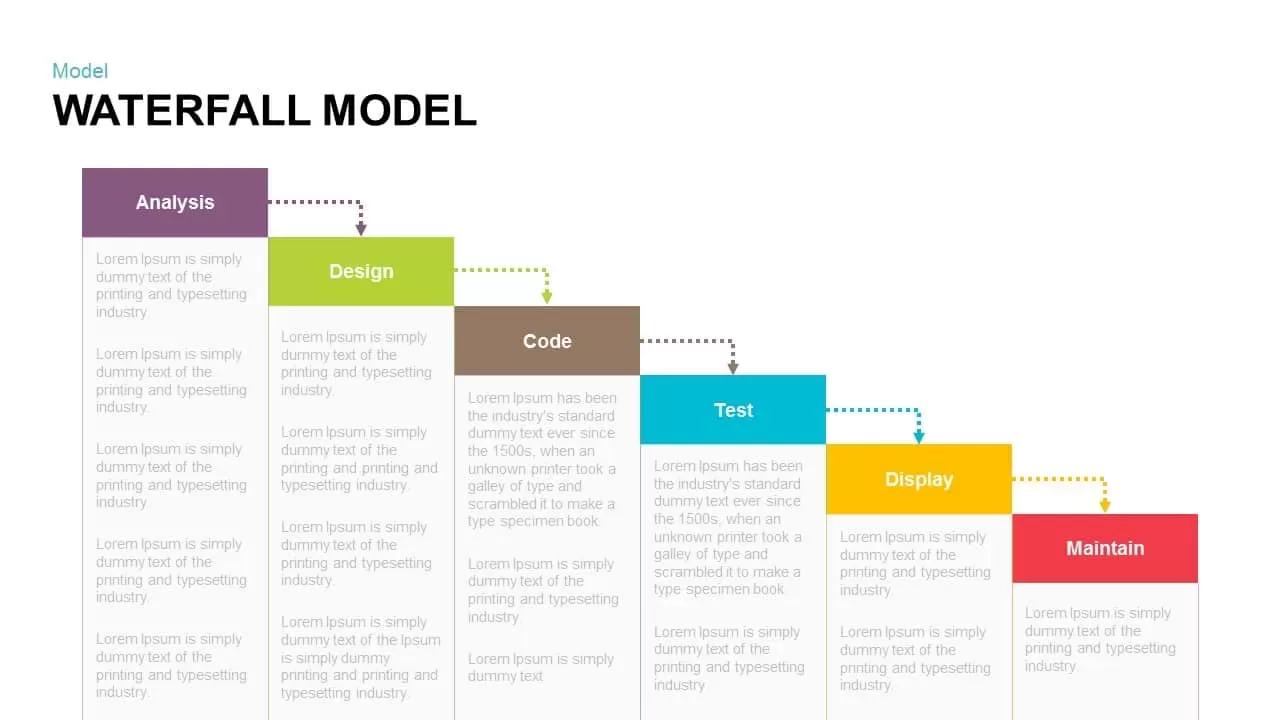
Waterfall Model Diagram Template for PowerPoint & Google Slides
Information Technology
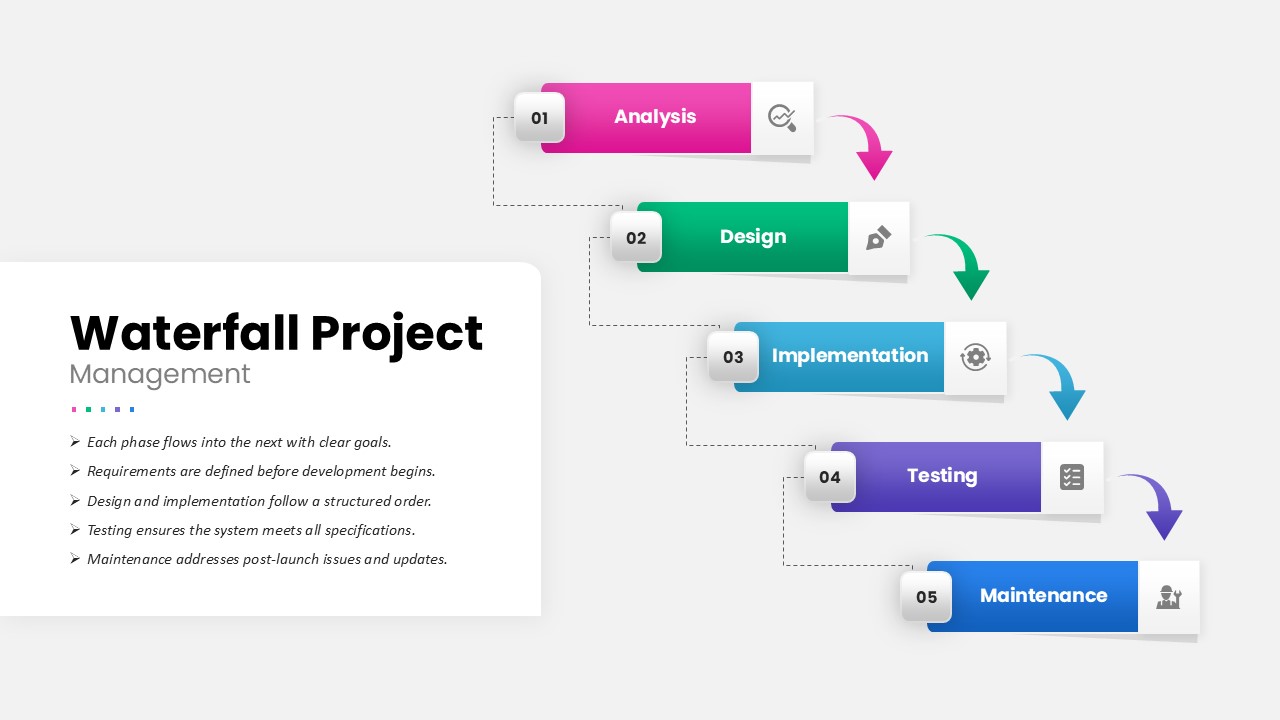
Waterfall Project Management Process template for PowerPoint & Google Slides
Process
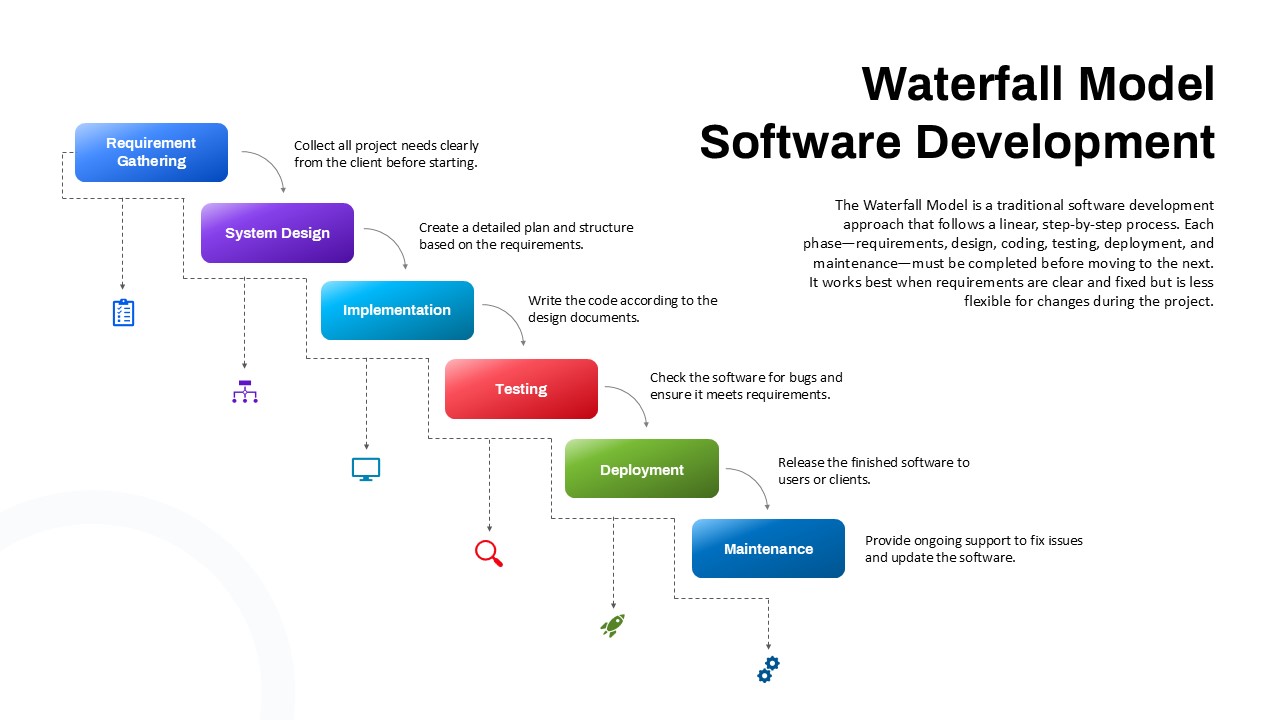
Waterfall Software Development Process Template for PowerPoint & Google Slides
Software Development
3D Stacked Infographic Layers Data Template for PowerPoint & Google Slides
Pyramid

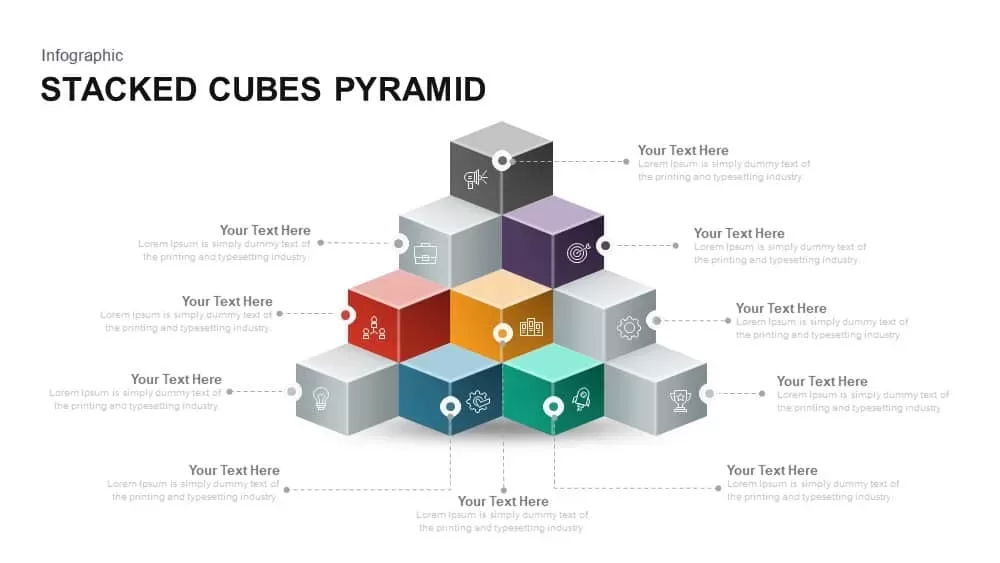
Stacked Cubes Pyramid Infographic Template for PowerPoint & Google Slides
Pyramid
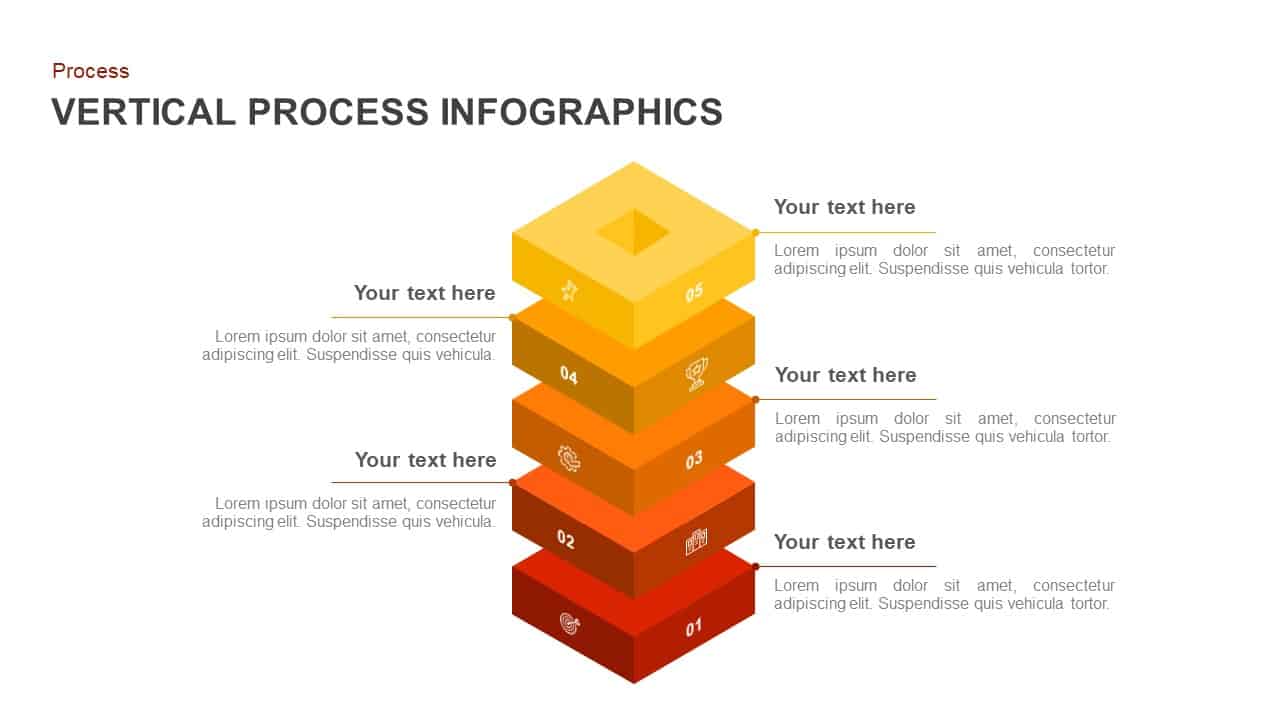
Vertical Stacked Process Infographic Template for PowerPoint & Google Slides
Process
Stacked Cubes Pyramid Six-Option Diagram Template for PowerPoint & Google Slides
Pyramid
Elegant Stacked Photo Collage Layout Template for PowerPoint & Google Slides
Graphics
Quad Chart Infographic Pack of 8 Slides Template for PowerPoint & Google Slides
Comparison Chart
Free Professional Gantt Chart Pack – 4 Slides Template for PowerPoint & Google Slides
Gantt Chart
Free
Circle Strategy Creative Chart template for PowerPoint & Google Slides
Business Strategy
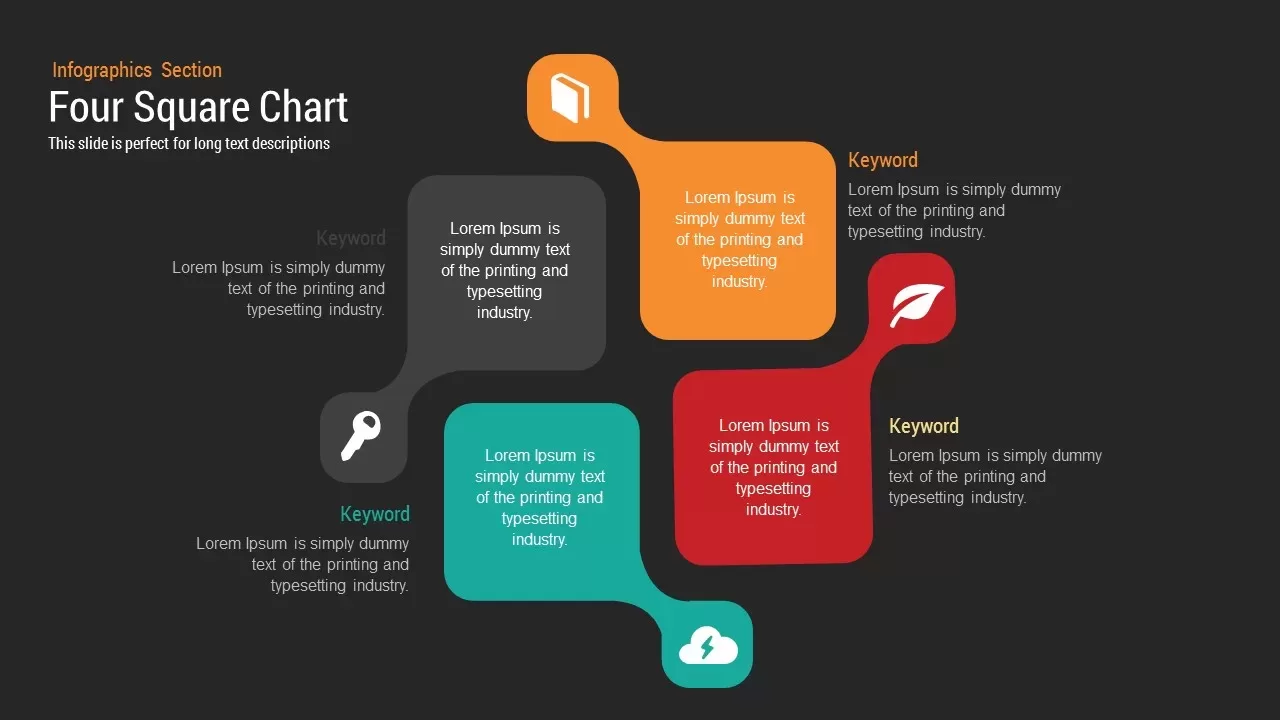
Four Square Chart template for PowerPoint & Google Slides
Charts
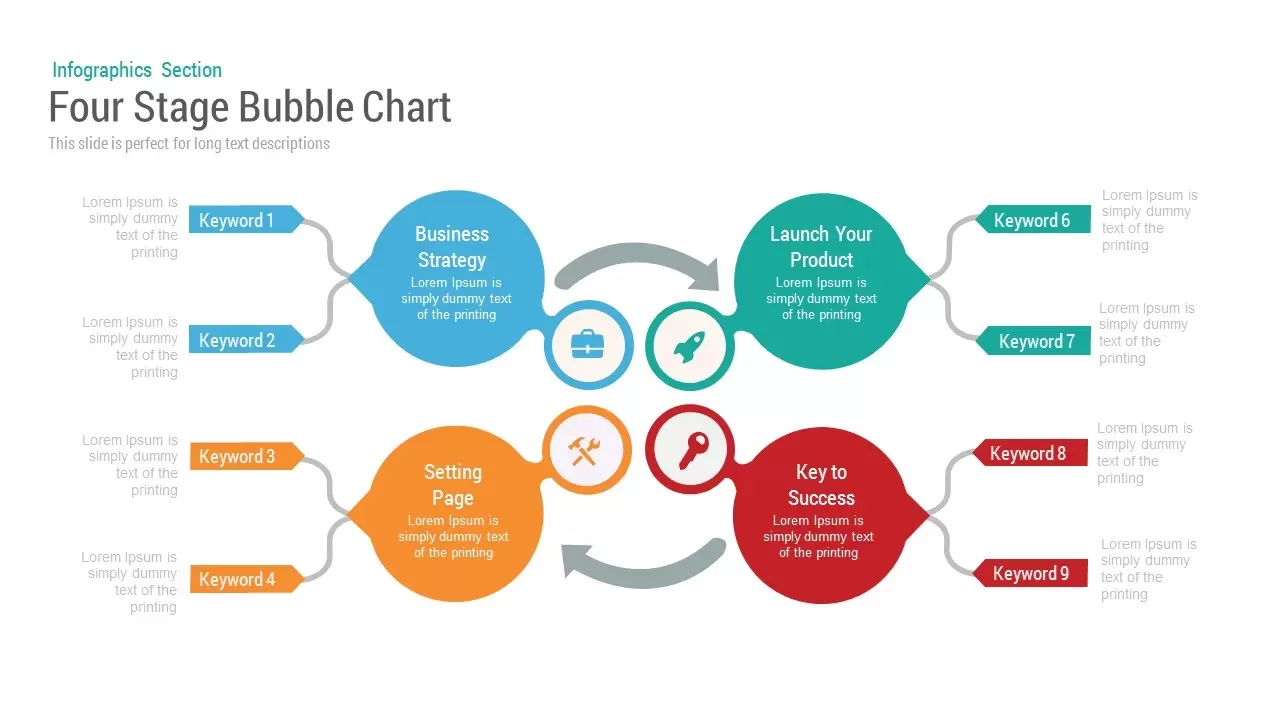
Bubble Chart template for PowerPoint & Google Slides
Charts
Creative SWOT Chart template for PowerPoint & Google Slides
SWOT

Corporate Organization Chart template for PowerPoint & Google Slides
Org Chart
Donut Chart template for PowerPoint & Google Slides
Pie/Donut
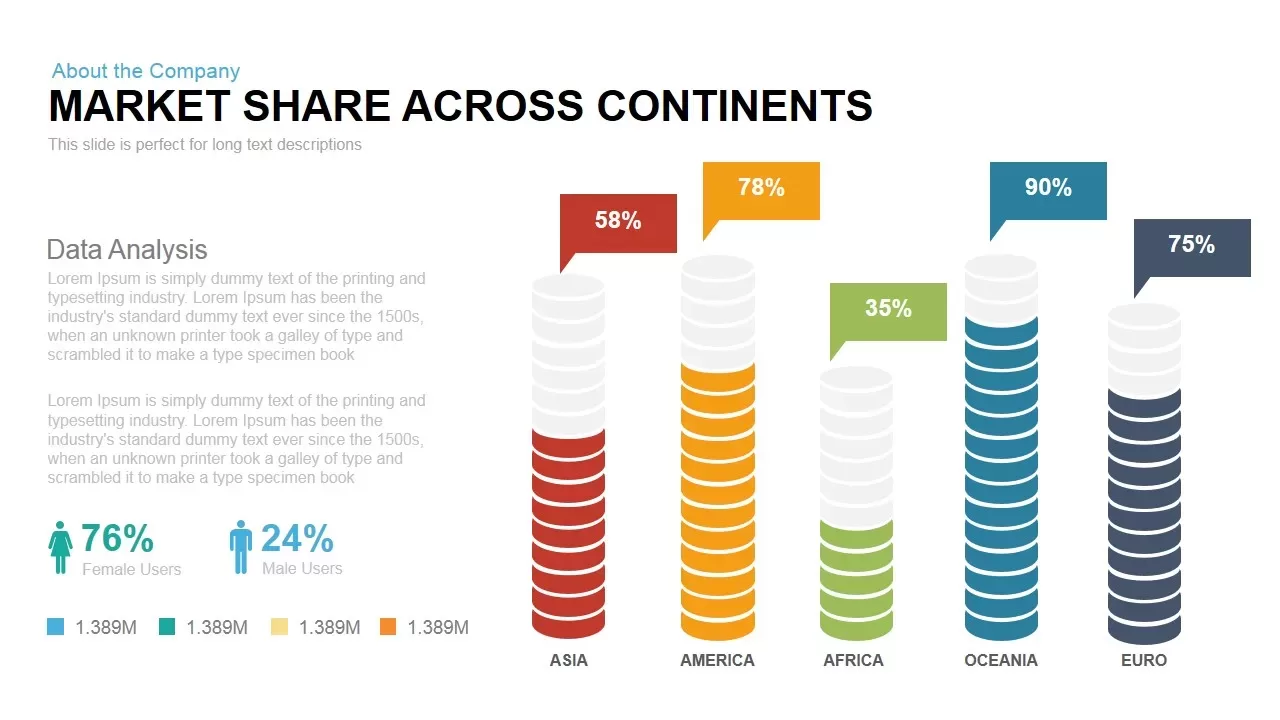
Global Market Share Cylinder Chart Template for PowerPoint & Google Slides
Bar/Column
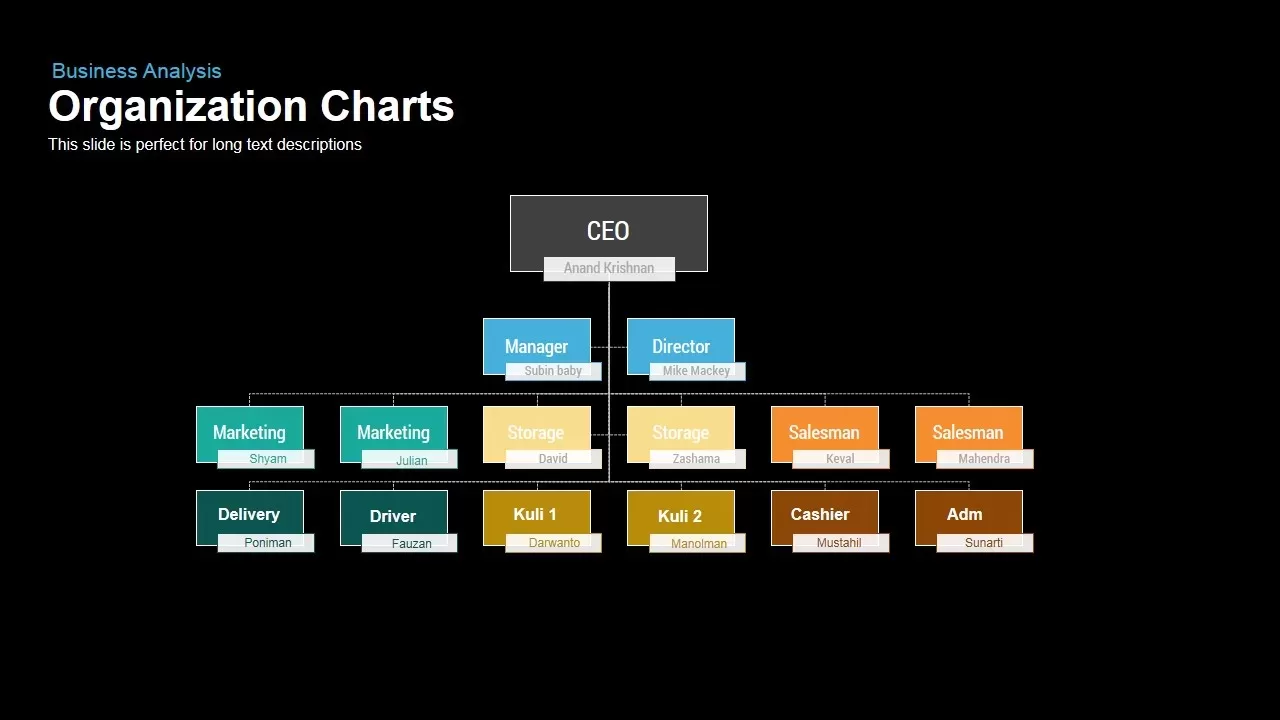
Business Organization Chart Hierarchy Template for PowerPoint & Google Slides
Org Chart
Creative Dynamic Gantt Chart Timeline Template for PowerPoint & Google Slides
Timeline
Simple Organizational Chart Infographic Template for PowerPoint & Google Slides
Org Chart
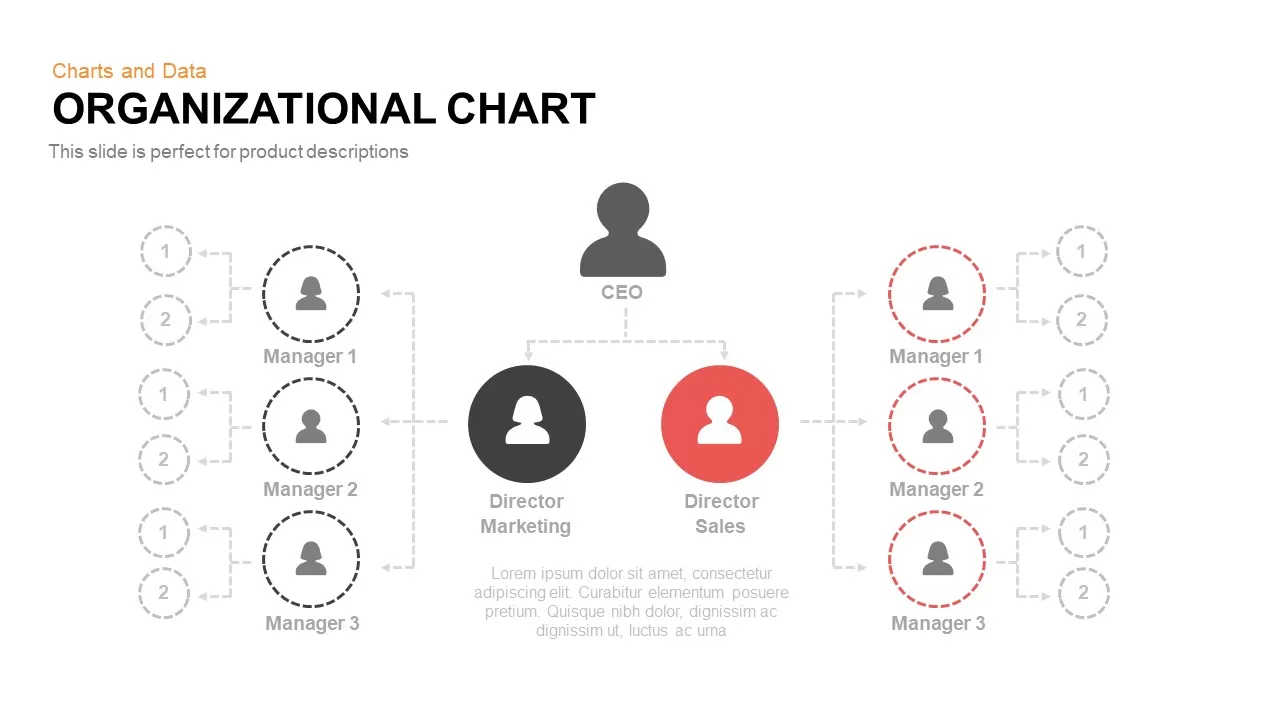
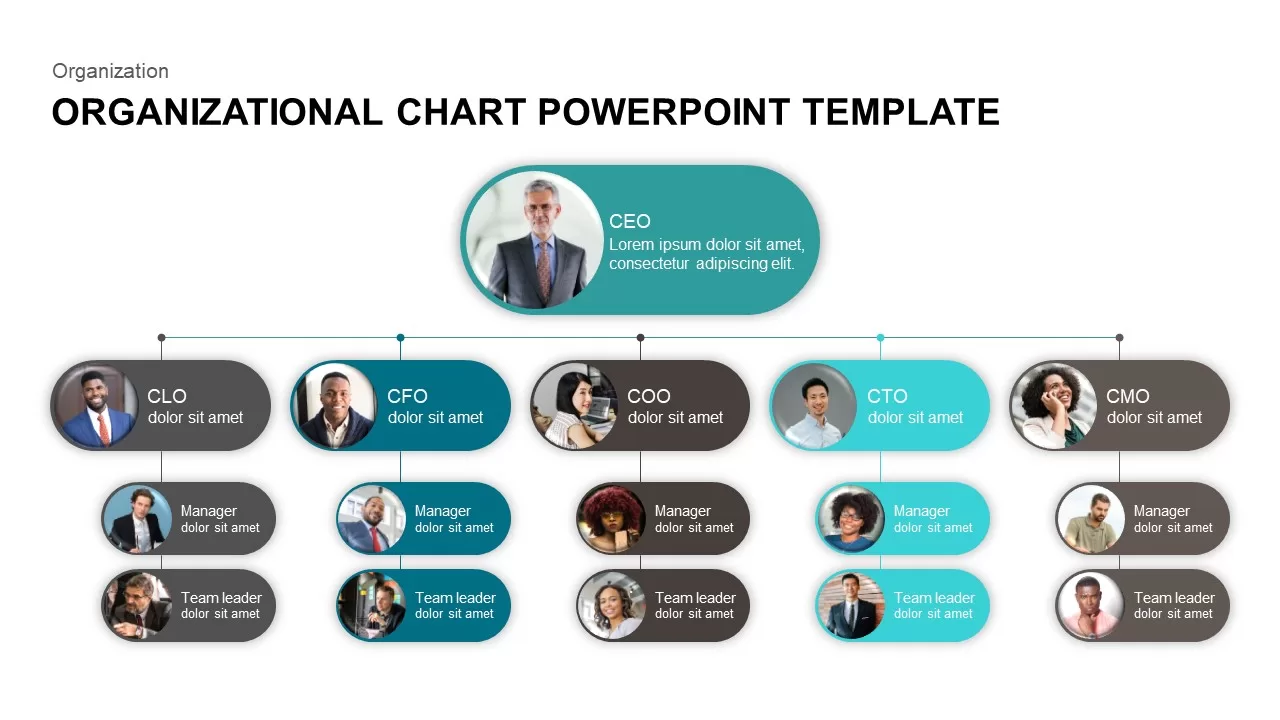
Organizational Chart Template for PowerPoint & Google Slides
Org Chart
Pencil Bar Chart Data Analysis Template for PowerPoint & Google Slides
Bar/Column
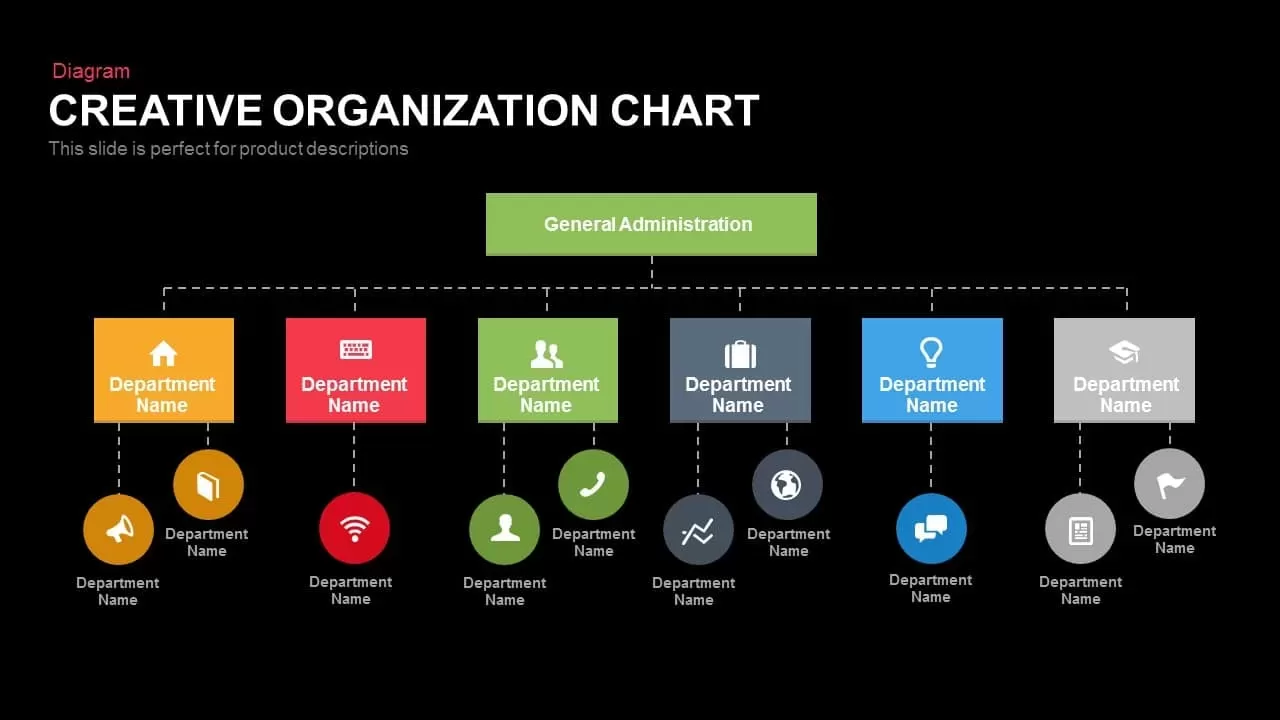
Creative Organization Chart Diagram Template for PowerPoint & Google Slides
Org Chart
Corporate Org Chart template for PowerPoint & Google Slides
Org Chart

Fully Editable Gantt Chart Timeline template for PowerPoint & Google Slides
Gantt Chart
Modern Ten-Block Section Title Chart template for PowerPoint & Google Slides
Comparison
Organizational People Percentage Chart template for PowerPoint & Google Slides
Org Chart

Product Usage Analytics Dashboard Chart Template for PowerPoint & Google Slides
Bar/Column
Five-Stage People Infographic Chart template for PowerPoint & Google Slides
Process
Sales vs Budget Performance Chart Template for PowerPoint & Google Slides
Bar/Column
Interactive Product Comparison Bar Chart Template for PowerPoint & Google Slides
Bar/Column
Organizational Chart Structure template for PowerPoint & Google Slides
Org Chart
Application Revenue Line Chart KPI Template for PowerPoint & Google Slides
Revenue
Organization Department Hexagon Chart Template for PowerPoint & Google Slides
Org Chart
Corporate Organizational Chart Hierarchy Template for PowerPoint & Google Slides
Org Chart
For and Against Vote Count Bar Chart Template for PowerPoint & Google Slides
Bar/Column
Entertainment Industry Revenue Bar Chart Template for PowerPoint & Google Slides
Bar/Column
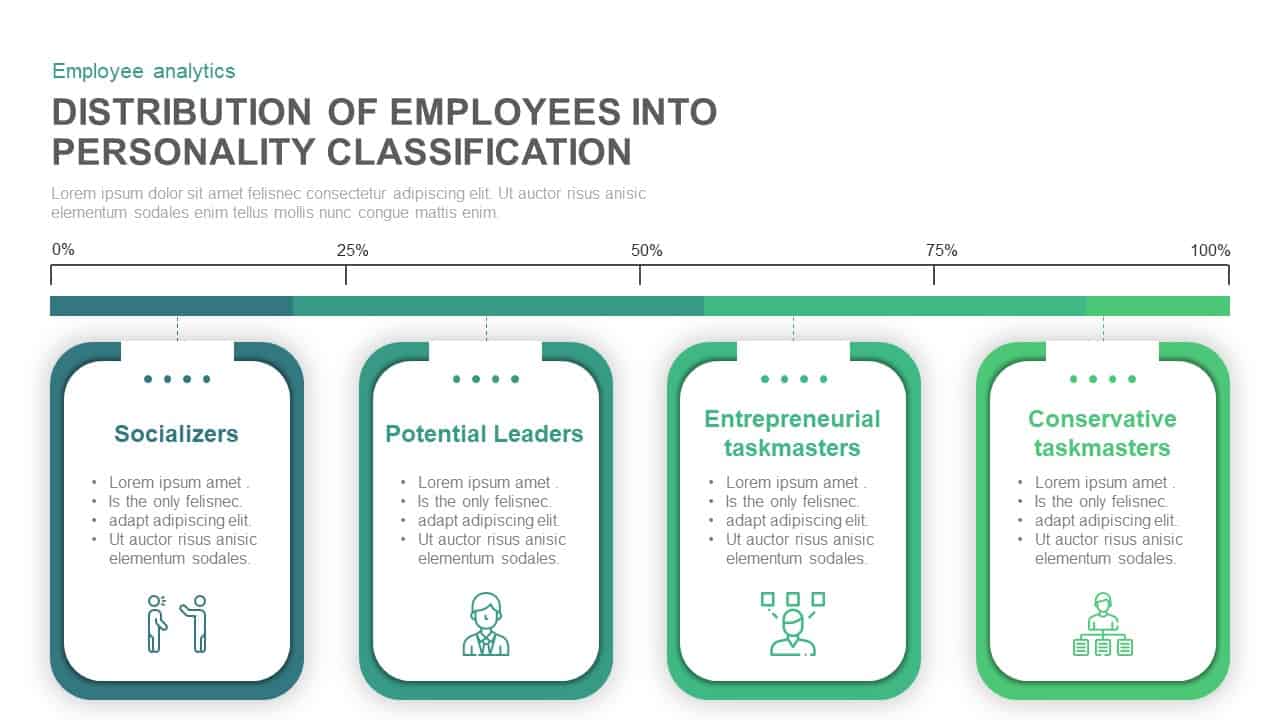
Employee Personality Distribution Chart Template for PowerPoint & Google Slides
Bar/Column
Capital Structure Dynamic Split Chart Template for PowerPoint & Google Slides
Comparison Chart
Business Growth Metaphor Chart Template for PowerPoint & Google Slides
Business
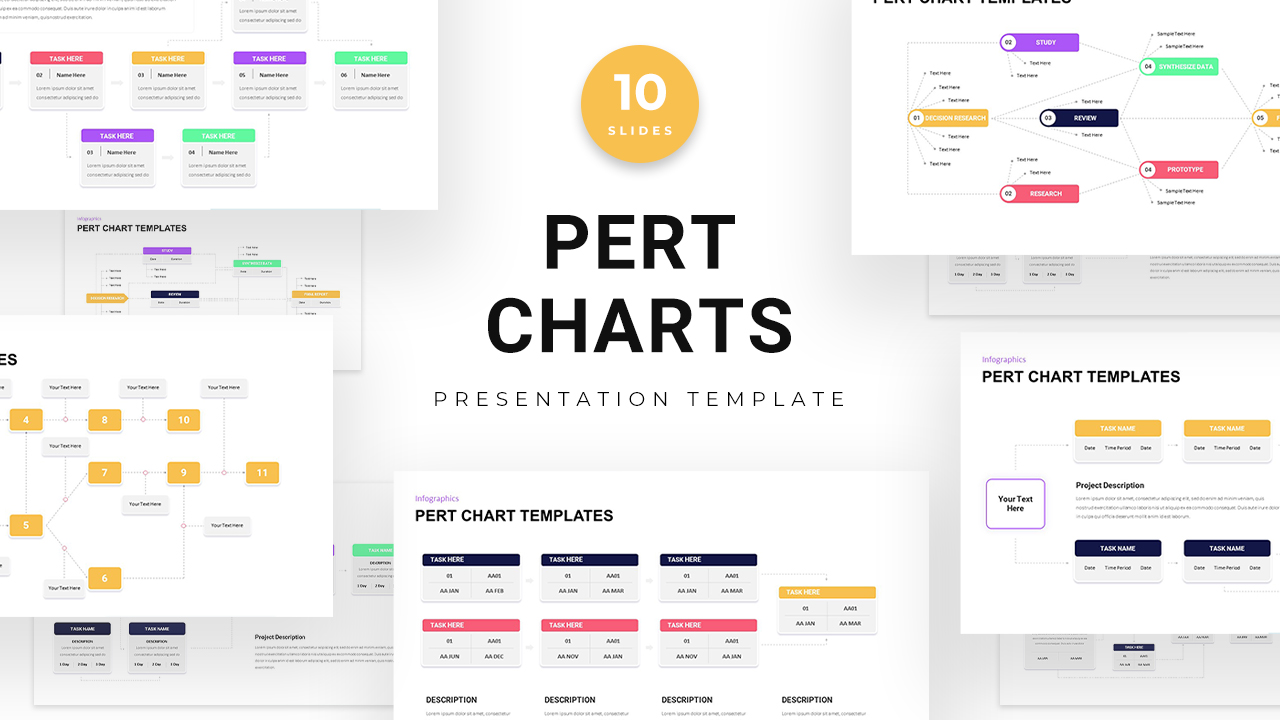
PERT Chart Project Management template for PowerPoint & Google Slides
Project Status
Professional Organizational Chart Diagram Template for PowerPoint & Google Slides
Org Chart
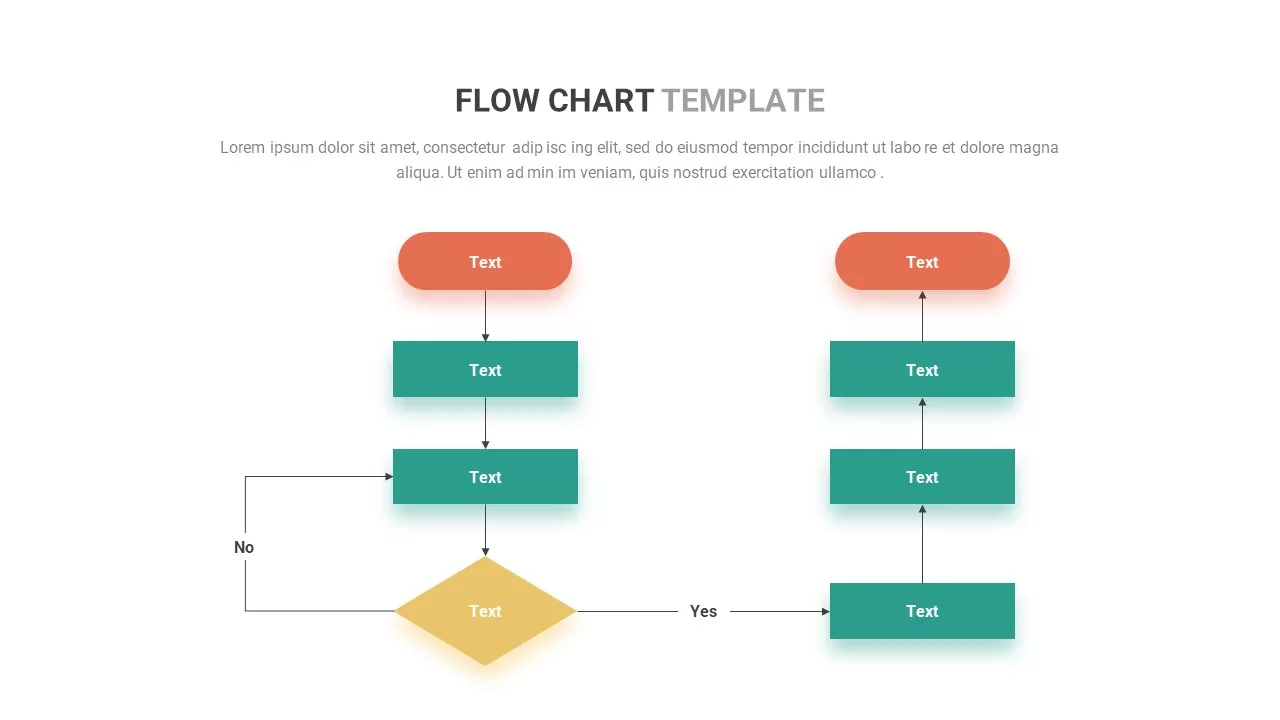
Flow Chart Template for PowerPoint & Google Slides
Flow Charts
Flow Chart template for PowerPoint & Google Slides
Flow Charts
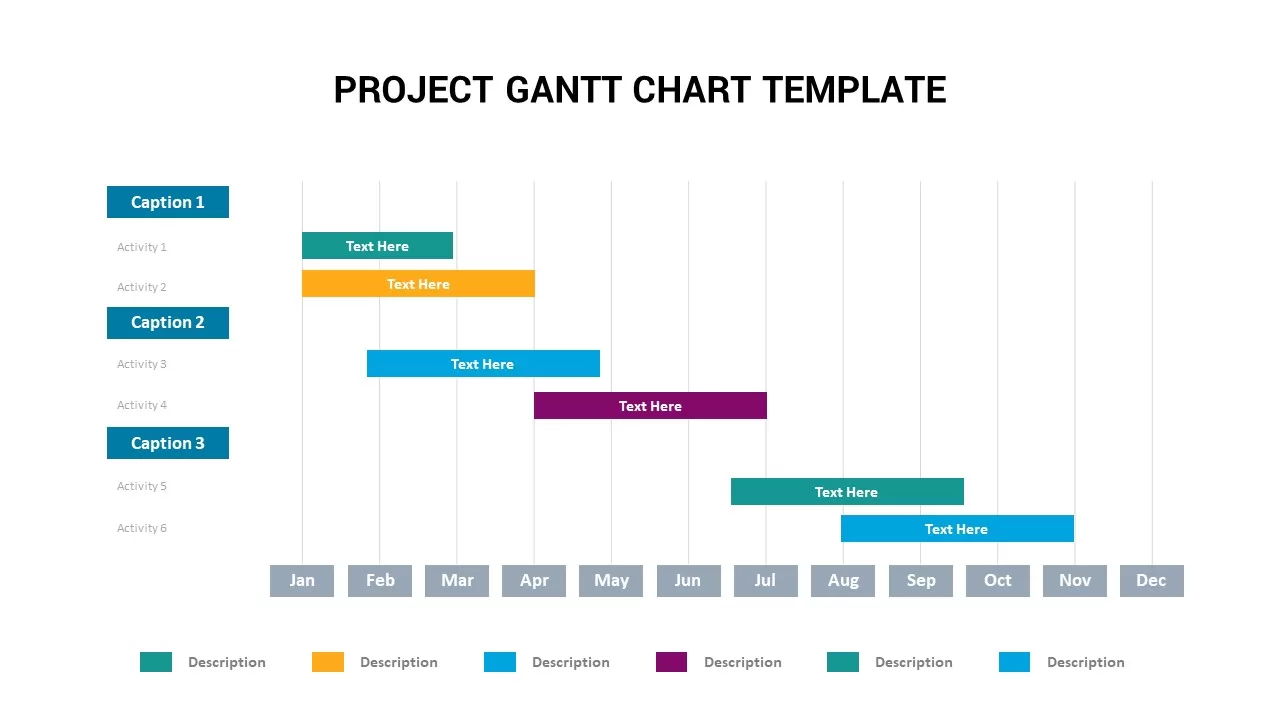
Project Gantt Chart Template for PowerPoint & Google Slides
Gantt Chart
Cost Reduction Strategy Donut Chart Template for PowerPoint & Google Slides
Pie/Donut
Statistics Infographic & KPI Bar Chart Template for PowerPoint & Google Slides
Bar/Column
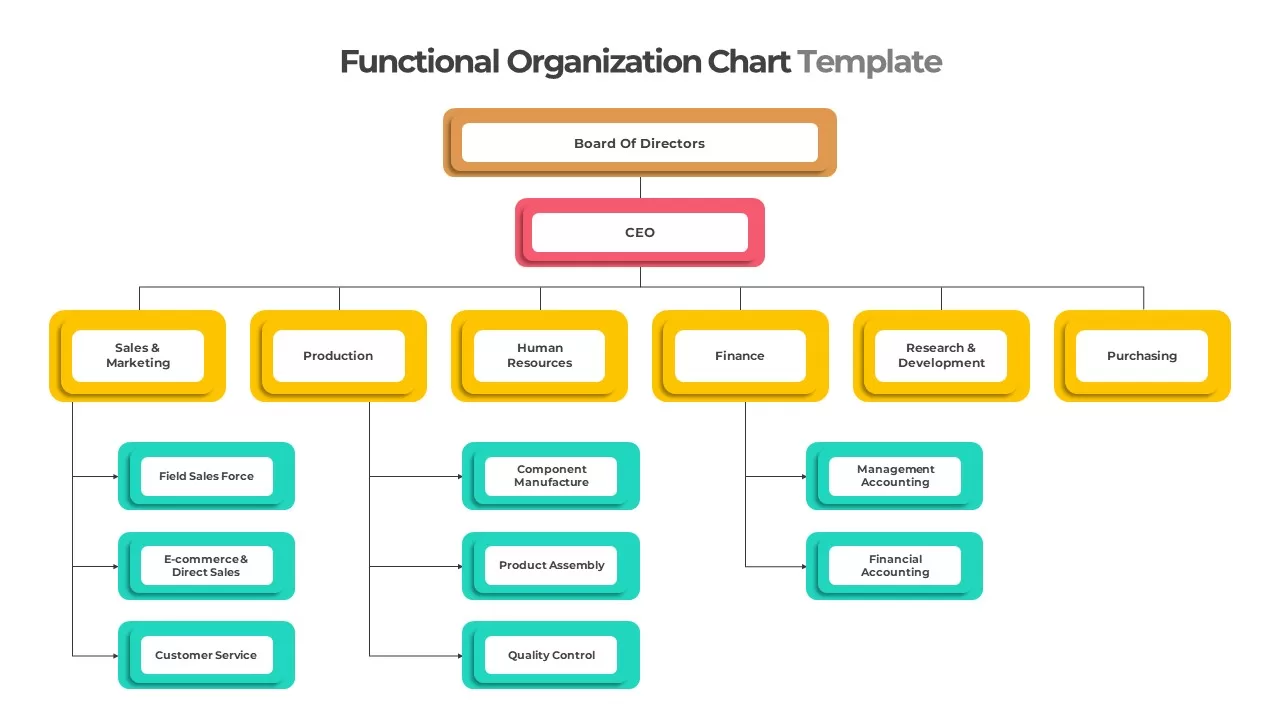
Colorful Functional Organization Chart Template for PowerPoint & Google Slides
Org Chart
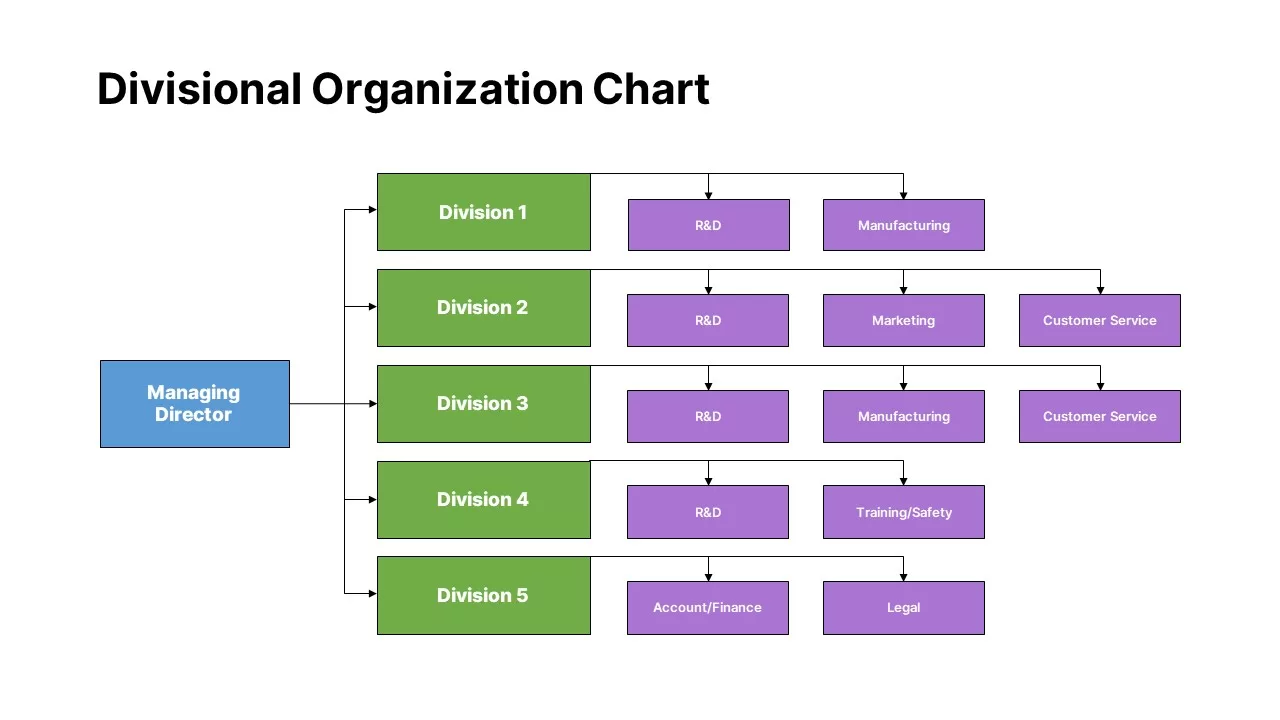
Divisional Organization Chart Template for PowerPoint & Google Slides
Org Chart
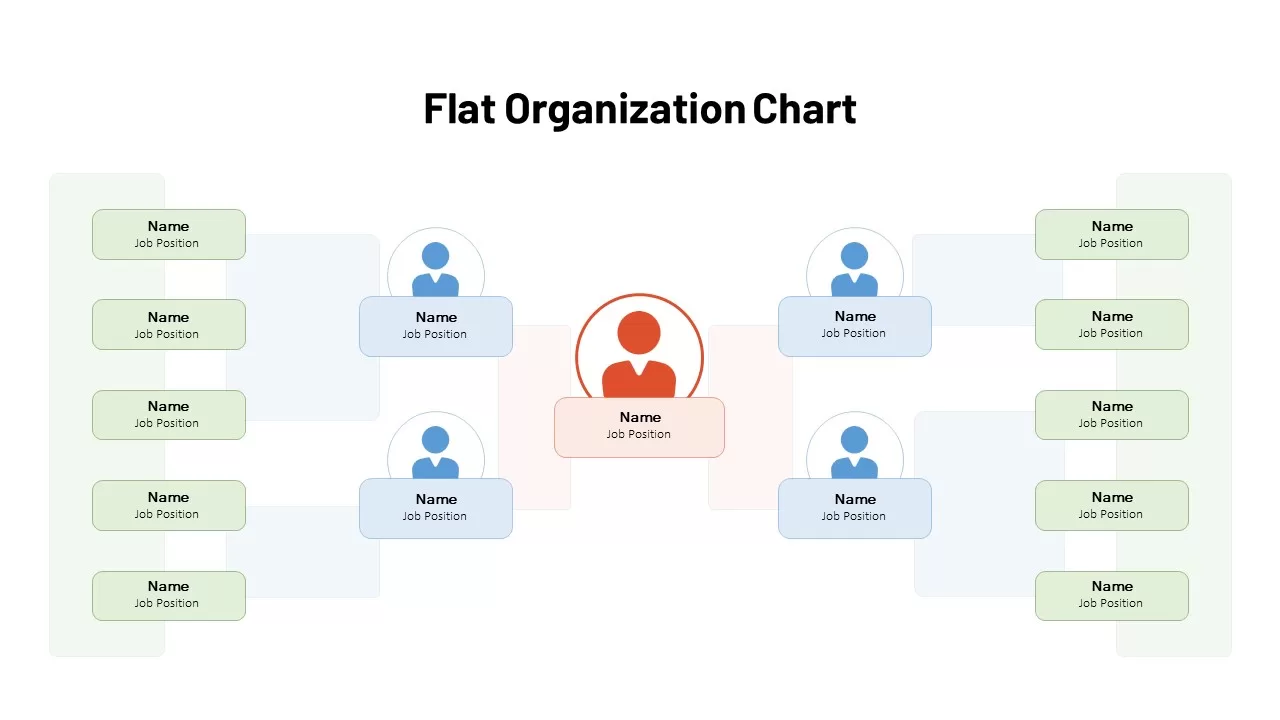
Flat Organization Chart Diagram Template for PowerPoint & Google Slides
Org Chart
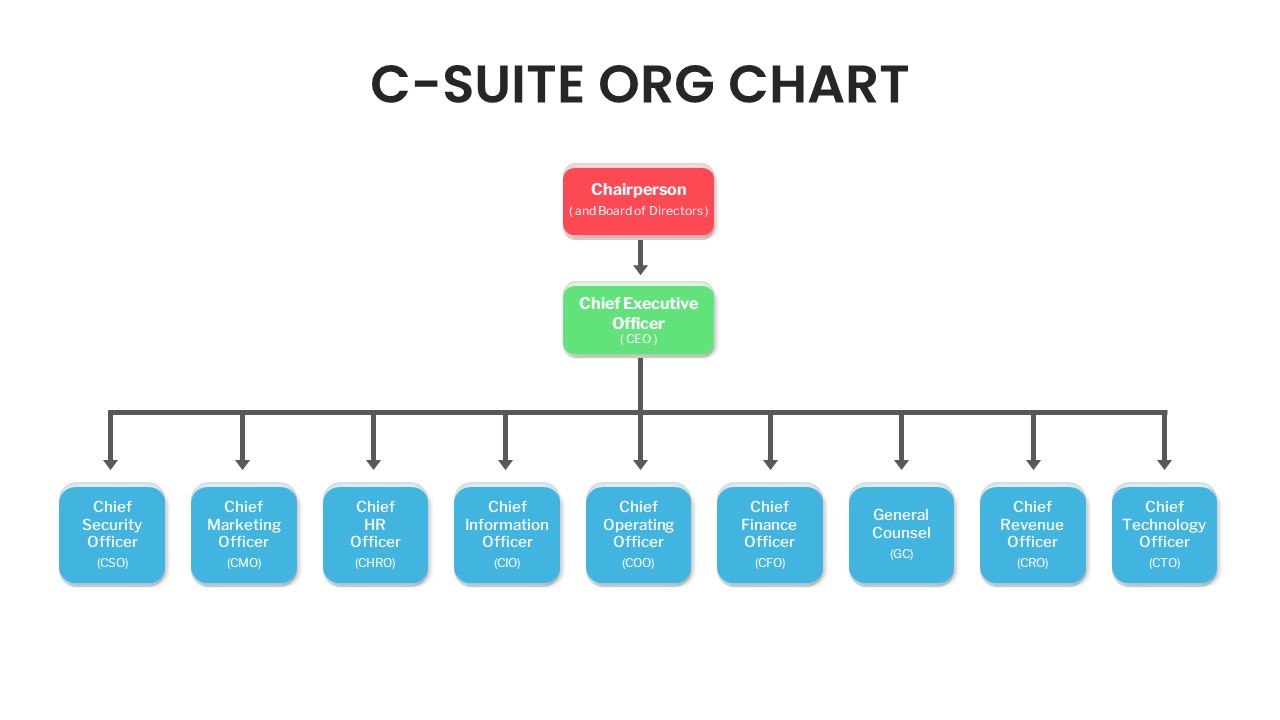
C-Suite Executive Org Chart Diagram Template for PowerPoint & Google Slides
Org Chart
Editable Multi-Series Peak Line Chart Template for PowerPoint & Google Slides
Comparison Chart
Business Timeline Comparison Bar Chart Template for PowerPoint & Google Slides
Comparison Chart
Grouped Column Chart Comparison Template for PowerPoint & Google Slides
Bar/Column
Multiple Line Chart Comparison Template for PowerPoint & Google Slides
Comparison Chart
Five-Phase and Three-Phase Phases Chart Template for PowerPoint & Google Slides
Charts
Excel-Driven Gradient Timeline Chart Template for PowerPoint & Google Slides
Multi-Series Line Chart with Icons Template for PowerPoint & Google Slides
Comparison Chart
Multi-Series Vertical Dot Chart Template for PowerPoint & Google Slides
Comparison Chart
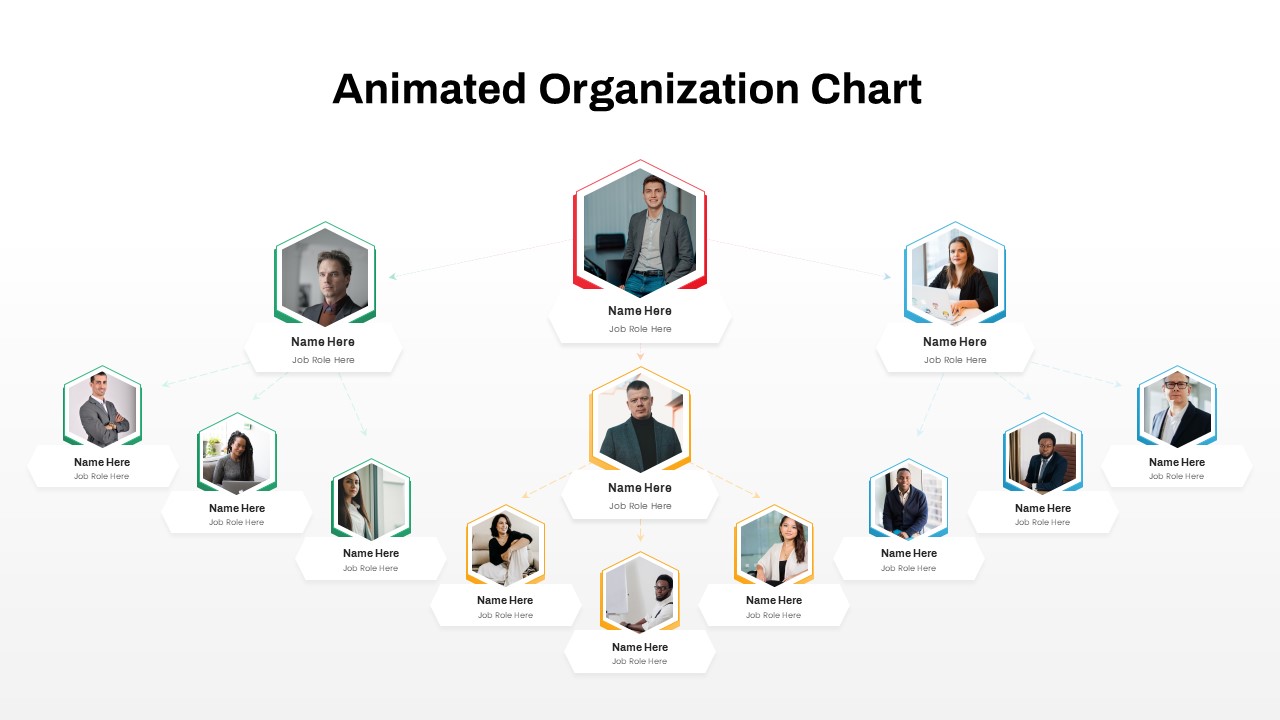
Animated Hexagon Org Chart Diagram Template for PowerPoint & Google Slides
Org Chart
Multi-Style Clock Chart Diagram Template for PowerPoint & Google Slides
Circular
Multipurpose Spline Chart Data Trend Template for PowerPoint & Google Slides
Bar/Column
Multi-Variation Circular Chart Diagram Template for PowerPoint & Google Slides
Circular
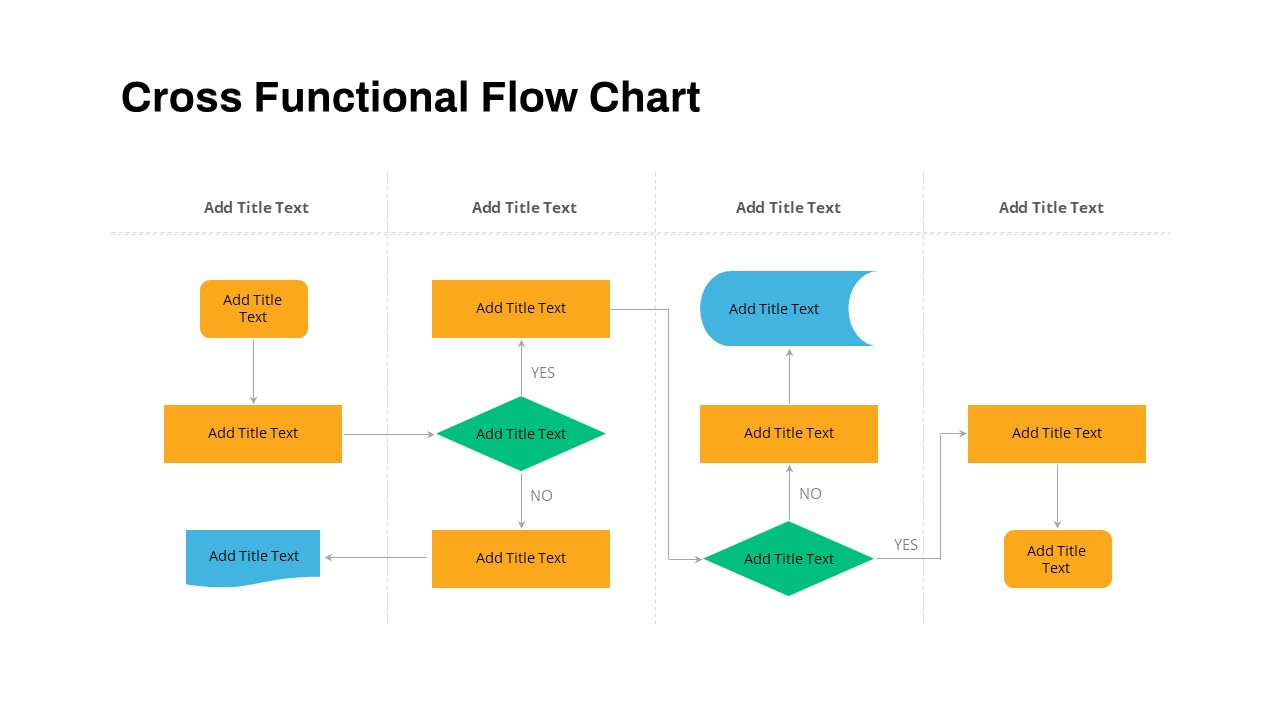
Cross Functional Swimlane Flow Chart Template for PowerPoint & Google Slides
Flow Charts
Professional HR Organization Chart Template for PowerPoint & Google Slides
Org Chart
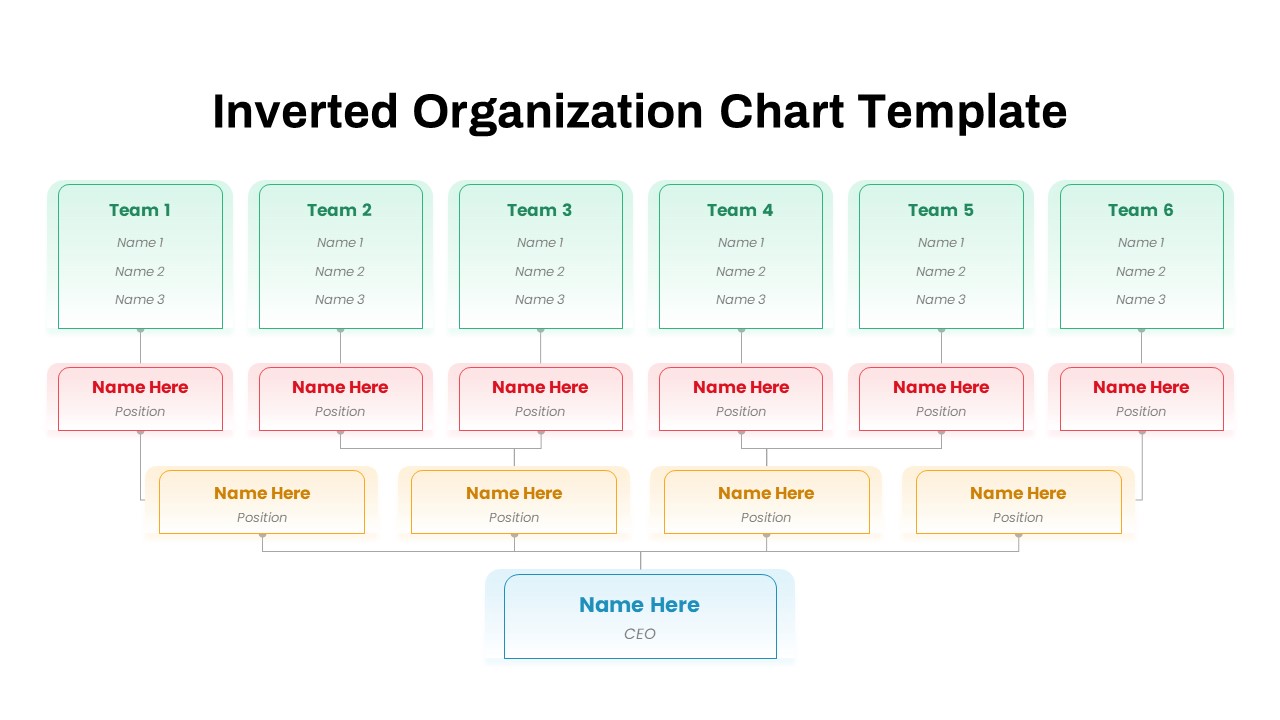
Inverted Organization Chart Diagram Template for PowerPoint & Google Slides
Org Chart
Multi-Level Colorful Pyramid Chart Template for PowerPoint & Google Slides
Pyramid
Bubble Chart Scatter, Diagram & Matrix Template for PowerPoint & Google Slides
Comparison Chart
Quarterly Gross Profit Rate Chart Template for PowerPoint & Google Slides
Revenue
Quarterly Revenue Comparison Bar Chart Template for PowerPoint & Google Slides
Bar/Column
Horizontal Bar Chart Slide with Icons Template for PowerPoint & Google Slides
Bar/Column
Project Tracker Timeline Gantt Chart Template for PowerPoint & Google Slides
Project Status
Competitor Comparison Chart Design Template for PowerPoint & Google Slides
Comparison
Two-Option Bar Chart Comparison Table Template for PowerPoint & Google Slides
Comparison
Event Planning Gantt Chart template for PowerPoint & Google Slides
Business
Feasibility Matrix Comparison Chart Template for PowerPoint & Google Slides
Comparison Chart
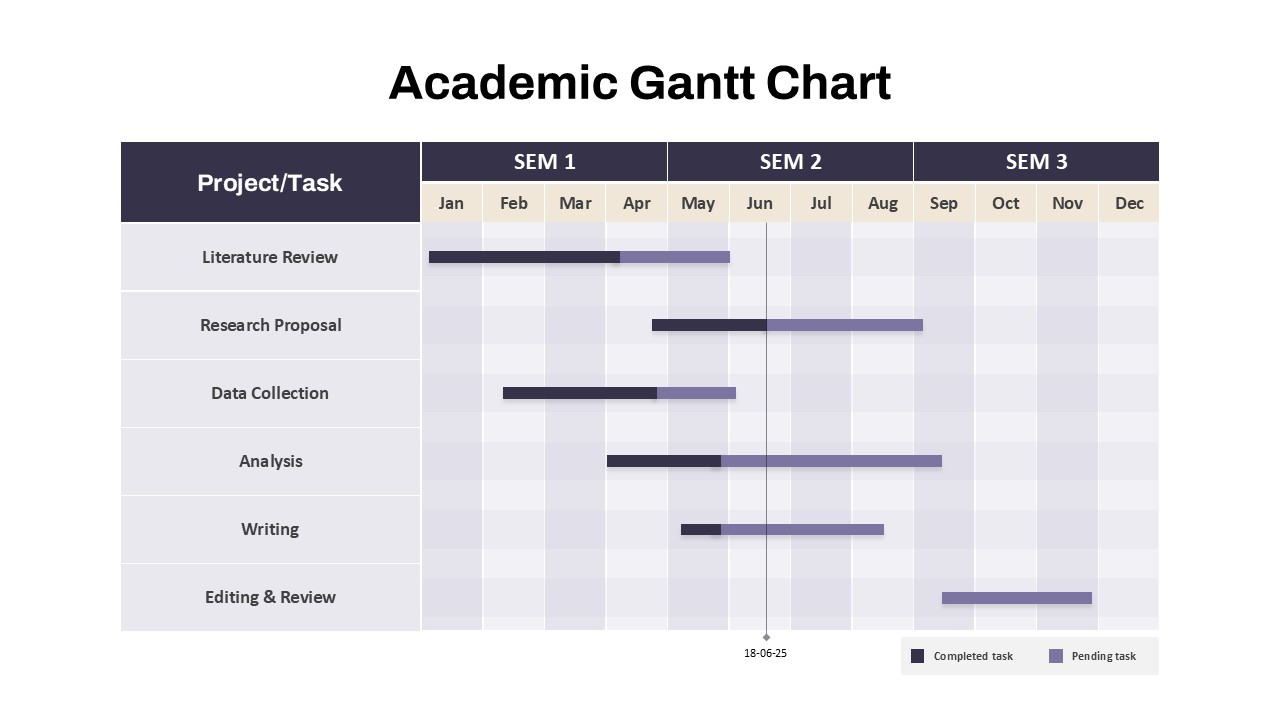
Academic Gantt Chart template for PowerPoint & Google Slides
Business
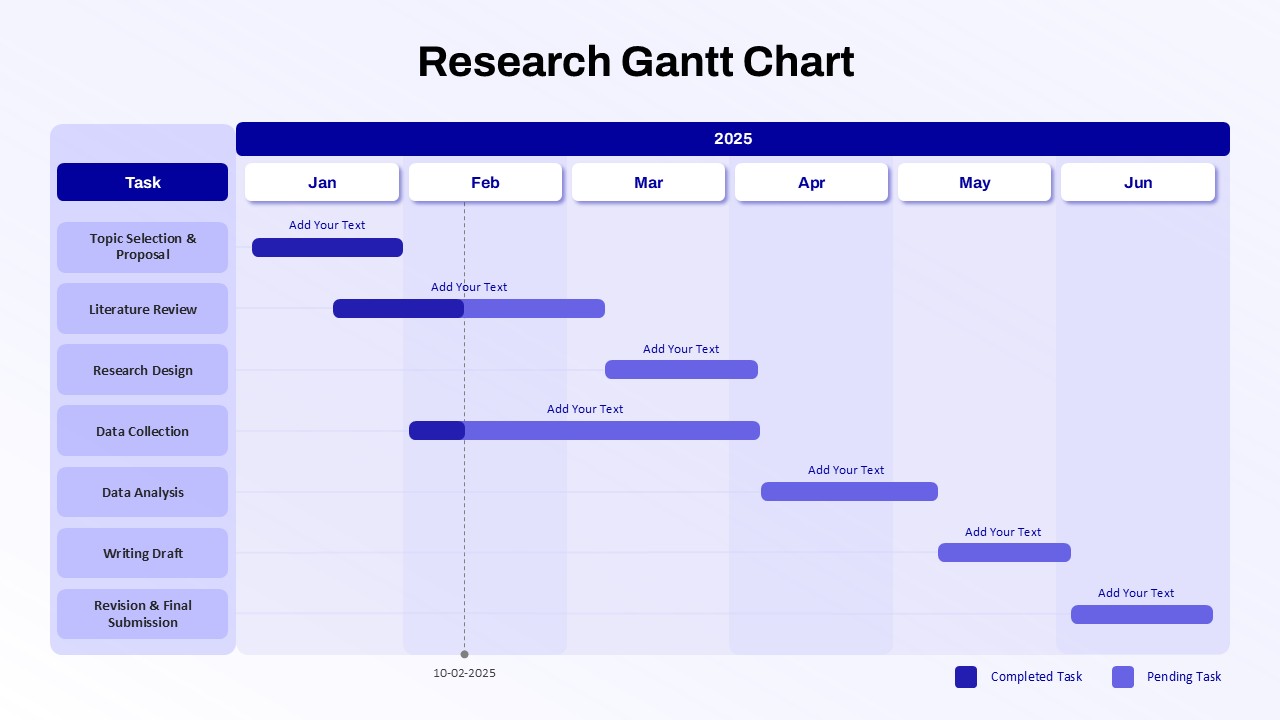
Research Gantt Chart template for PowerPoint & Google Slides
Project
Circular Sample Org Chart Template for PowerPoint & Google Slides
Org Chart
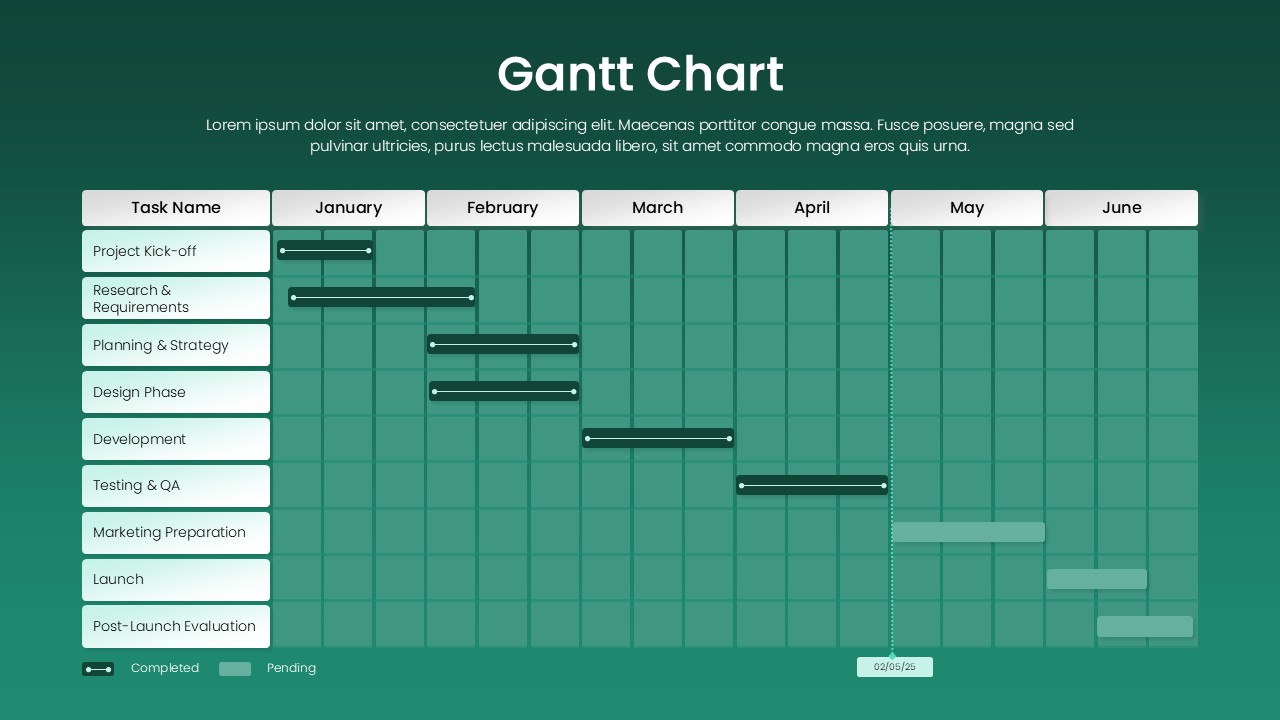
Green Gantt Chart Template for PowerPoint & Google Slides
Gantt Chart
Horizontal Organizational Chart Template for PowerPoint & Google Slides
Org Chart
Colorful Annual Gantt Chart Project Planner Template for PowerPoint & Google Slides
Gantt Chart
7 Step 6 Month Gantt Chart Timeline Template for PowerPoint & Google Slides
Gantt Chart
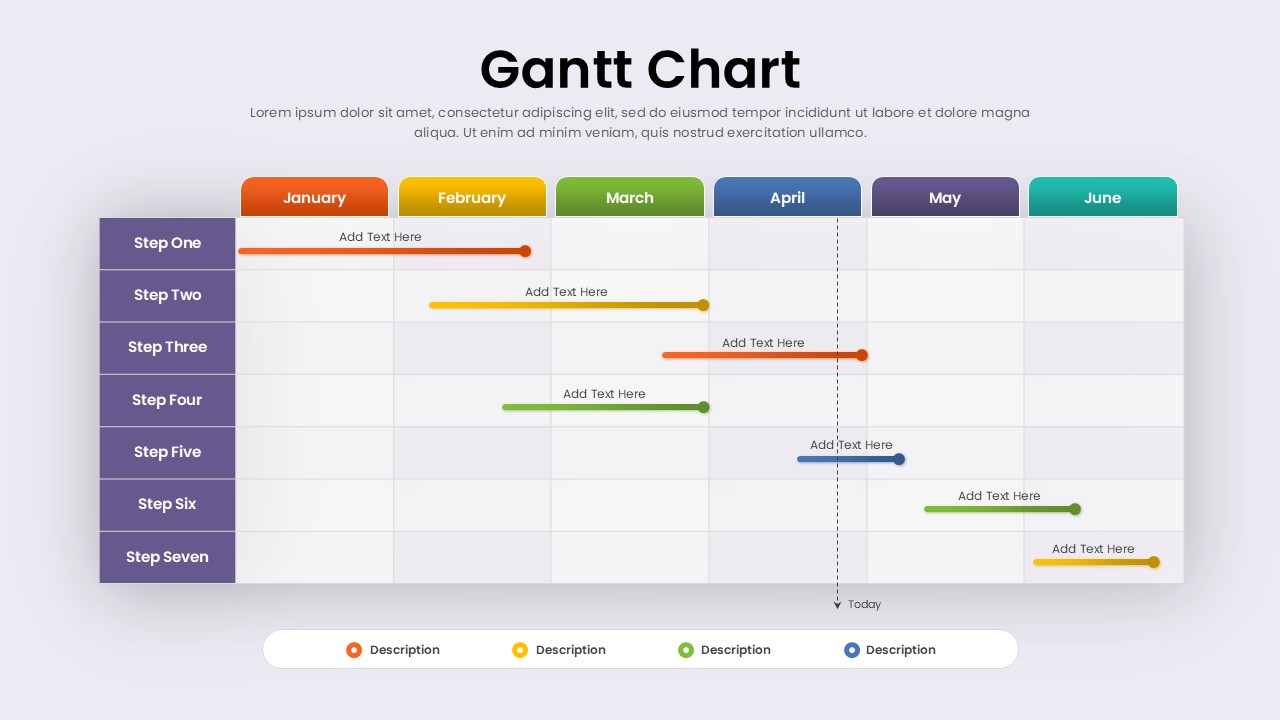
Quarterly Gantt Chart with Today Marker Template for PowerPoint & Google Slides
Gantt Chart

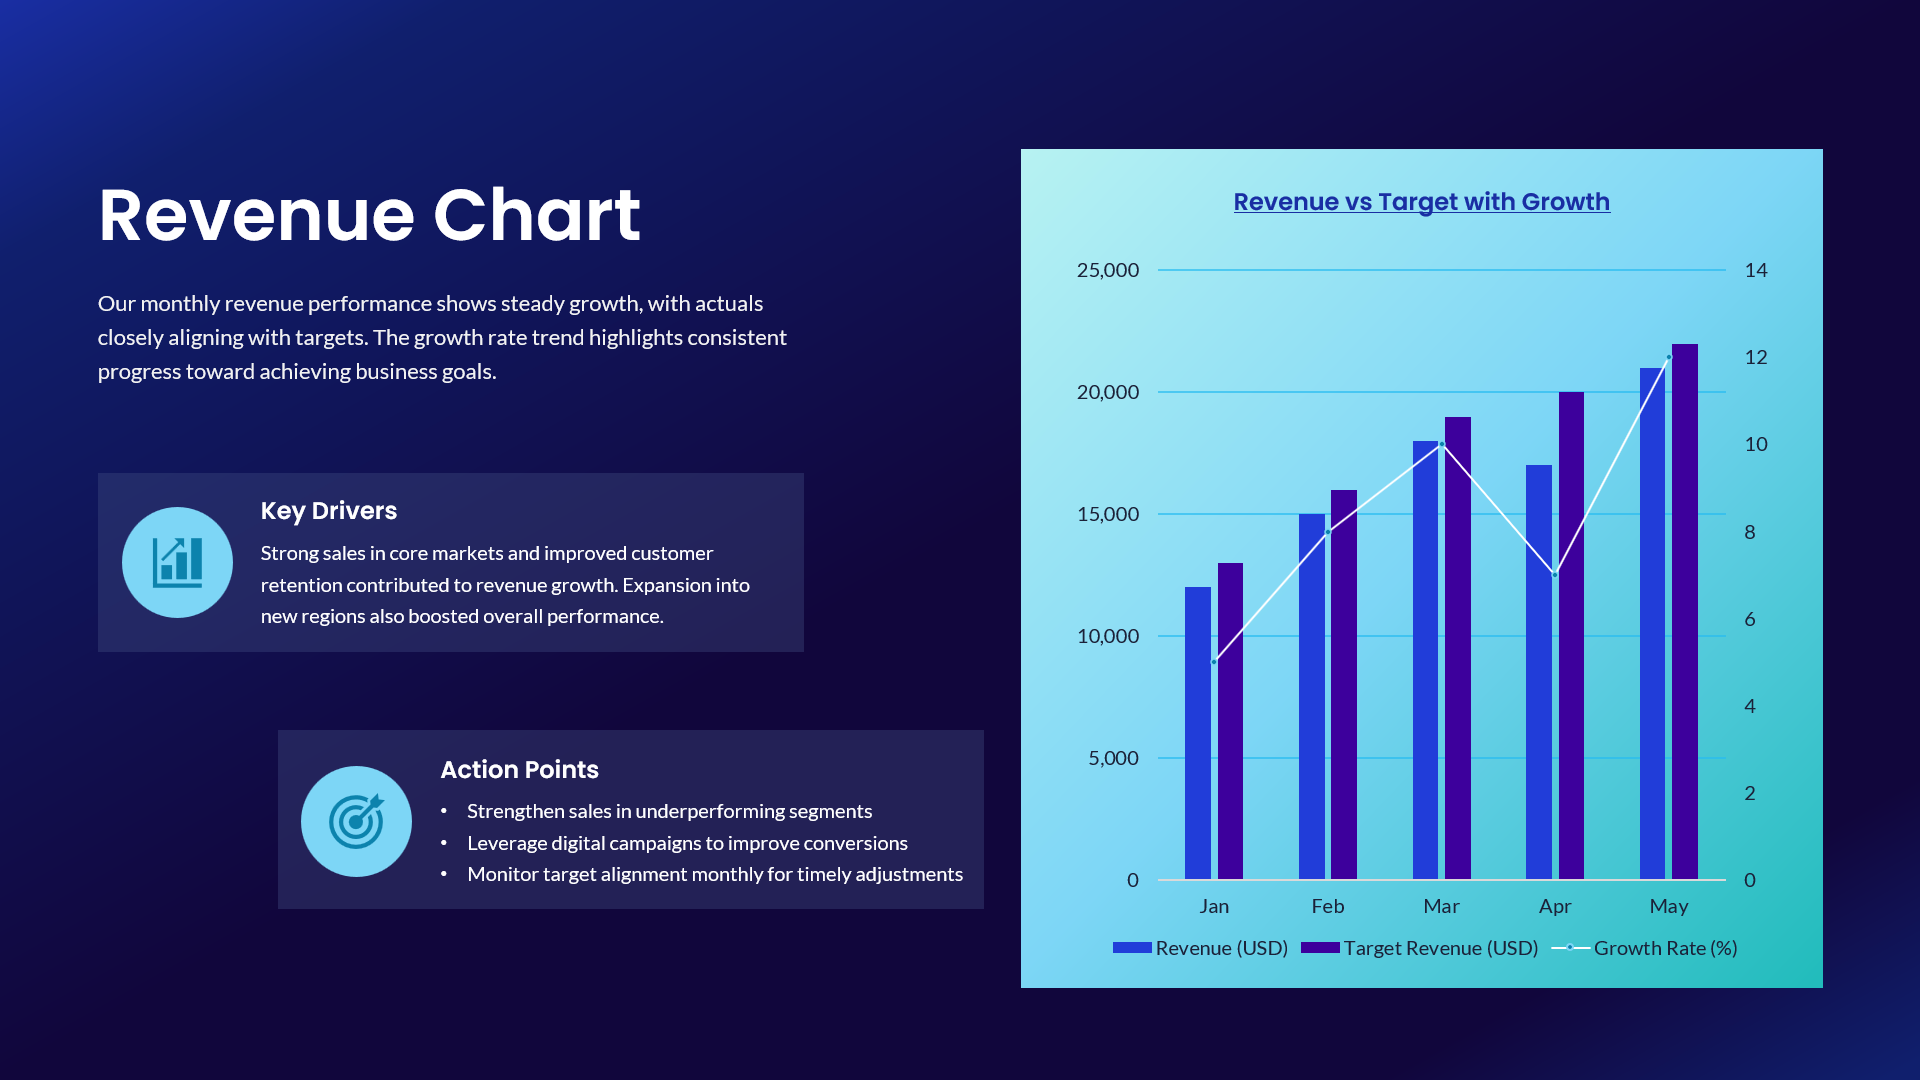
Revenue vs Target Growth Chart Template for PowerPoint & Google Slides
Revenue
Blank Comparison Chart Template for PowerPoint & Google Slides
Comparison Chart