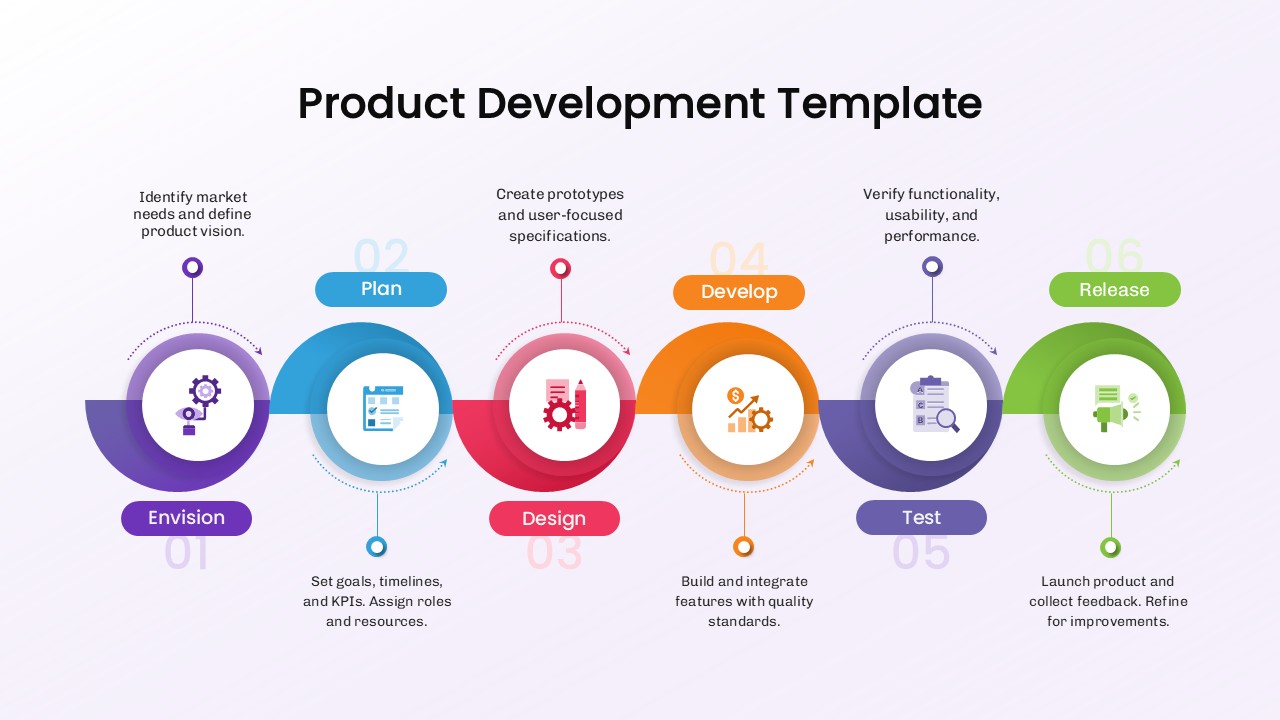
Six-Stage Gear Wheel Diagram Template for PowerPoint & Google Slides
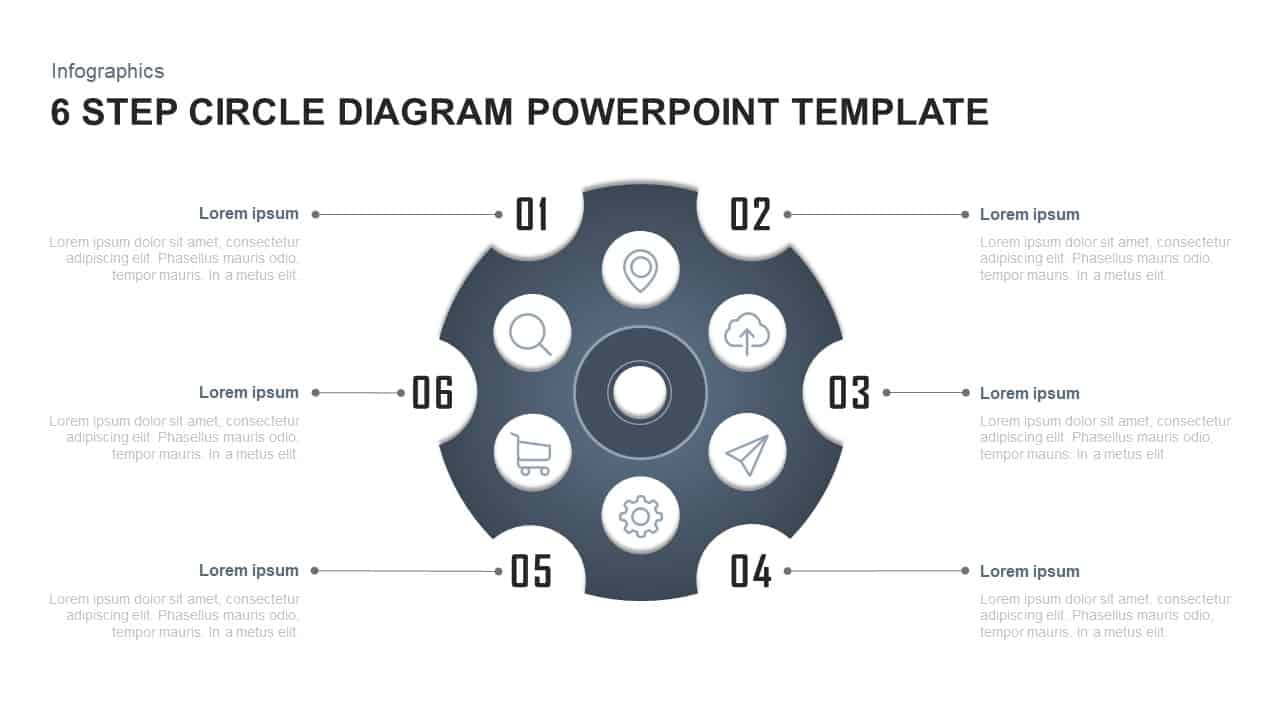
Visualize complex workflows and cyclical processes with this six-stage gear wheel infographic slide. The design features a central 3D gear shape rendered in subtle gray gradients, segmented into six outer notches—each housing a clean white icon (location marker, cloud upload, paper plane, cogwheel, shopping cart, and magnifying glass) to represent distinct stages or functions. Crisp numbering from 01 to 06 aligns each notch with its corresponding text callout, which you can position on either side of the gear for optimal readability. Built on master slides with 100% editable vector shapes, this template allows you to swap icons, adjust notch colors, resize the central gear, or modify connector lines in seconds to match your brand palette or thematic requirements.
The flat-plus-isometric aesthetic, paired with generous white space and sans-serif typography, ensures a polished, professional look across HD screens and printed materials. Subtle drop shadows beneath each icon bubble add depth without cluttering the layout. Whether you’re outlining a product lifecycle, depicting operational stages, or illustrating a risk-assessment framework, this gear wheel diagram turns detailed sequences into an intuitive visual narrative that guides audiences through each critical phase.
By leveraging built-in alignment guides and placeholder text boxes, you can maintain consistent spacing and hierarchy as you update content. Duplicate or remove notches to expand or condense the number of stages, and integrate data callouts or percentage labels for performance metrics. Fully compatible with both PowerPoint and Google Slides, this slide eliminates formatting headaches and accelerates deck creation, letting you focus on delivering persuasive, data-driven insights.
Who is it for
Project managers, process engineers, and operations directors will leverage this slide to present multi-step workflows, system overviews, and performance reviews. Strategy consultants, business analysts, and training facilitators can also adopt the gear metaphor to align stakeholders and streamline complex information.
Other Uses
Beyond process mapping, repurpose this template for product roadmaps, organizational frameworks, or technology architecture overviews. Swap icons for departmental symbols, recolor notches for thematic variation, or layer additional data charts within the central gear to highlight KPIs and progress metrics.
Login to download this file

Item ID
SB01180
Related Templates

Six-Staged Gear Diagram Framework Template for PowerPoint & Google Slides
Process
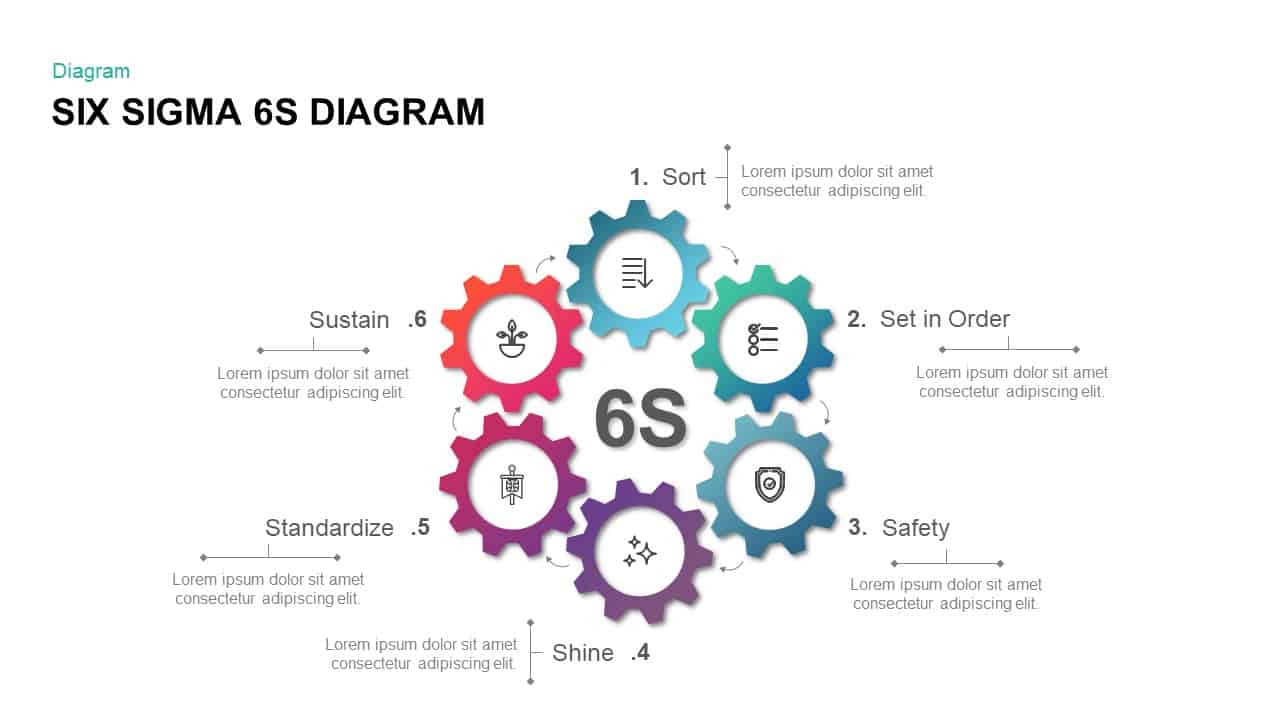
Six Sigma Gear Process Diagram Template for PowerPoint & Google Slides
Process
Six-Option Gear Diagram Slide Template for PowerPoint & Google Slides
Circular

Modern Four Stage Gear Diagram Template for PowerPoint & Google Slides
Process
Four-Stage Gear Process Diagram Template for PowerPoint & Google Slides
Process
5-Stage Gear Process Flow Diagram Template for PowerPoint & Google Slides
Process
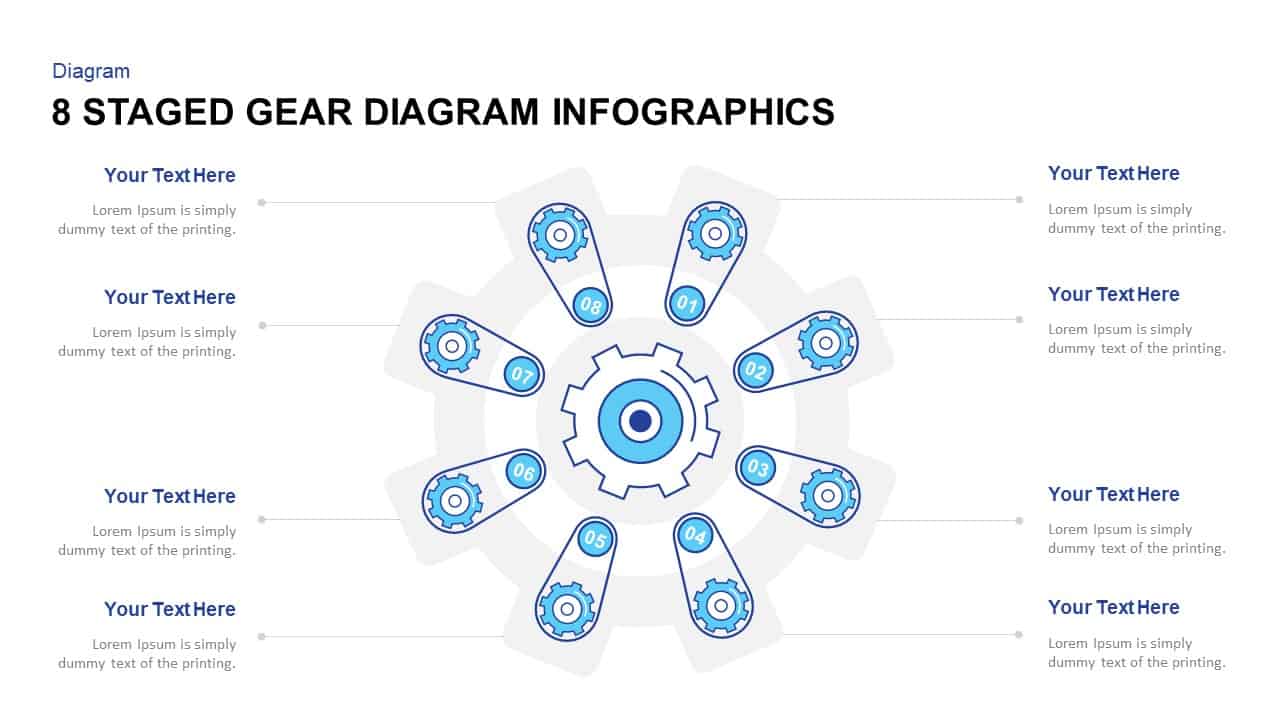
Eight-Stage Gear Diagram Process Template for PowerPoint & Google Slides
Process
Six Colorful Gear Shapes Infographic Template for PowerPoint & Google Slides
Process
Free
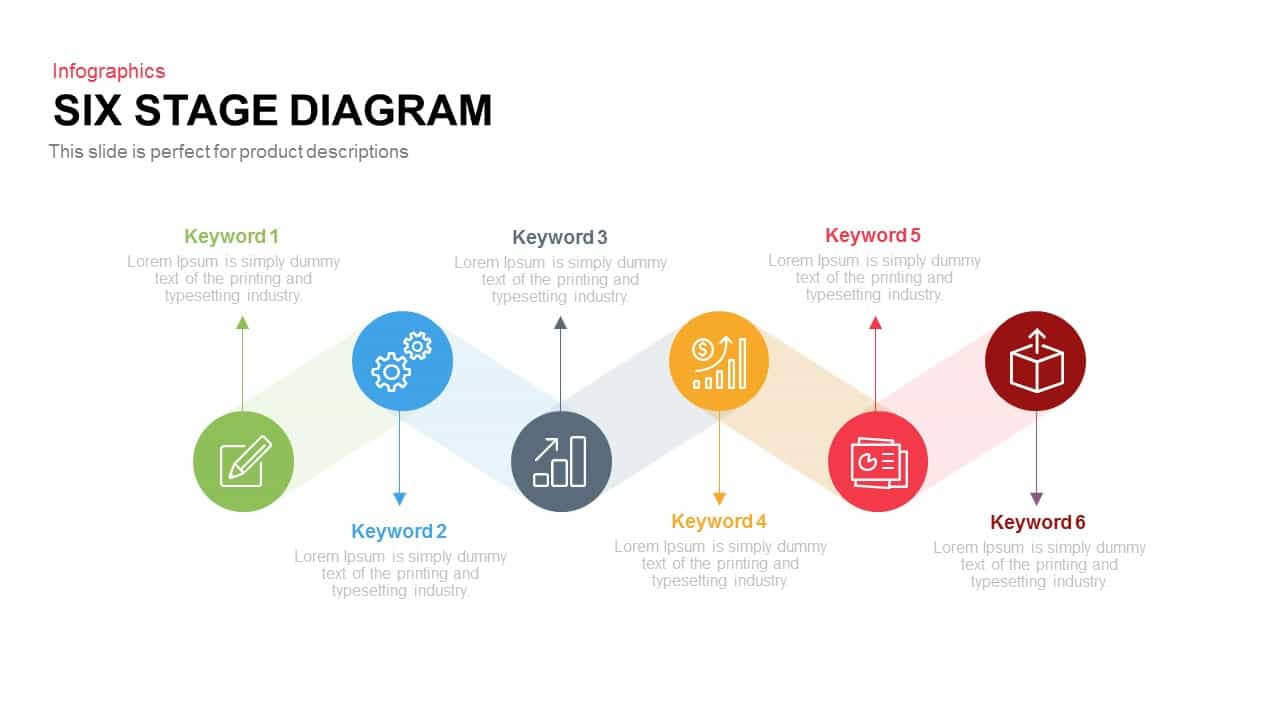
Six Stage Zigzag Process Diagram Template for PowerPoint & Google Slides
Process
Six-Stage Zig-Zag Process Flow Diagram Template for PowerPoint & Google Slides
Process
Six-Stage Semi-Circle Diagram with Icons Template for PowerPoint & Google Slides
Circular
Six-Stage Circular Cycle Diagram Template for PowerPoint & Google Slides
Process
Free Six Stage Bubble Process Diagram template for PowerPoint & Google Slides
Process
Free
Six-Stage Circular Process Diagram Template for PowerPoint & Google Slides
Process
Six Stage Circular Diagram with Icons Template for PowerPoint & Google Slides
Circular
Six-Stage Circle Process Diagram Template for PowerPoint & Google Slides
Process
Free Six-Stage Arrow Process Diagram Template for PowerPoint & Google Slides
Process
Free
Six-Stage Circular Diagram Process Template for PowerPoint & Google Slides
Circular
Six-Stage Arrow Timeline Diagram Template for PowerPoint & Google Slides
Timeline
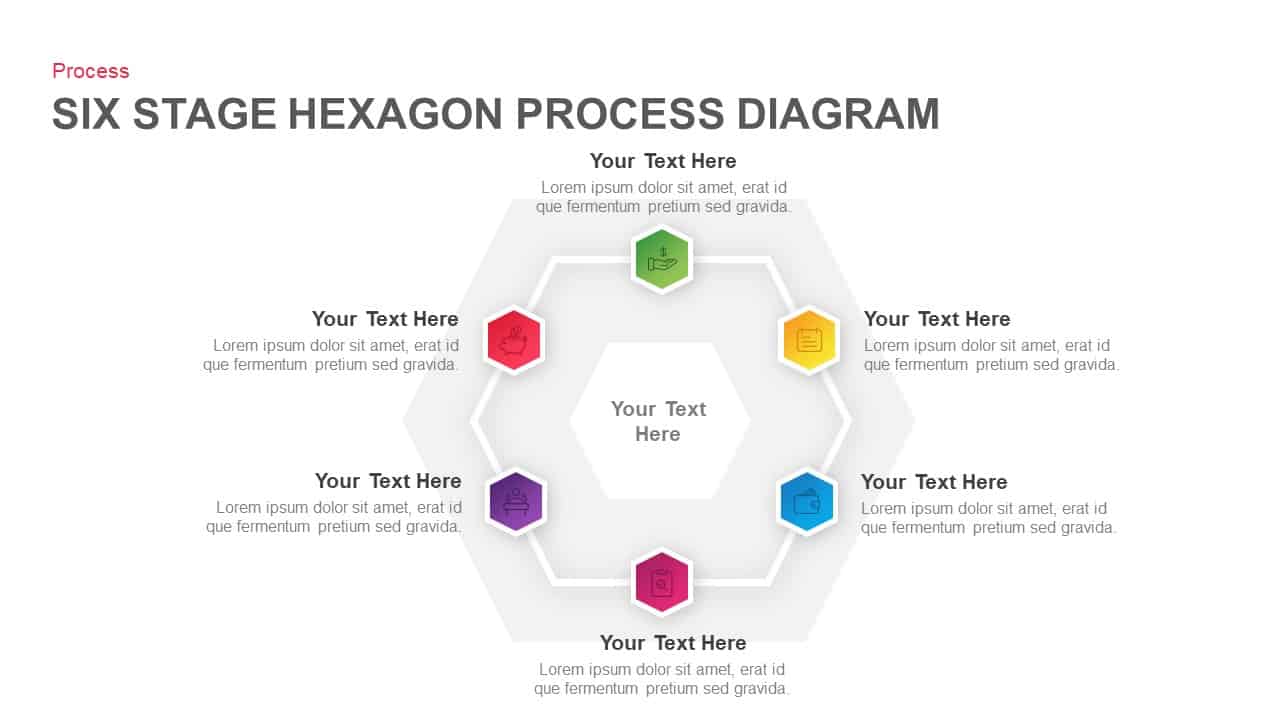
Six Stage Hexagon Process Diagram Template for PowerPoint & Google Slides
Process
Six-Stage Infinity Loop Process Diagram Template for PowerPoint & Google Slides
Process
Six-Stage Clockwise Circular Diagram Template for PowerPoint & Google Slides
Circular
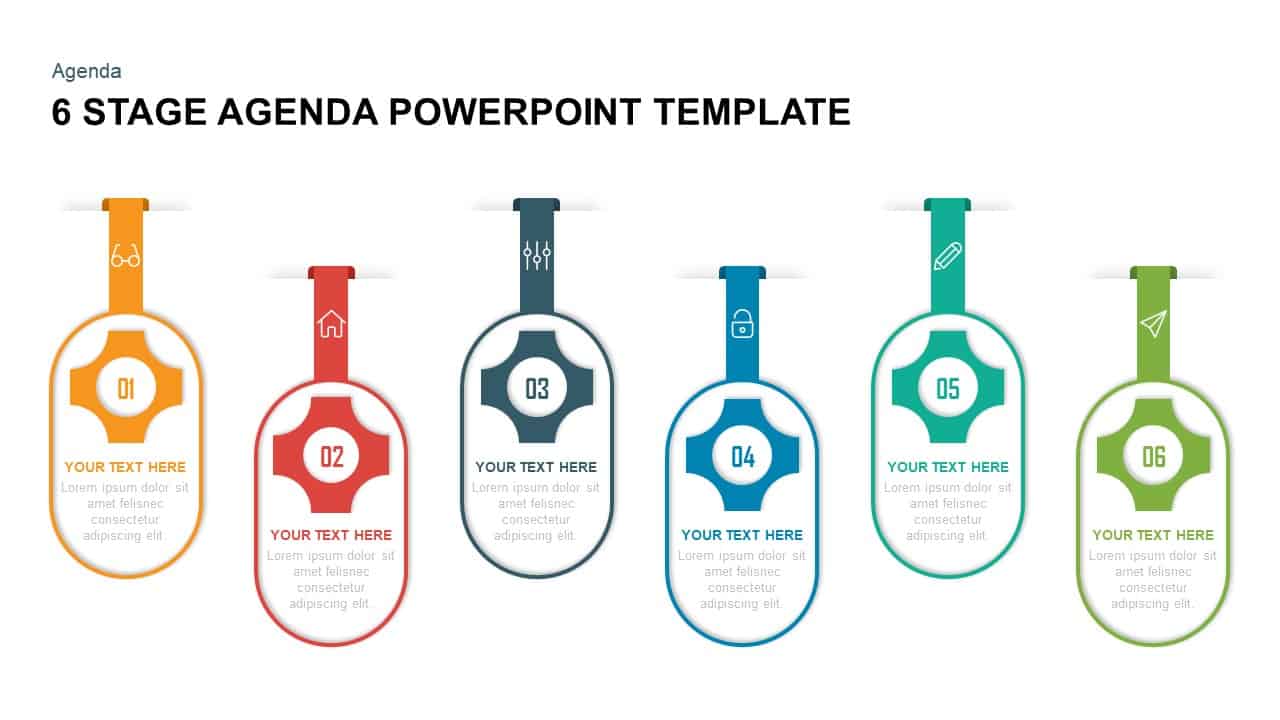
Six Stage Agenda Timeline Diagram template for PowerPoint & Google Slides
Agenda
Six-Stage Circular Flow Diagram Template for PowerPoint & Google Slides
Circular
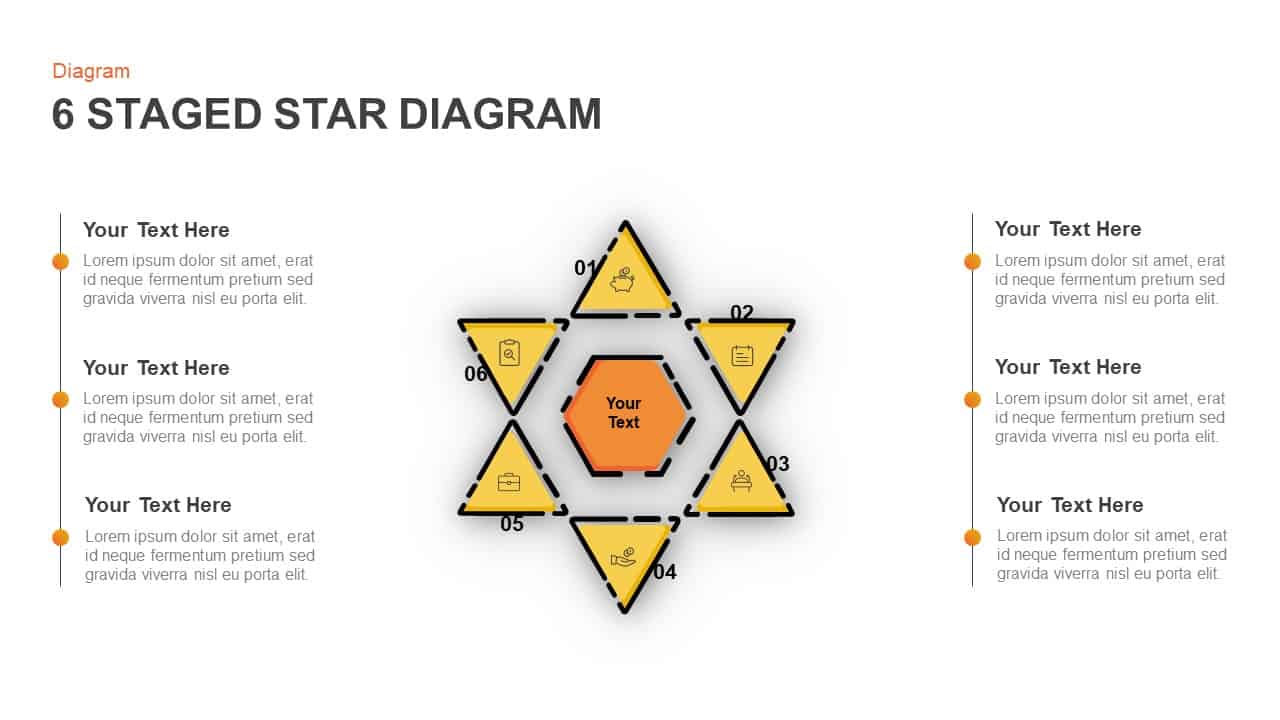
Six-Stage Star Diagram Infographic Template for PowerPoint & Google Slides
Process

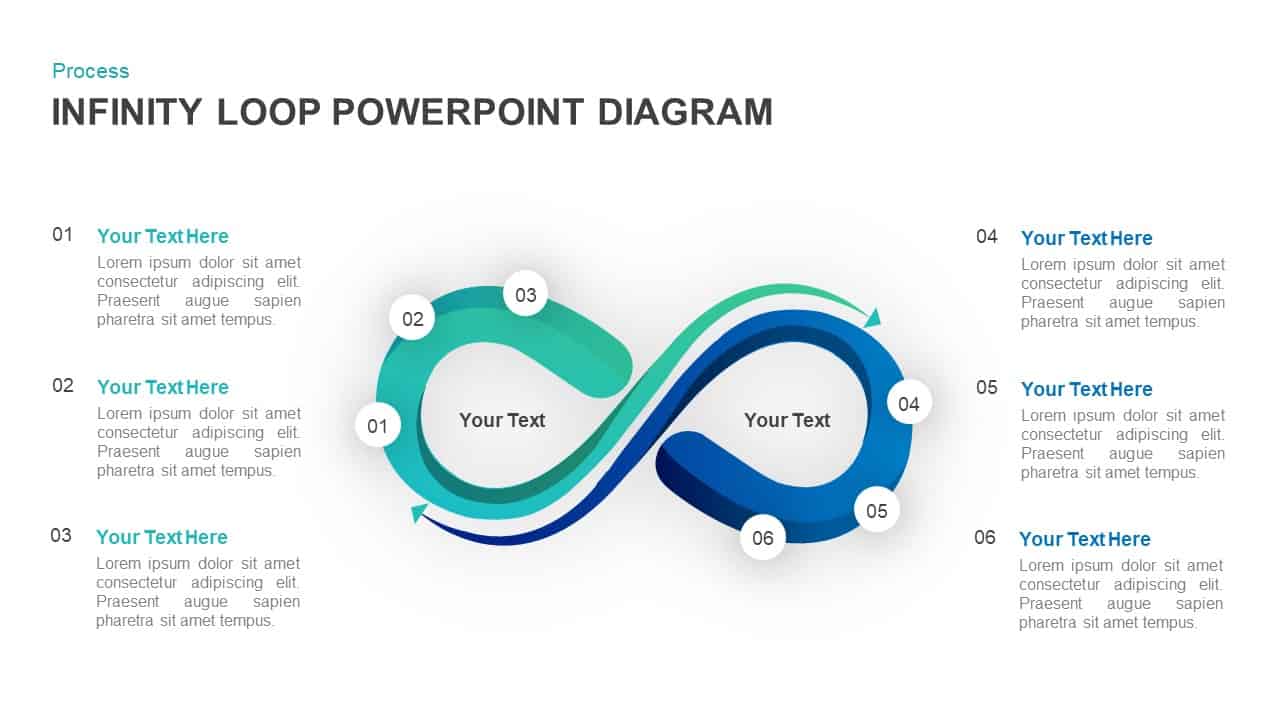
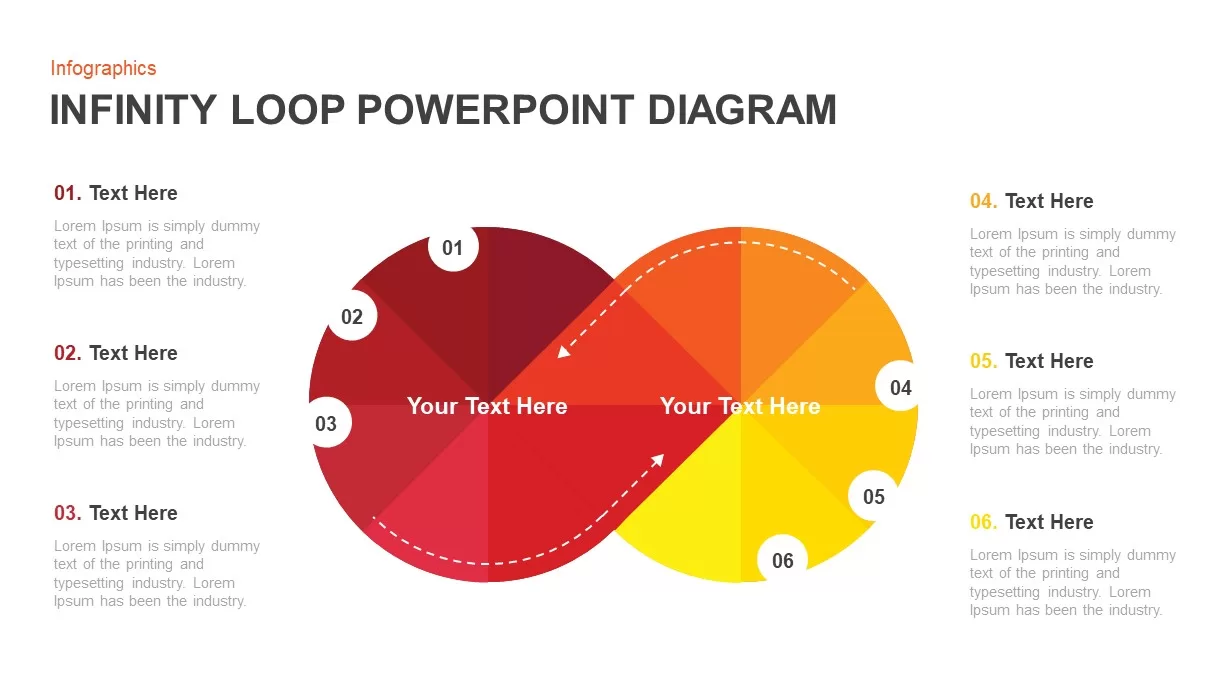
Six-Stage Infinity Loop Diagram Template for PowerPoint & Google Slides
Process
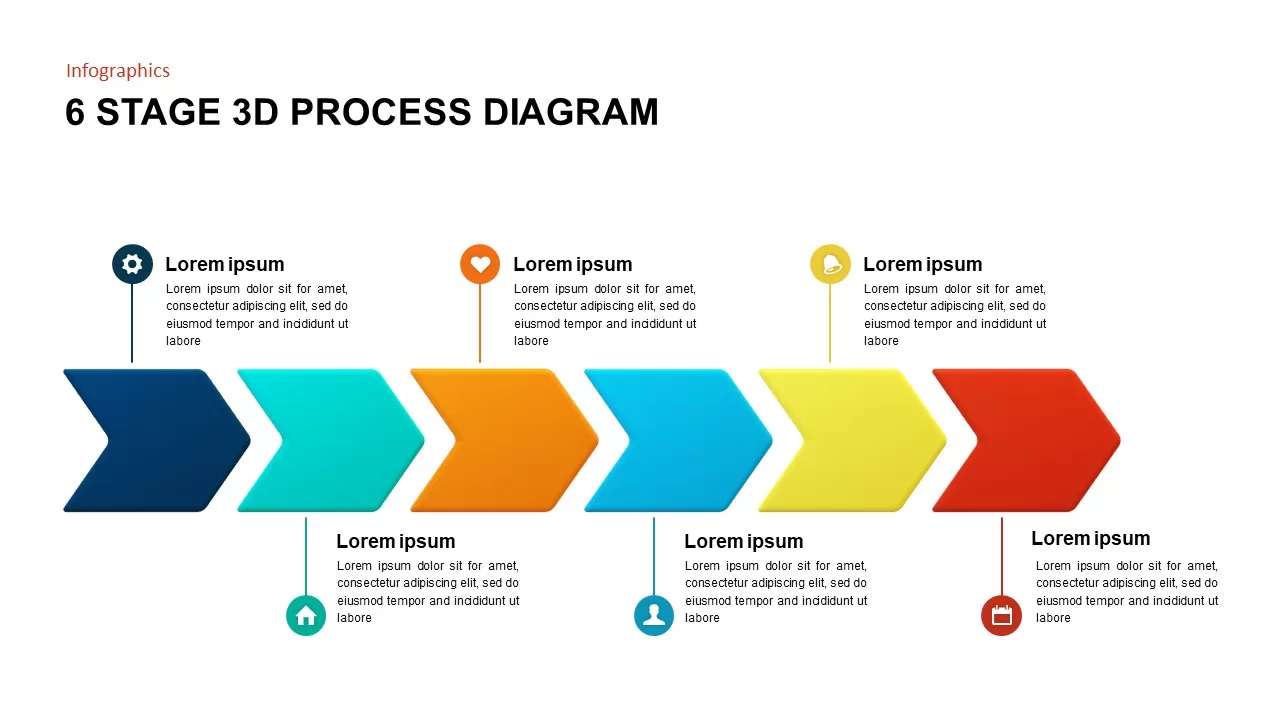
Animated Six-Stage 3D Process Diagram Template for PowerPoint & Google Slides
Arrow
Six Stage Timeline Diagram for PowerPoint & Google Slides
Timeline
Five and Six Step Line Linear Stage Diagram for PowerPoint & Google Slides
Infographics
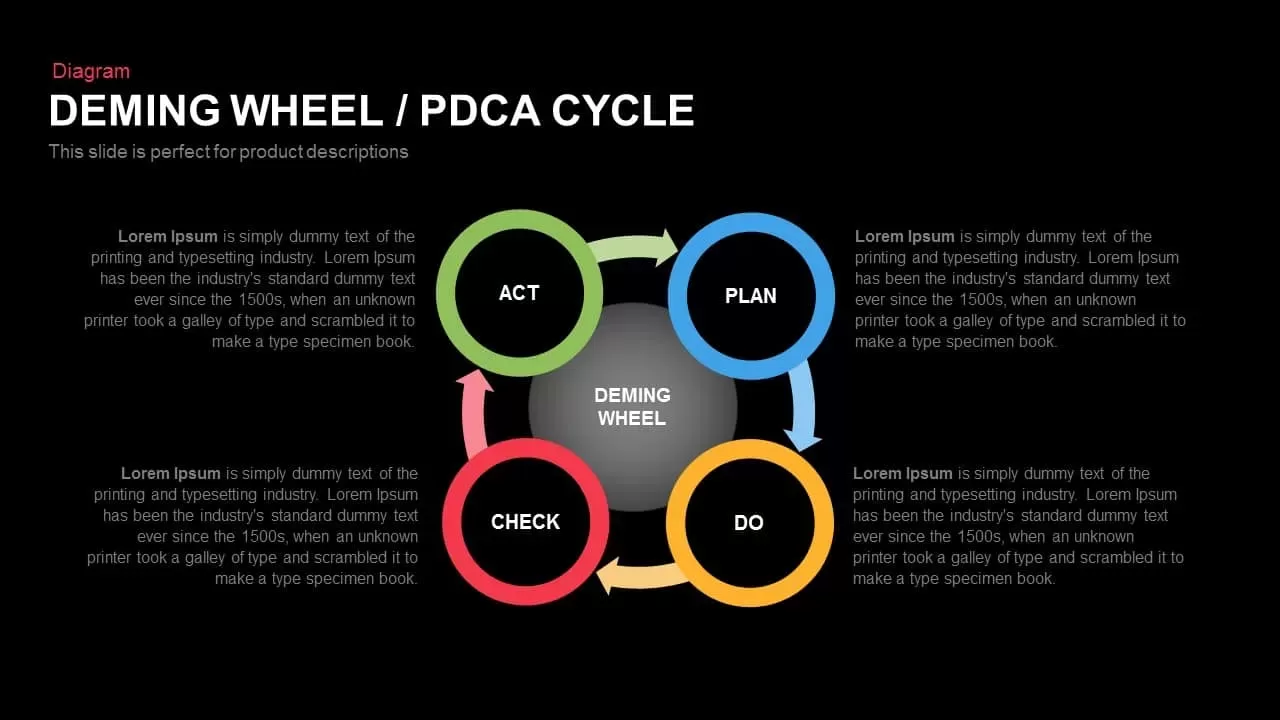
Deming Wheel PDCA Cycle Diagram Template for PowerPoint & Google Slides
Business Plan
Multi-Level Wheel Chart Diagram template for PowerPoint & Google Slides
Pie/Donut
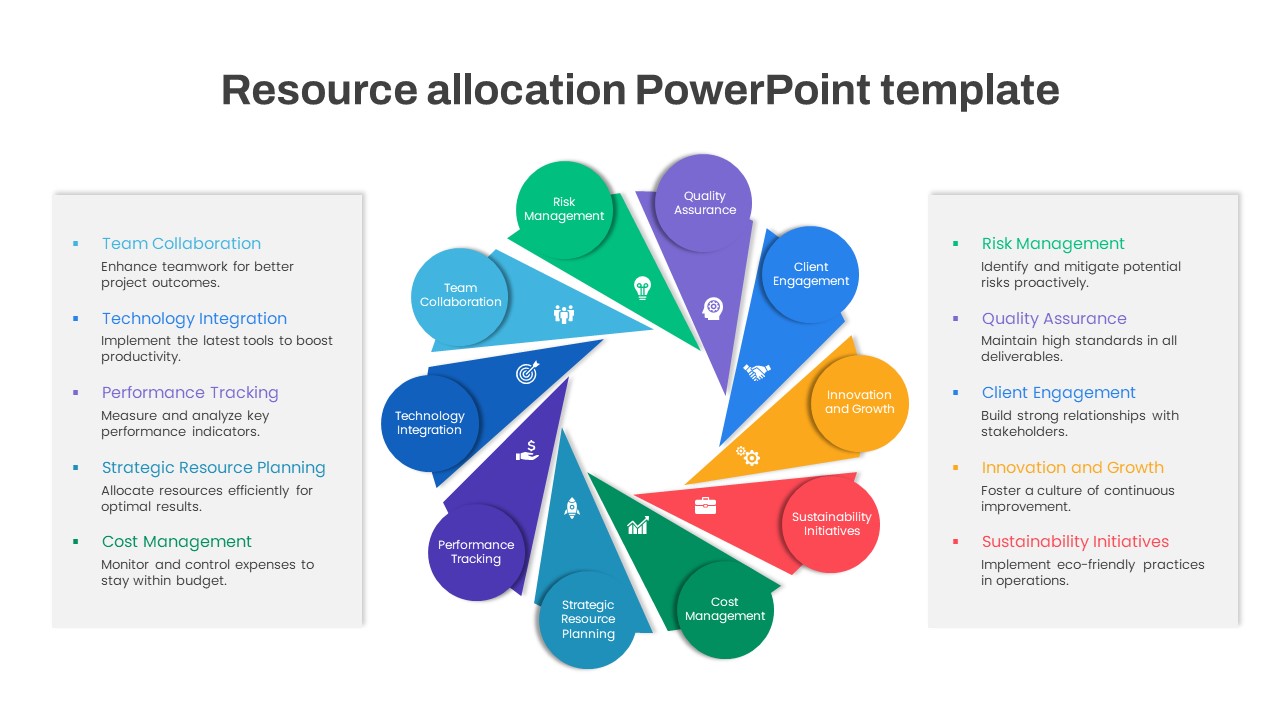
Resource Allocation Wheel Diagram Template for PowerPoint & Google Slides
Circular
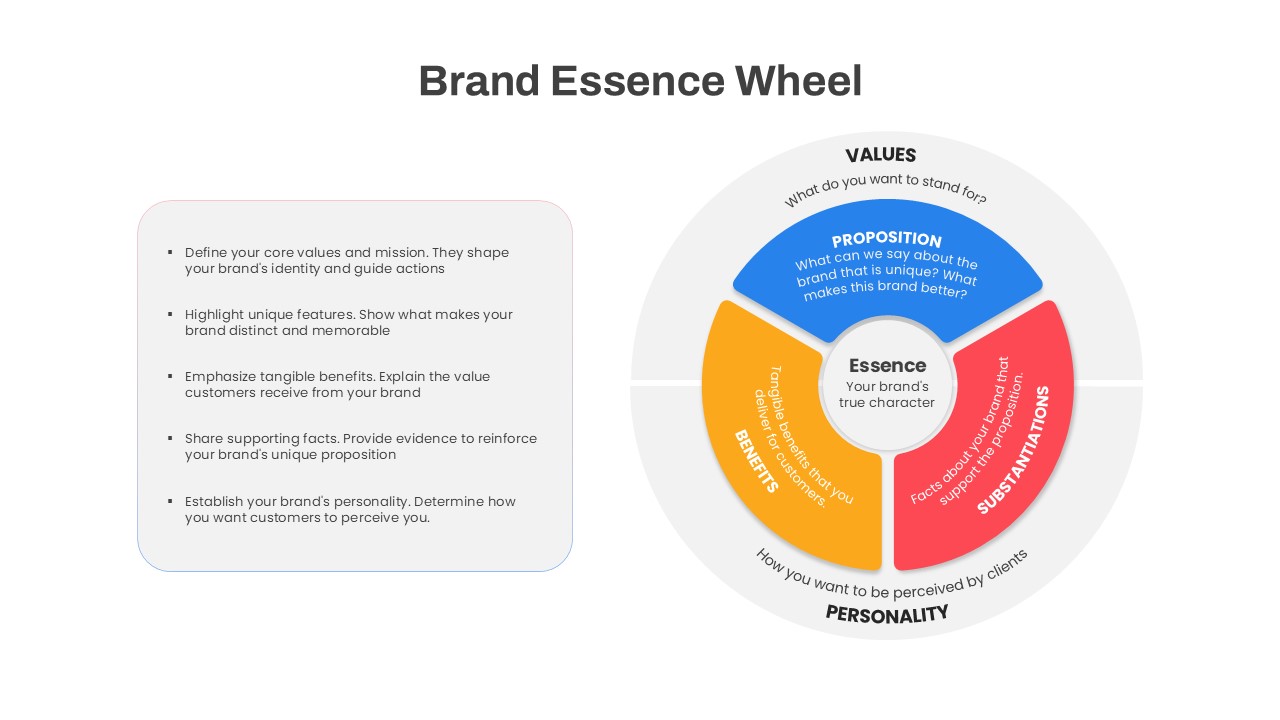
Brand Essence Wheel Strategy Diagram Template for PowerPoint & Google Slides
Circular
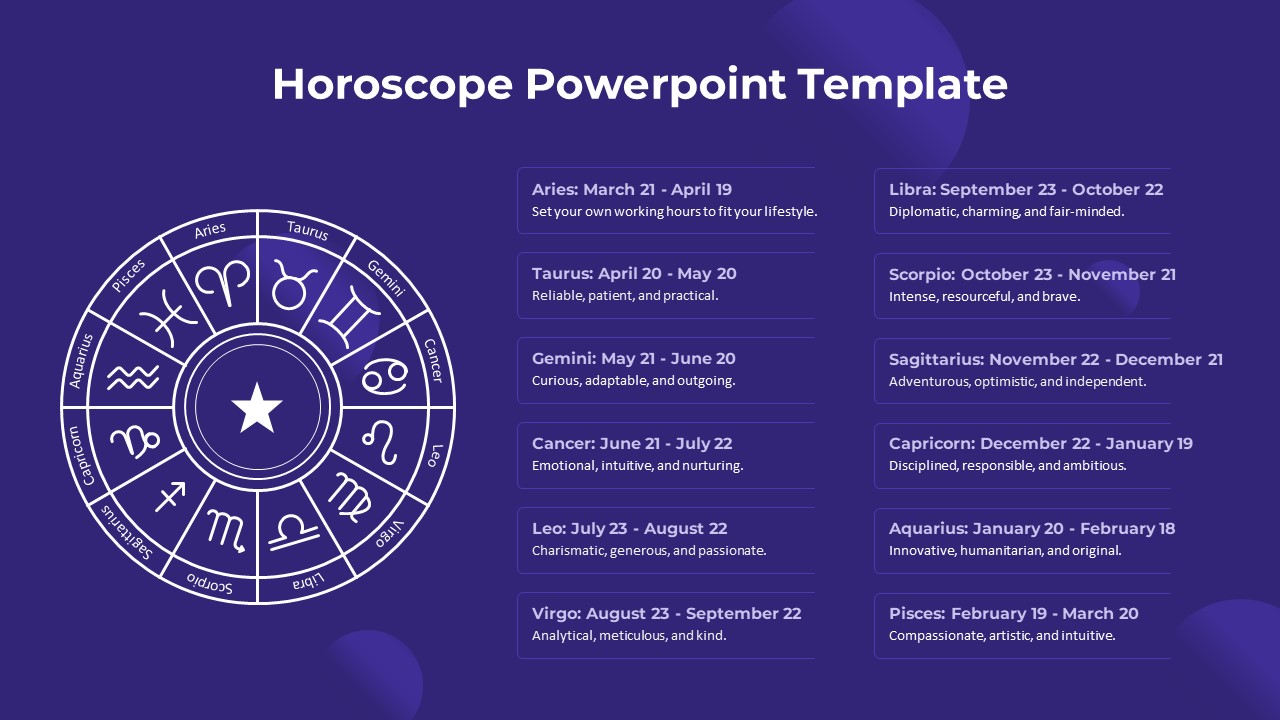
Free Zodiac Horoscope Wheel Diagram Template for PowerPoint & Google Slides
Circular
Free
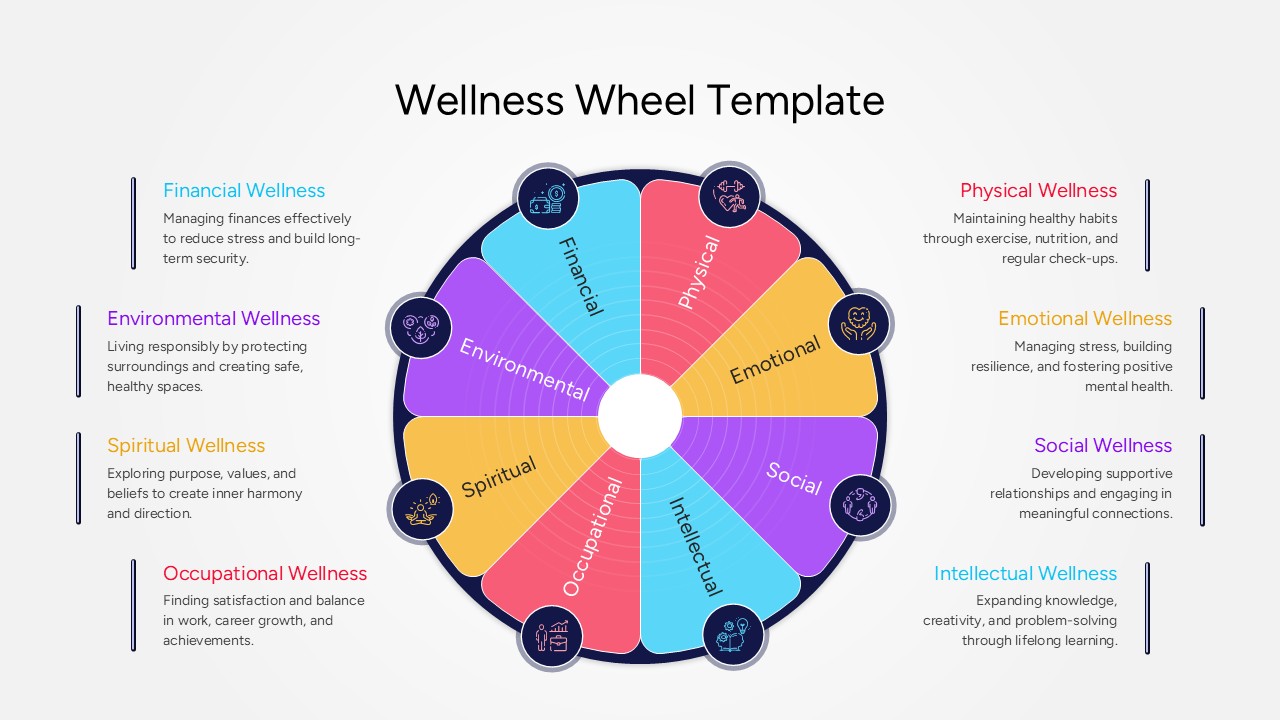
Wellness Wheel Concept Diagram Template for PowerPoint & Google Slides
Health
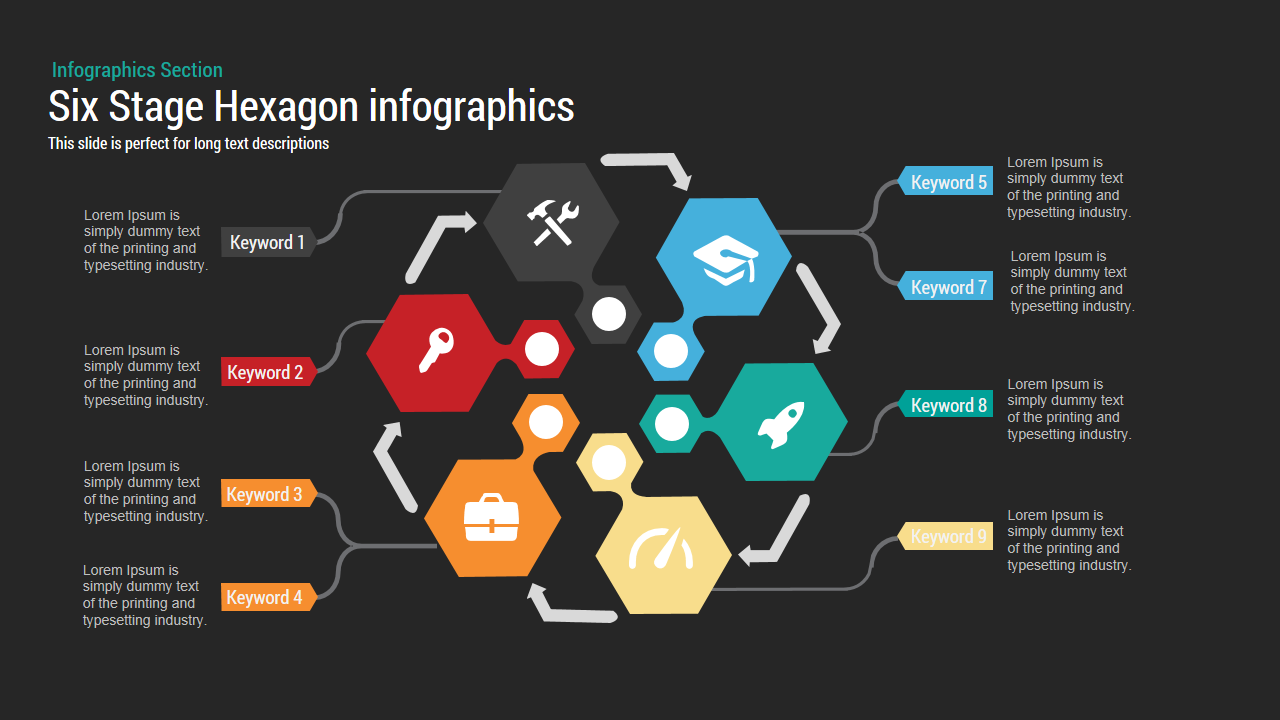
Six-Stage Hexagon template for PowerPoint & Google Slides
Process
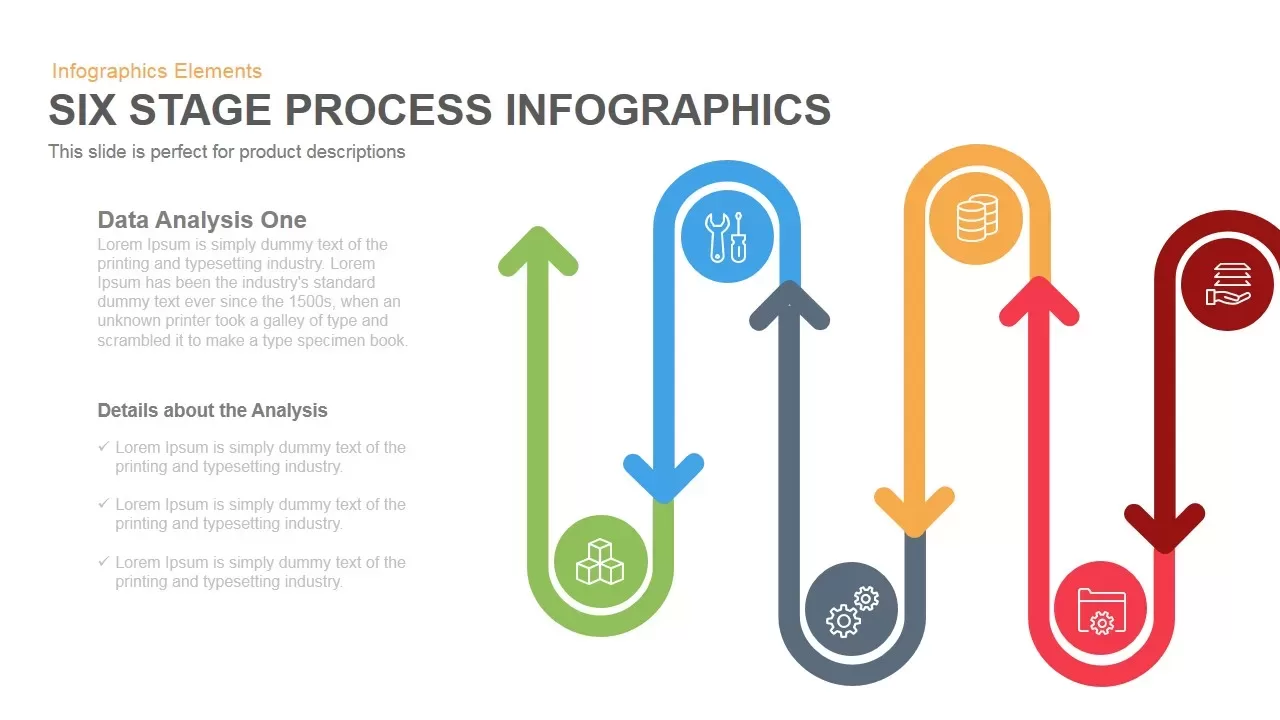
Six-Stage Process Infographics Template for PowerPoint & Google Slides
Process
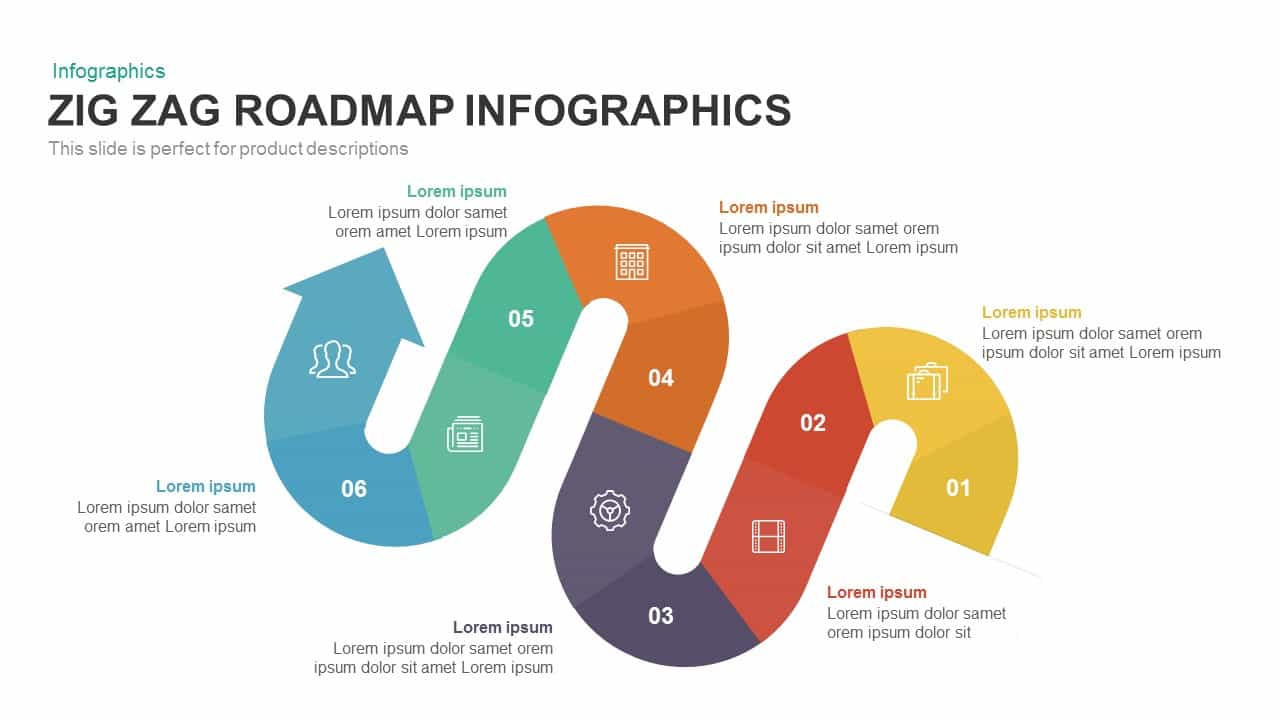
Six-Stage Zig-Zag Roadmap Infographics Template for PowerPoint & Google Slides
Roadmap
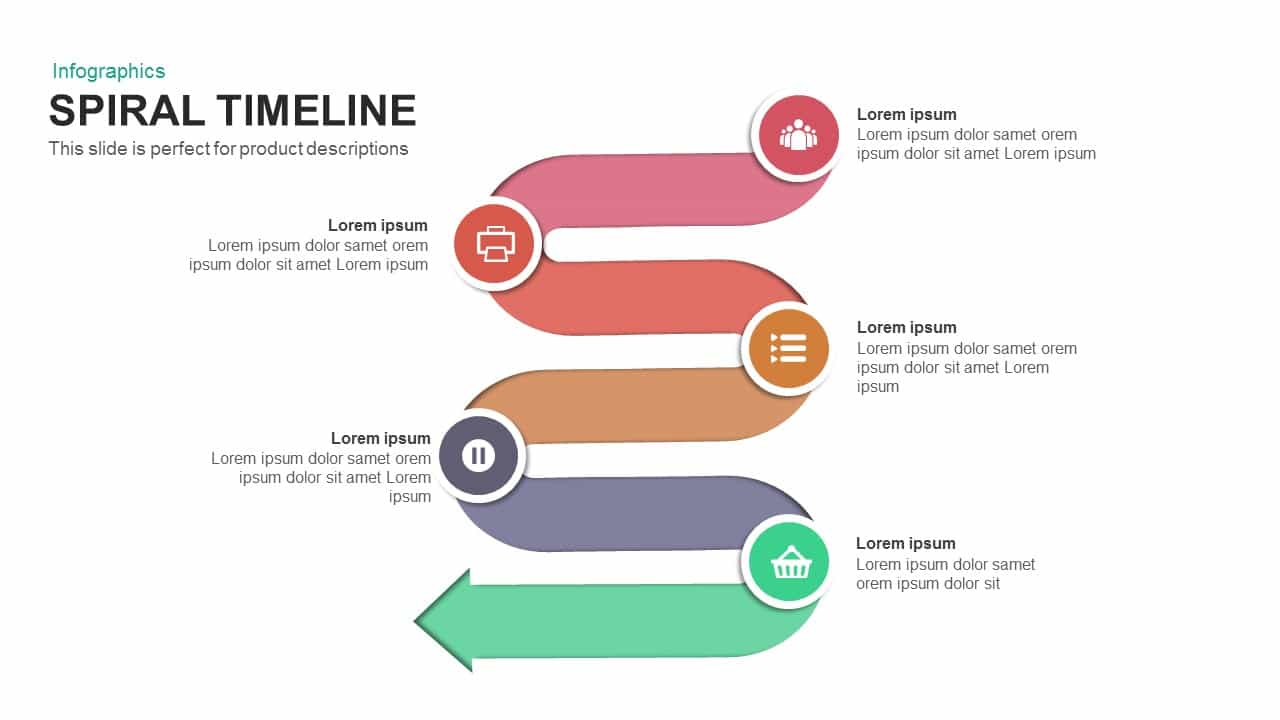
Six-Stage Colorful Spiral Timeline Template for PowerPoint & Google Slides
Timeline
Six-Stage Time Arrow Infographics Template for PowerPoint & Google Slides
Arrow
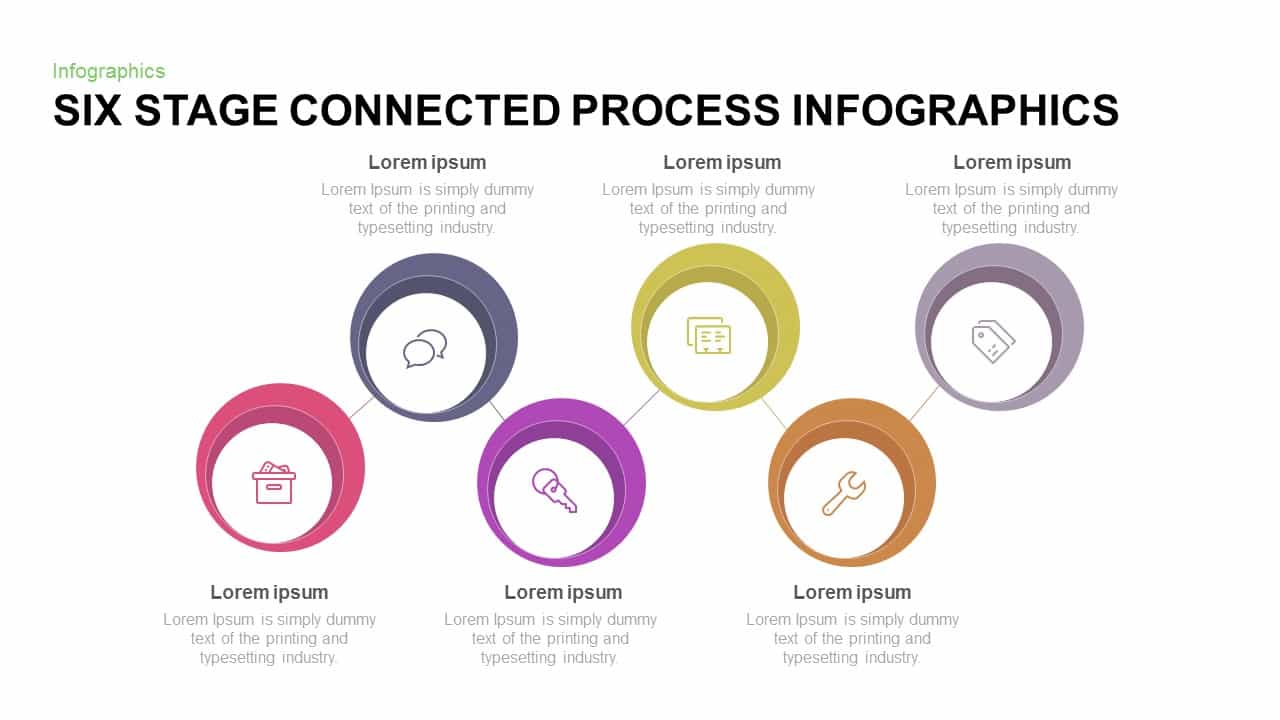
Six-Stage Connected Process Infographics Template for PowerPoint & Google Slides
Process
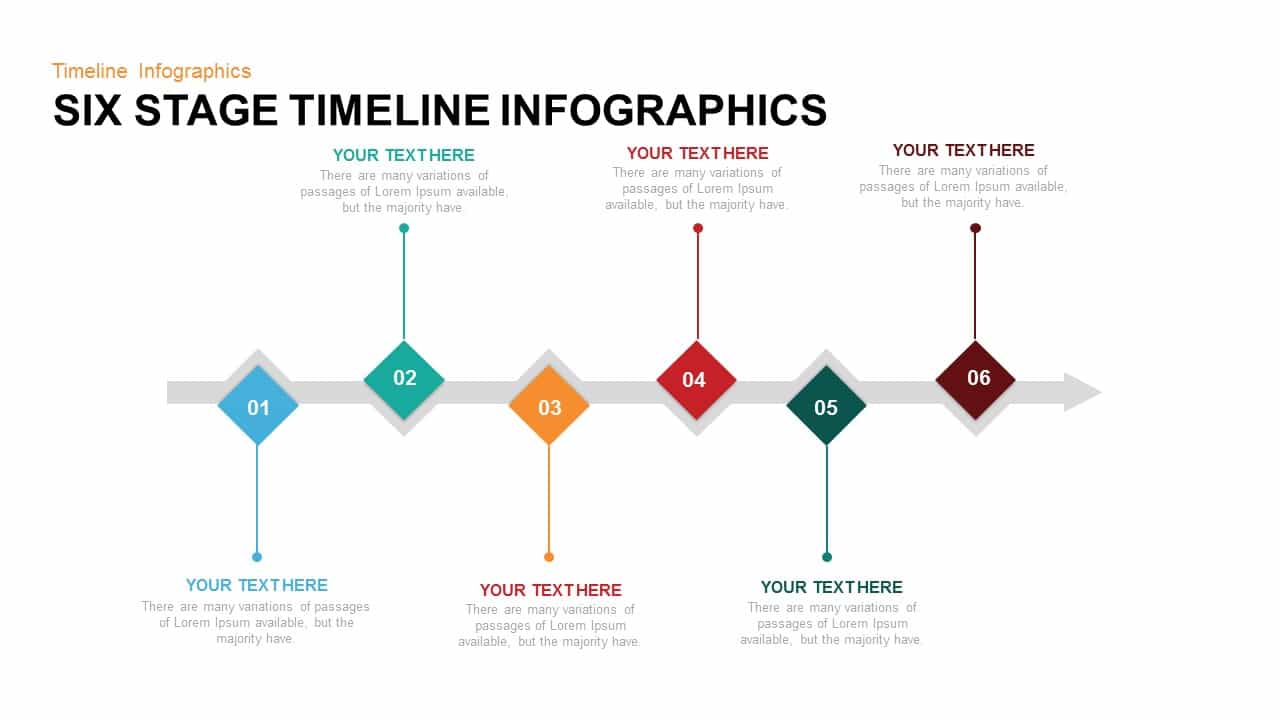
Six Stage Timeline Infographics Template for PowerPoint & Google Slides
Timeline
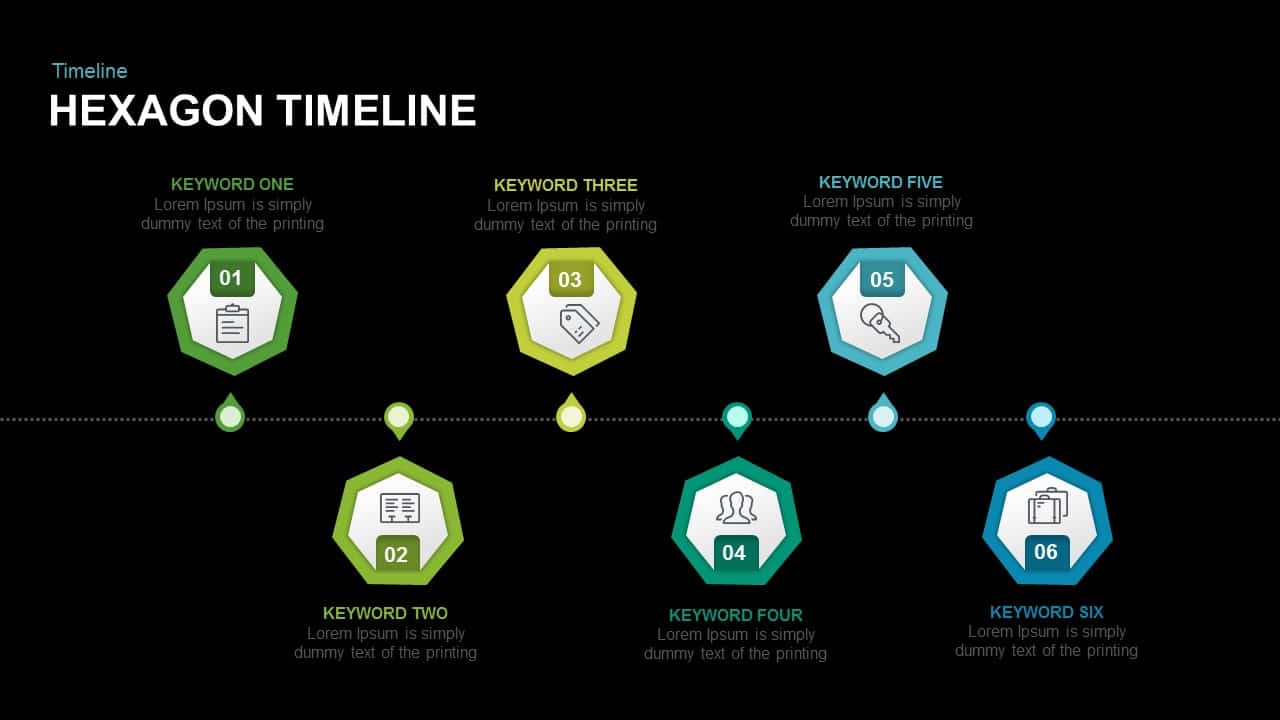
Six-Stage Hexagon Timeline Infographic Template for PowerPoint & Google Slides
Timeline
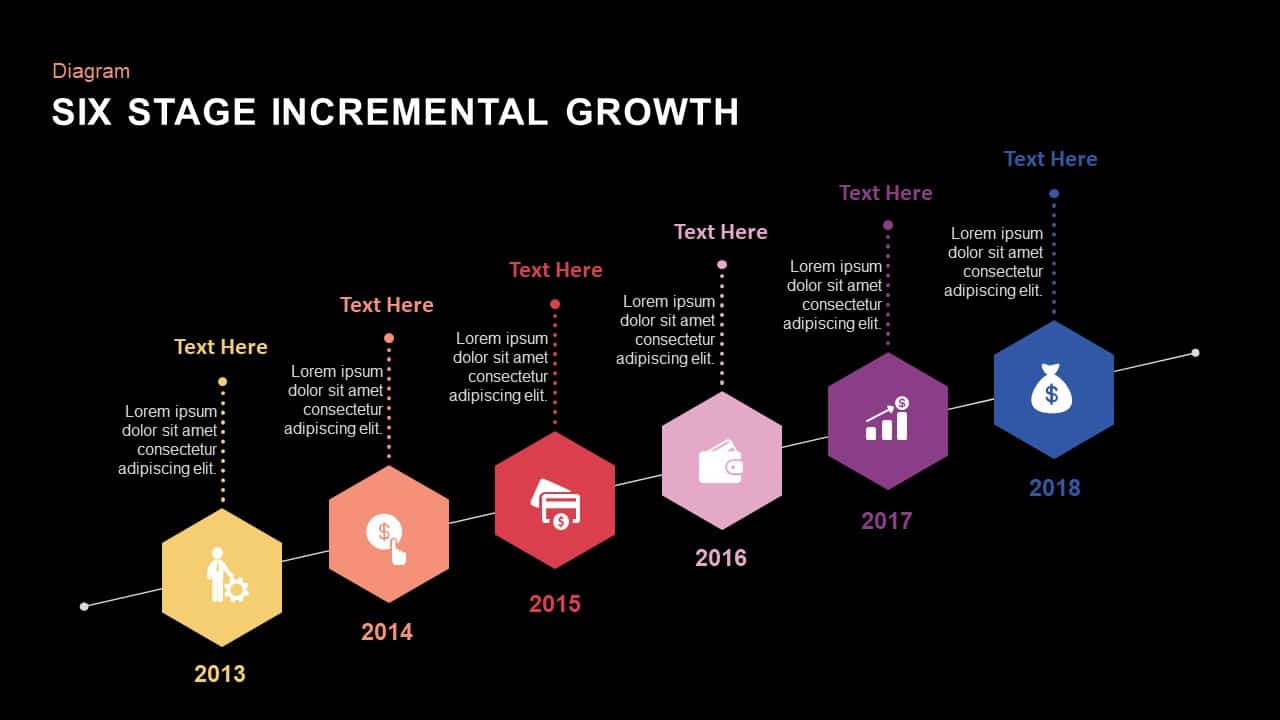
Six Stage Incremental Growth template for PowerPoint & Google Slides
Timeline
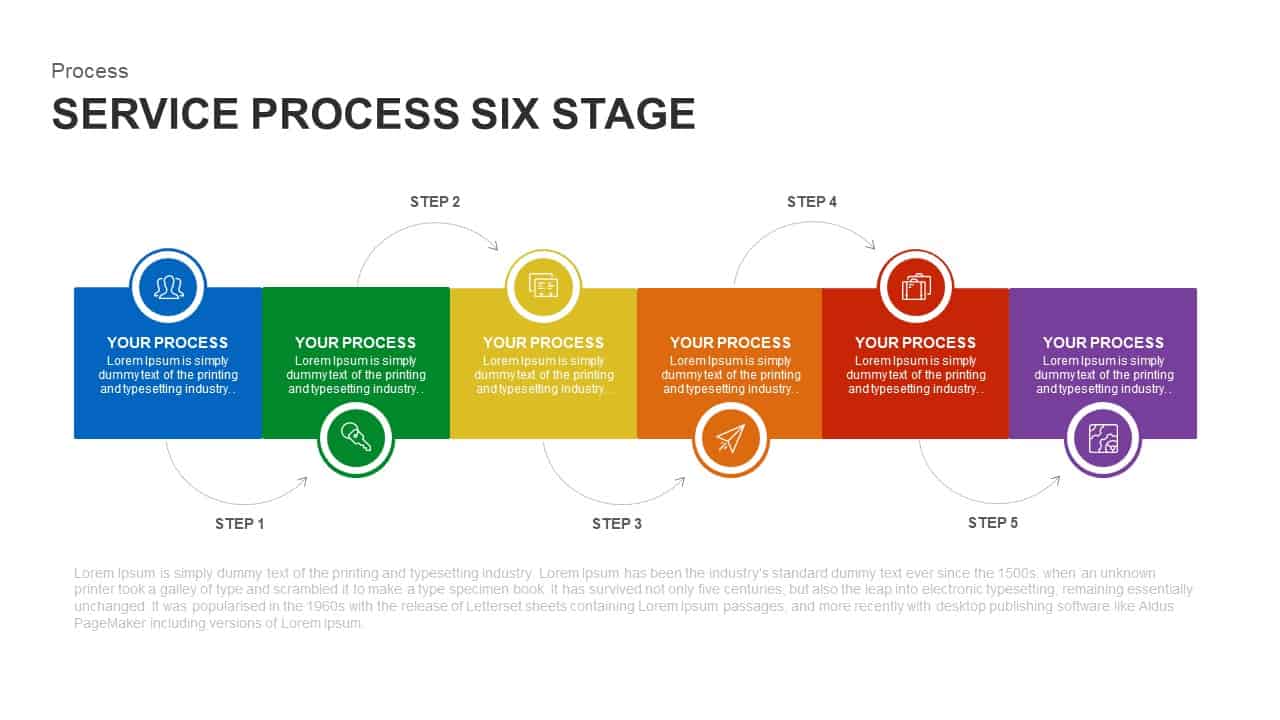
Six-Stage Service Process Workflow Template for PowerPoint & Google Slides
Process
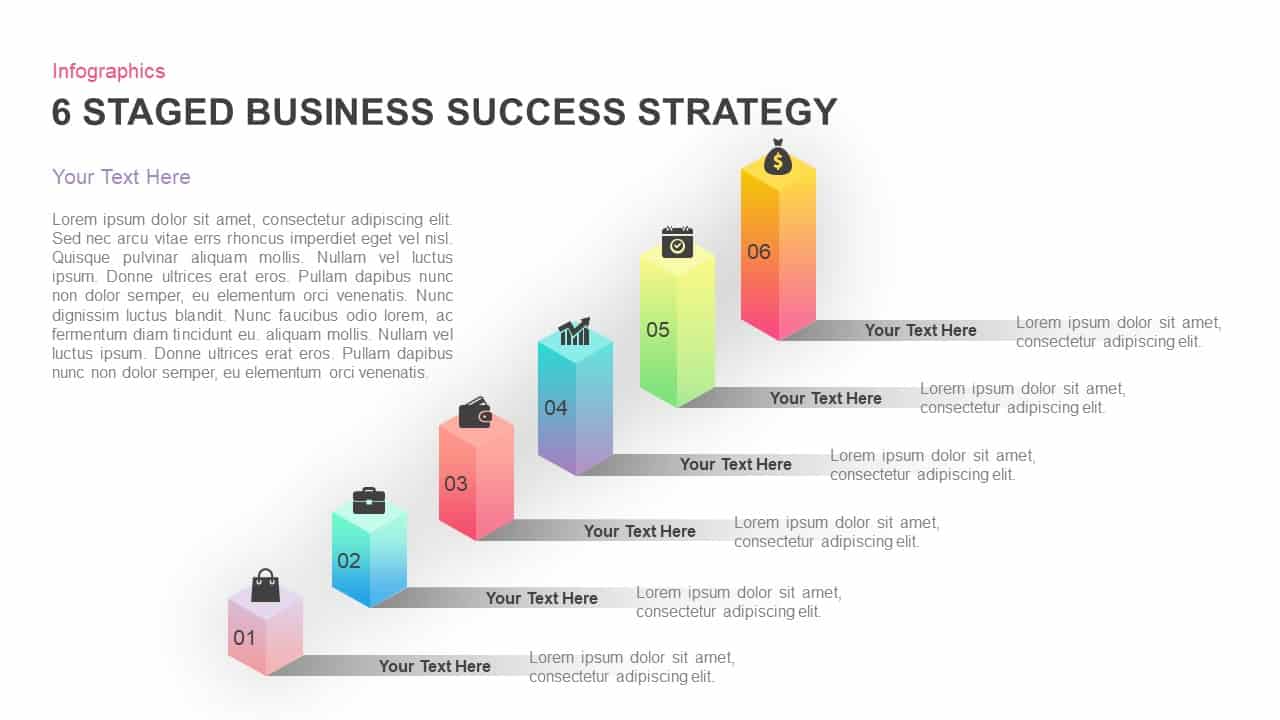
Six-Stage Business Success Strategy Template for PowerPoint & Google Slides
Business Strategy
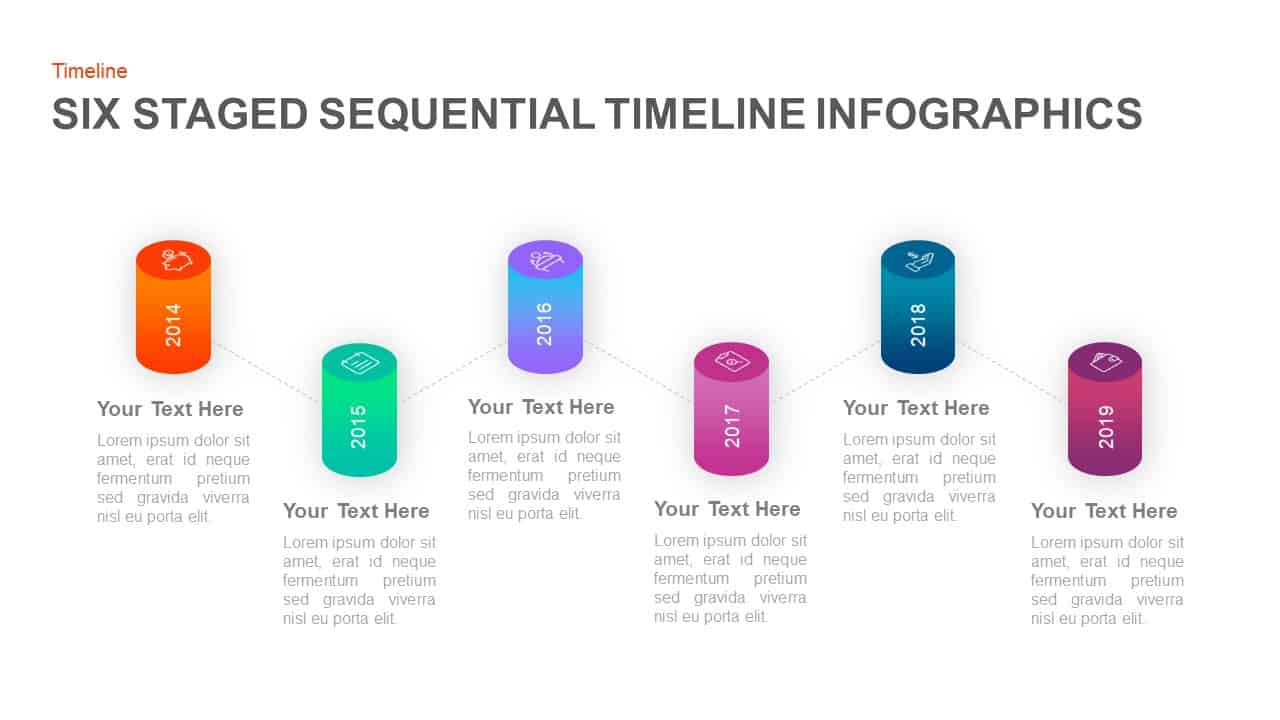
Six-Stage Timeline Infographic Template for PowerPoint & Google Slides
Timeline
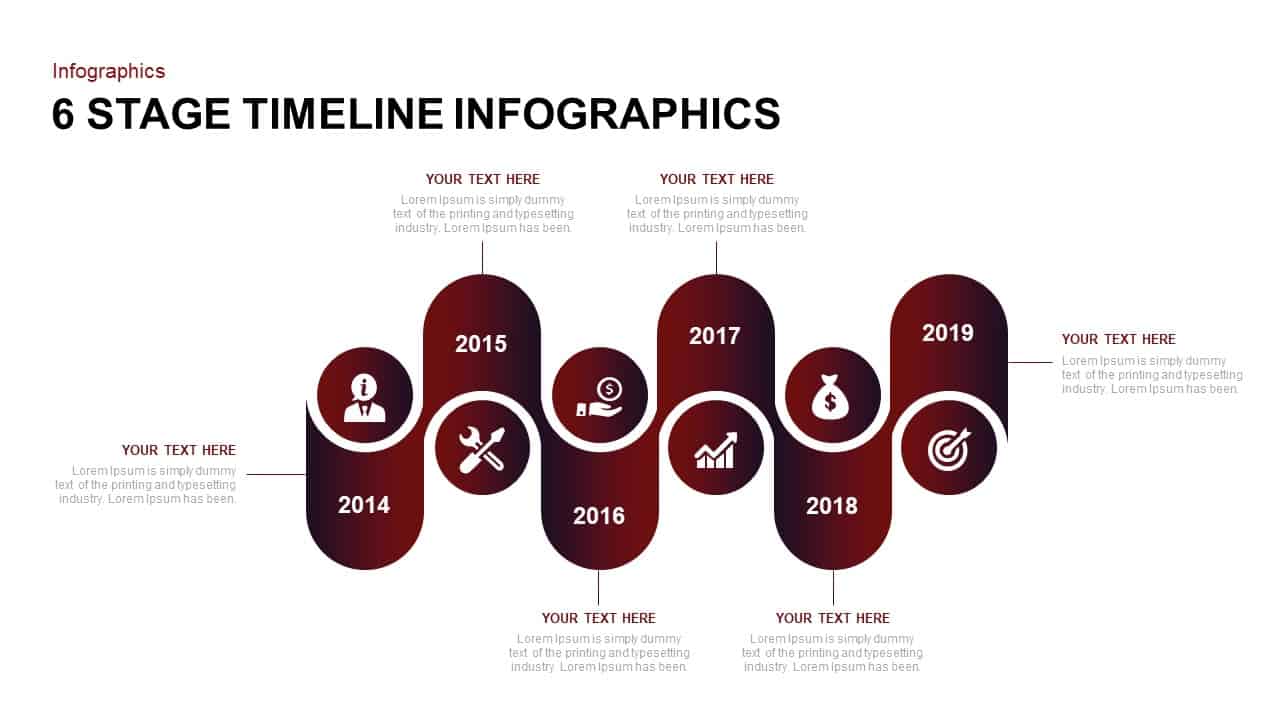
Six-Stage Timeline Infographics Slide Template for PowerPoint & Google Slides
Timeline
Six-Stage Road Map Infographic Timeline Template for PowerPoint & Google Slides
Roadmap
Six-Stage Pyramid Process Slide Template for PowerPoint & Google Slides
Pyramid
Six Stage Product Development Process Template for PowerPoint & Google Slides
Software Development
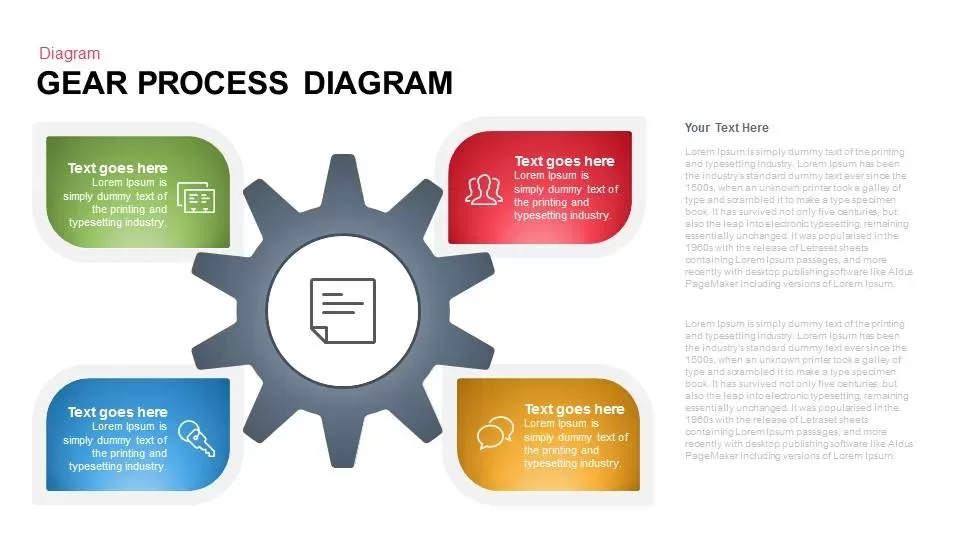
Gear Process Diagram PowerPoint Template for PowerPoint & Google Slides
Process
Gear Process Diagram template for PowerPoint & Google Slides
Process
Gear Diagram template for PowerPoint & Google Slides
Process
Professional 3D Gear Process Diagram Template for PowerPoint & Google Slides
Process
Gear Process Phase Diagram template for PowerPoint & Google Slides
Process

Five-Step Gear Process Diagram Template for PowerPoint & Google Slides
Process
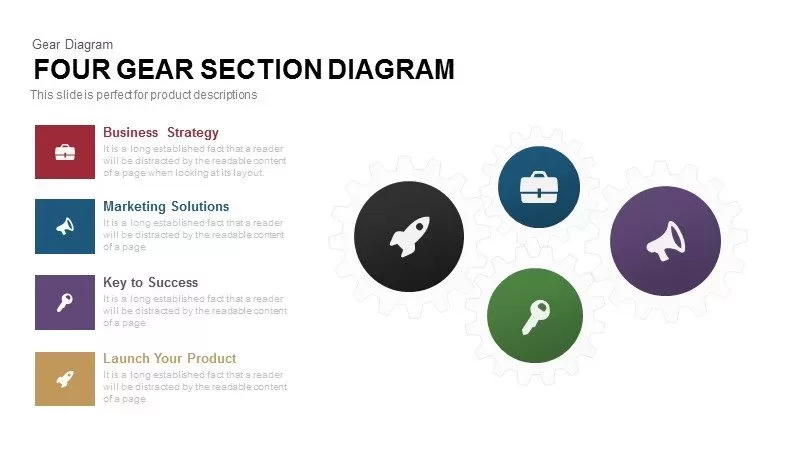
Four Gear Section Diagram Template for PowerPoint & Google Slides
Circular

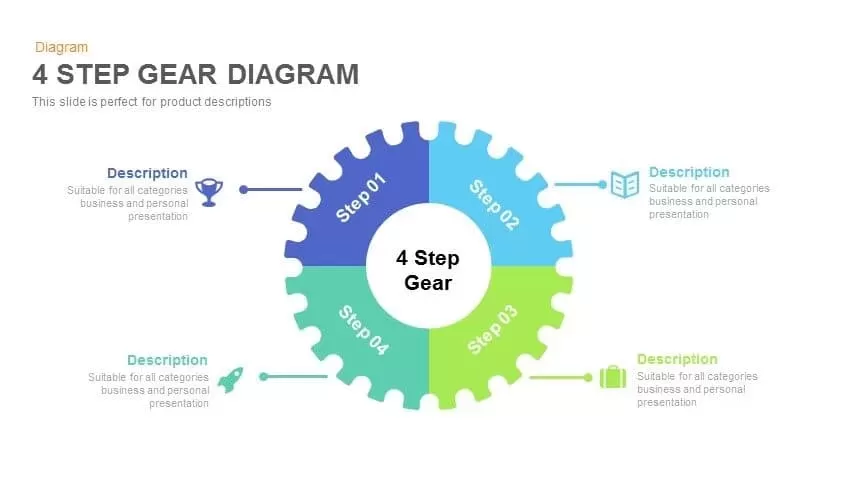
4 Step Gear Diagram Template for PowerPoint & Google Slides
Process

Dynamic 4 Gear Process Diagram Template for PowerPoint & Google Slides
Process
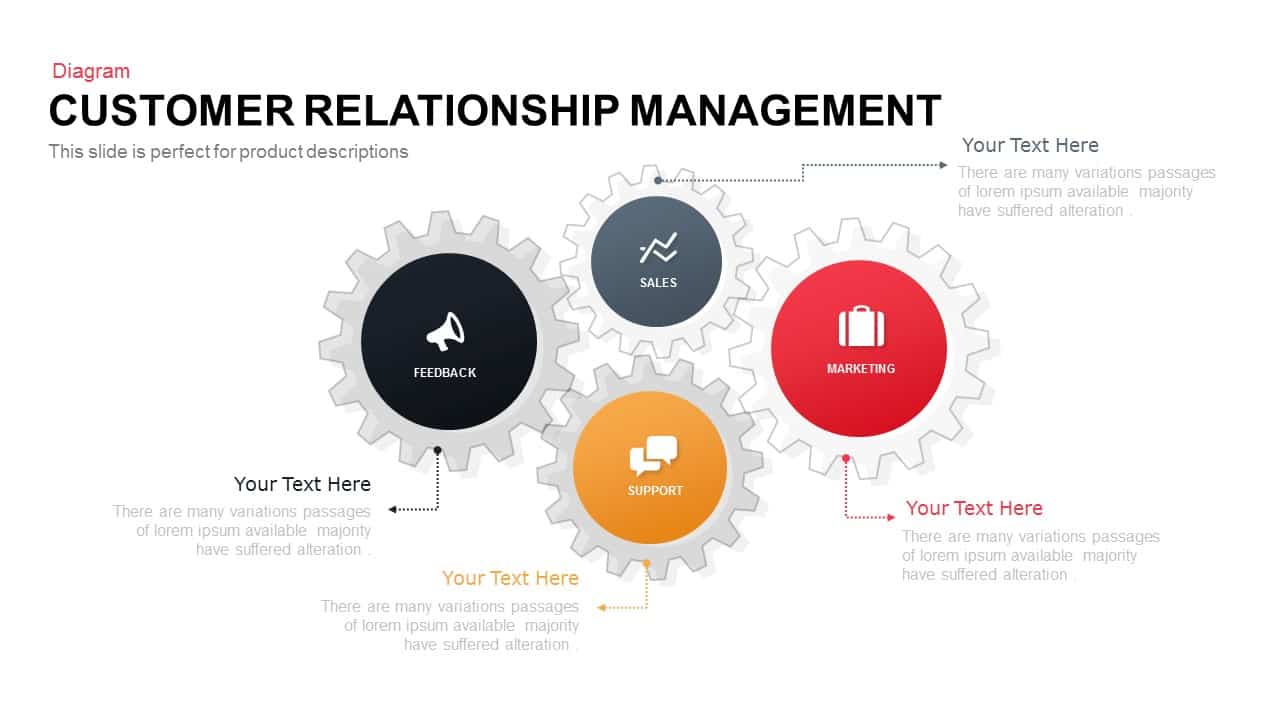
Colorful Modern CRM Gear Diagram Template for PowerPoint & Google Slides
Customer Experience
Gear Pie Diagram Data Visualization Template for PowerPoint & Google Slides
Pie/Donut
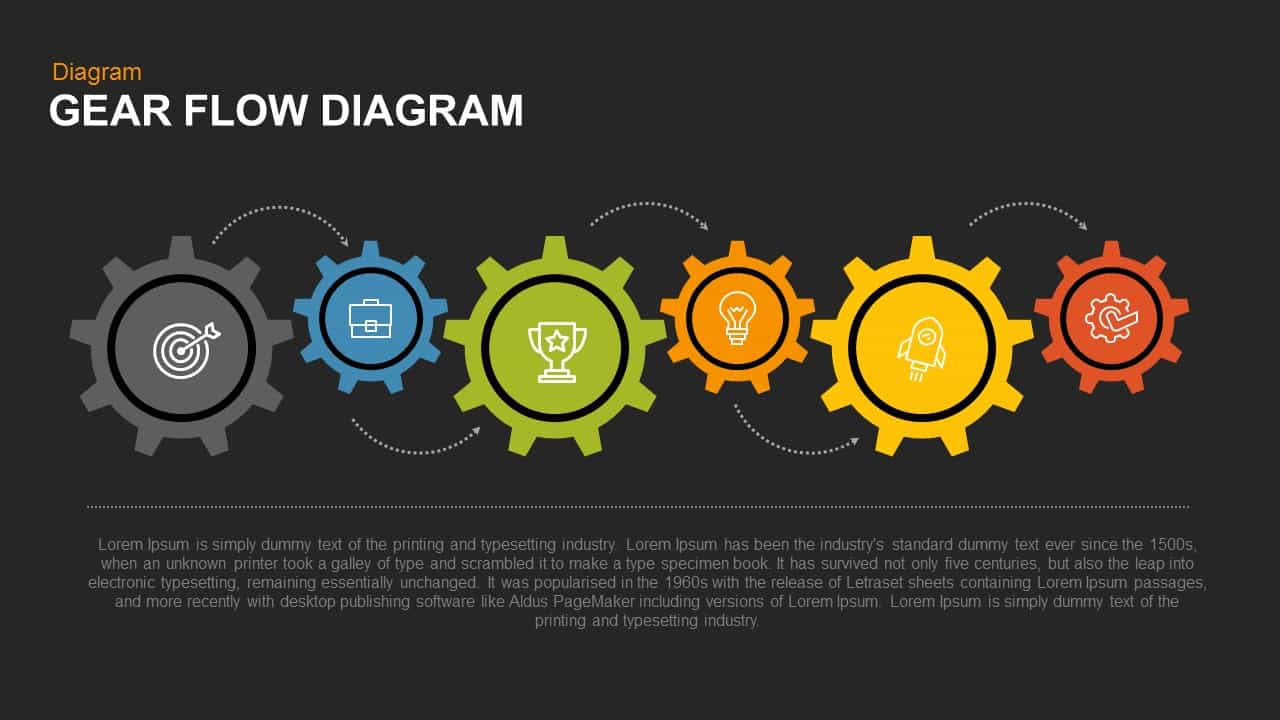
Gear Flow Diagram template for PowerPoint & Google Slides
Process
Artificial Intelligence Gear Diagram Template for PowerPoint & Google Slides
Process
Marketing Risk Management Gear Diagram Template for PowerPoint & Google Slides
Risk Management
SWOT Analysis Gear Diagram Slide Template for PowerPoint & Google Slides
SWOT
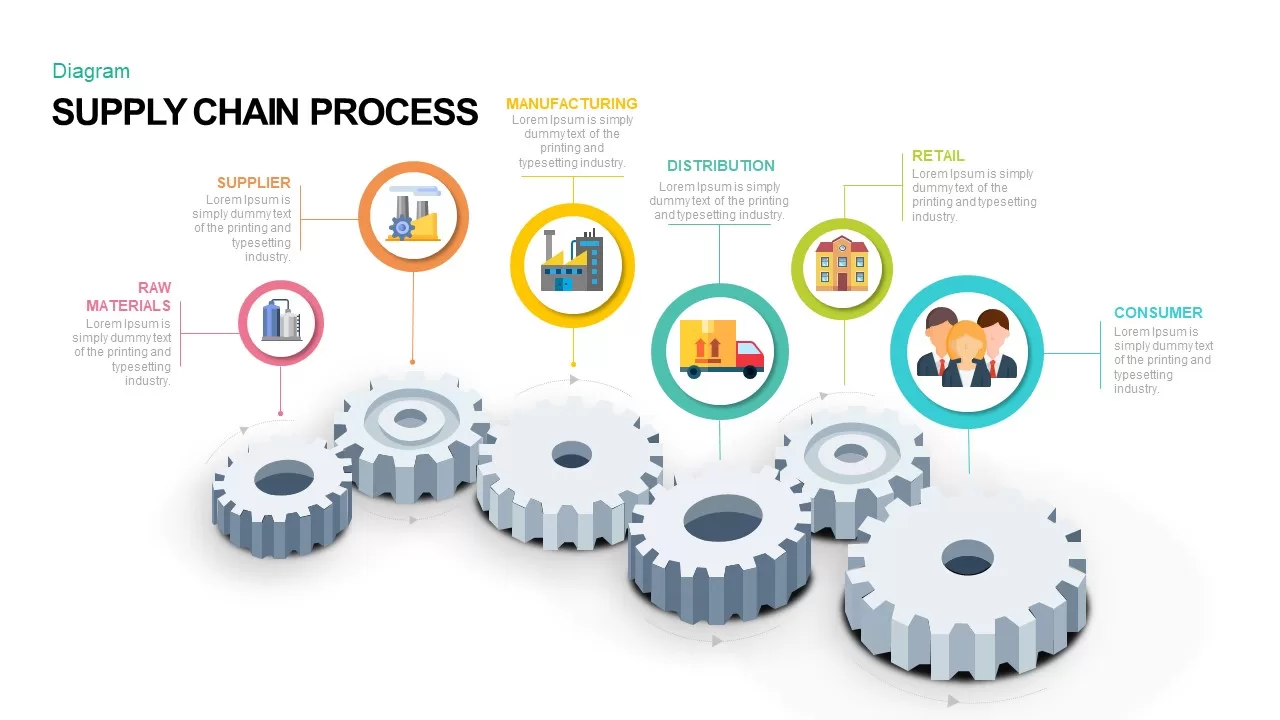
Supply Chain Process Gear Diagram Template for PowerPoint & Google Slides
Process
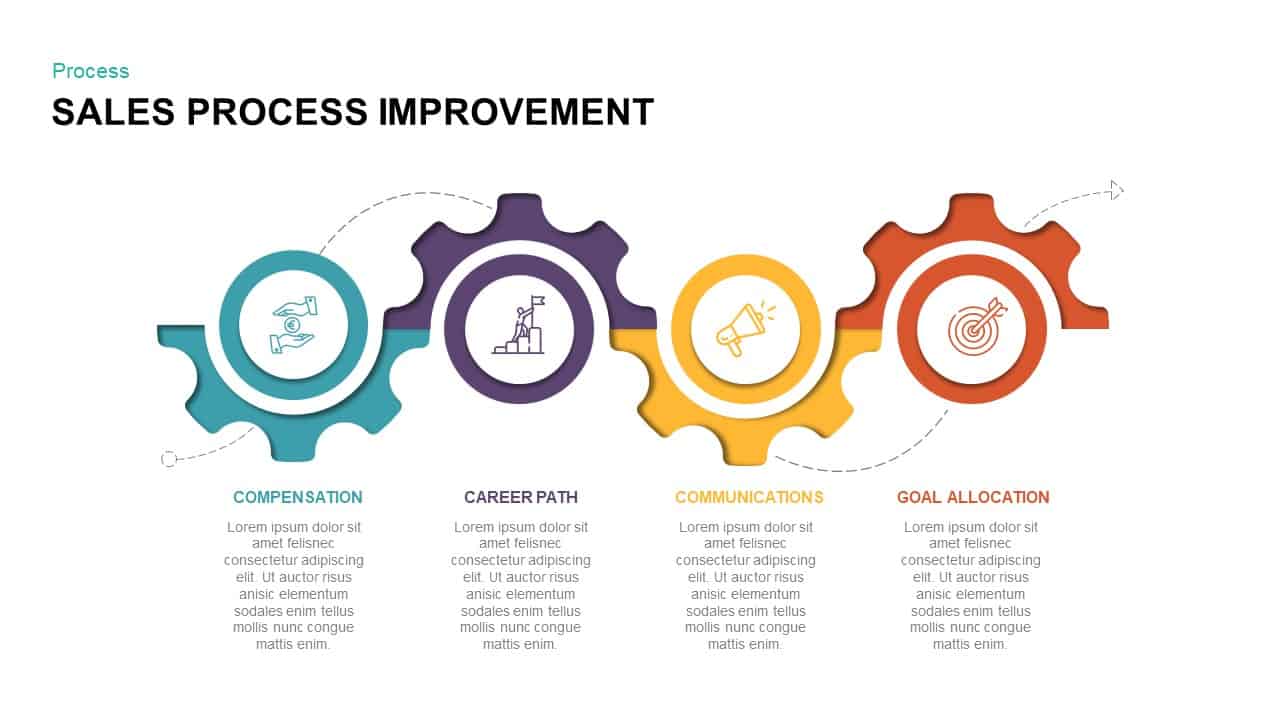
Sales Process Improvement Gear Diagram Template for PowerPoint & Google Slides
Process
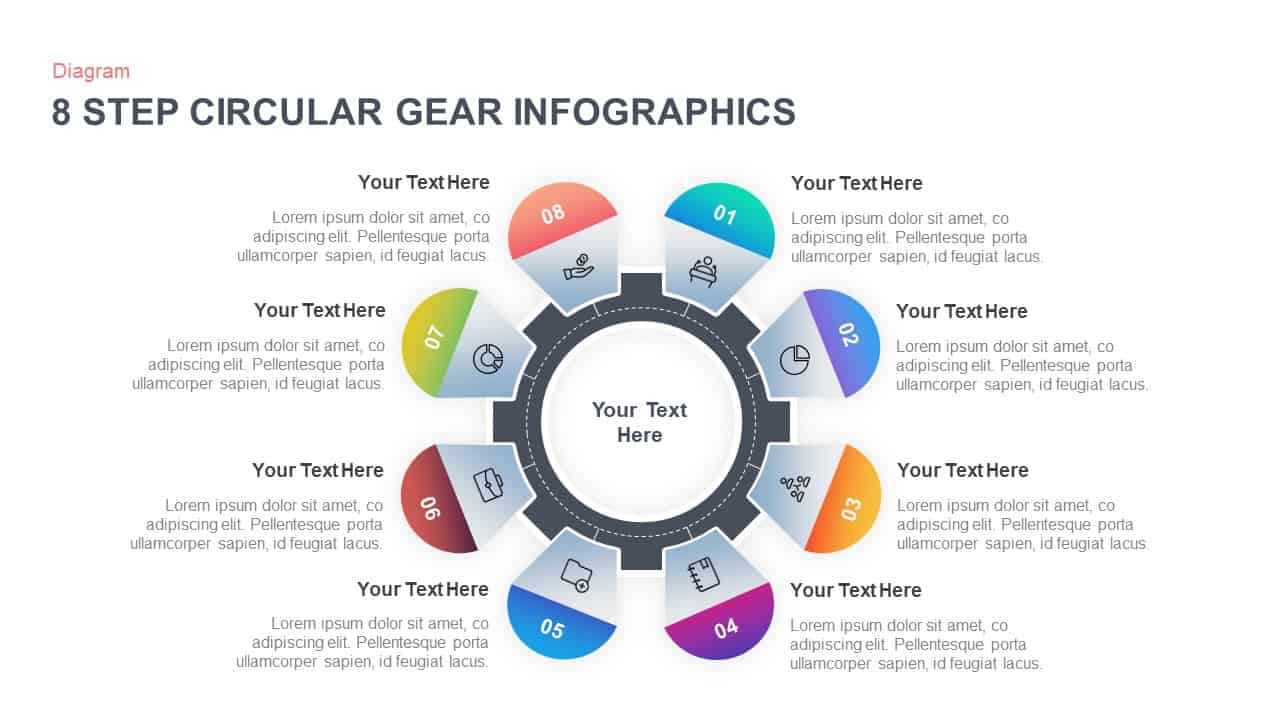
8-Step Circular Gear Infographic Diagram Template for PowerPoint & Google Slides
Circular
Modern Gear Venn Diagram Infographic Template for PowerPoint & Google Slides
Comparison
6-Part Circular Gear Infographic Diagram Template for PowerPoint & Google Slides
Process
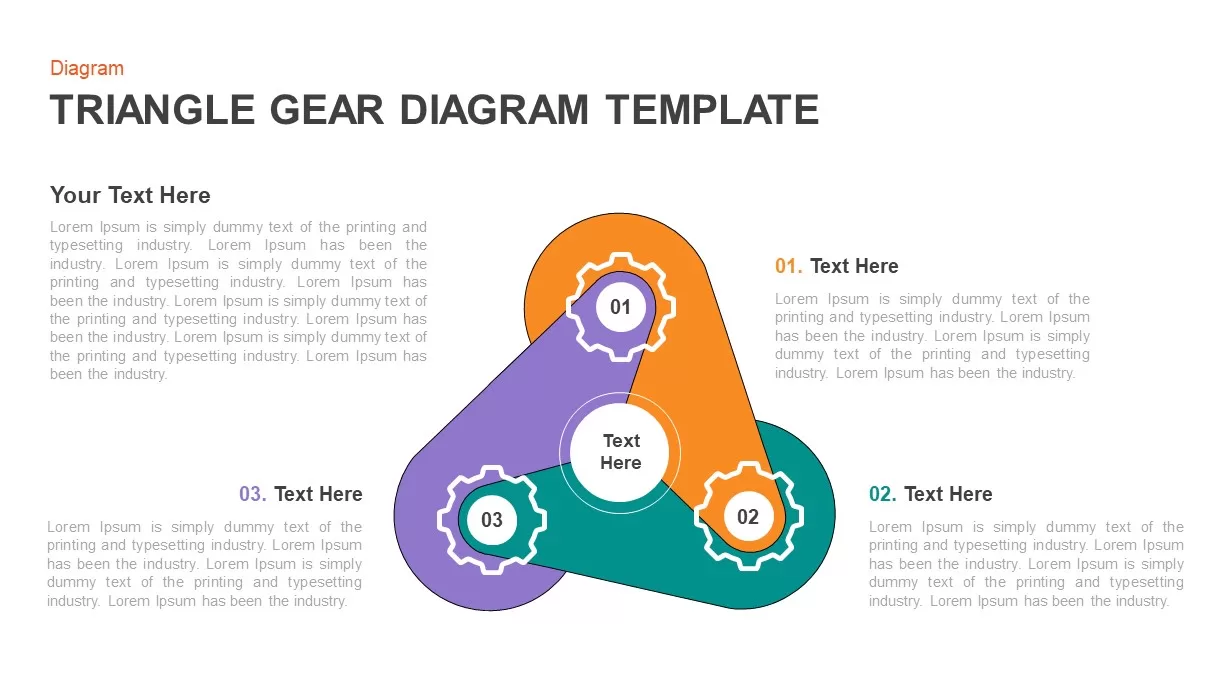
Three-Step Triangular Gear Diagram Template for PowerPoint & Google Slides
Process
Dynamic Gear Diagram Infographics Template for PowerPoint & Google Slides
Process
Gear Process Diagram Template for PowerPoint & Google Slides
Process
Gear Process Diagram Template for PowerPoint & Google Slides
Process
Cloud Gear Automation Diagram Template for PowerPoint & Google Slides
Cloud Computing
Gear Process Diagram for PowerPoint & Google Slides
Process
8-Step Circular Gear Infographics Diagram for PowerPoint & Google Slides
Process
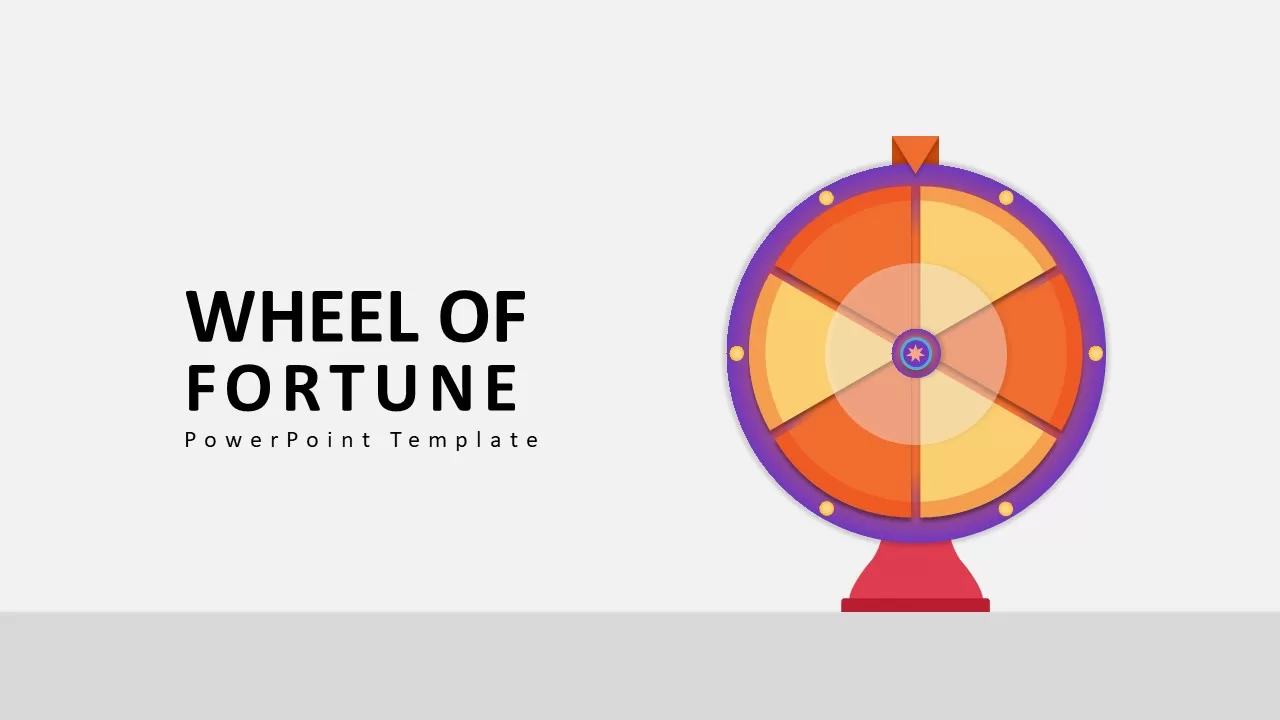
Wheel of Fortune PowerPoint Template for PowerPoint & Google Slides
Business Proposal
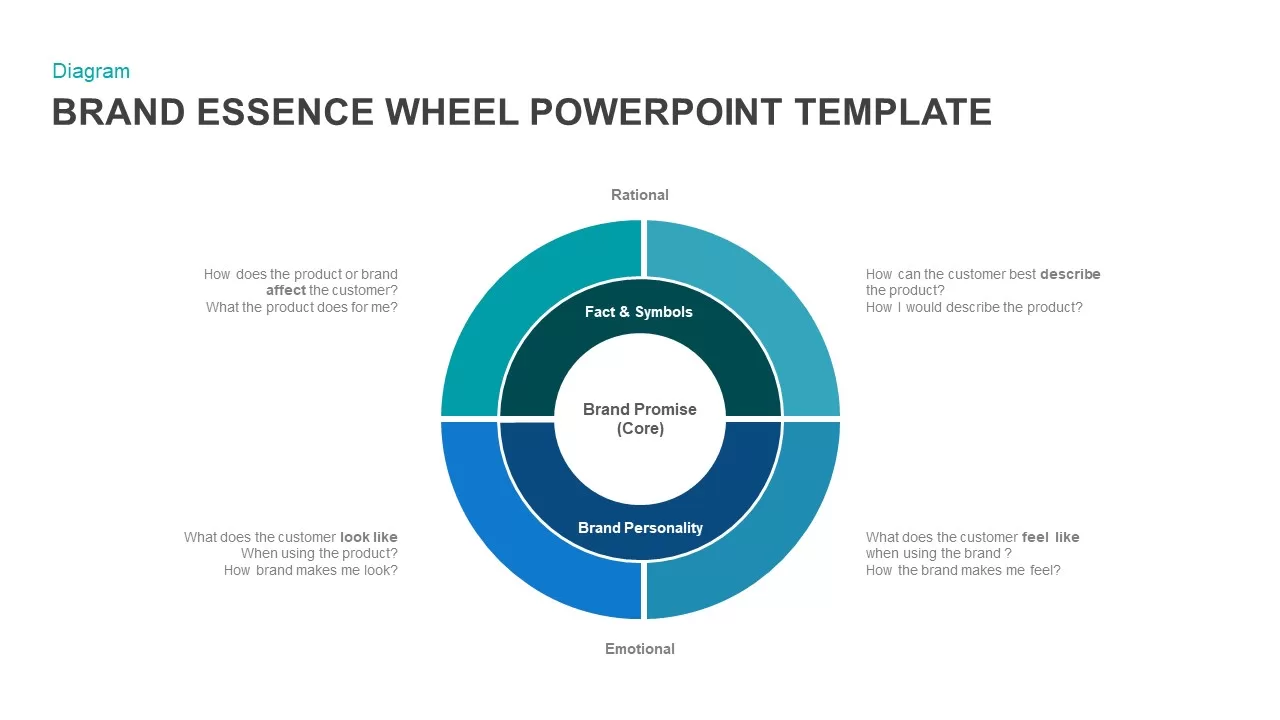
Brand Essence Wheel PowerPoint Template for PowerPoint & Google Slides
Marketing
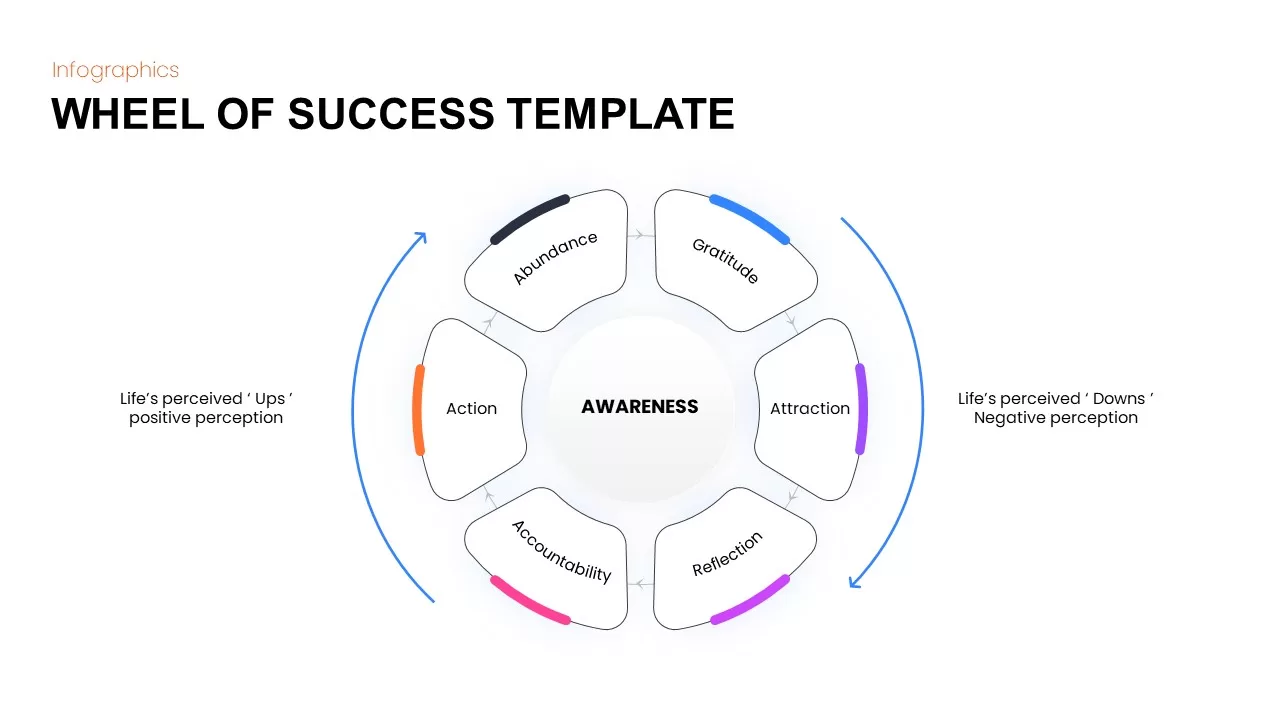
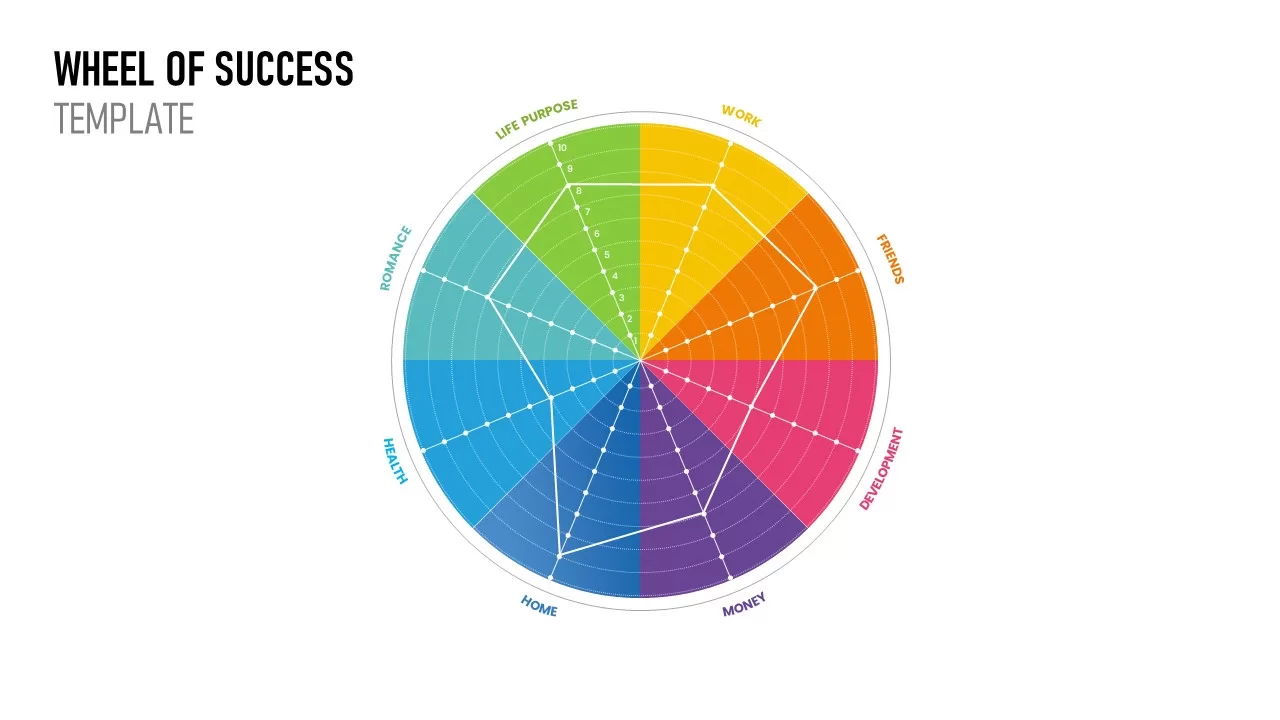
Wheel of Success Infographic template for PowerPoint & Google Slides
Circular
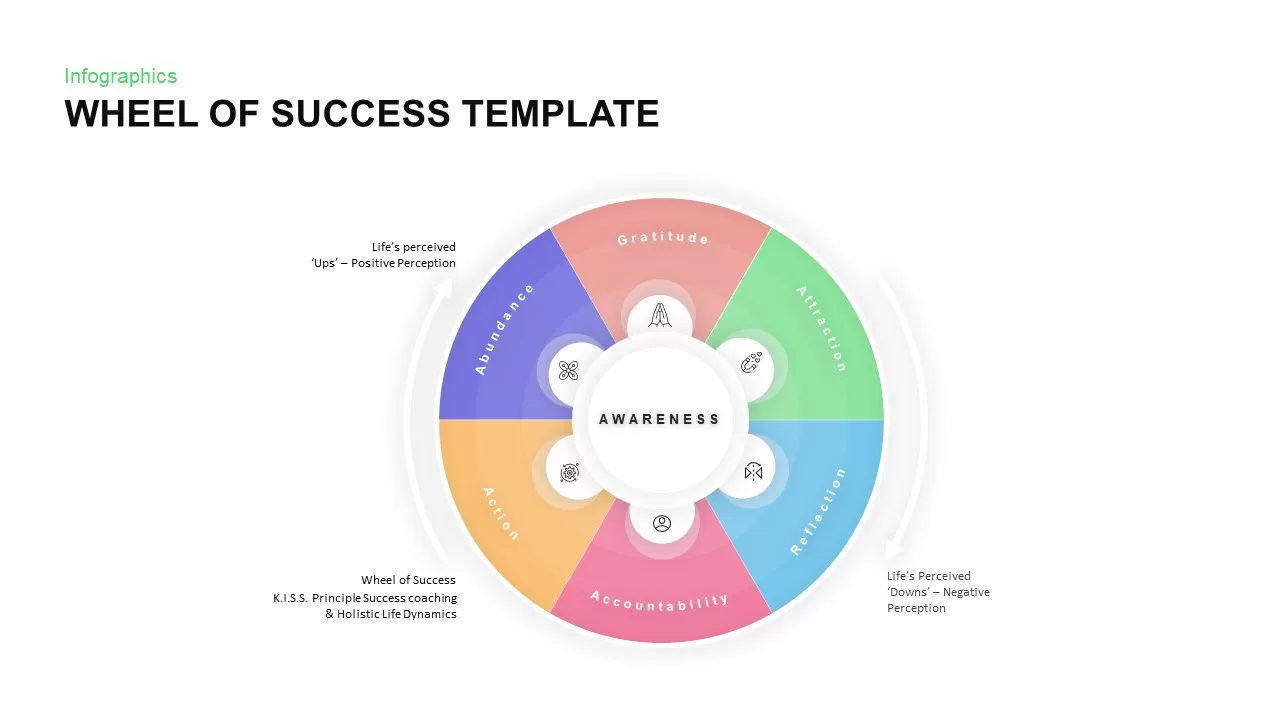
Wheel of Success Overview template for PowerPoint & Google Slides
Business Strategy
Wheel of Life template for PowerPoint & Google Slides
Business
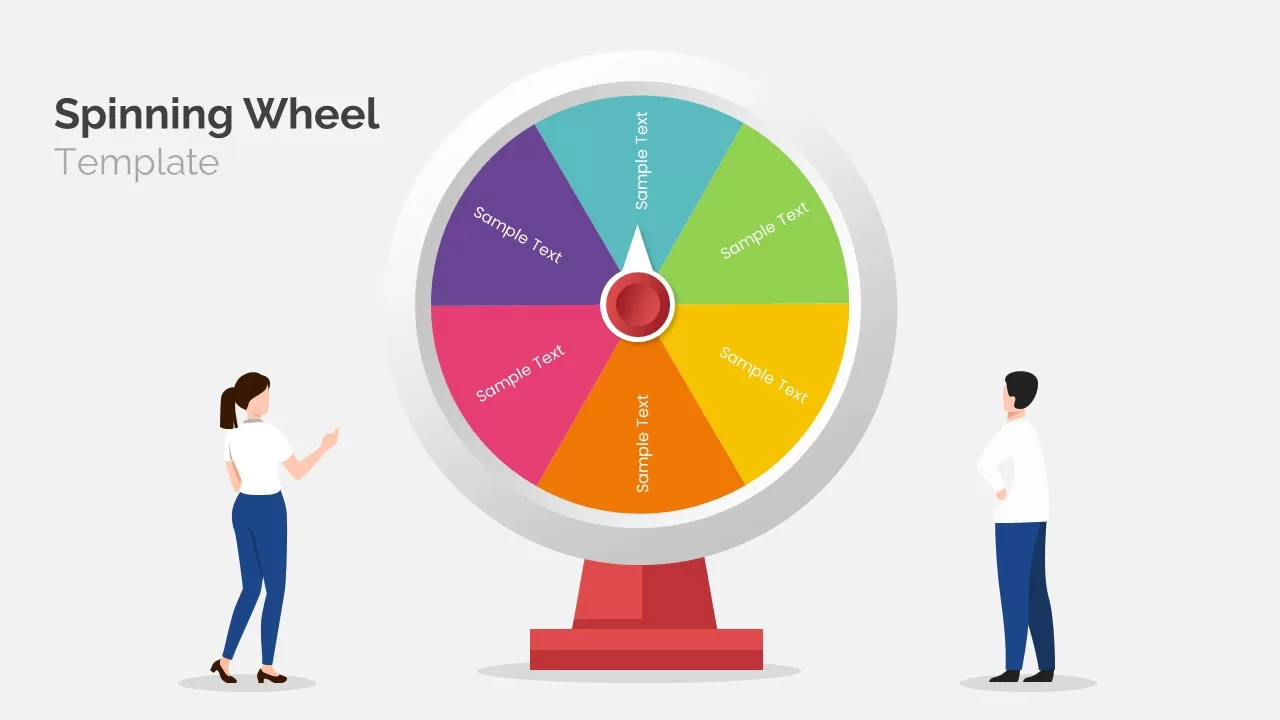
Animated Spinning Wheel Infographic Pack Template for PowerPoint & Google Slides
Circular
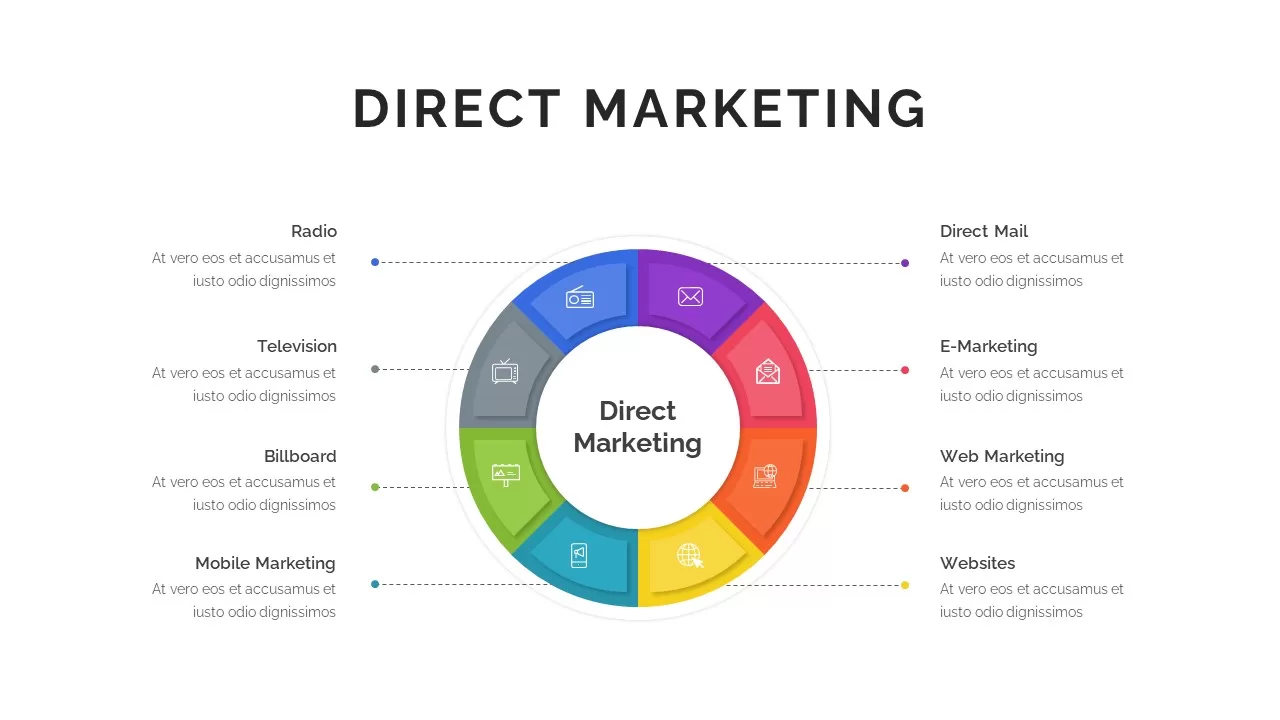
Eight-Segment Direct Marketing Wheel Template for PowerPoint & Google Slides
Circular
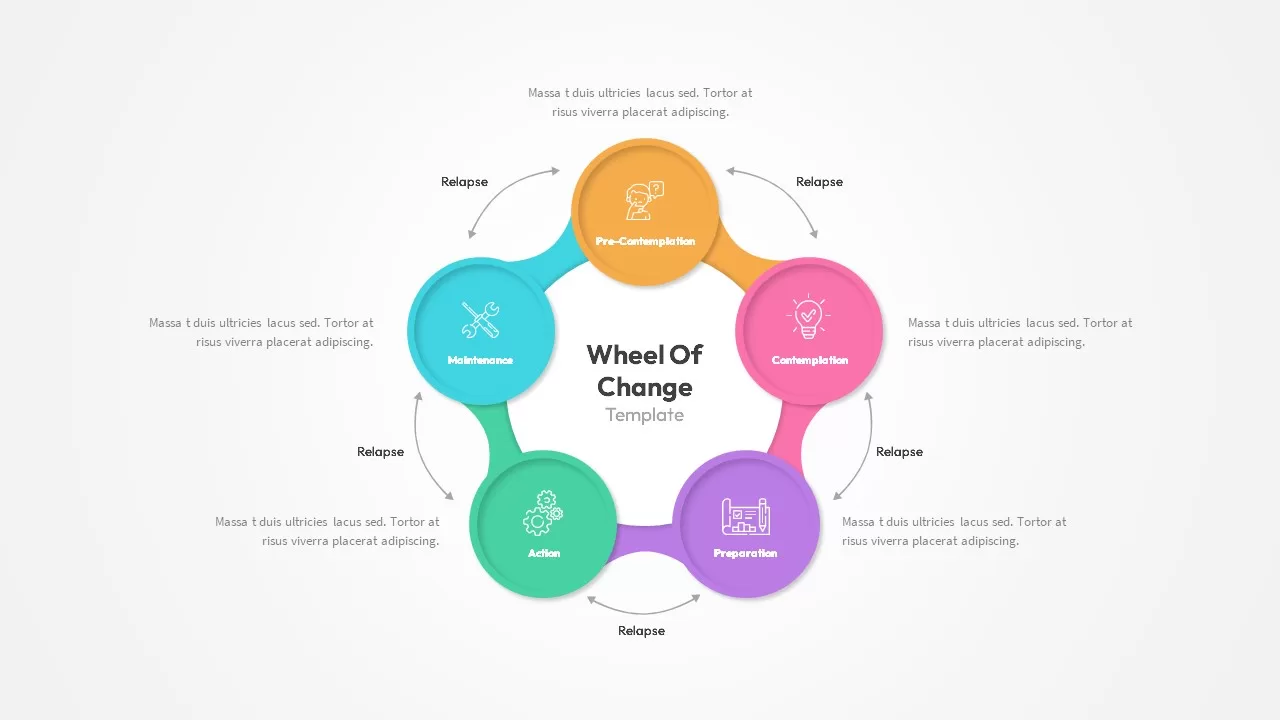
Wheel of Change Model template for PowerPoint & Google Slides
Business Strategy
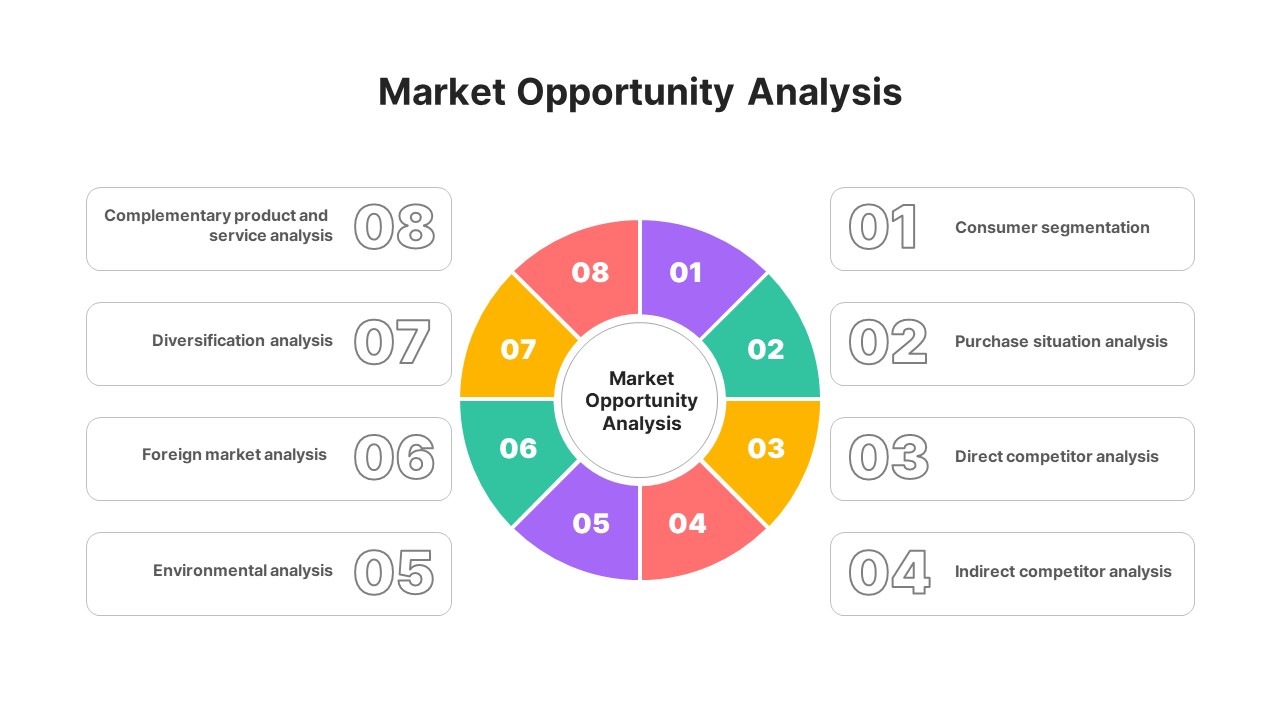
Market Opportunity Analysis Wheel template for PowerPoint & Google Slides
Business Strategy

Free Spin the Wheel Interactive Game Template for PowerPoint & Google Slides
Decks
Free
Colorful Four-Segment Wheel Chart Template for PowerPoint & Google Slides
Circular
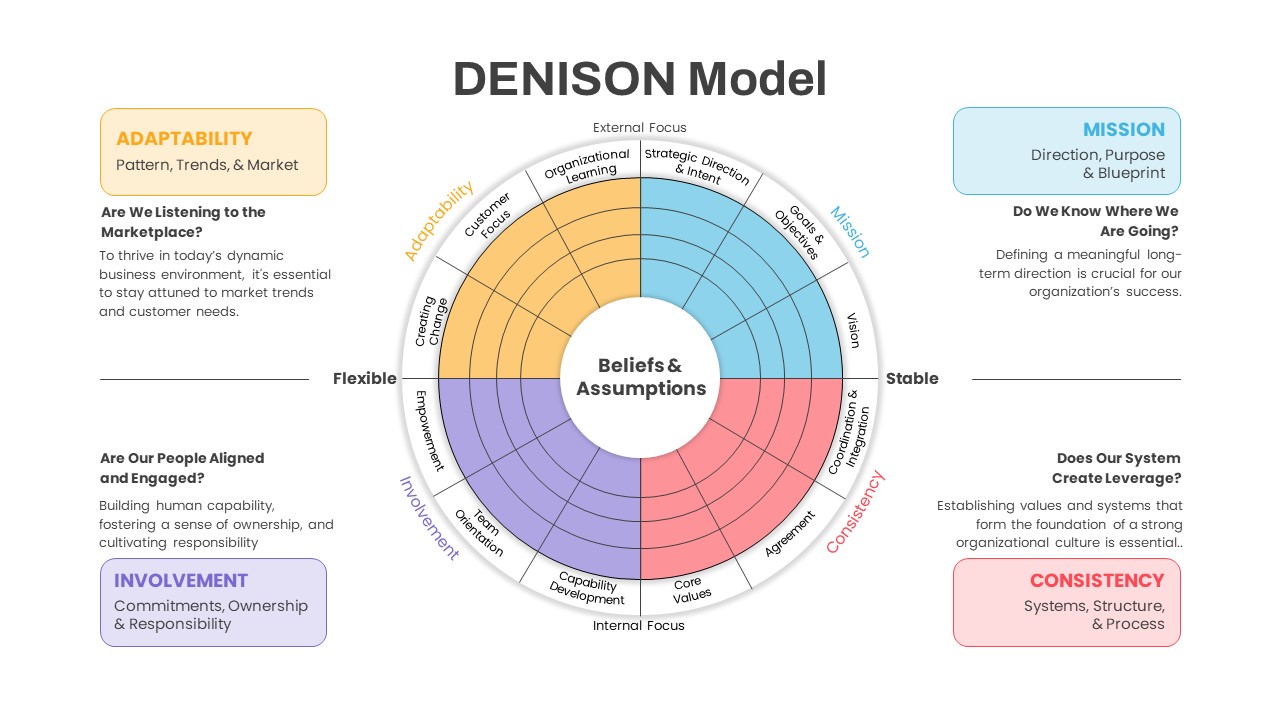
Denison Culture Model Wheel template for PowerPoint & Google Slides
Leadership
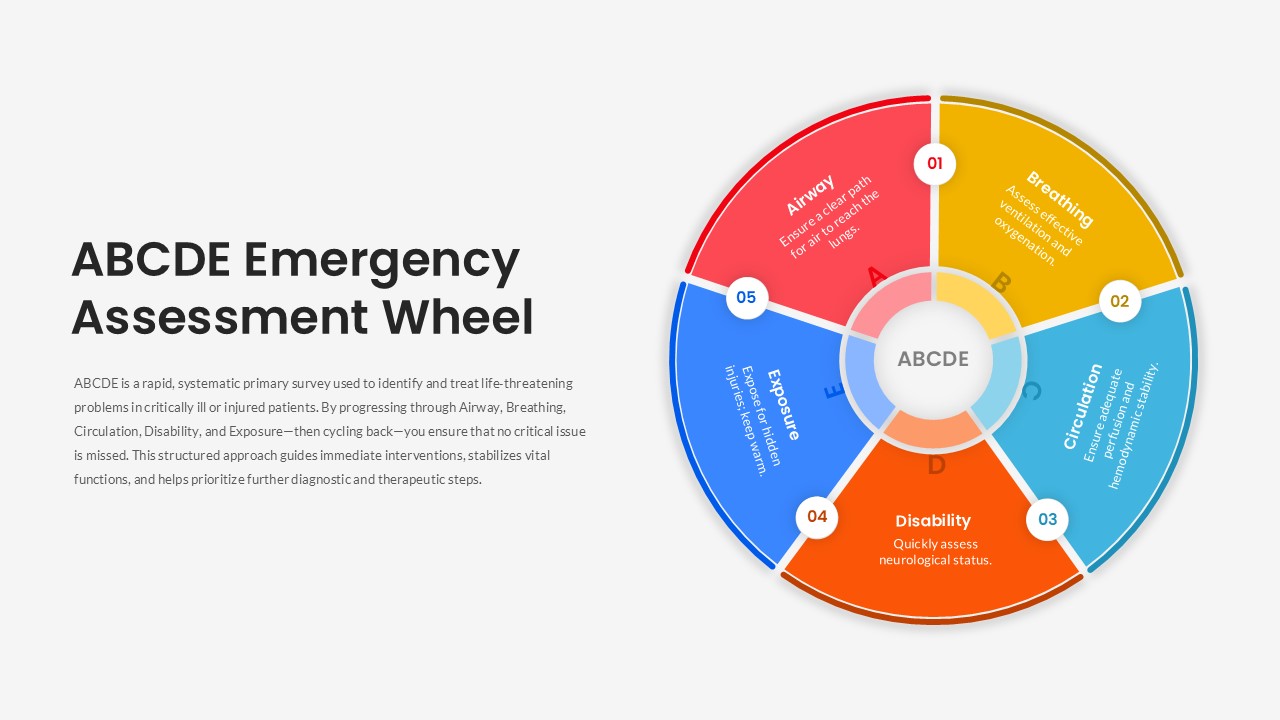
ABCDE Emergency Assessment Wheel Template for PowerPoint & Google Slides
Circular
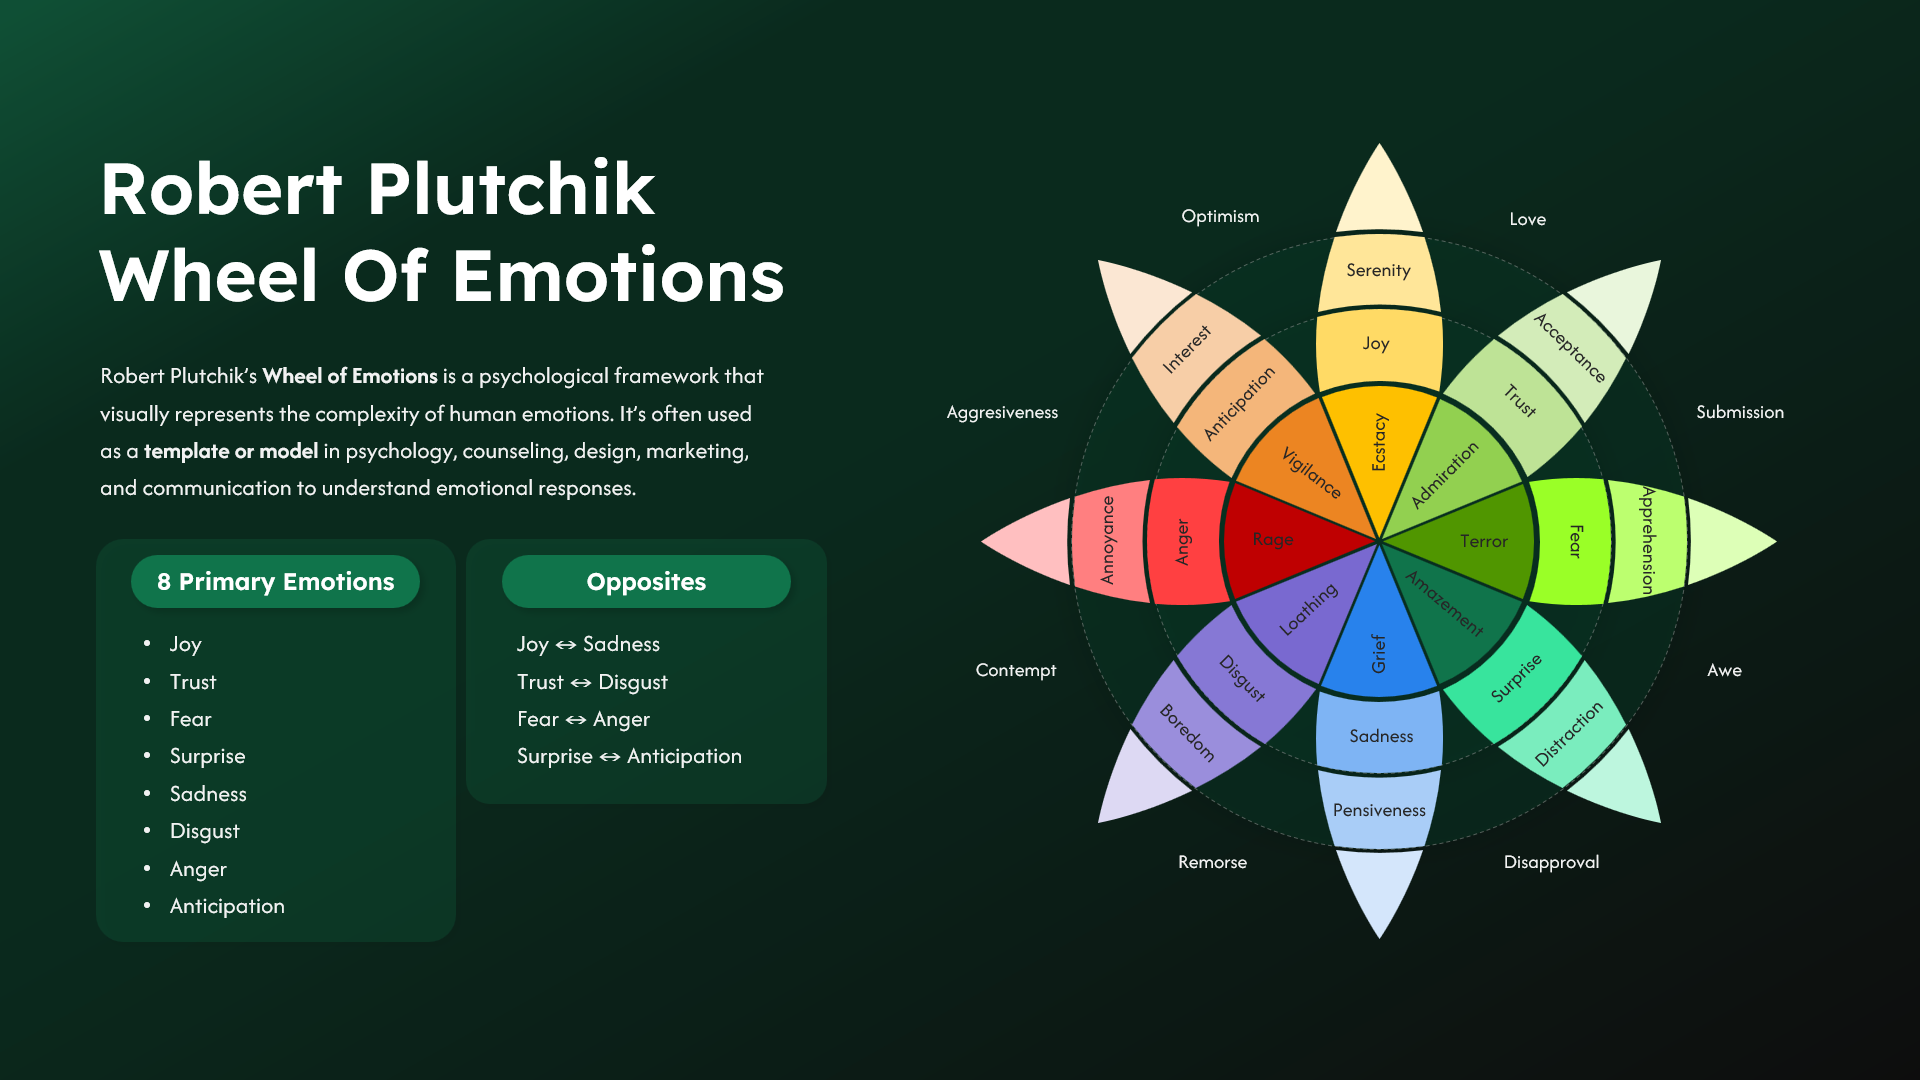
Robert Plutchik Wheel of Emotions Template for PowerPoint & Google Slides
Circular
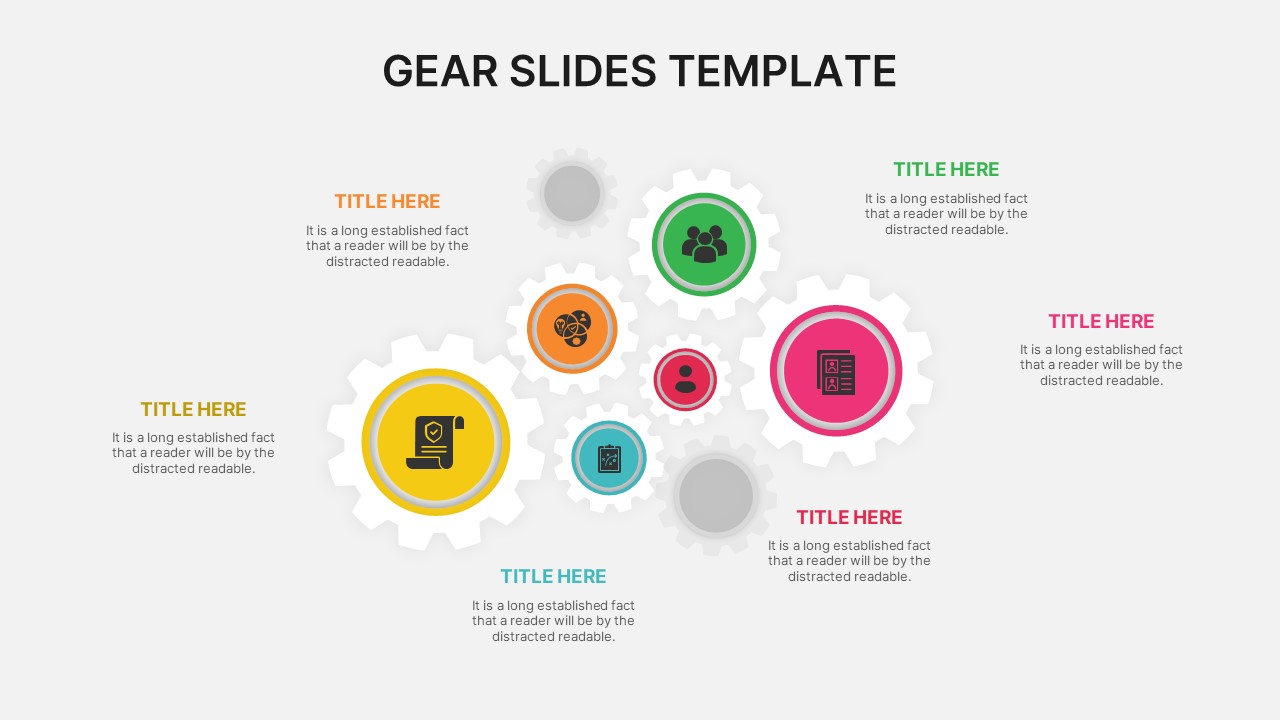
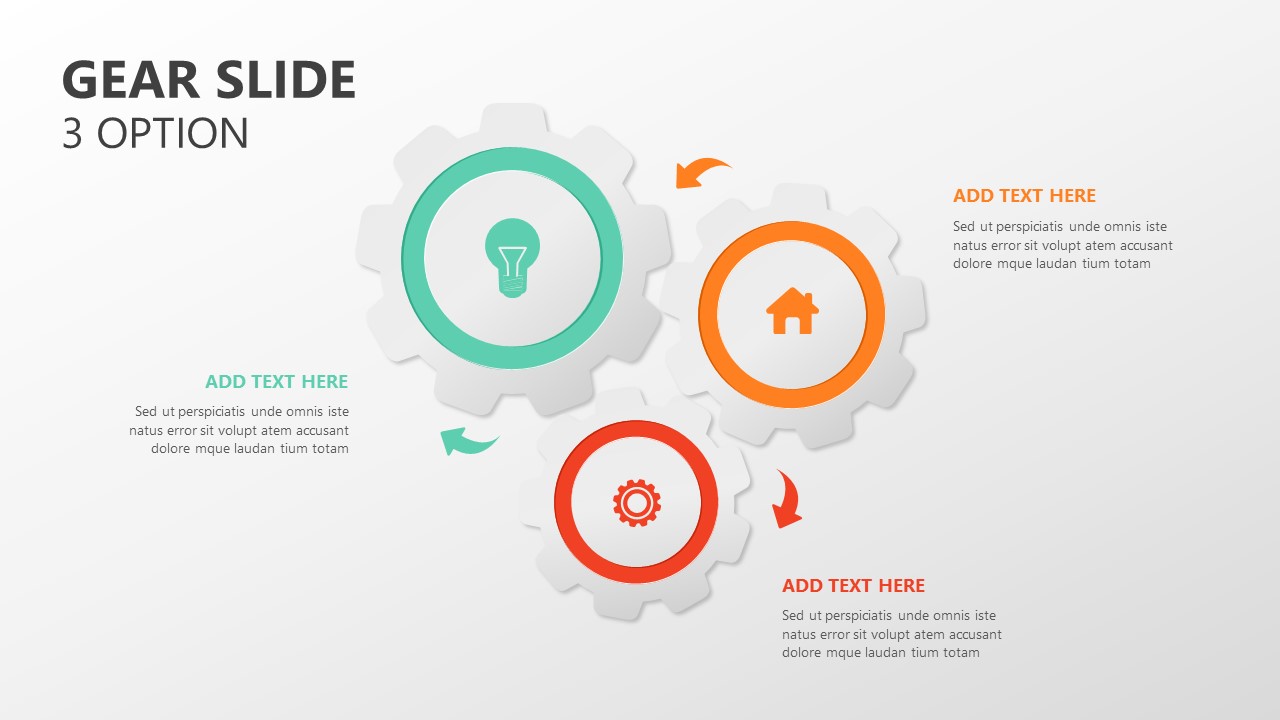
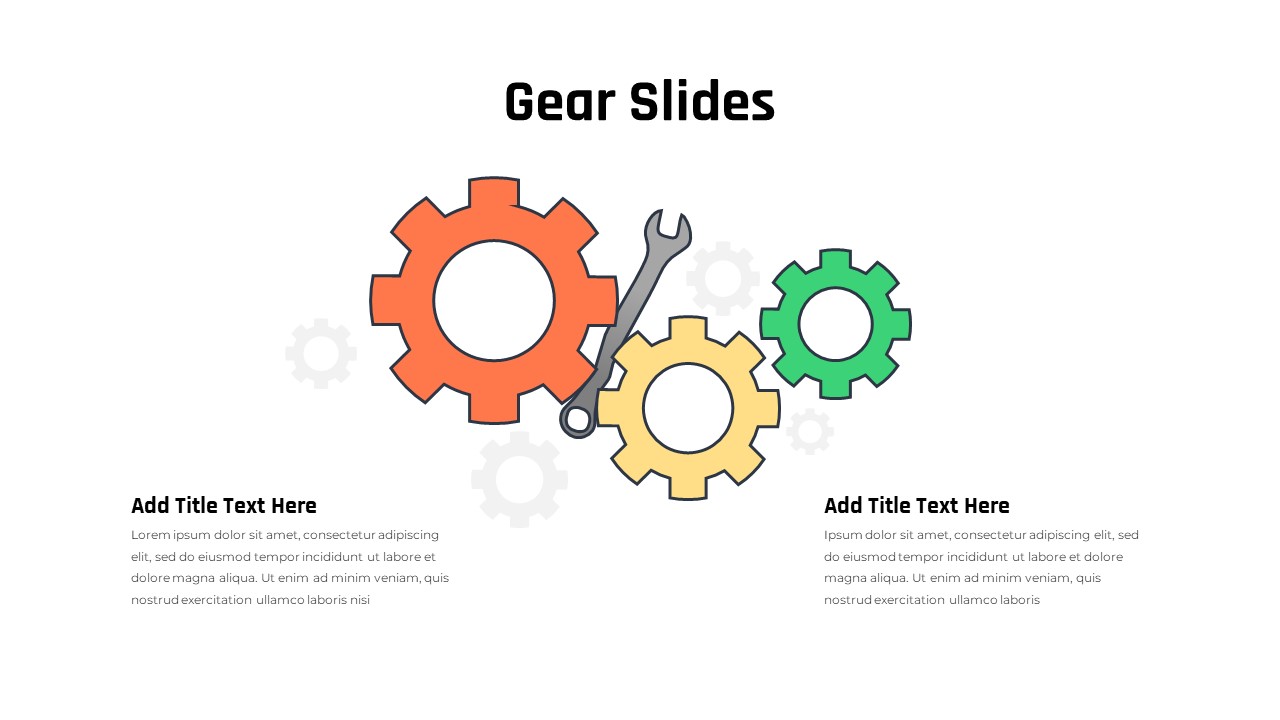
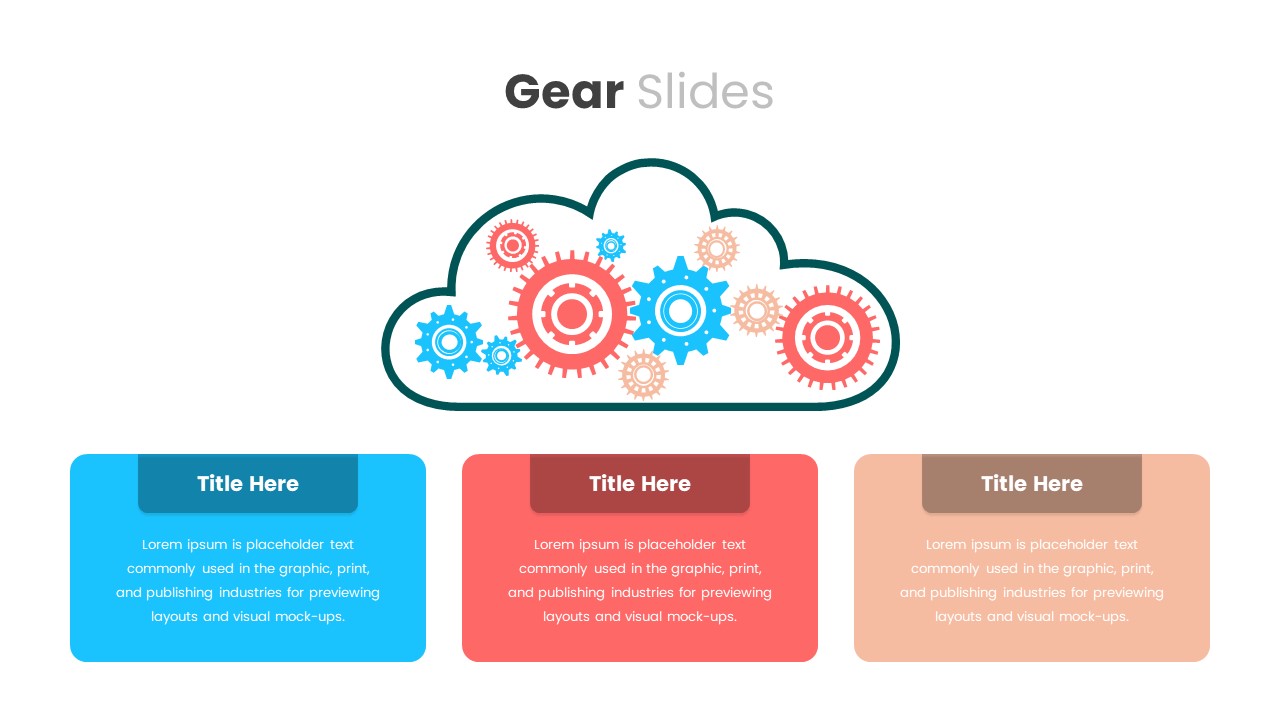
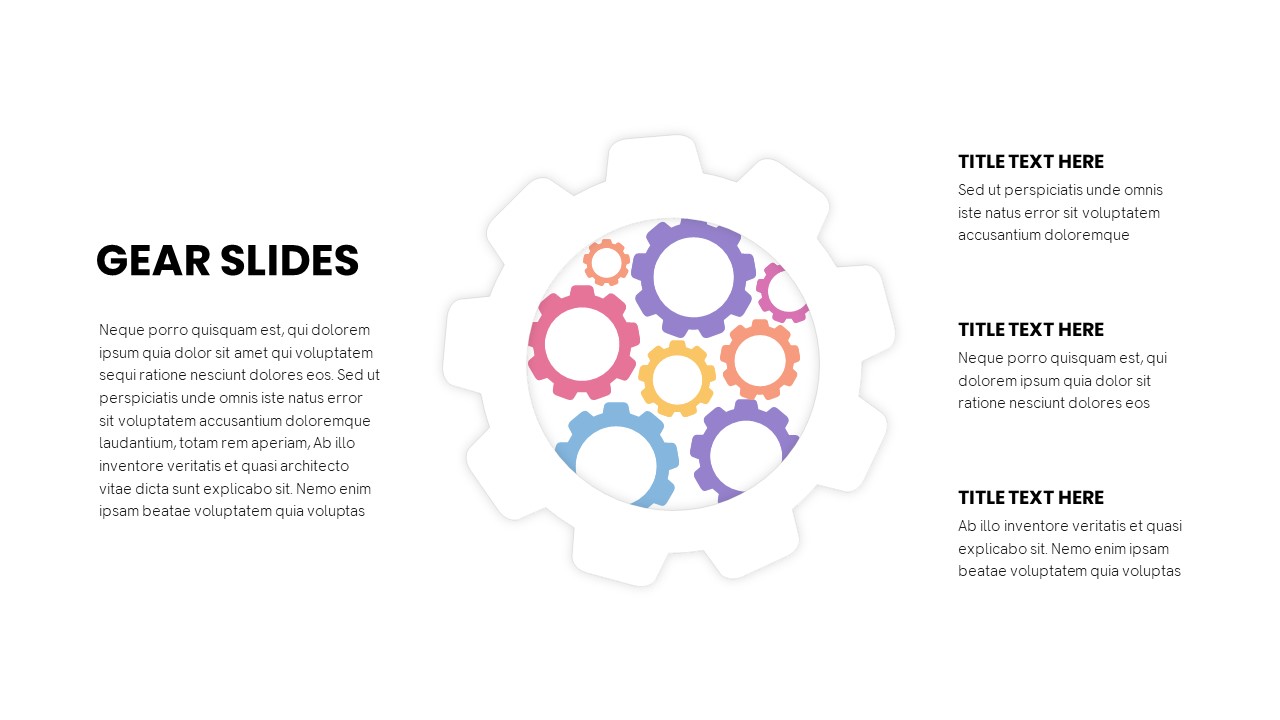
Gear Slides for PowerPoint & Google Slides
Infographics
Brain Gear Hub-and-Spoke Infographics template for PowerPoint & Google Slides
Org Chart
Support Services Gear Infographic Template for PowerPoint & Google Slides
Business
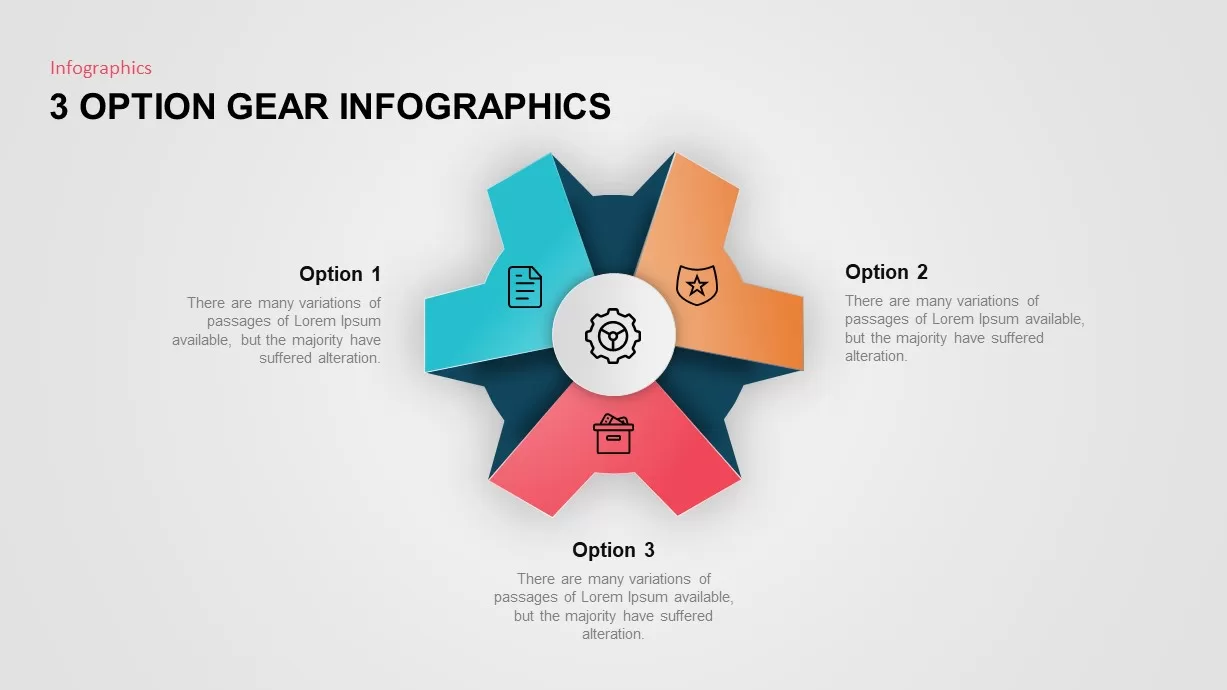
Three-Option Gear Infographic Pro Template for PowerPoint & Google Slides
Process
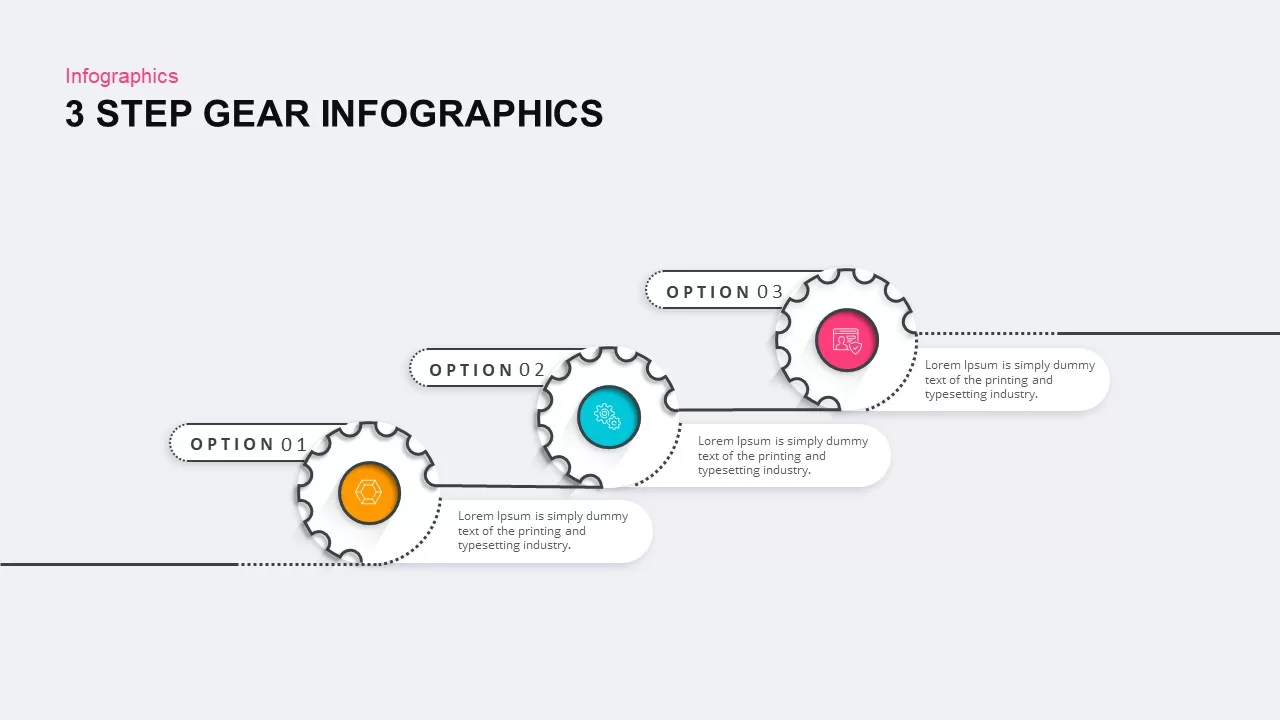
Three-Phase Planning Gear Infographic Template for PowerPoint & Google Slides
Process
3, 4, and 5 Step Gear Infographics Template for PowerPoint & Google Slides
Process
Animated Multi-Gear Cluster Infographic Template for PowerPoint & Google Slides
Process
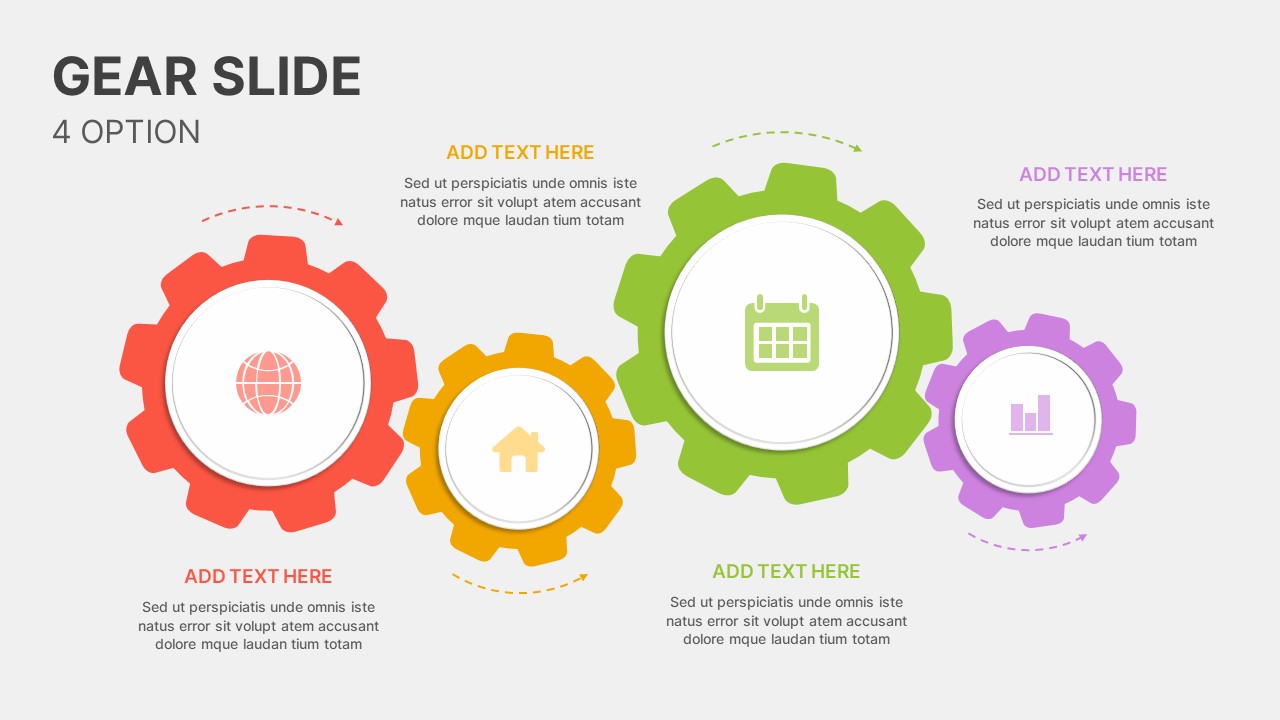
Dynamic Four-Step Gear Process Template for PowerPoint & Google Slides
Process