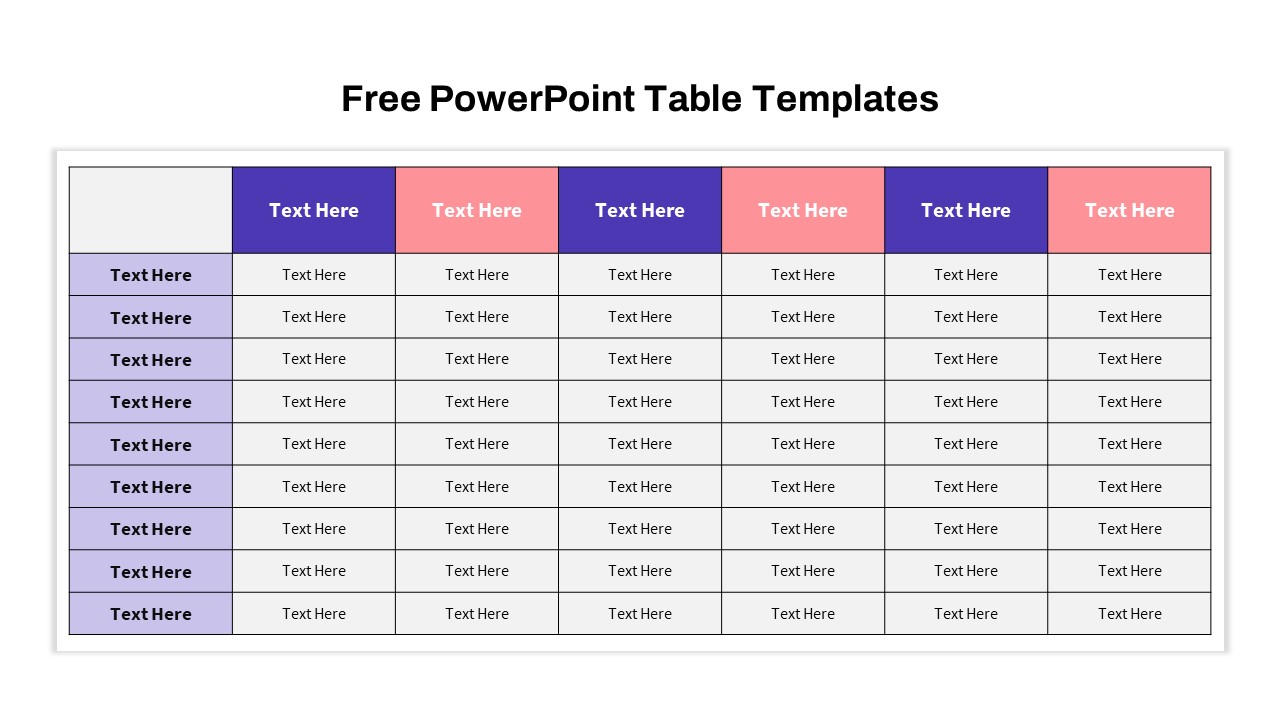
Dynamic Multicolor Comparison Table Template for PowerPoint & Google Slides

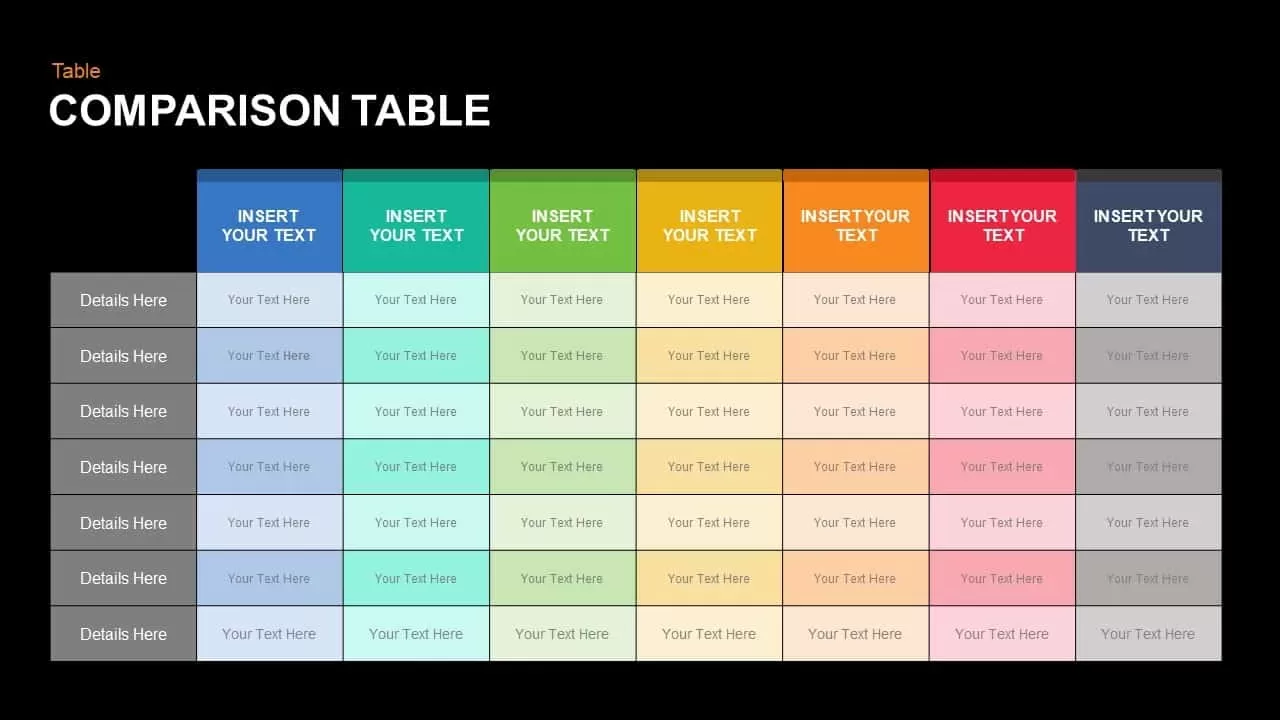

Leverage this vibrant multicolor comparison table slide to present side-by-side analysis of seven distinct options with exceptional clarity and visual appeal. The slide features a dedicated grey sidebar for row labels and seven bold header bars in rich blue, teal, lime green, mustard yellow, burnt orange, coral red, and slate navy—each matched to corresponding content cells for coordinated emphasis. Editable placeholders empower you to insert custom metrics, feature descriptions, pricing details, or performance indicators without disrupting the balanced grid layout. Its clean flat design, ample white space, and consistent typography facilitate quick scanning and ensure audience attention is guided precisely to critical data points.
Engineered for effortless customization, this asset leverages master slides and intuitive placeholders so you can adjust header hues, resize cells, or add additional rows in seconds. The uniform cell styling and subtle shading variations help differentiate categories while maintaining a cohesive aesthetic. Whether you’re conducting product comparisons, service tier breakdowns, or feature analyses, this template offers the structure to tell a clear comparative story. Simply update text, swap colors, or reorder columns to tailor the slide to your brand guidelines and messaging objectives.
Optimized for both PowerPoint and Google Slides, this comparison table maintains pixel-perfect rendering across devices and streamlines collaborative editing. Its fully editable design eliminates formatting headaches and speeds up deck creation, making it ideal for executive briefings, sales presentations, vendor evaluations, or internal workshops. Integrate this slide into your pitch decks and reports to drive data-driven discussions, support decision-making processes, and highlight key differences with confidence and impact.
Who is it for
Business analysts, product managers, and marketing teams will benefit from this comparison table when evaluating features, pricing tiers, or vendor proposals. Sales professionals and executive leadership can leverage it to highlight differences and drive strategic decisions. Educators and consultants can use the structured grid to compare frameworks or methodologies in training sessions and workshops.
Other Uses
Beyond standard feature comparisons, repurpose this slide for pricing matrix breakdowns, project status grids, competitive benchmarking, decision-making scorecards, resource allocation charts, or risk assessment tables. It can also serve as a product lineup showcase, service tier mapping, capability audit sheet, or training comparison table. Simply duplicate rows or columns to adapt for academic modules, departmental scorecards, or event planning matrices.
Login to download this file

Item ID
SB00826
Related Templates

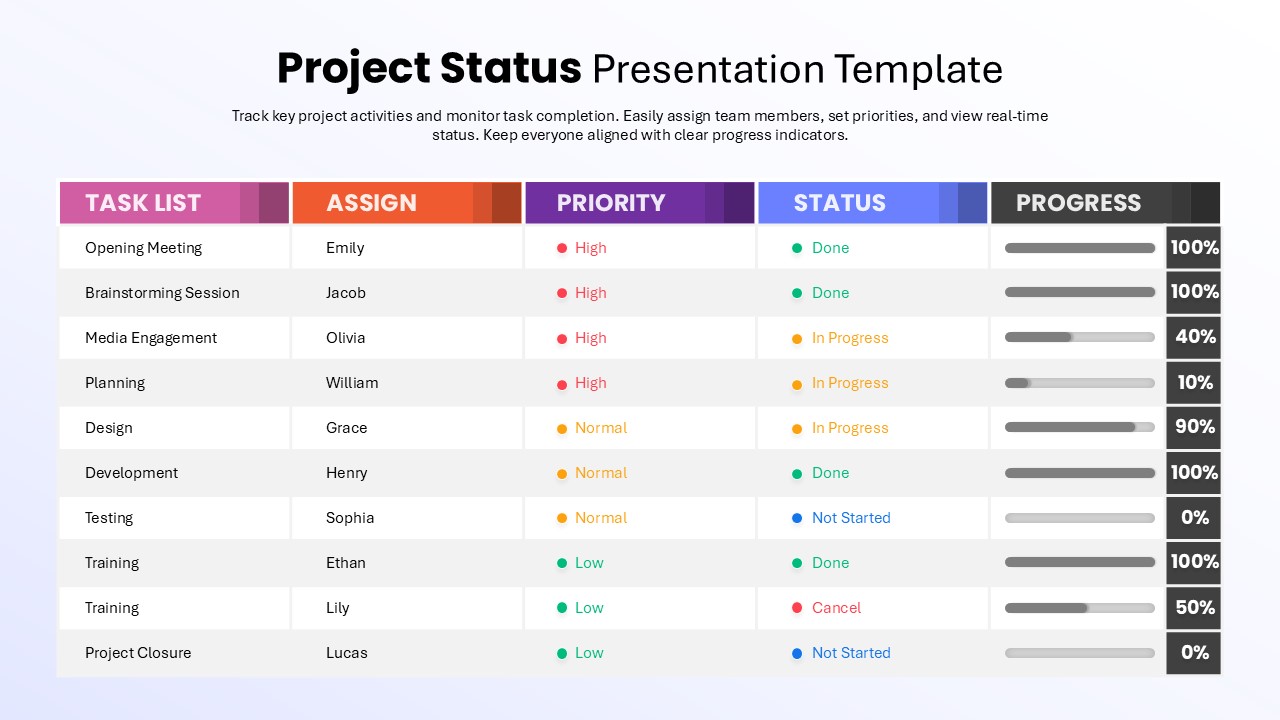
Dynamic Project Status Tracking Table Template for PowerPoint & Google Slides
Project Status
Dynamic Benchmarking Comparison Chart Template for PowerPoint & Google Slides
Comparison Chart
Dynamic Bar-of-Pie Chart Comparison Template for PowerPoint & Google Slides
Pie/Donut
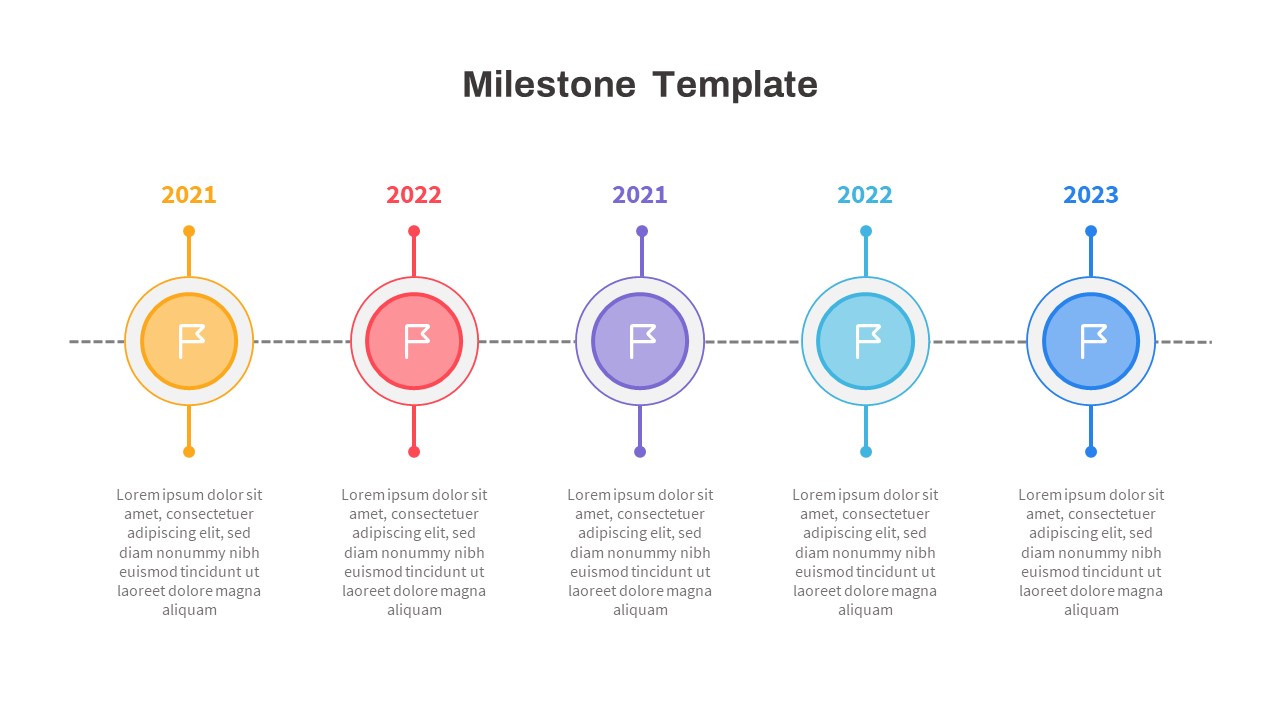
Free Multicolor Five-Stage Milestone Timeline Template for PowerPoint & Google Slides
Timeline
Free
Multicolor Animated Fireworks Slide Template for PowerPoint & Google Slides
Graphics
Free
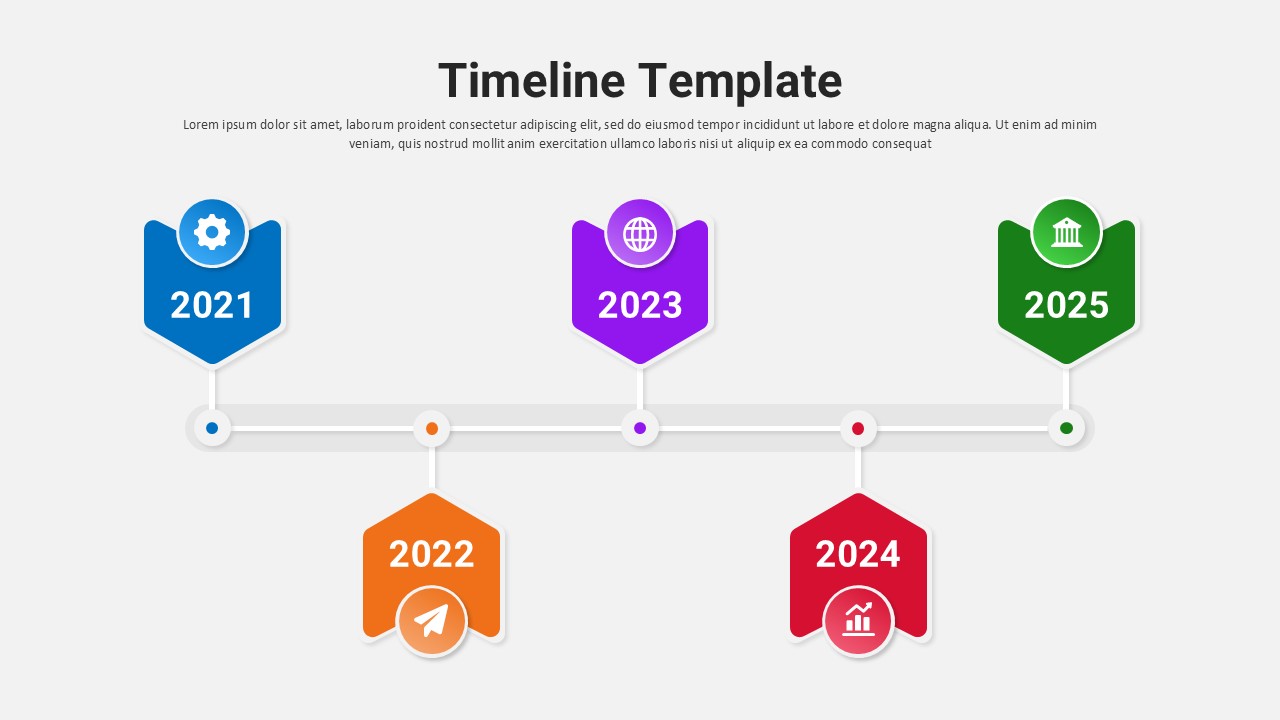
Multicolor Alternating Timeline Roadmap Template for PowerPoint & Google Slides
Timeline
Creative Dynamic Gantt Chart Timeline Template for PowerPoint & Google Slides
Timeline
Dynamic Creative Head Infographics Template for PowerPoint & Google Slides
Circular
Dynamic Shield Process Flow Diagram template for PowerPoint & Google Slides
Process

Dynamic Circle Timeline Infographics template for PowerPoint & Google Slides
Timeline
Dynamic Key Points Diagram Template for PowerPoint & Google Slides
Process

Dynamic Data Dashboard Infographic Template for PowerPoint & Google Slides
Bar/Column
Dynamic Arrow Process Template for PowerPoint & Google Slides
Process

Dynamic 4 Gear Process Diagram Template for PowerPoint & Google Slides
Process
Dynamic Five-Step Ribbon Agenda Layout Template for PowerPoint & Google Slides
Agenda
Dynamic Winding Road Process Timeline Template for PowerPoint & Google Slides
Process
Dynamic Winding Roadmap Infographic Template for PowerPoint & Google Slides
Roadmap
Dynamic AI Applications Infographic Template for PowerPoint & Google Slides
AI
Dynamic Growth Arrow Step Infographic Template for PowerPoint & Google Slides
Process
Dynamic Online Education Illustration Template for PowerPoint & Google Slides
Business Proposal
Capital Structure Dynamic Split Chart Template for PowerPoint & Google Slides
Comparison Chart

Dynamic Marketing Radar Chart Analytics Template for PowerPoint & Google Slides
Comparison
Dynamic Gear Diagram Infographics Template for PowerPoint & Google Slides
Process
Modern & Dynamic 6-Step Agenda Sequence Template for PowerPoint & Google Slides
Agenda
Dynamic Curved Arrow Process Roadmap Template for PowerPoint & Google Slides
Process
Dynamic Conveyor Belt Process Flow Template for PowerPoint & Google Slides
Process
Dynamic Statistics & Progress Charts Template for PowerPoint & Google Slides
Pie/Donut
Dynamic Hub-and-Spoke Infographic Diagram Template for PowerPoint & Google Slides
Circular
Dynamic Circular Hub-and-Spoke Infographic Template for PowerPoint & Google Slides
Circular
Dynamic 3D Rubik’s Cube Diagram Pack Template for PowerPoint & Google Slides
Infographics
Dynamic Four-Step Gear Process Template for PowerPoint & Google Slides
Process
Dynamic Basketball Training Promotion Template for PowerPoint & Google Slides
Advertising
Dynamic Hurdle Race Presentation Template for PowerPoint & Google Slides
Advertising
Dynamic Sprint Race Cover Slide Template for PowerPoint & Google Slides
Graphics
Dynamic Soccer Stadium Presentation Template for PowerPoint & Google Slides
Graphics
Dynamic Cycling Presentation Template for PowerPoint & Google Slides
Graphics
Dynamic Boxing Training Cover Slide Template for PowerPoint & Google Slides
Graphics
Dynamic Relay Race Presentation Slide Template for PowerPoint & Google Slides
Graphics
Dynamic Chevron Timeline Infographic Template for PowerPoint & Google Slides
Timeline
Dynamic Animated Question Mark Template for PowerPoint & Google Slides
Graphics
Dynamic Three-Series Stacked Area Chart Template for PowerPoint & Google Slides
Comparison Chart
Dynamic Sunburst Chart Visualization Template for PowerPoint & Google Slides
Charts
Dynamic Abstract Corporate Theme Template for PowerPoint & Google Slides
Decks
Dynamic Investment & Finance Growth Template for PowerPoint & Google Slides
Finance
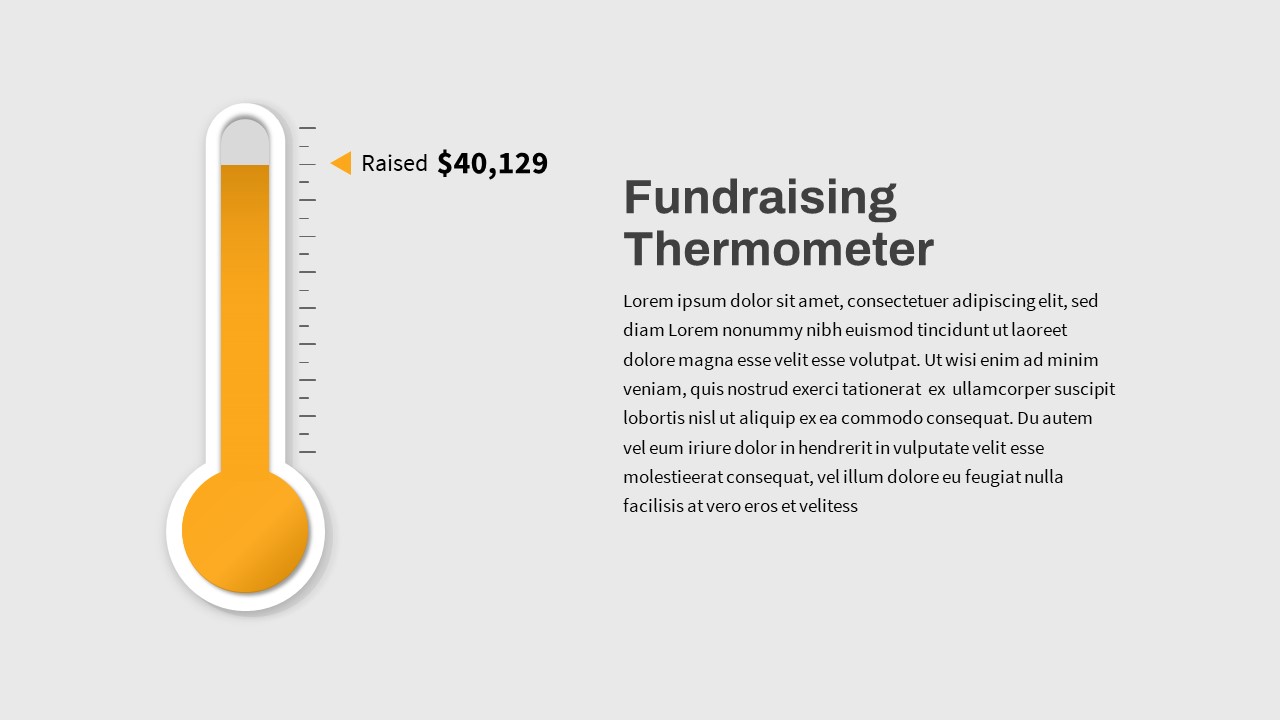
Dynamic Fundraising Thermometer Slide Template for PowerPoint & Google Slides
Revenue

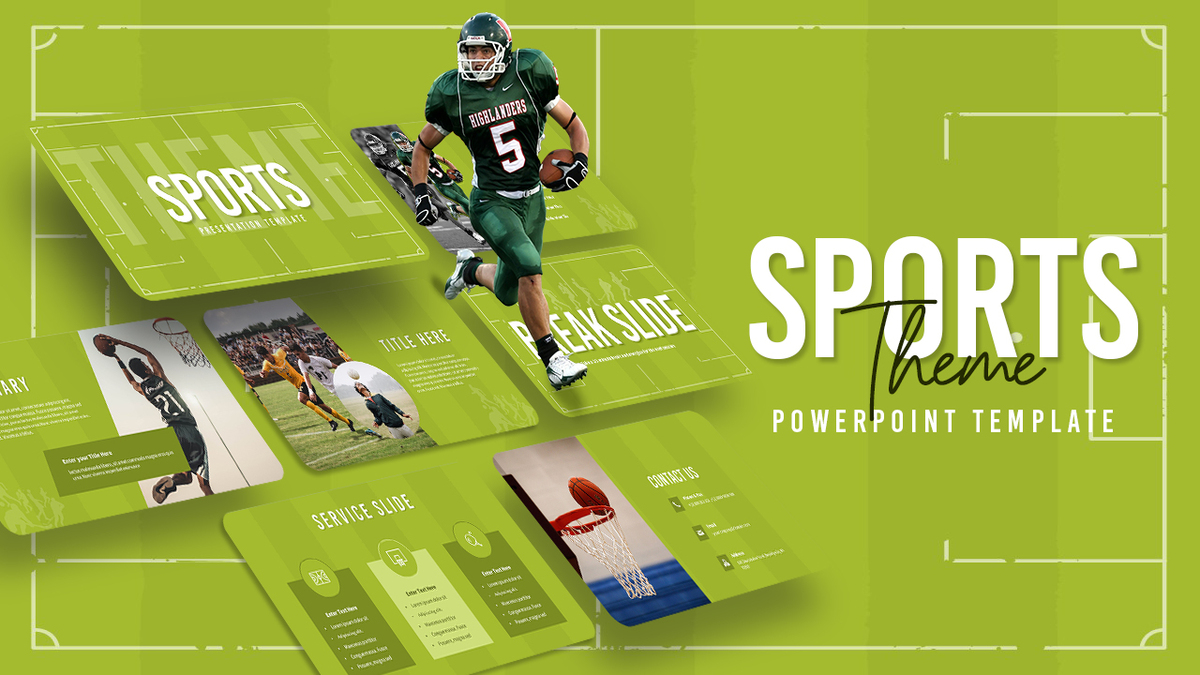
Dynamic Green Field Sports Presentation Template for PowerPoint & Google Slides
Decks
Dynamic Financial Analysis Line Chart Template for PowerPoint & Google Slides
Finance
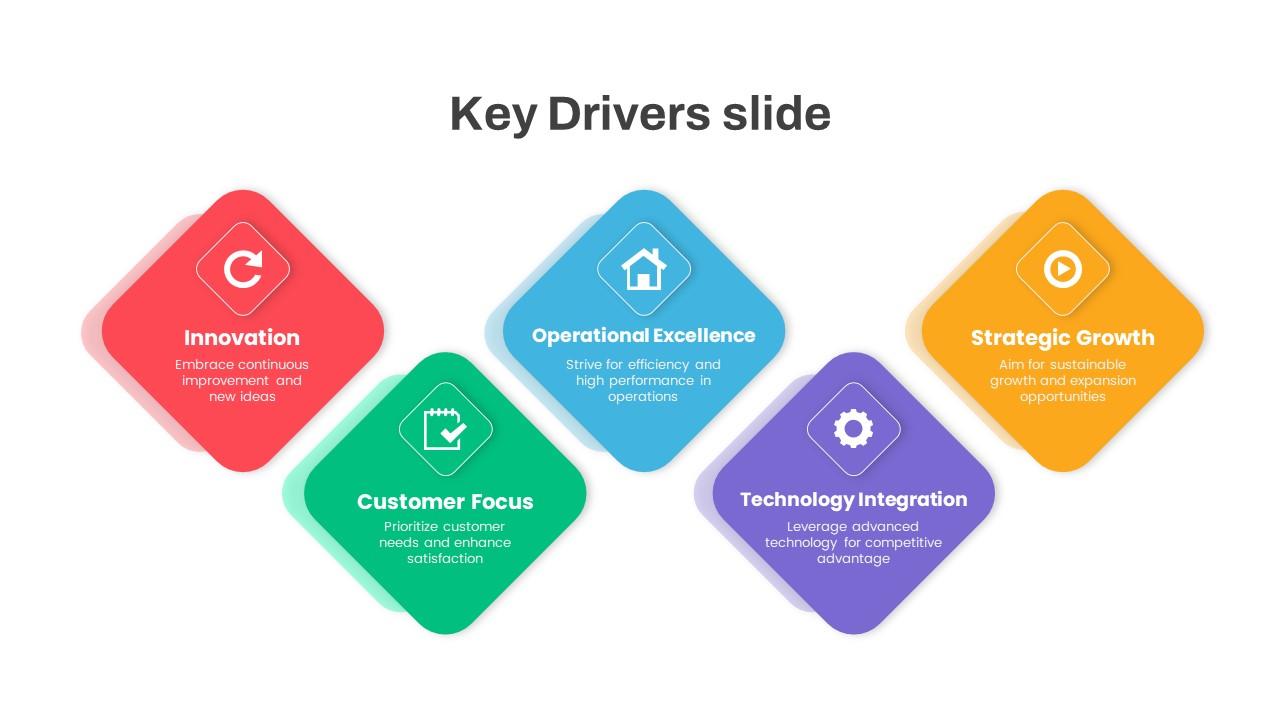
Dynamic Business Key Drivers Slide Template for PowerPoint & Google Slides
Process

Free Dynamic Global Warming Presentation Template for PowerPoint & Google Slides
Pitch Deck
Free
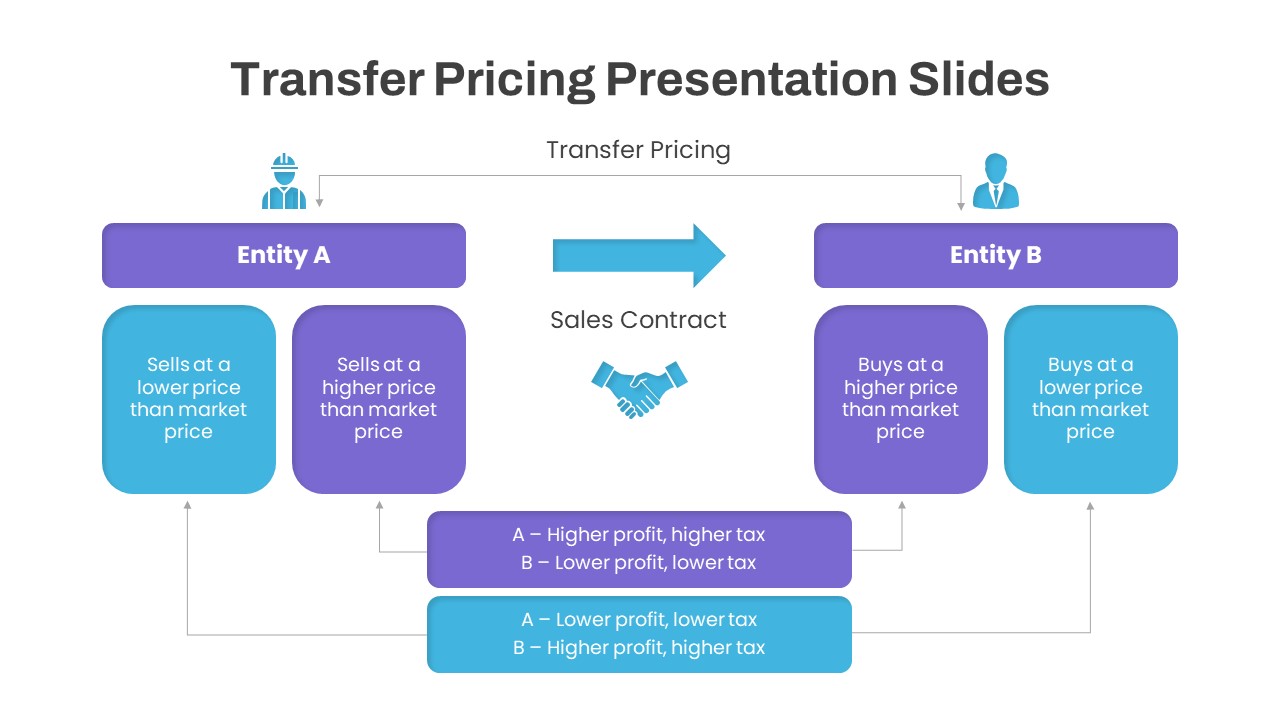
Dynamic Transfer Pricing Flow Diagram Template for PowerPoint & Google Slides
Finance
Dynamic Carousel Icon Hub Diagram Template for PowerPoint & Google Slides
Circular
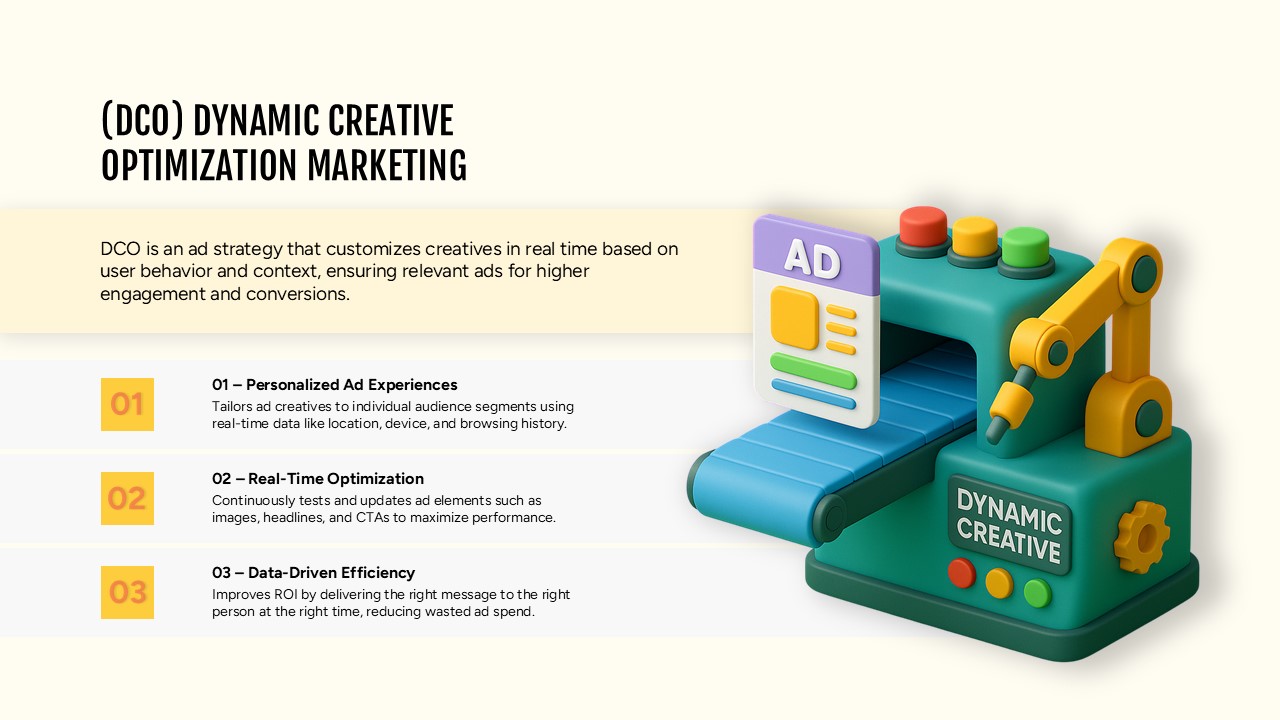
Dynamic Creative Optimization Marketing Template for PowerPoint & Google Slides
Digital Marketing
Dynamic Tennis Sports Theme Slide for PowerPoint & Google Slides
Graphics
Simple Comparison Table Template for PowerPoint & Google Slides
Comparison
Four-Tier Pricing Comparison Table Template for PowerPoint & Google Slides
Comparison
Four-Plan Pricing Table Comparison Template for PowerPoint & Google Slides
Comparison

Comparison Pricing Table Infographic Template for PowerPoint & Google Slides
Comparison Chart
Five-Option Text Boxes Table Comparison Template for PowerPoint & Google Slides
Business Report
Two-Option Bar Chart Comparison Table Template for PowerPoint & Google Slides
Comparison
Product Feature Comparison Table Template for PowerPoint & Google Slides
Comparison Chart
Sales Growth Comparison Chart & Table Template for PowerPoint & Google Slides
Bar/Column
Comparison Table Presentation Template for PowerPoint & Google Slides
Table
Colorful Comparison Table Presentation Template for PowerPoint & Google Slides
Table
Colorful Business Data Comparison Table Template for PowerPoint & Google Slides
Table
Five Column Comparison Table Layout Template for PowerPoint & Google Slides
Comparison
Pros and Cons Comparison Table Template for PowerPoint & Google Slides
Comparison Chart
Service Zoom Feature Slides Comparison template for PowerPoint & Google Slides
Process
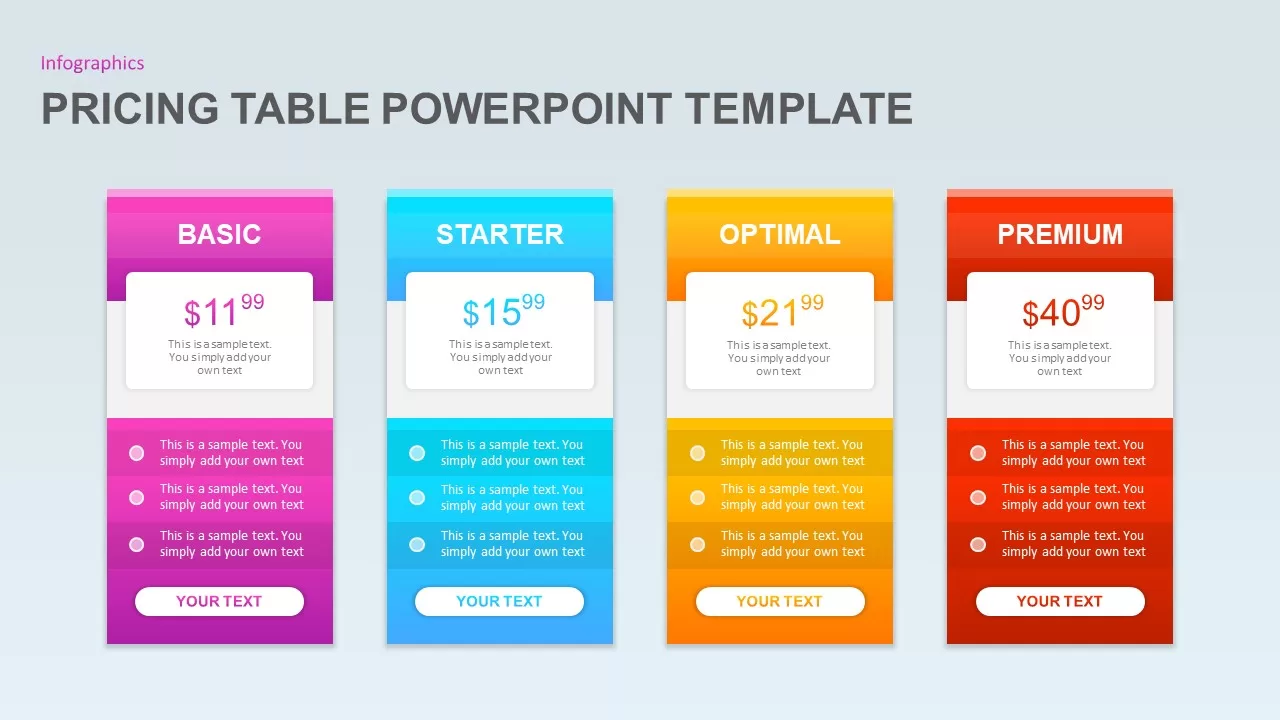
Pricing Table PowerPoint Template for PowerPoint & Google Slides
Infographics
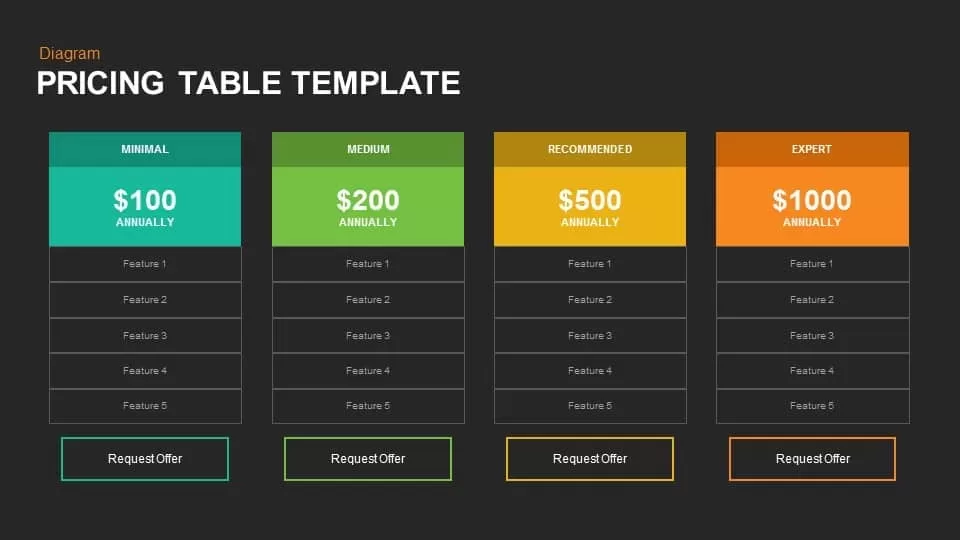
Pricing Table Template for PowerPoint & Google Slides
Business Proposal
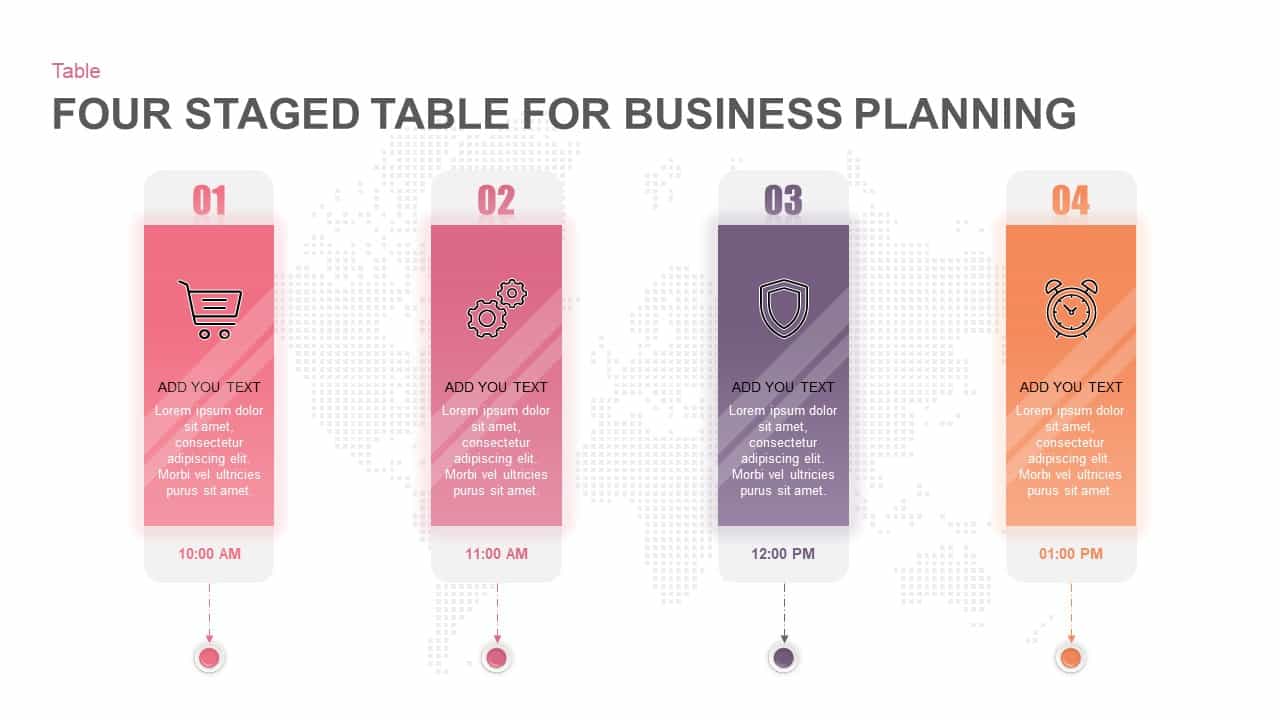
Four-Stage Business Planning Table Template for PowerPoint & Google Slides
Business Plan
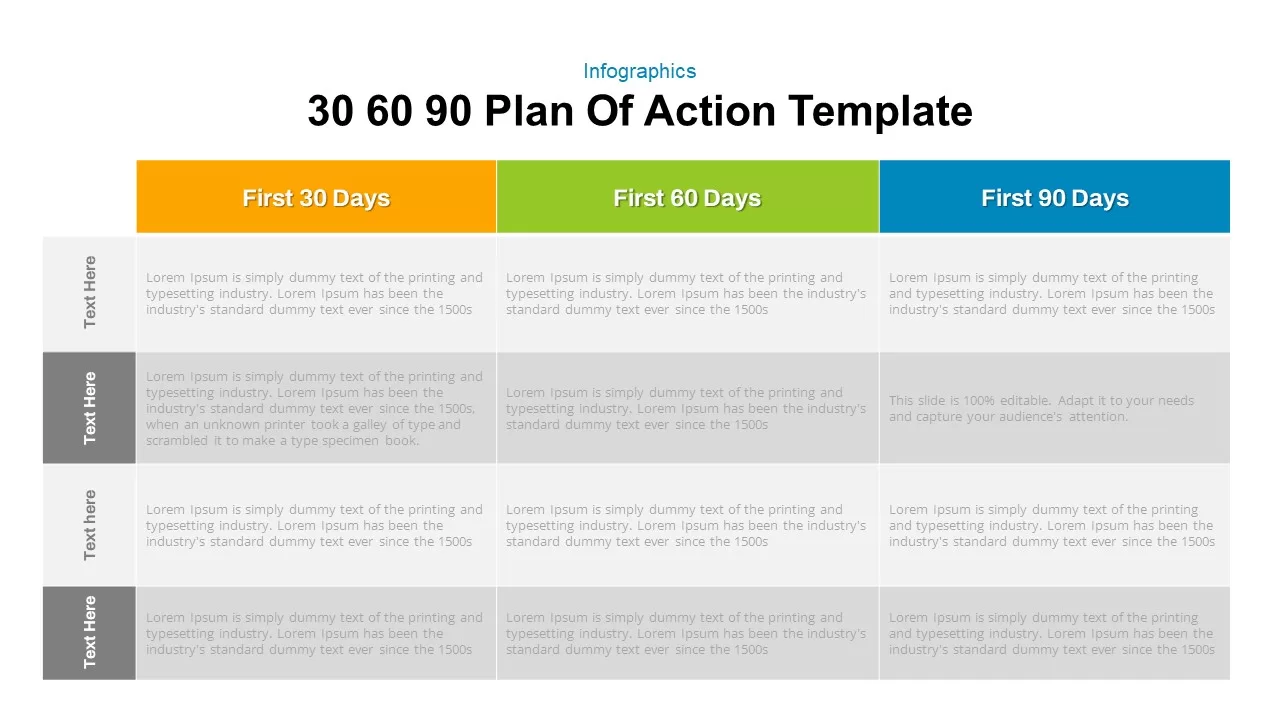
30 60 90 Day Plan Matrix Table Template for PowerPoint & Google Slides
Timeline
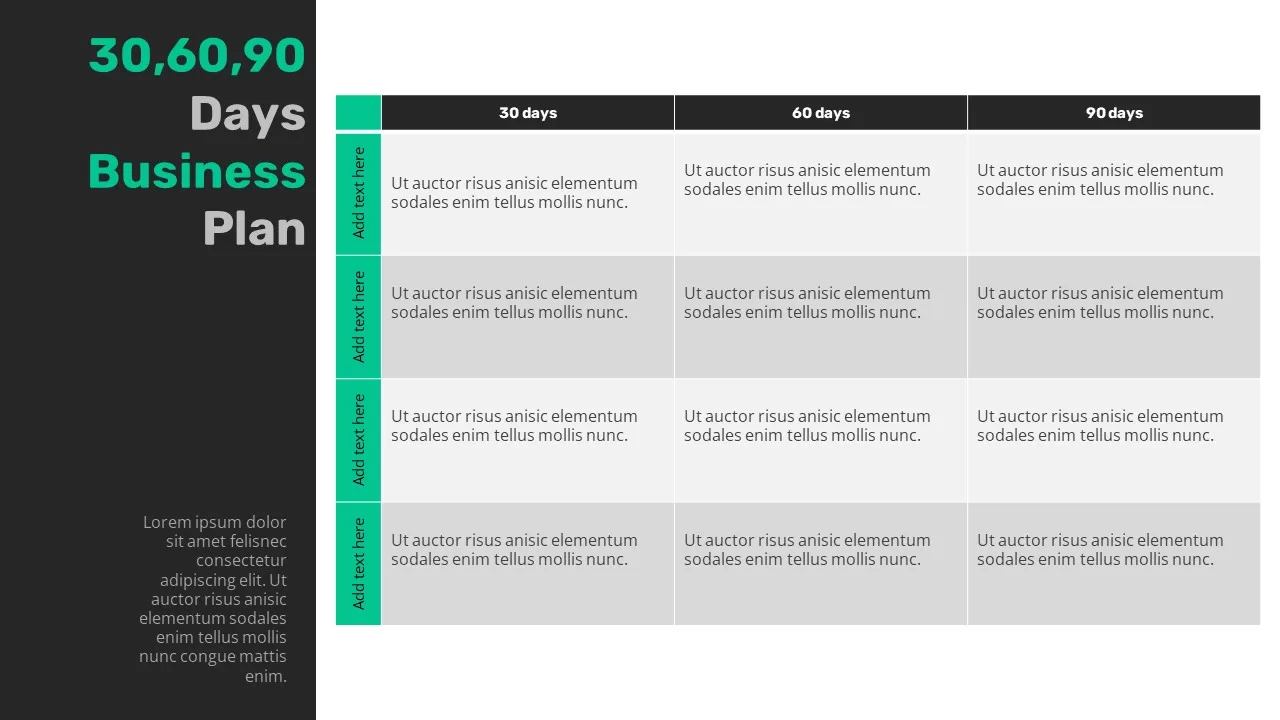
30-60-90 Business Plan Table Template for PowerPoint & Google Slides
Timeline
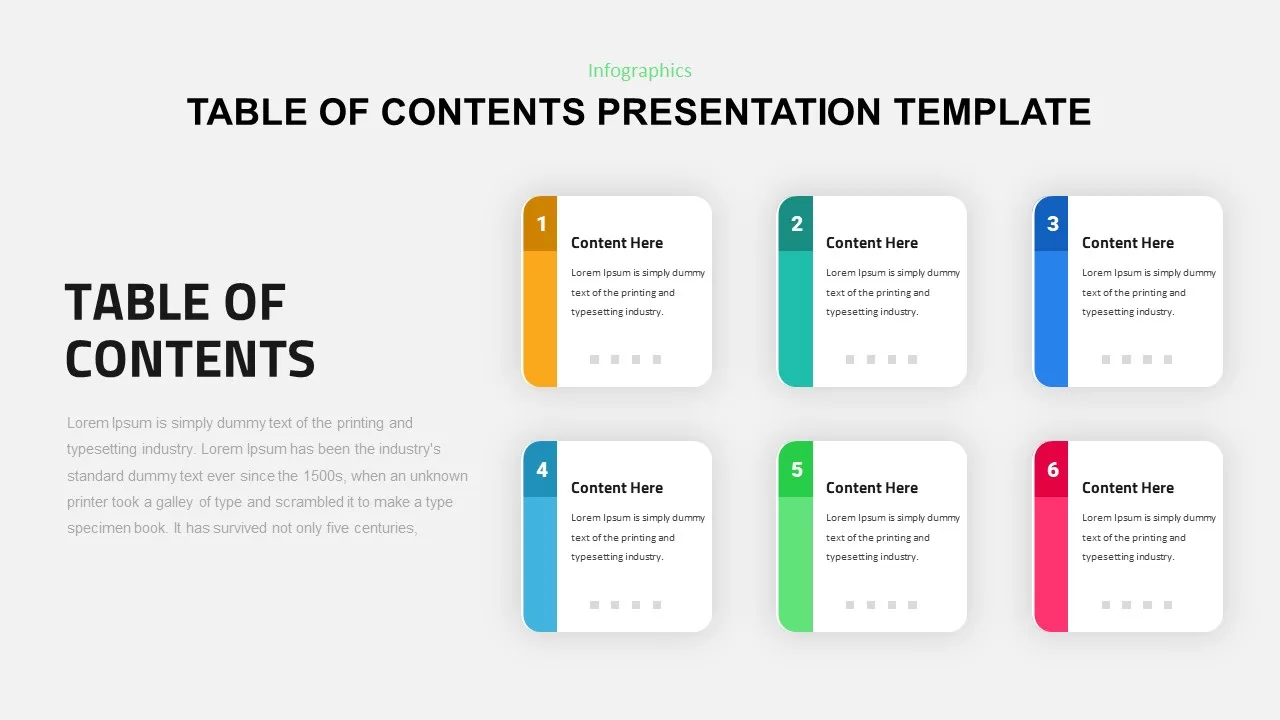
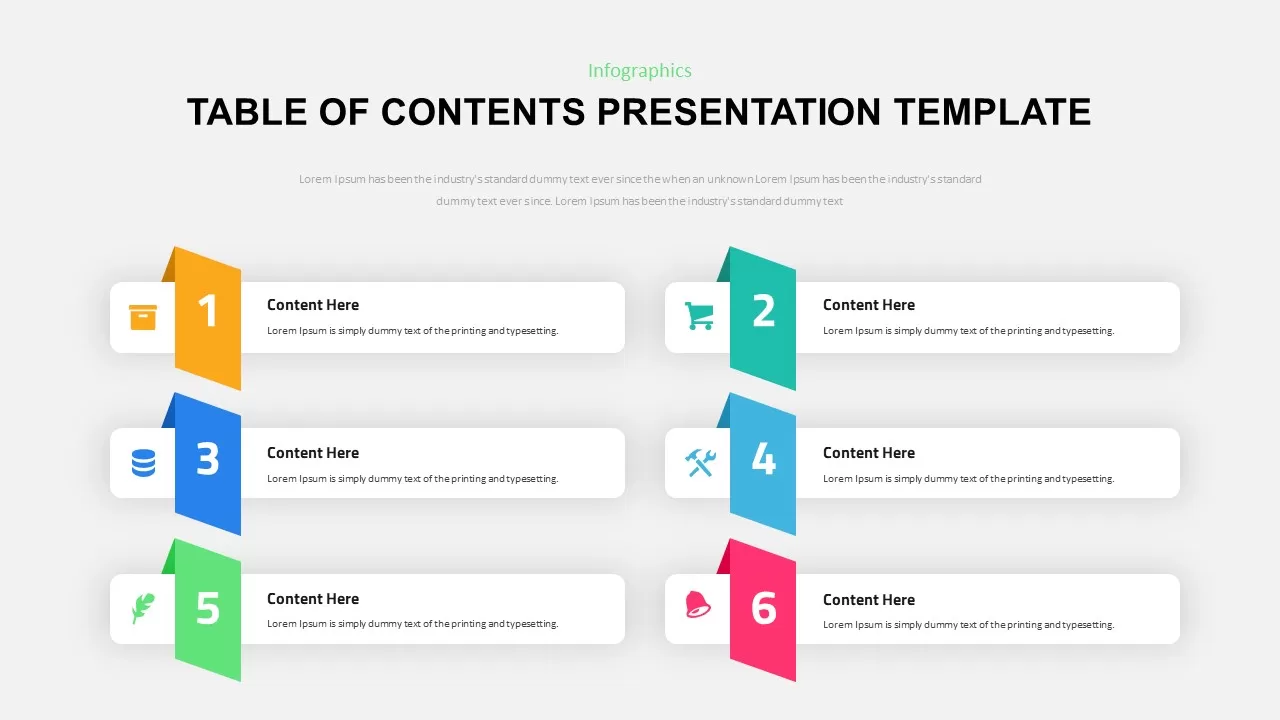
Six-Step Color-Coded Table of Contents Template for PowerPoint & Google Slides
Agenda
Table of Contents Infographic Slide template for PowerPoint & Google Slides
Agenda
Six-Step Table of Contents Infographic Template for PowerPoint & Google Slides
Agenda
Four-Section Table of Contents Template for PowerPoint & Google Slides
Agenda
Four-Step Numbered Table of Contents Template for PowerPoint & Google Slides
Agenda
Chevron Table of Contents Presentation Template for PowerPoint & Google Slides
Agenda
Modern Four-Step Table of Contents Template for PowerPoint & Google Slides
Agenda
Four-Step Strategic Table of Contents Template for PowerPoint & Google Slides
Agenda
Project Status Dashboard Table Template for PowerPoint & Google Slides
Project Status
Project Status Table Template for PowerPoint & Google Slides
Project Status
Social Media Plan Table Slide Deck Template for PowerPoint & Google Slides
Process
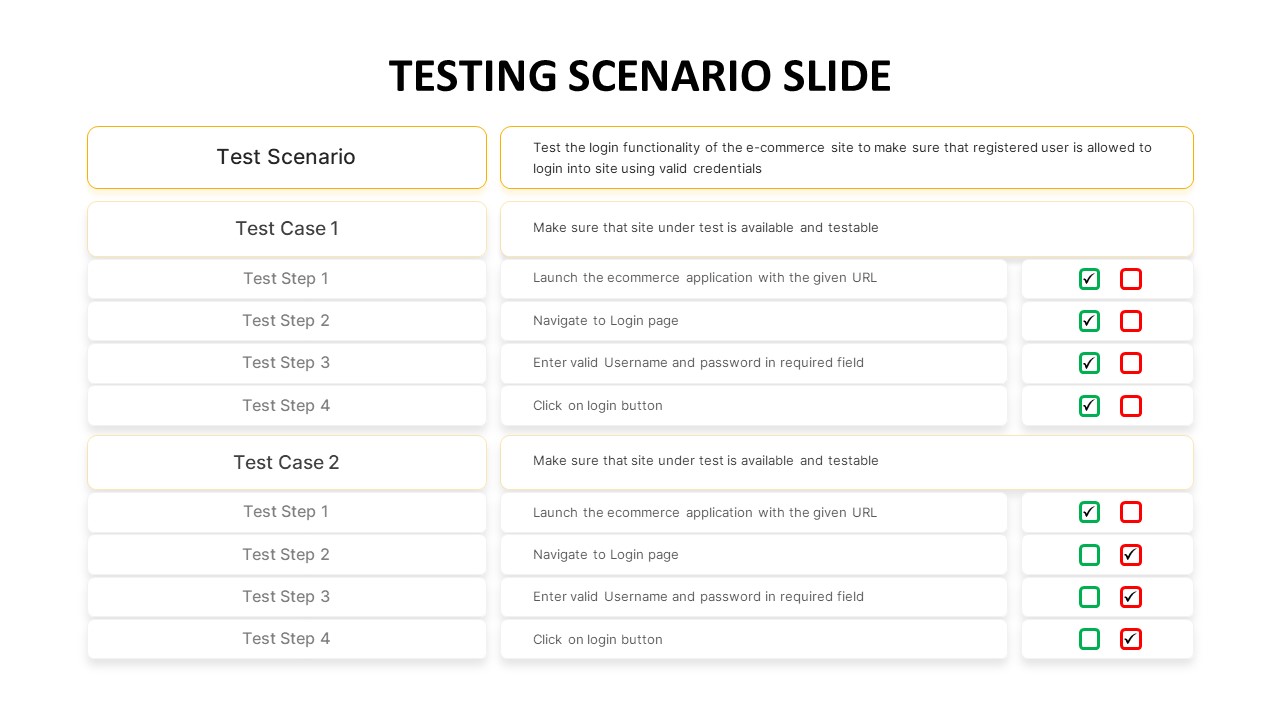
Testing Scenario Table Template for PowerPoint & Google Slides
Business Requirements
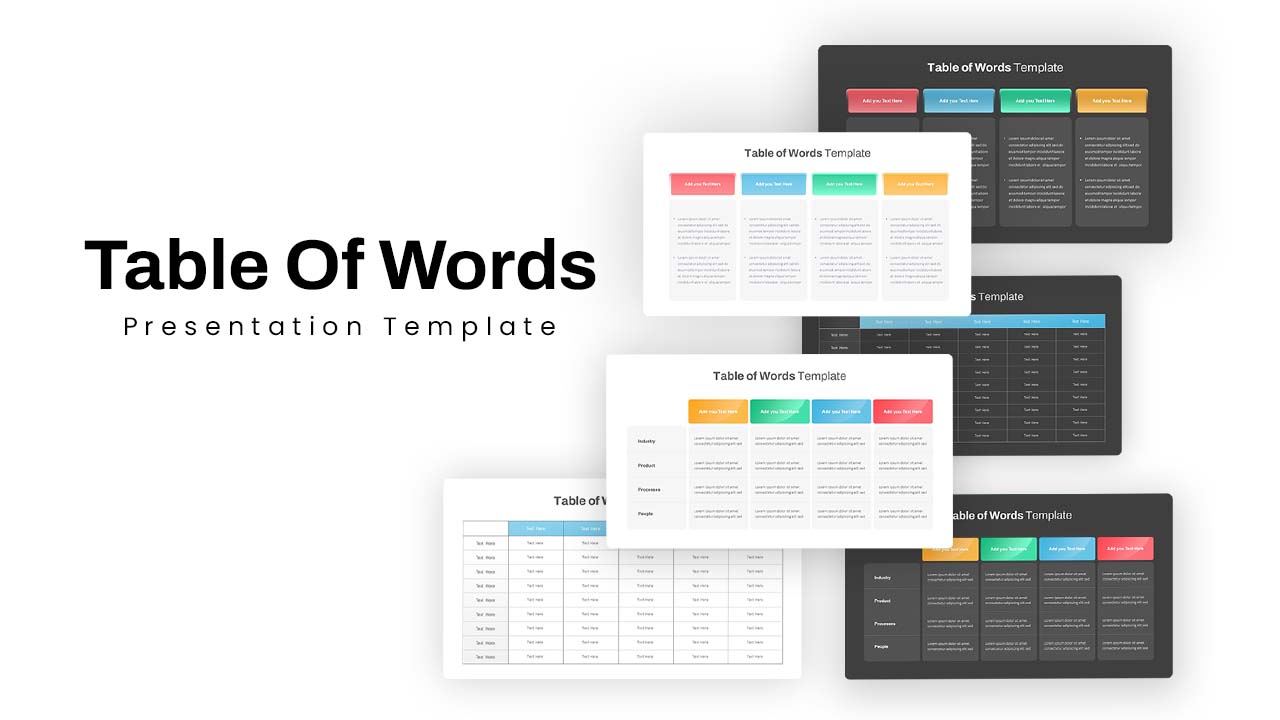
Versatile Table of Words Layout Template for PowerPoint & Google Slides
Table
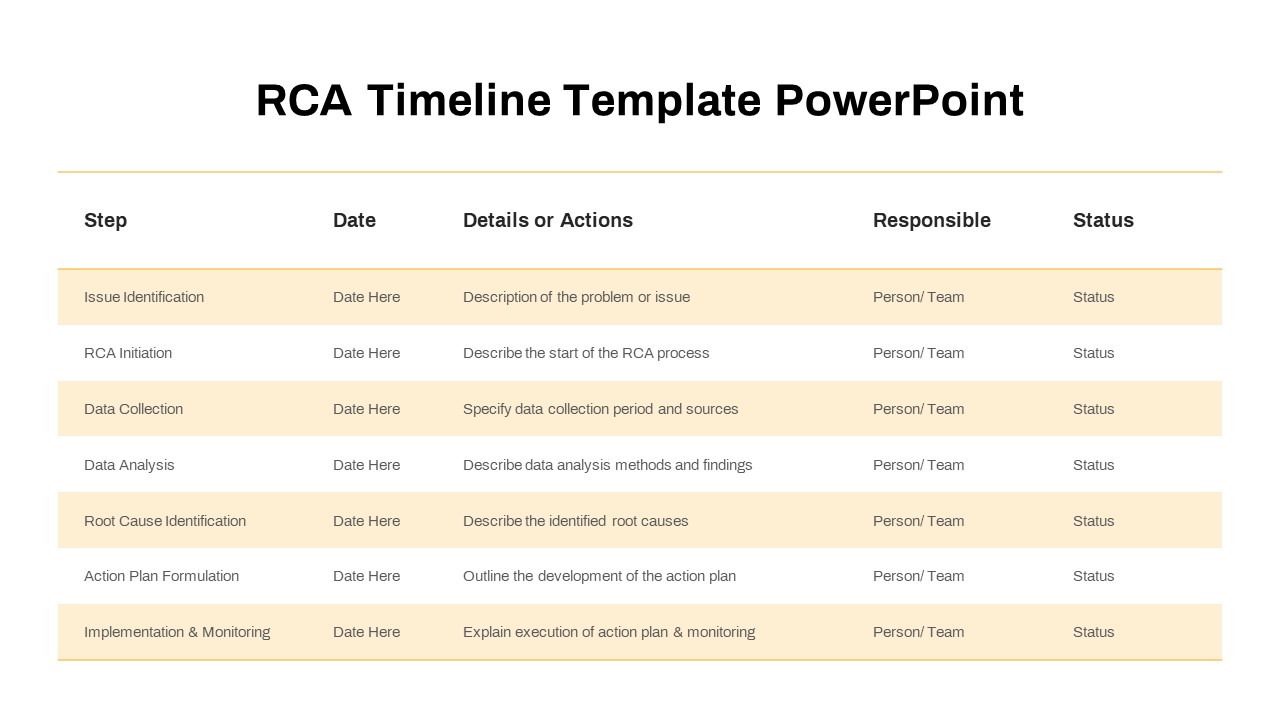
RCA Process Timeline Table Slide Template for PowerPoint & Google Slides
Timeline
Free Versatile Table Collection Template for PowerPoint & Google Slides
Pitch Deck
Free
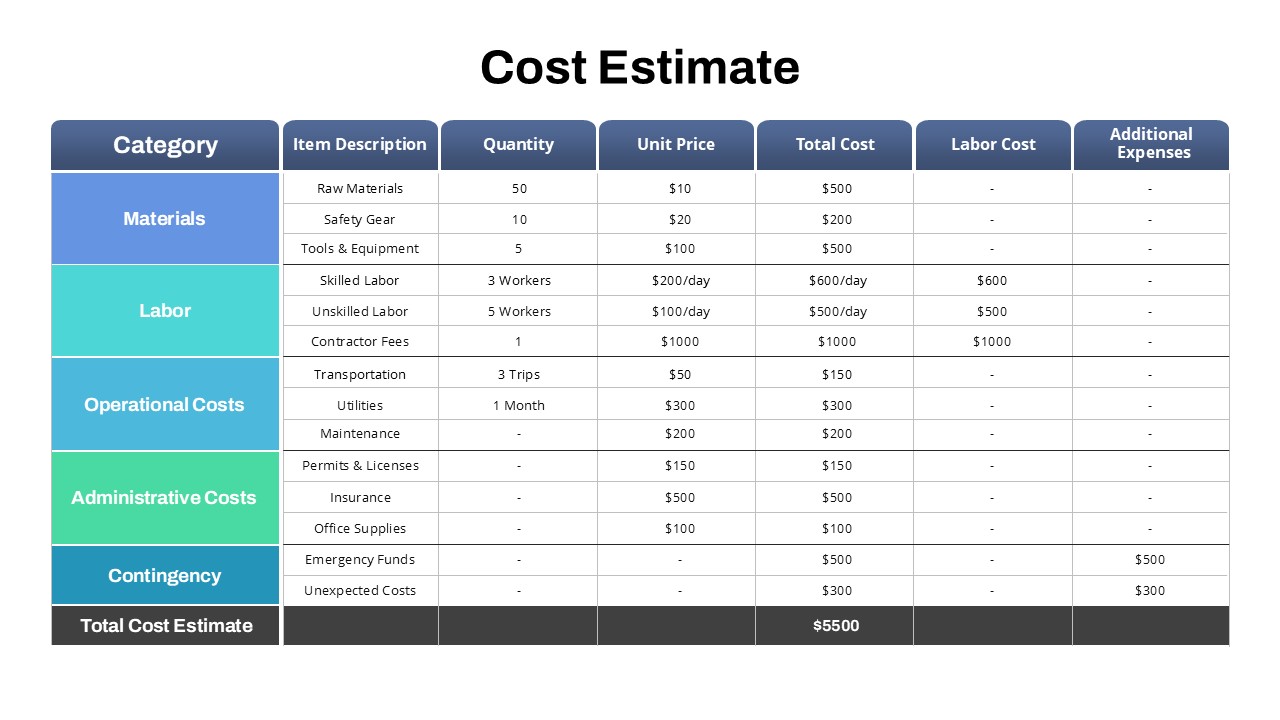
Project Detailed Cost Estimate Table Template for PowerPoint & Google Slides
Project
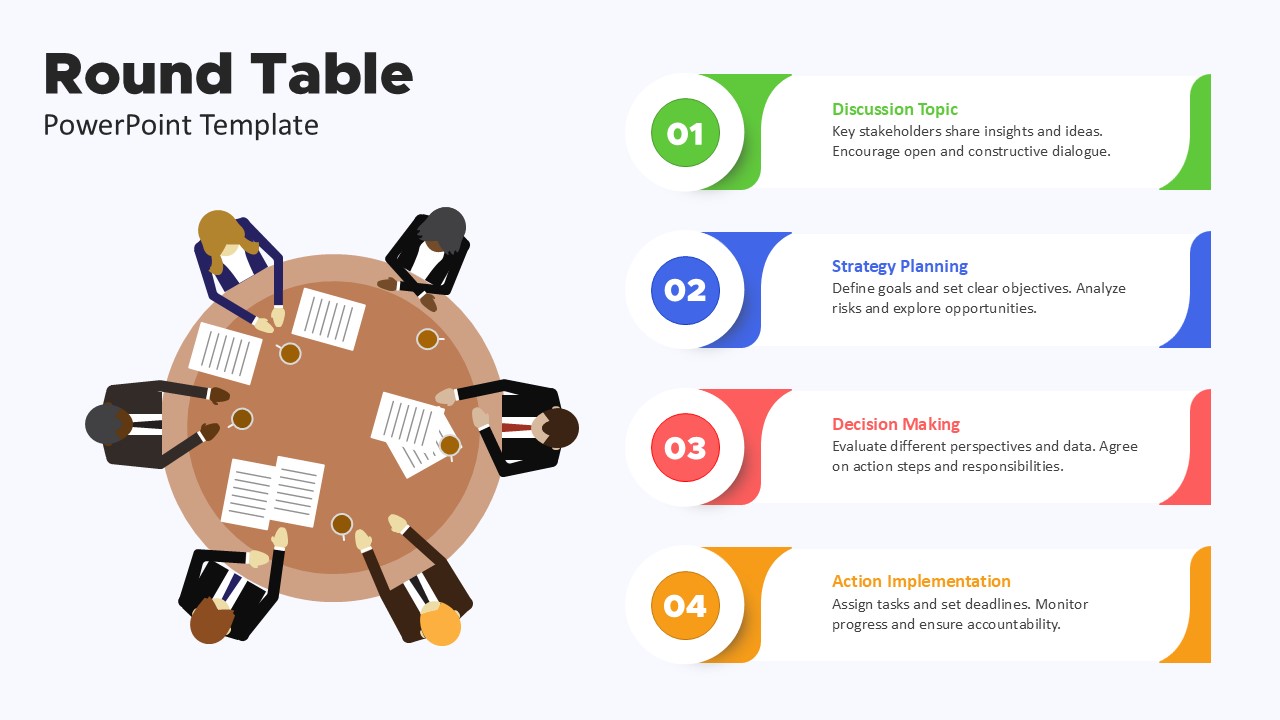
Title: Round Table Meeting Discussion Process Template for PowerPoint & Google Slides
Process
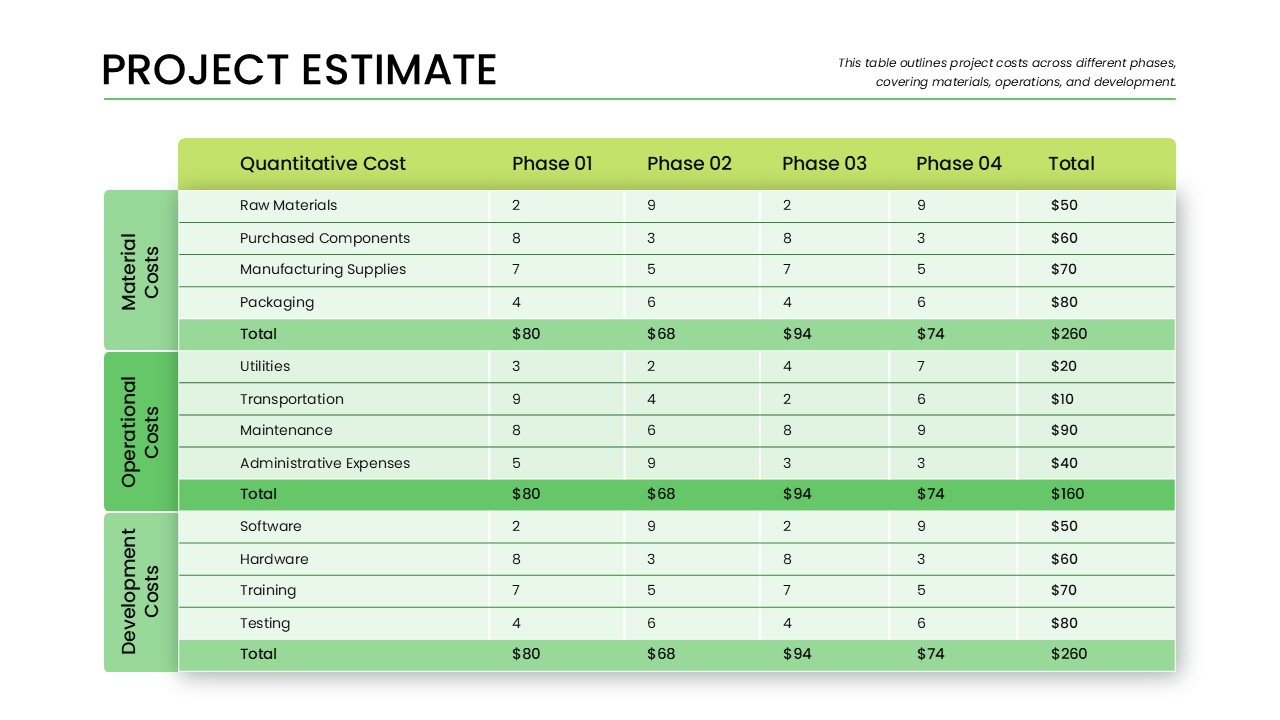
Phase-Wise Project Estimate Table Template for PowerPoint & Google Slides
Business Report
Progression Track Milestone Table Template for PowerPoint & Google Slides
Project Status
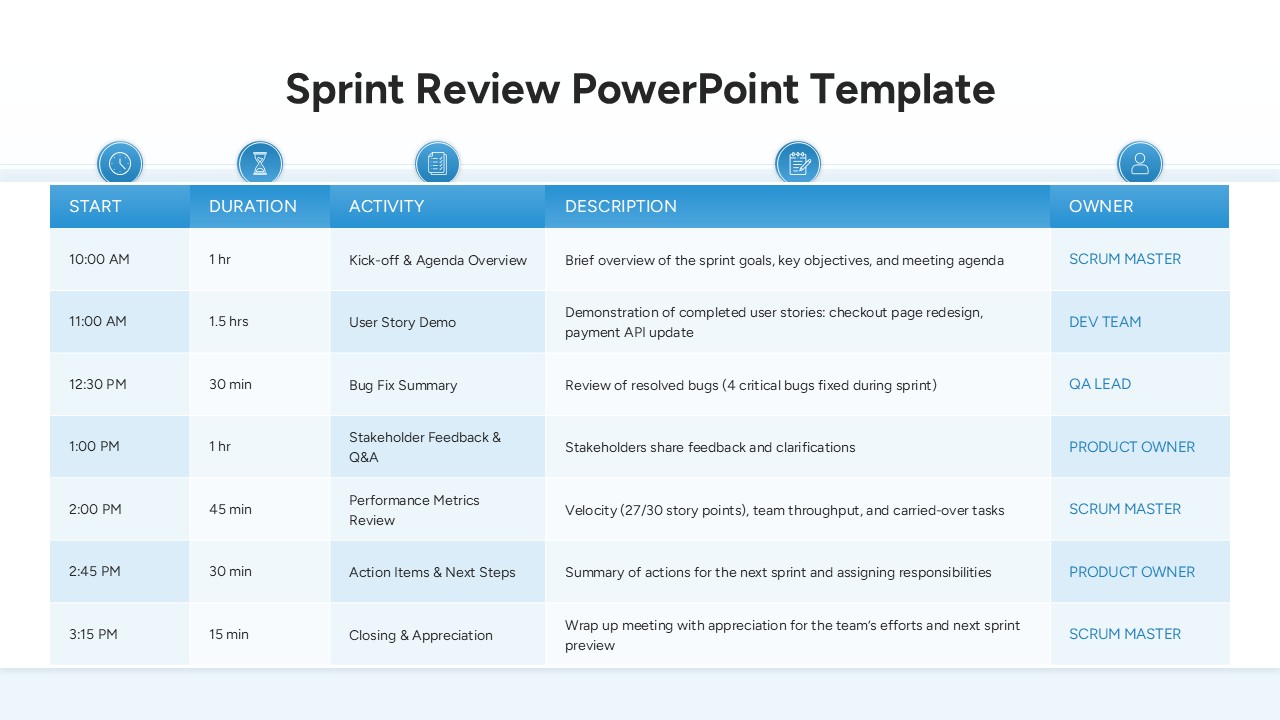
Sprint Review Meeting Agenda Table Template for PowerPoint & Google Slides
Agenda
Project Tracking Dashboard Table Template for PowerPoint & Google Slides
Project Status
Action Items Management Dashboard Table Template for PowerPoint & Google Slides
Project Status
Comprehensive Action Tracker Table Template for PowerPoint & Google Slides
Business
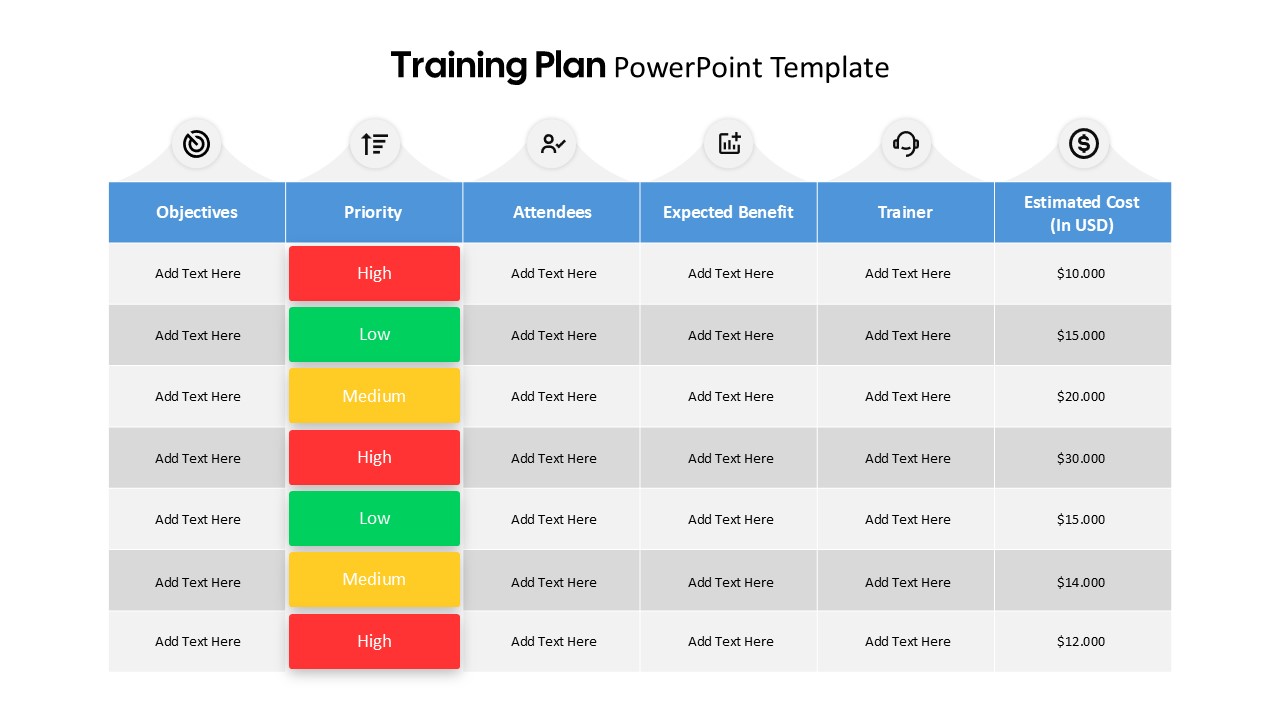
Training Plan Table Layout Template for PowerPoint & Google Slides
Employee Performance
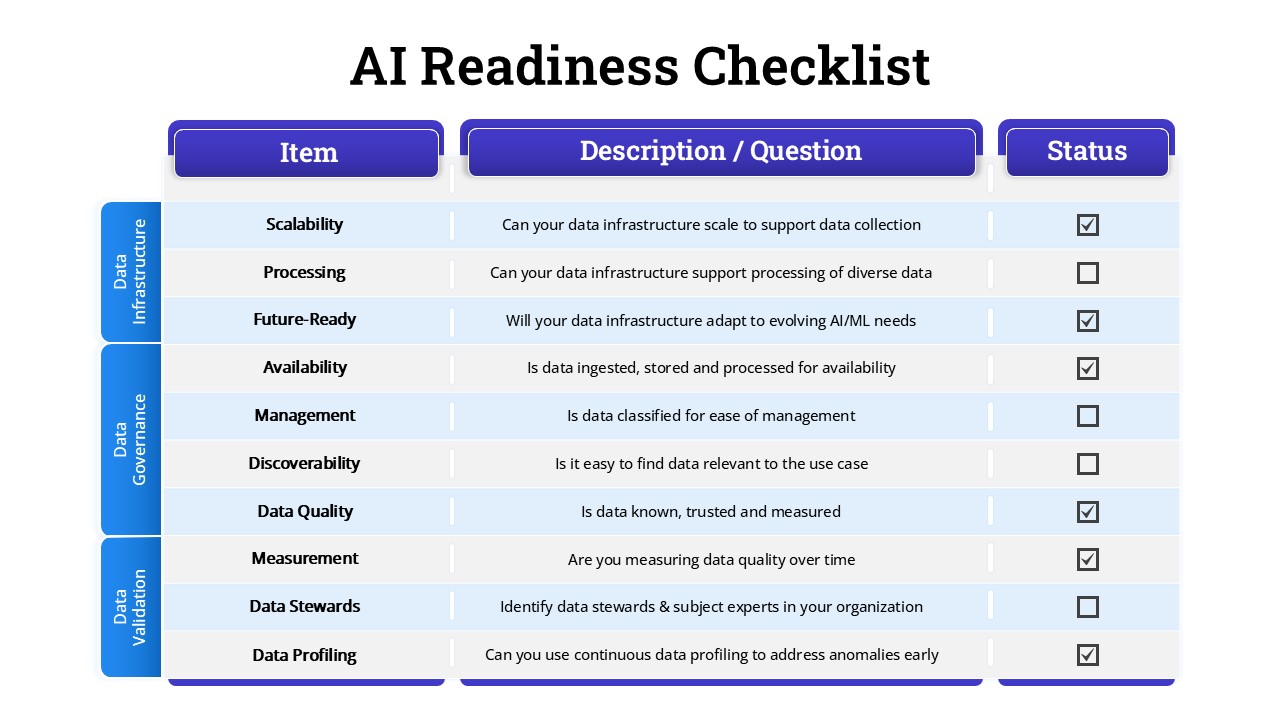
AI Readiness Checklist Table Slide Template for PowerPoint & Google Slides
Process
Multi-Column Table Presentation Template for PowerPoint & Google Slides
Table
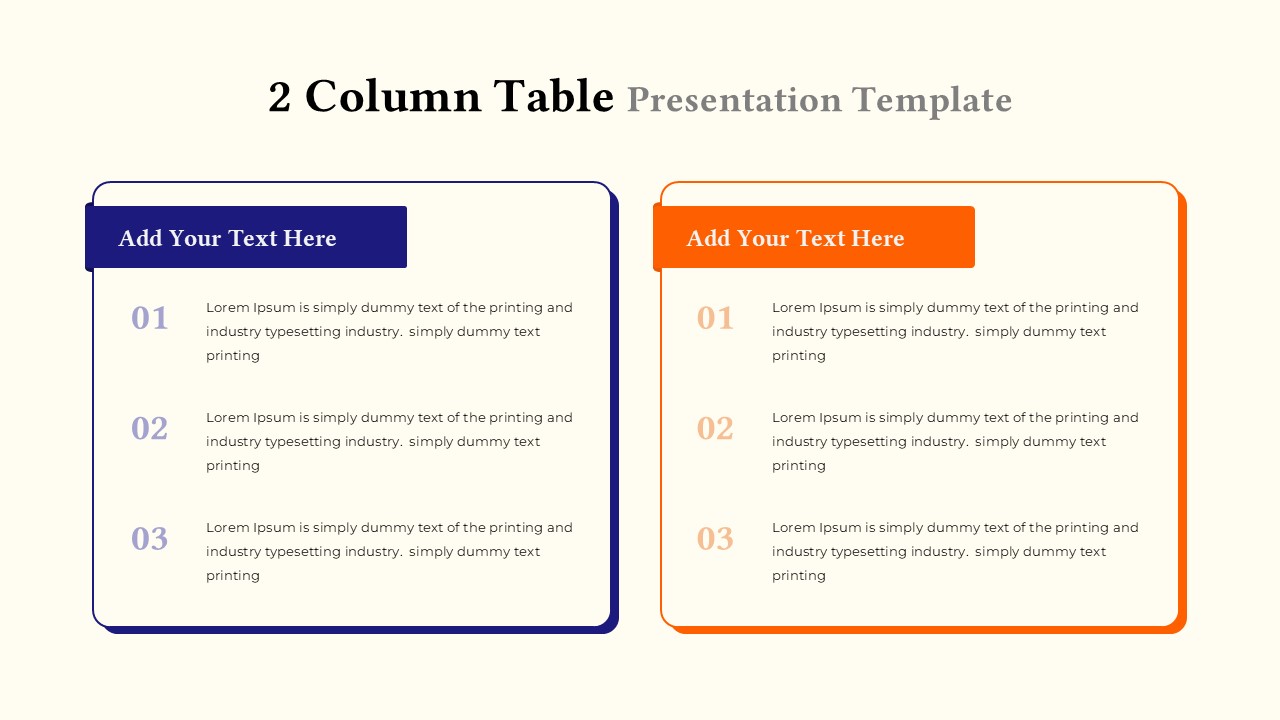
Two-Column Table Presentation Template for PowerPoint & Google Slides
Table
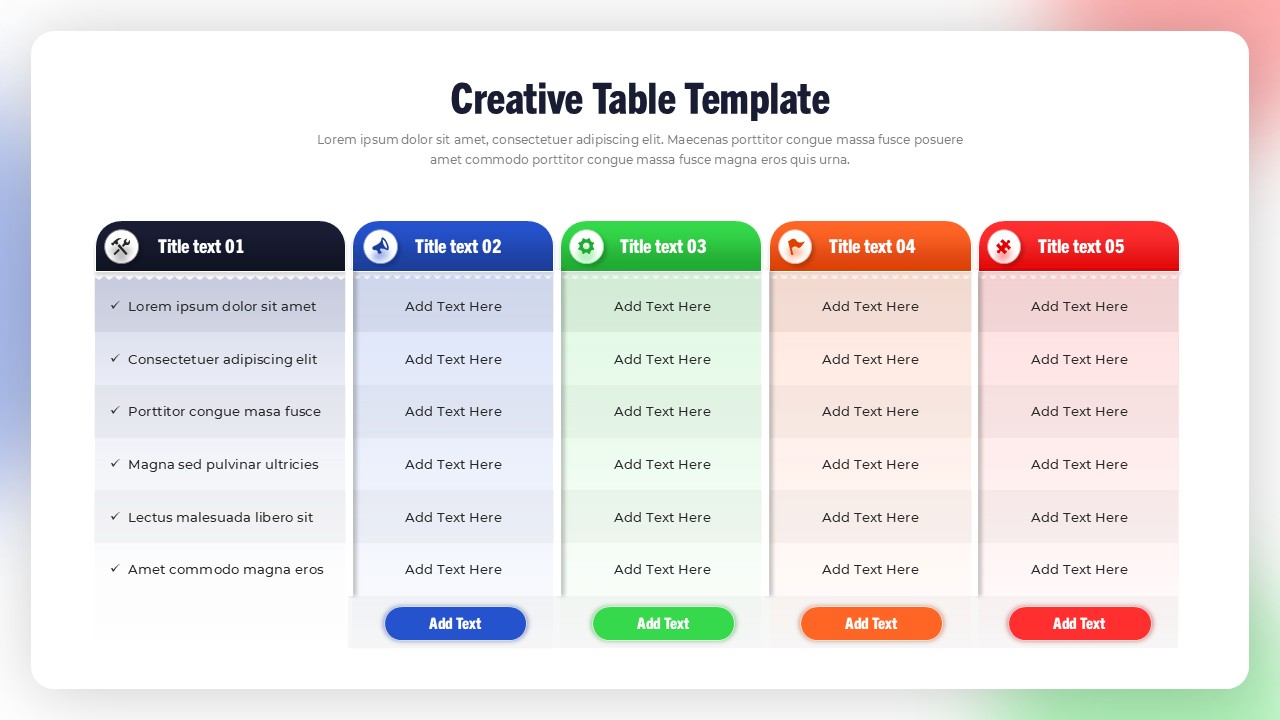
Creative Table Template for PowerPoint & Google Slides
Table