Venturing Diagram Template for PowerPoint & Google Slides


Description
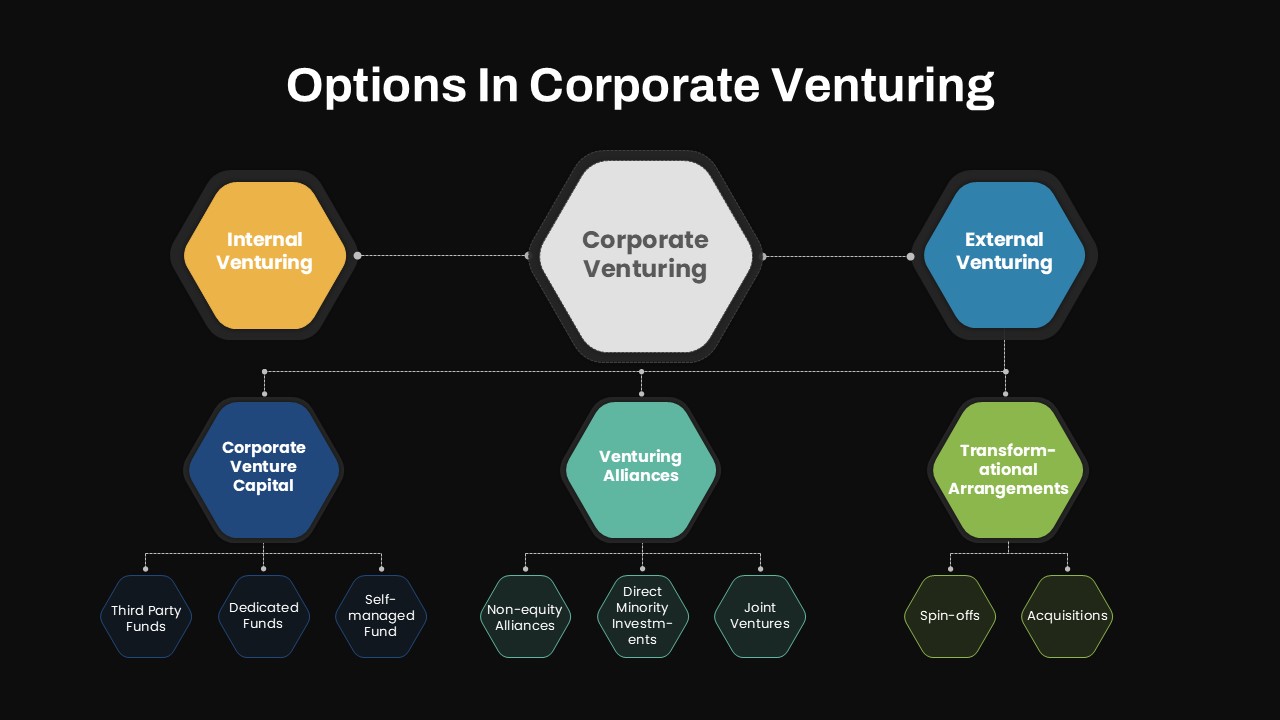
Use this corporate venturing hexagon diagram to present strategic investment options in an intuitive, color-coded hierarchy. Central to the layout is a bold, black hexagon labeled “Corporate Venturing,” flanked by gold and blue hexagons for Internal and External Venturing. Beneath each branch, secondary nodes—navy for Corporate Venture Capital with sub-nodes for Third Party Funds, Dedicated Funds, and Self-managed Funds; teal for Venturing Alliances with Non-equity Alliances, Direct Minority Investments, and Joint Ventures; and green for Transformational Arrangements with Spin-offs and Acquisitions—are connected by dashed lines to illustrate relationships. Subtle drop shadows and consistent hexagon proportions reinforce visual cohesion.
Designed on editable master slides, every component—from hexagon fills and border styles to dashed connectors and text placeholders—can be customized in seconds to match your brand guidelines. Swap color gradients or relabel nodes with a single click, and import your own icons or logo accents to reinforce corporate identity. Apply animation presets to reveal each tier sequentially, guiding audiences through the venturing framework during live presentations. Generous white space and minimalist typography maintain focus on content, ensuring clarity across desktop, projector, and virtual environments.
Fully compatible with both PowerPoint and Google Slides, this diagram retains precise alignment and formatting when co-editing in cloud environments, eliminating version-control headaches. Duplicate or hide nodes to tailor the hierarchy to your organization’s structure, or overlay data callouts to emphasize funding amounts and performance metrics. Use built-in connector styles to map iterative feedback loops or highlight risk-reward trade-offs, and integrate data-driven insights by linking node text to external charts or dashboards. Beyond corporate venturing, repurpose the hierarchy to map partner ecosystems, organizational governance structures, or multi-tiered process flows. This versatile infographic empowers executives, strategy consultants, and investment teams to communicate complex relationships with maximum impact and minimal effort.
Who is it for
Corporate strategy leaders, CVC teams, and innovation managers will benefit from this slide when outlining internal versus external investment pathways. Consultants, board members, and venture analysts can also leverage the clear hierarchy to align stakeholders and drive data-informed discussions.
Other Uses
Repurpose this hexagon hierarchy for organizational charts, partner-ecosystem maps, or multi-tiered product-launch frameworks. Use the same structure to visualize governance models, stakeholder networks, or phased rollout plans.
Login to download this file

Item ID
SB04666
Related Templates

Snake Diagram Pack of 8 Slides template for PowerPoint & Google Slides
Process
Gear Process Diagram PowerPoint Template for PowerPoint & Google Slides
Process
Sales Process Workflow Funnel Diagram PowerPoint Template for PowerPoint & Google Slides
Funnel
Puzzle Diagram PowerPoint Template for PowerPoint & Google Slides
Process
Transportation Logistics PowerPoint Diagram template for PowerPoint & Google Slides
Process
Emoji Scale PowerPoint Diagram for PowerPoint & Google Slides
Infographics
4 Step Problem Solving PowerPoint Diagram for PowerPoint & Google Slides
Process
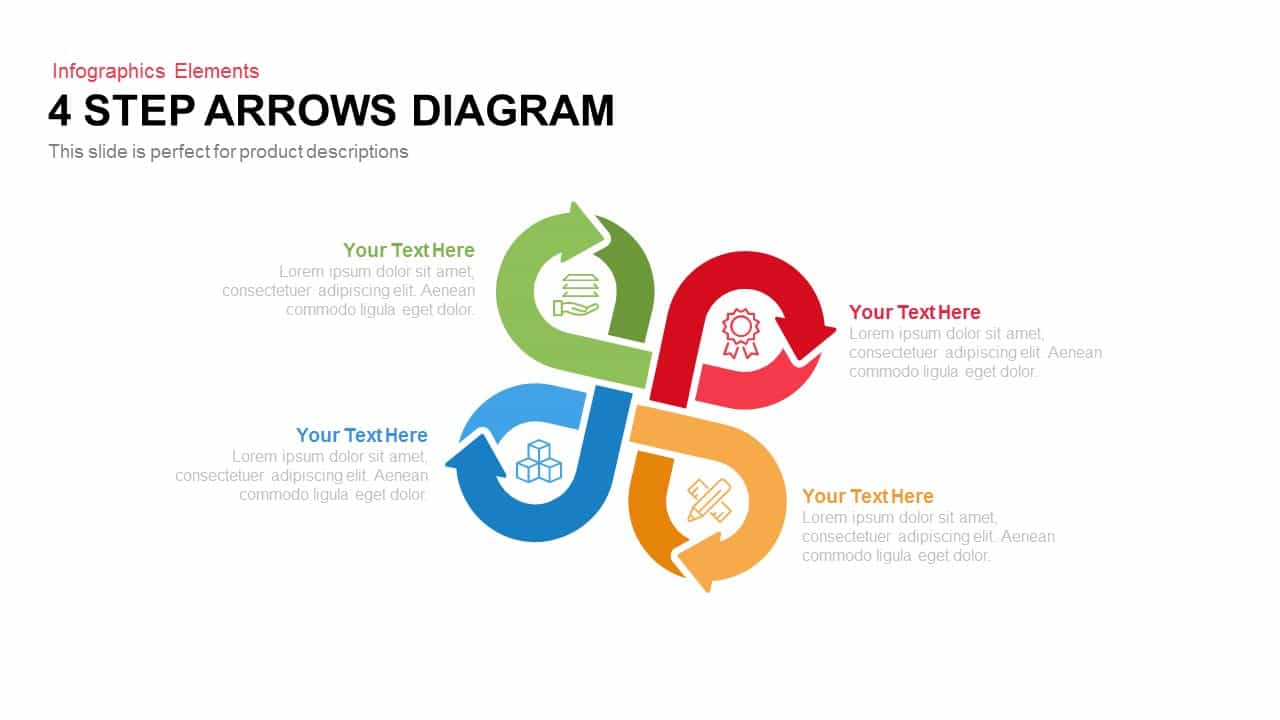
4Step Arrows Diagram Template for PowerPoint & Google Slides
Infographics
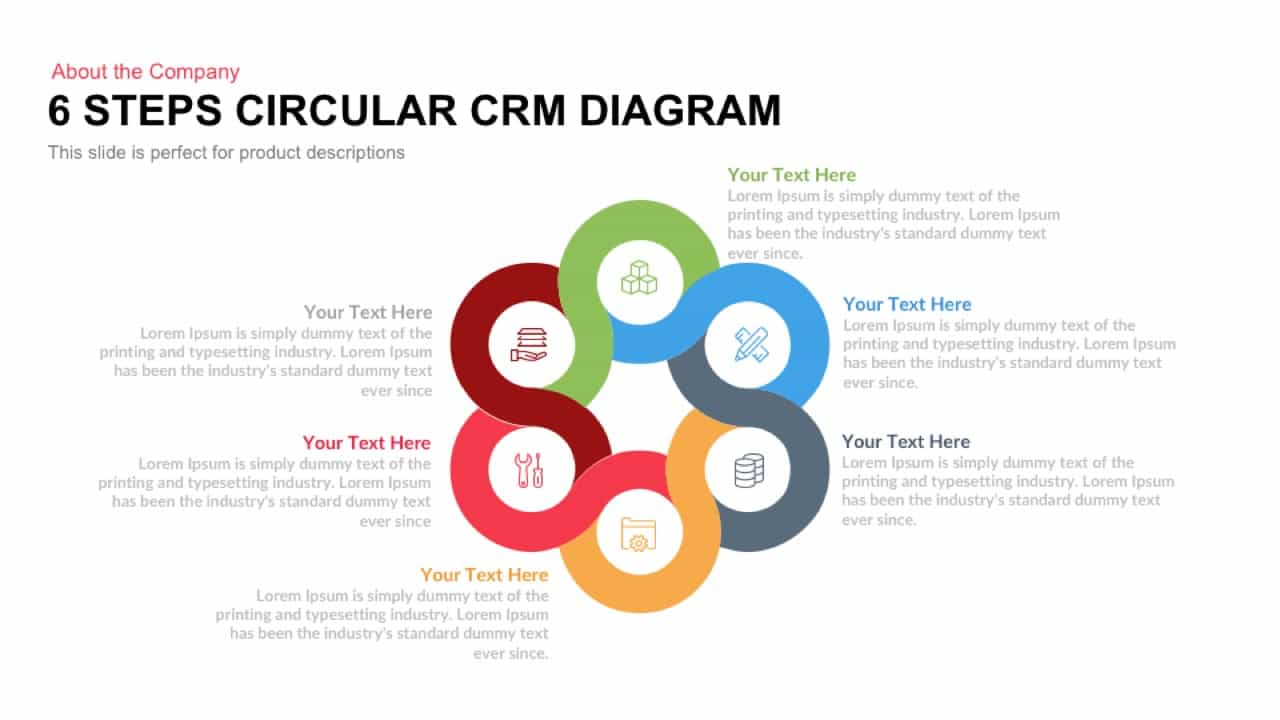
Six Steps Circular CRM Diagram Template for PowerPoint & Google Slides
Customer Journey
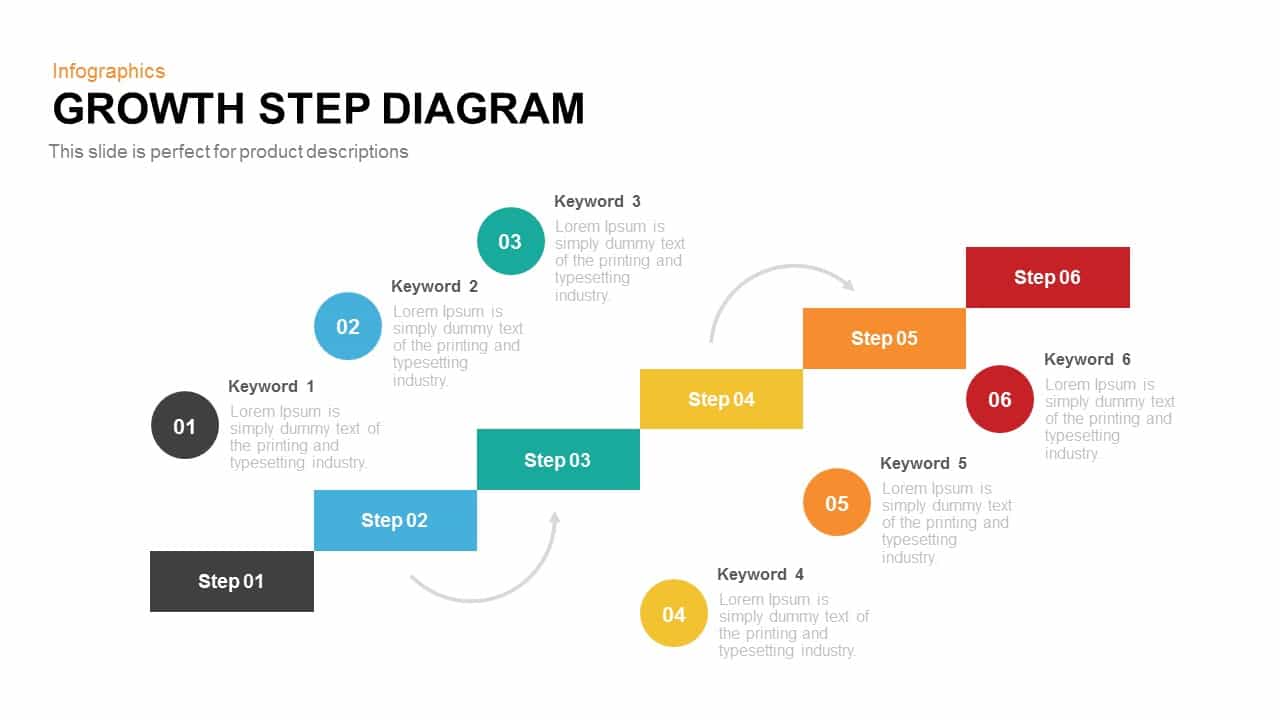
Growth Step Diagram template for PowerPoint & Google Slides
Infographics
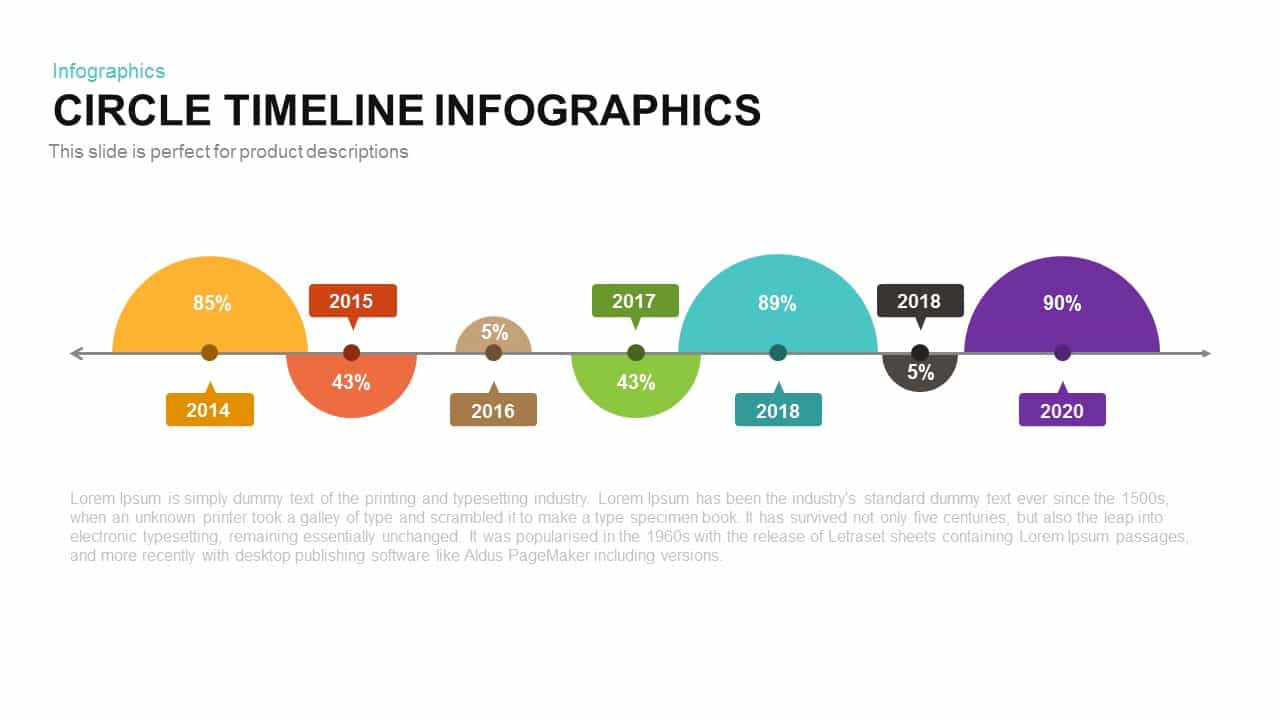
Alternating Circle Timeline Diagram Template for PowerPoint & Google Slides
Timeline
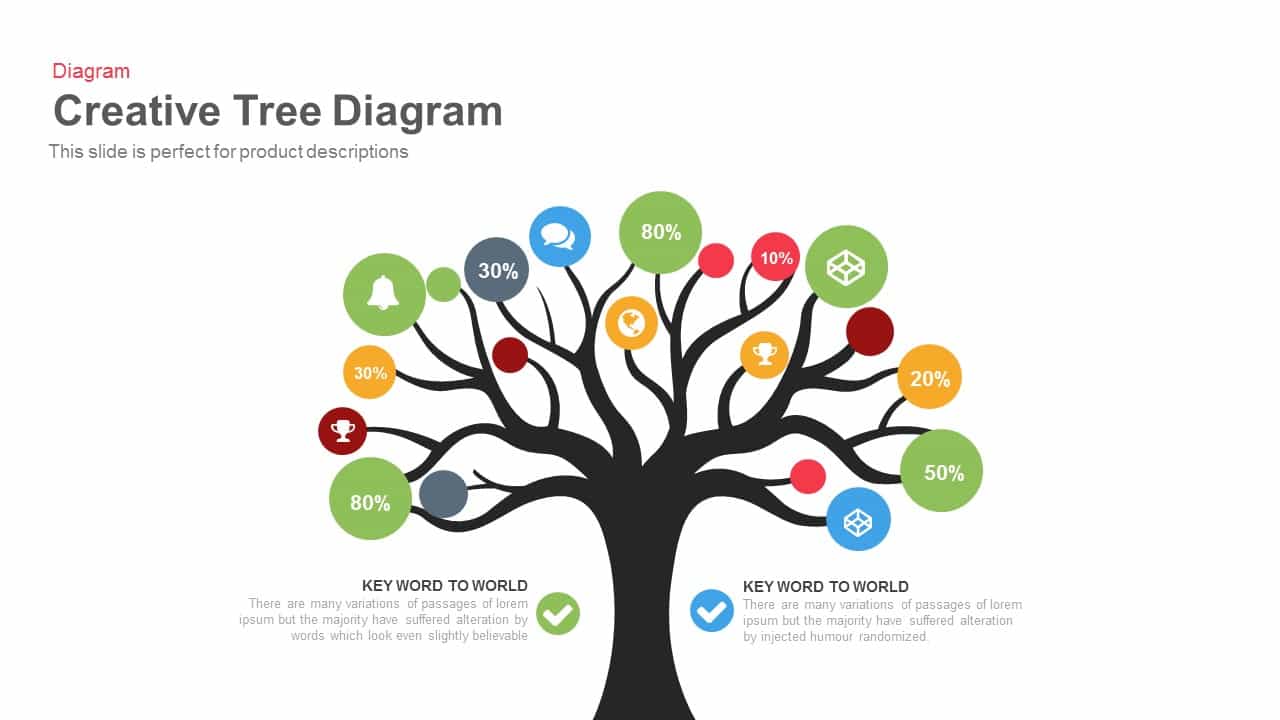
Engaging Creative Tree Diagram Slide Template for PowerPoint & Google Slides
Flow Charts
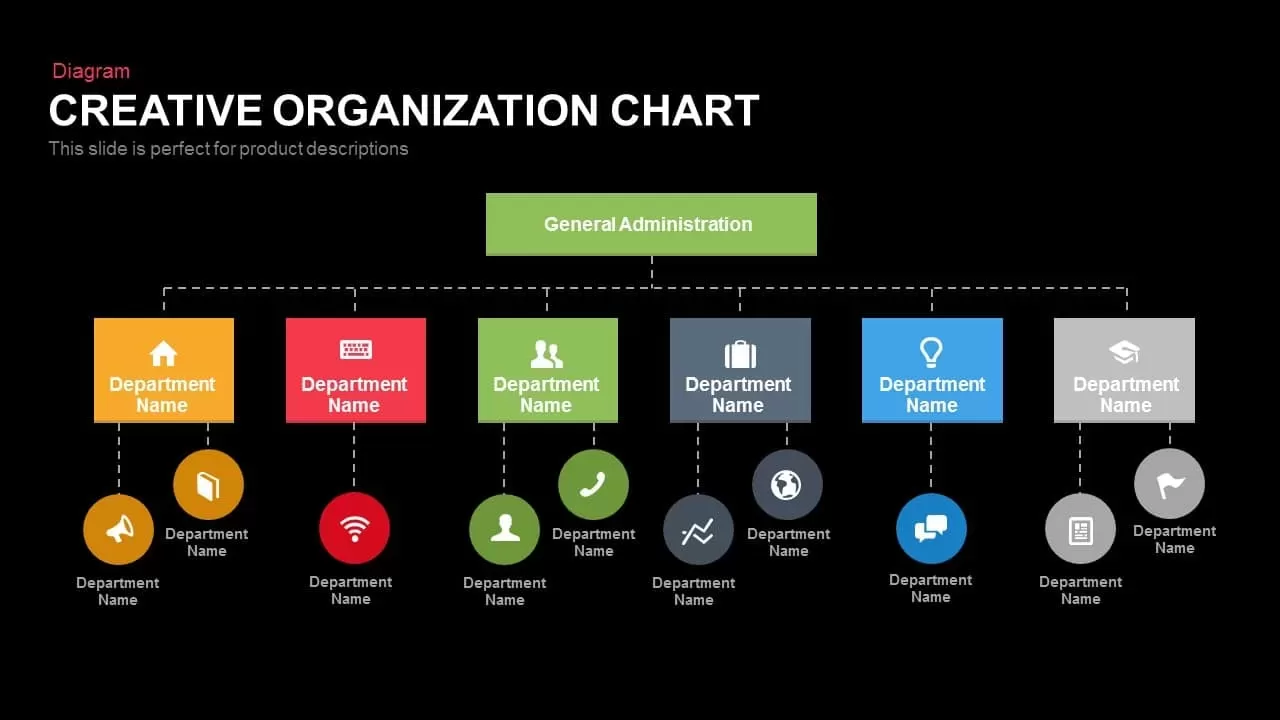
Creative Organization Chart Diagram Template for PowerPoint & Google Slides
Org Chart
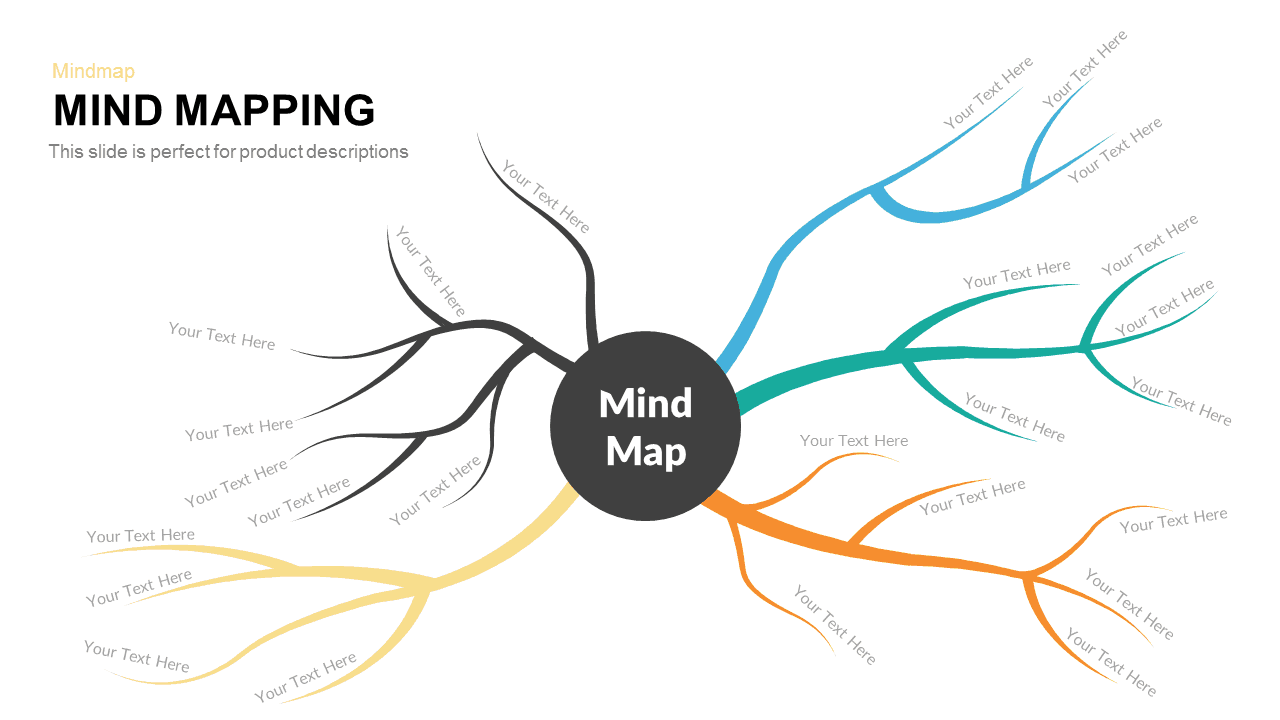
Five-Branch Mind Mapping Diagram template for PowerPoint & Google Slides
Mind Maps
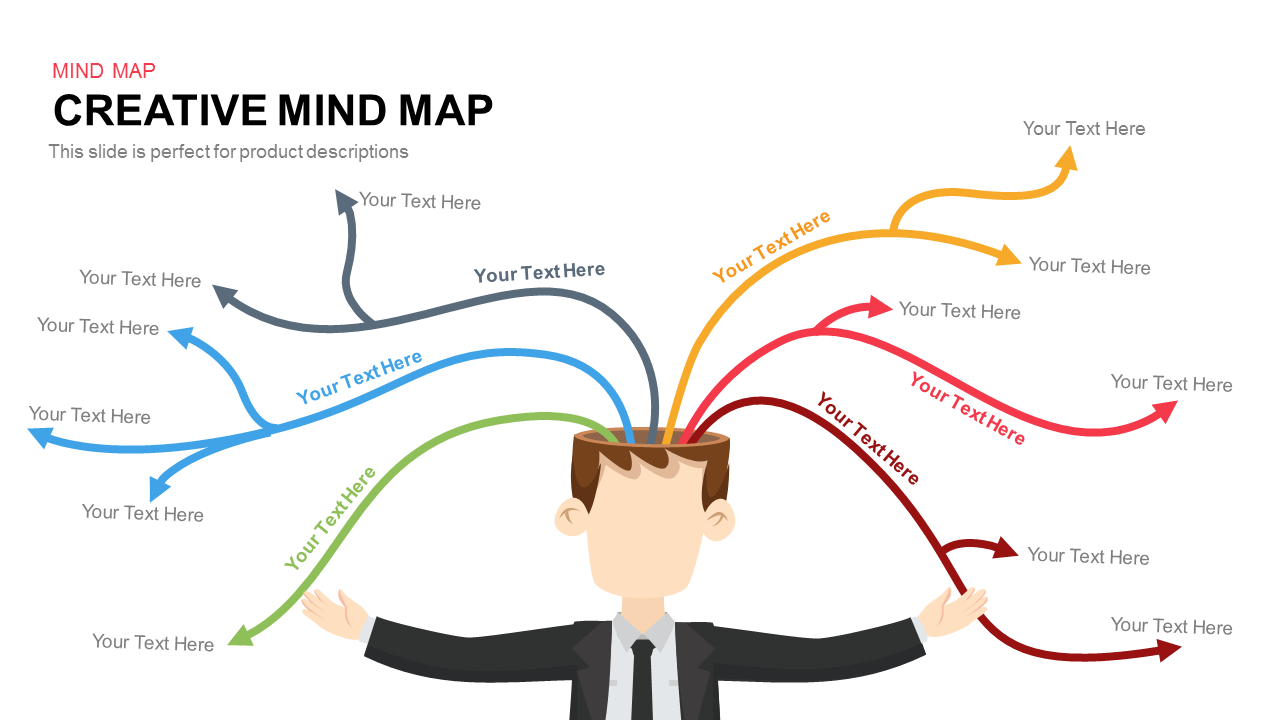
Colorful Creative Mind Map Diagram template for PowerPoint & Google Slides
Mind Maps

Five-Step Gear Process Diagram Template for PowerPoint & Google Slides
Process
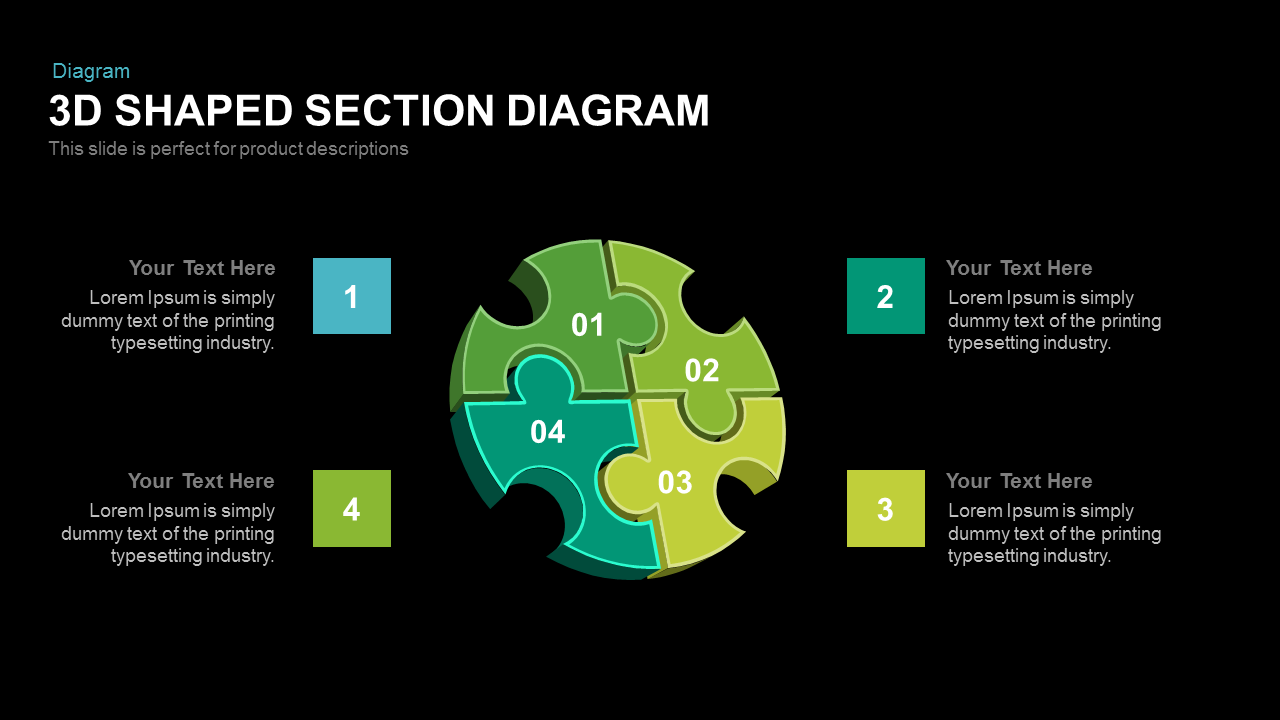
3D Shaped Section Diagram template for PowerPoint & Google Slides
Infographics

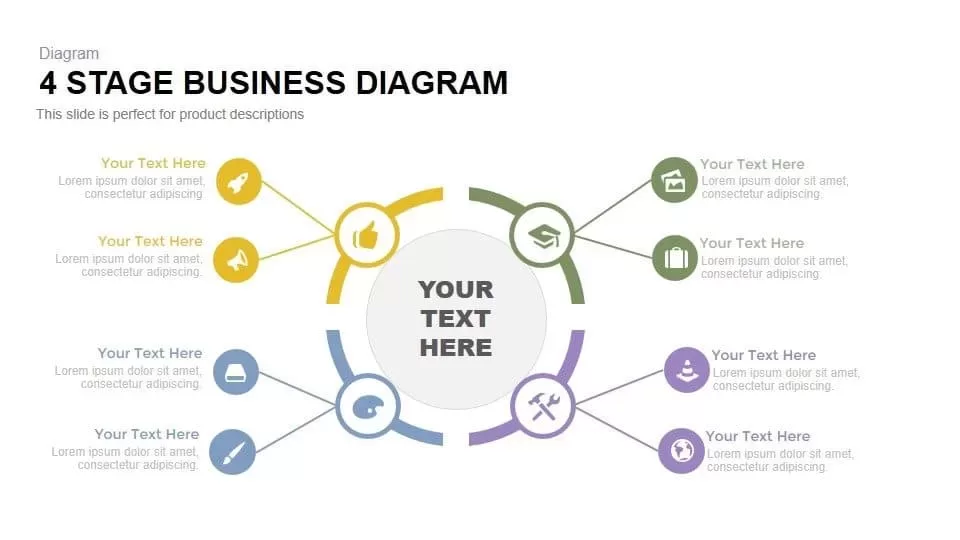
Four-Stage Business Circular Diagram Template for PowerPoint & Google Slides
Process
Professional Four-Stage Funnel Diagram Template for PowerPoint & Google Slides
Funnel
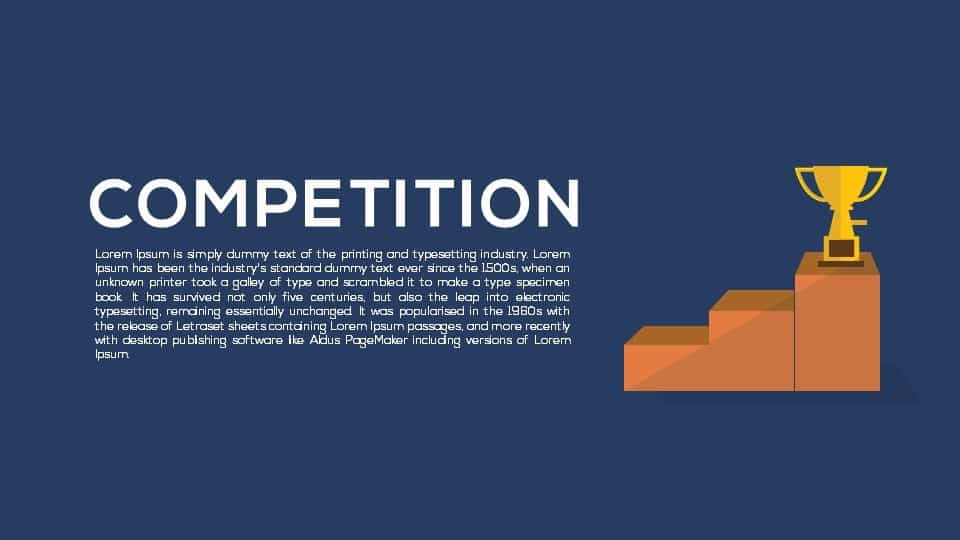
Competition Metaphor Podium Diagram Template for PowerPoint & Google Slides
Business
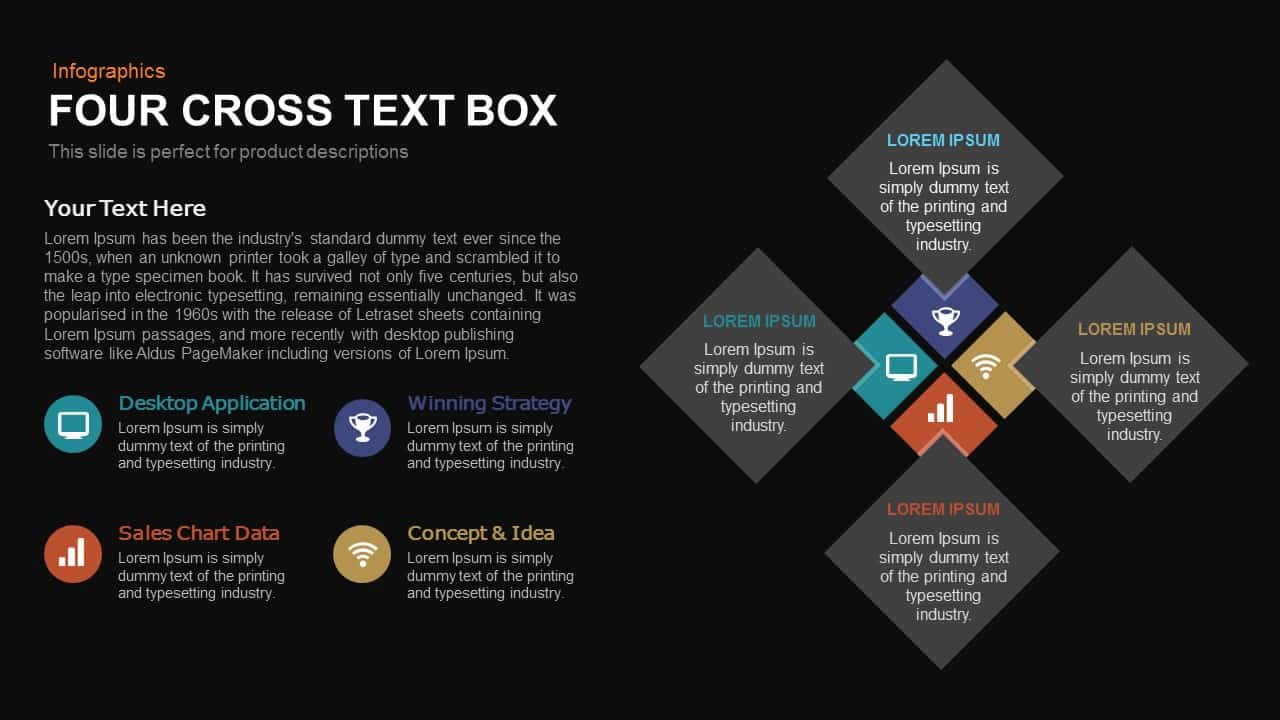
Four-Cross Text Box Diagram Template for PowerPoint & Google Slides
Comparison
Modern Five-Stage Cycle Process Diagram Template for PowerPoint & Google Slides
Process
Four and Five-Stage Funnel Diagram Template for PowerPoint & Google Slides
Funnel
Five Ribbon Sections Process Diagram Template for PowerPoint & Google Slides
Process
Five-Stage Pentagon Arrow Diagram Template for PowerPoint & Google Slides
Arrow
SCAMPER Technique Diagram template for PowerPoint & Google Slides
Process
Pros & Cons Arrow Diagram template for PowerPoint & Google Slides
Comparison Chart
Gear Flow Diagram template for PowerPoint & Google Slides
Process
Free Six Stage Bubble Process Diagram template for PowerPoint & Google Slides
Process
Free
Seven-Part Marketing Mix Diagram Template for PowerPoint & Google Slides
Marketing

Four-Staged Puzzle Diagram Slide Template for PowerPoint & Google Slides
Process
Modern Five-Step Circles Process Diagram Template for PowerPoint & Google Slides
Circular
Four-Piece Jigsaw Puzzle Diagram Template for PowerPoint & Google Slides
Process
Fishbone Diagram Cause-and-Effect Template for PowerPoint & Google Slides
Process
Six-Step Hexagonal Diagram Slide Template for PowerPoint & Google Slides
Circular
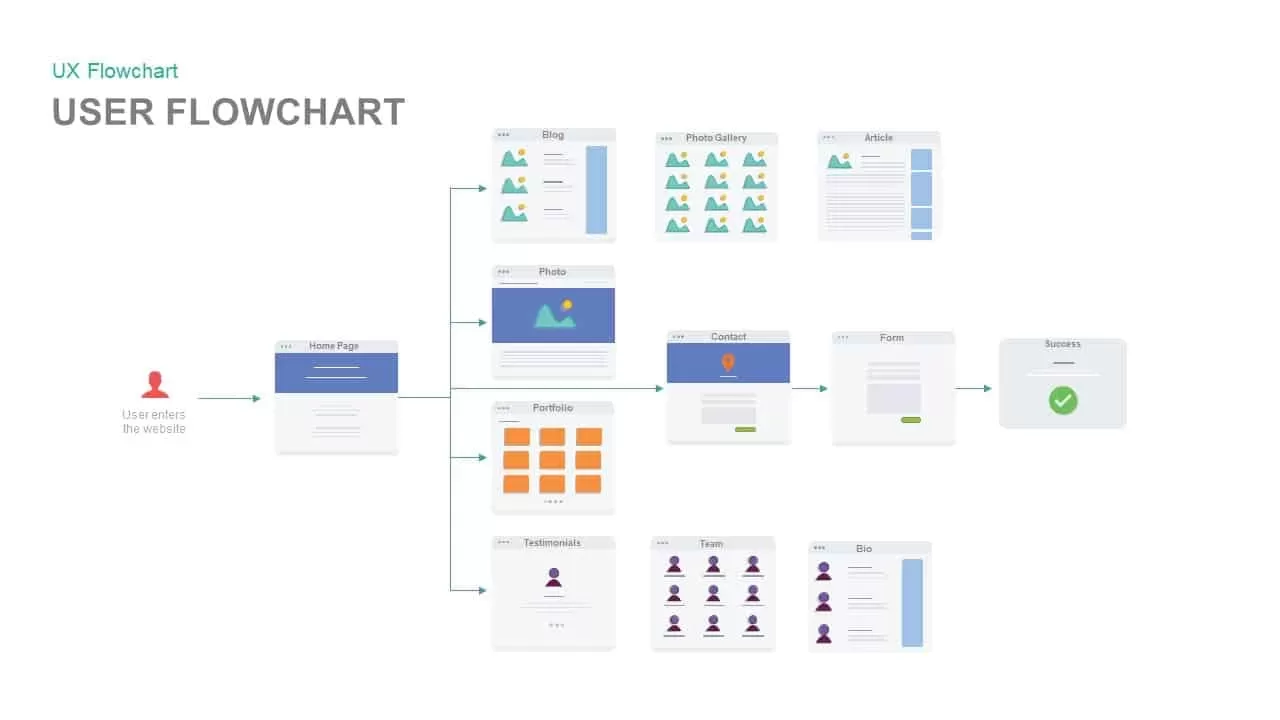
Website User Flowchart Diagram Template for PowerPoint & Google Slides
Process
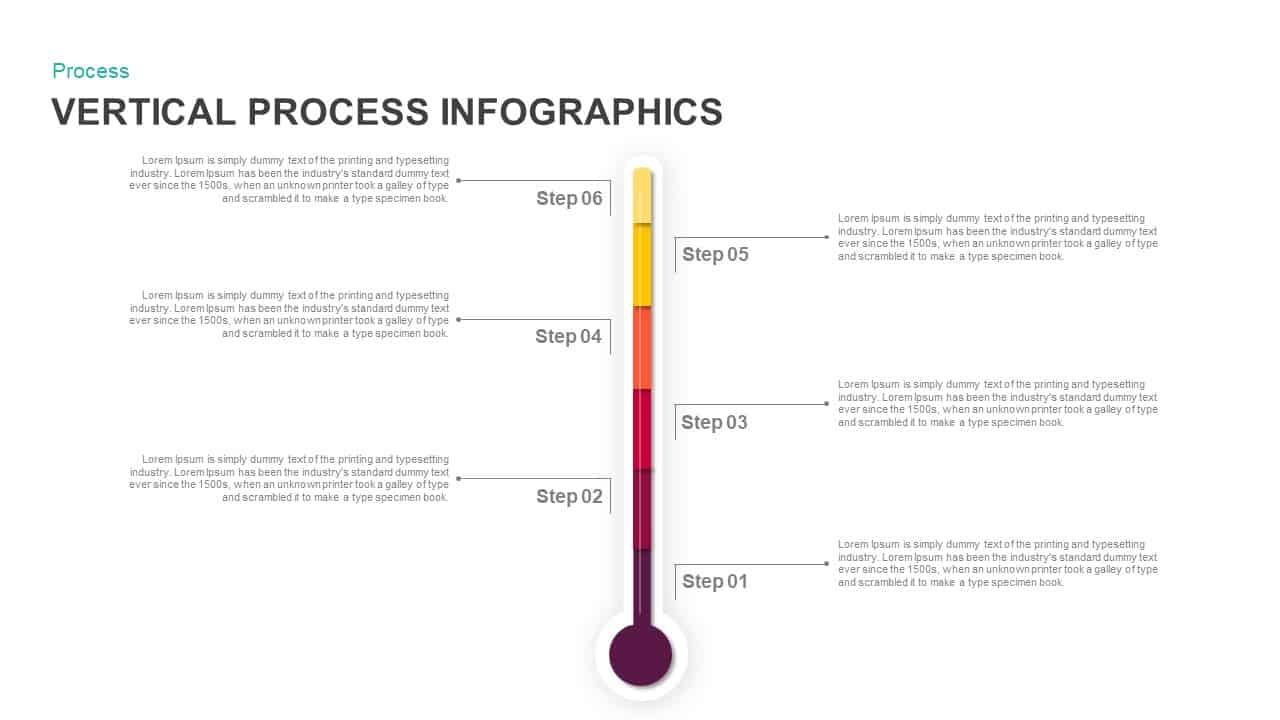
Six-Step Vertical Process Diagram Template for PowerPoint & Google Slides
Process
Risk Management Heat Map Diagram Template for PowerPoint & Google Slides
Comparison Chart

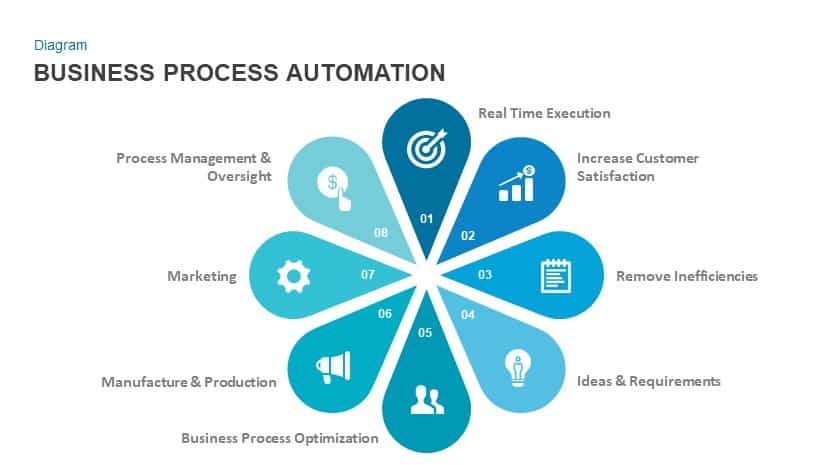
Business Process Automation Diagram Template for PowerPoint & Google Slides
Process
Six-Step Linear Arrow Process Diagram Template for PowerPoint & Google Slides
Process
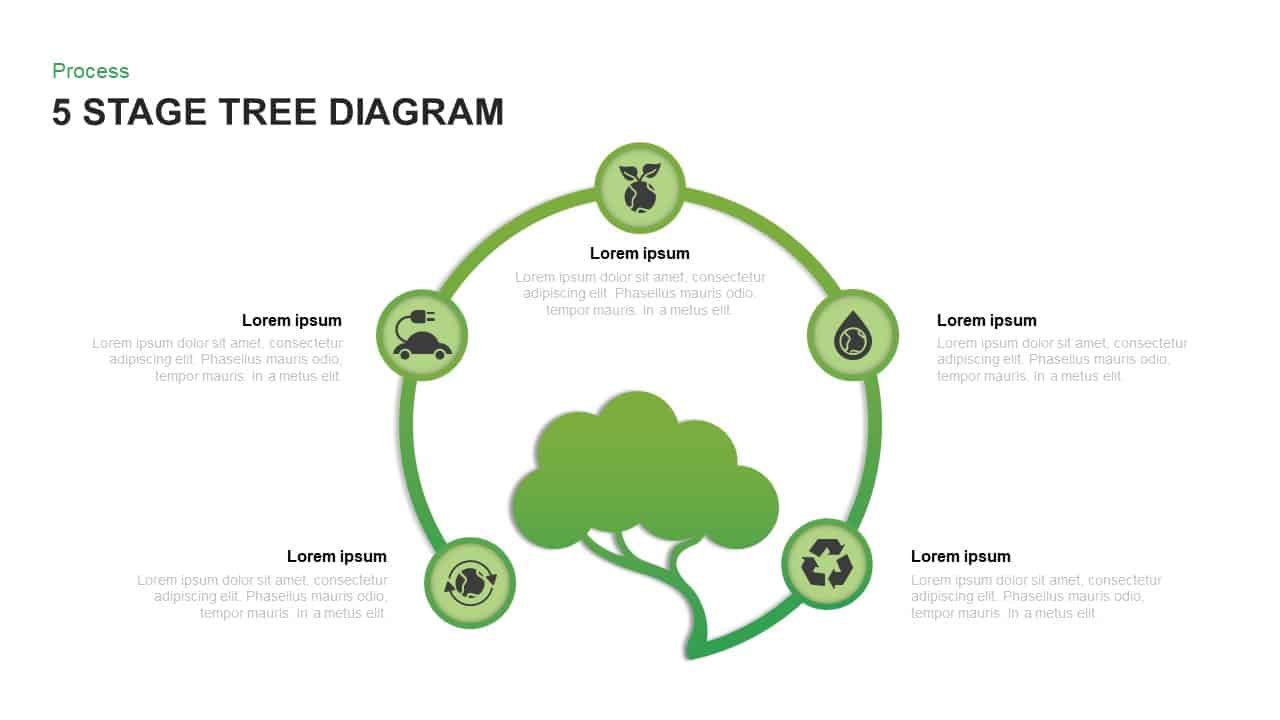
Five-Stage Eco Tree Process Diagram Template for PowerPoint & Google Slides
Process
Six-Stage Circular Diagram Process Template for PowerPoint & Google Slides
Circular
Three-Way Decision Process Arrow Diagram Template for PowerPoint & Google Slides
Arrow
Five Stage Circular Arrow Diagram Template for PowerPoint & Google Slides
Process
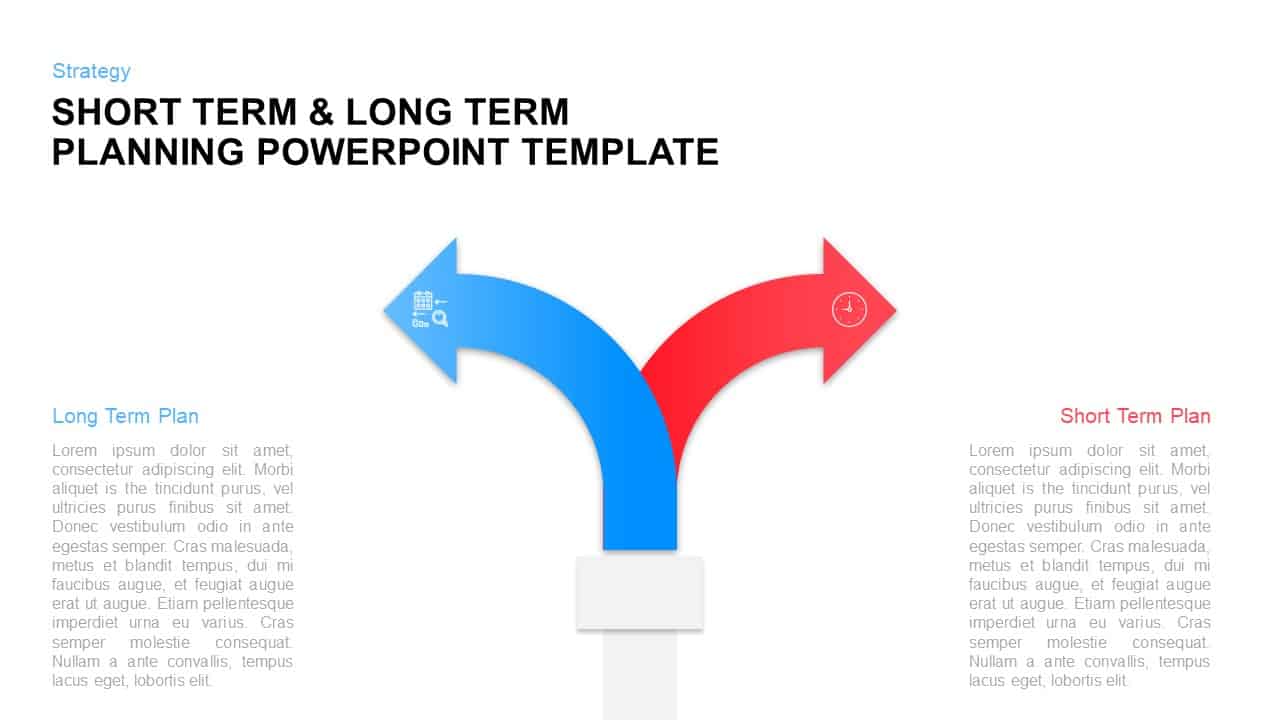
Long-Term vs Short-Term Planning Diagram Template for PowerPoint & Google Slides
Comparison
Three-Step Flowchart Process Diagram Template for PowerPoint & Google Slides
Flow Charts
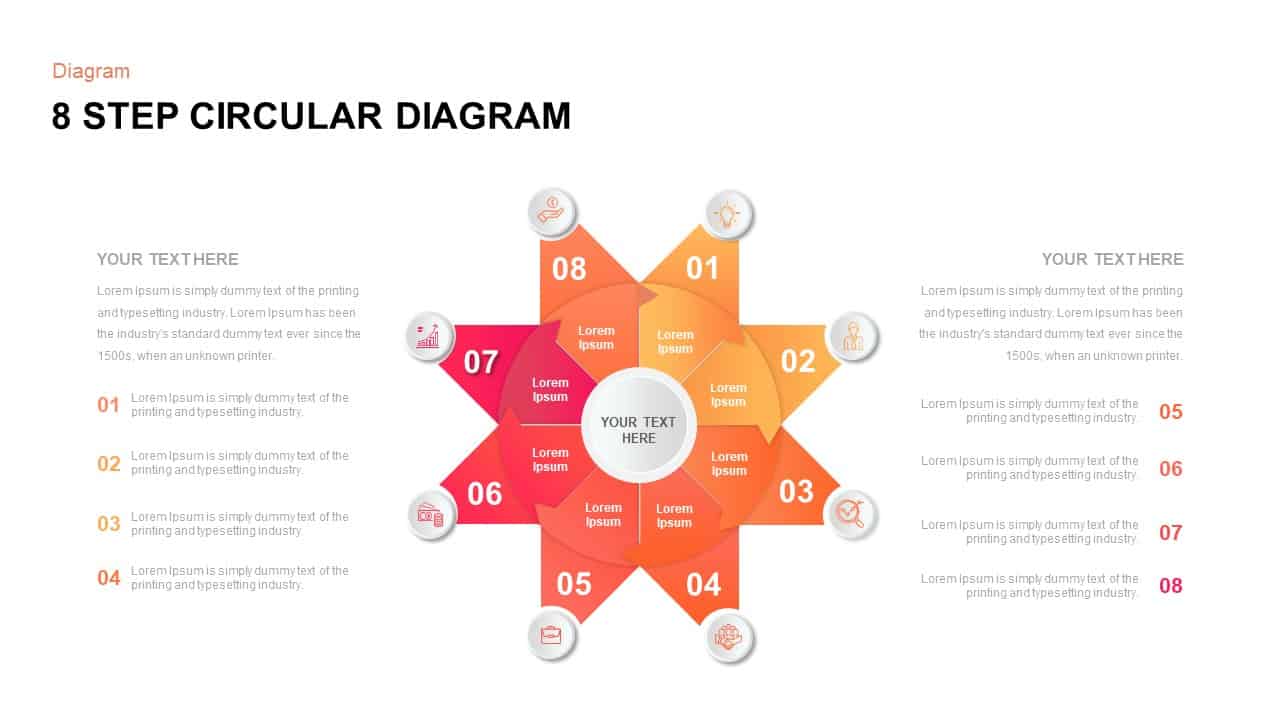
Eight Step Circular Diagram Template for PowerPoint & Google Slides
Circular
Four-Part SWOT Analysis Diagram Template for PowerPoint & Google Slides
SWOT
Fishbone Cause Analysis Diagram Template for PowerPoint & Google Slides
Process

Modern 6-Step Cycle Diagram Slide Deck Template for PowerPoint & Google Slides
Process
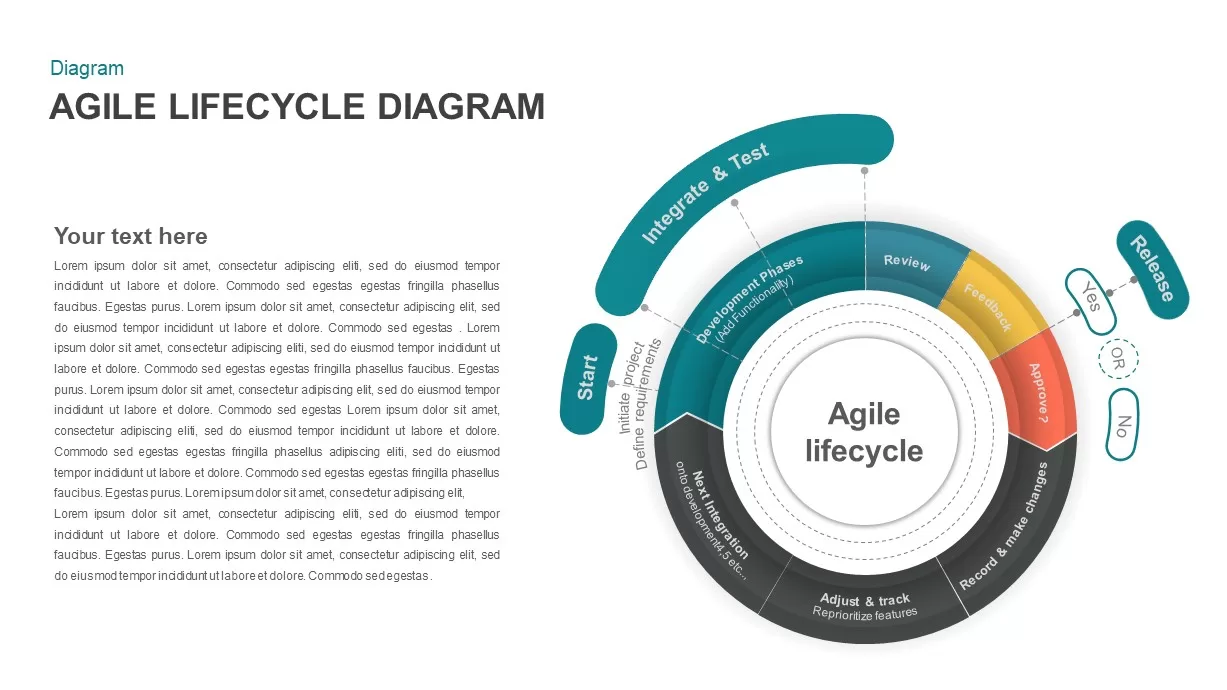
Agile Lifecycle Circular Diagram Template for PowerPoint & Google Slides
Circular
Eight-Node Mind Map Infographic Diagram Template for PowerPoint & Google Slides
Mind Maps
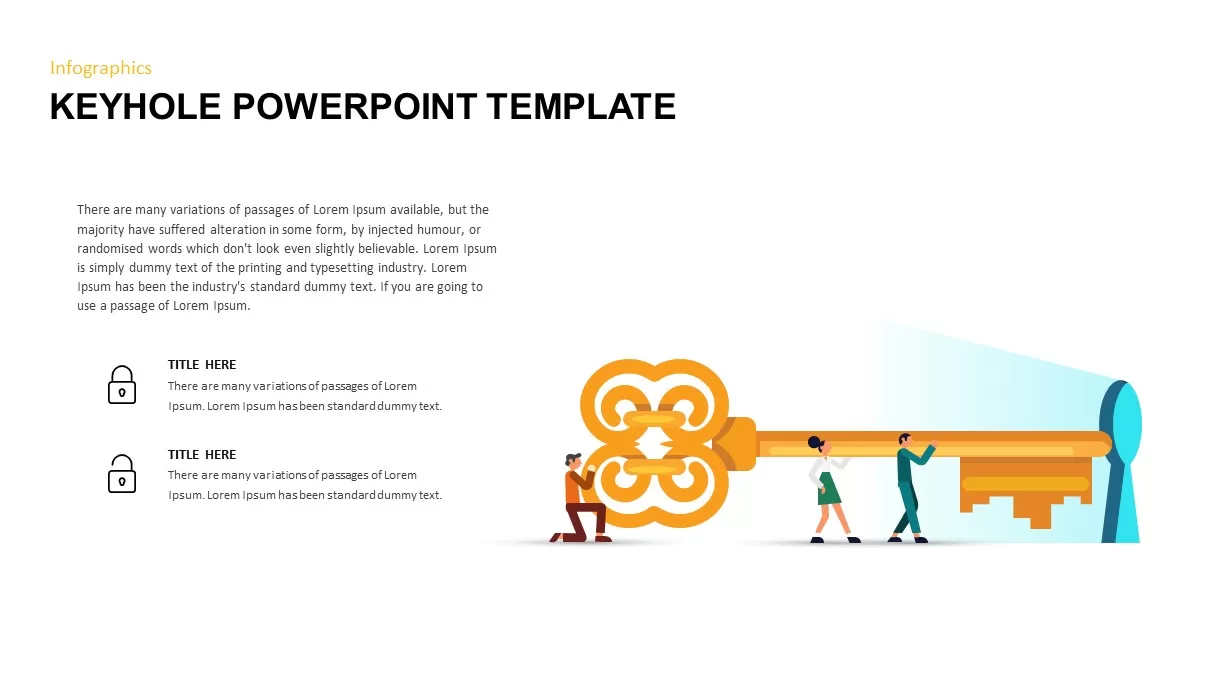
Keyhole Infographic Process Diagram Template for PowerPoint & Google Slides
Process
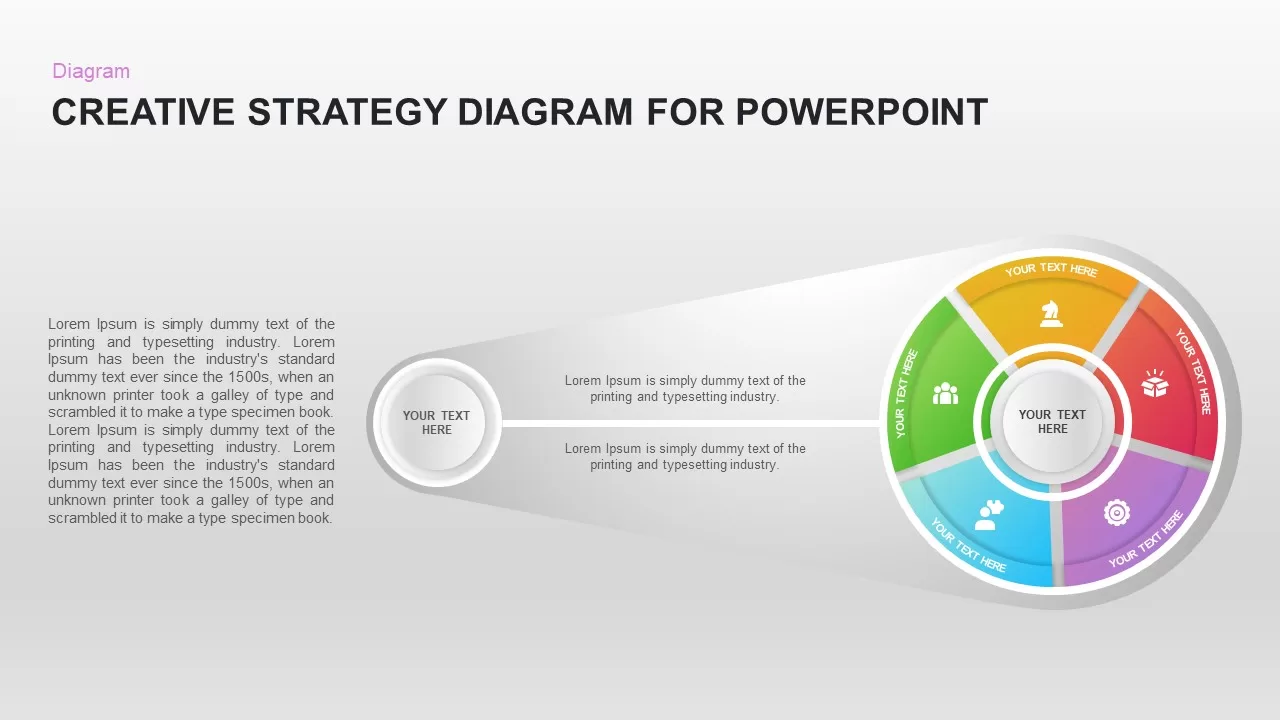
Creative Strategy Diagram Template for PowerPoint & Google Slides
Business Strategy
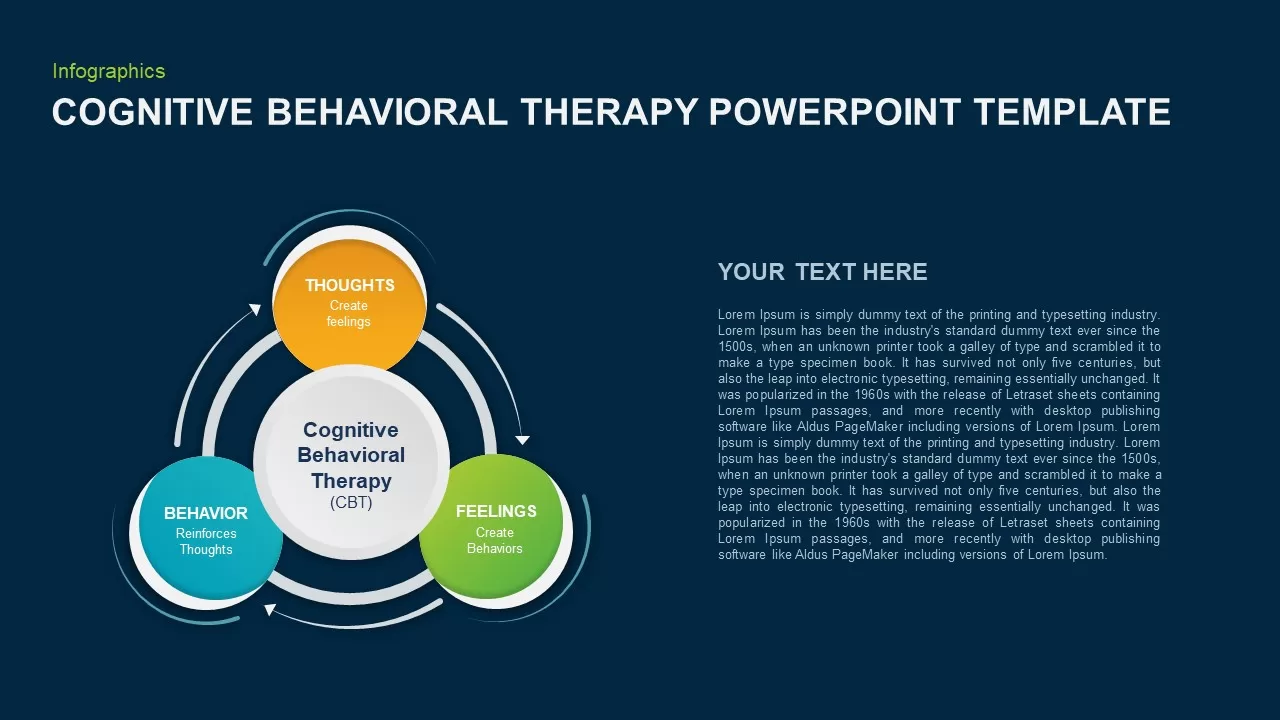
Cognitive Behavioral Therapy Diagram Template for PowerPoint & Google Slides
Health
Circular 3D Cube Six-Segment Diagram Template for PowerPoint & Google Slides
Infographics
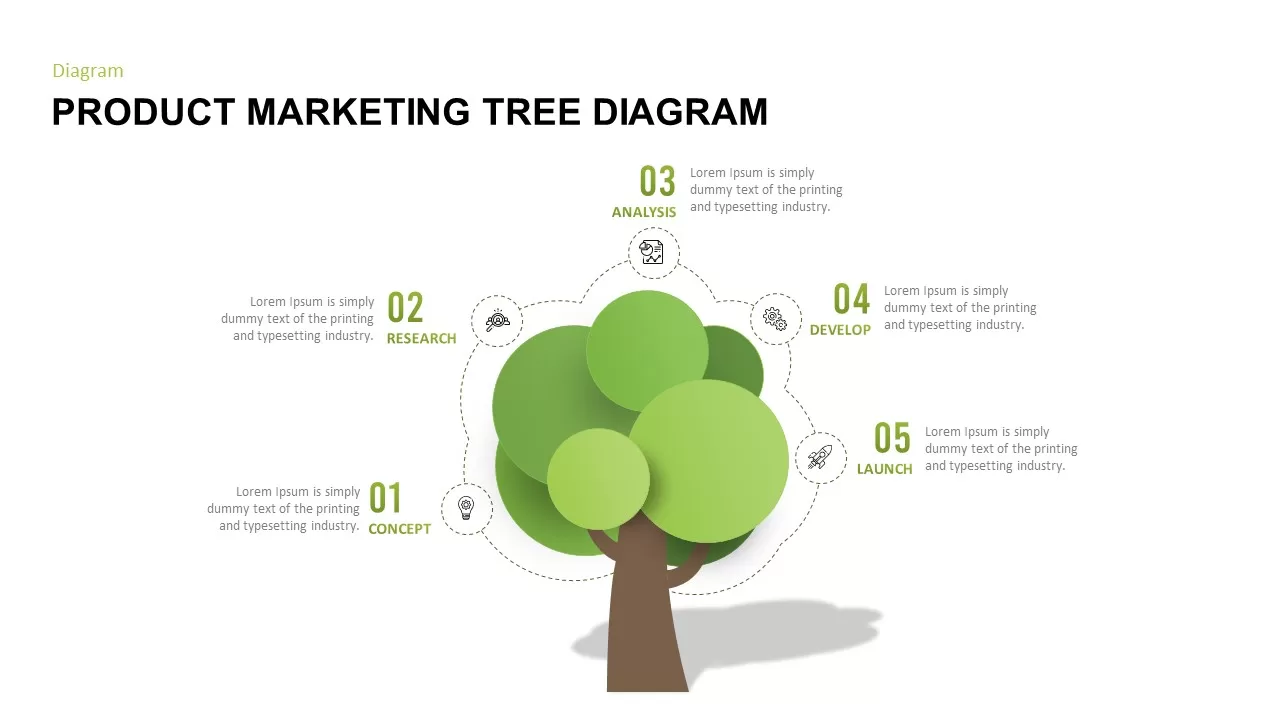
Product Marketing Tree Diagram Template for PowerPoint & Google Slides
Marketing
IQ Scale Analysis Diagram template for PowerPoint & Google Slides
Employee Performance
Circular Business Ecosystem Diagram Template for PowerPoint & Google Slides
Business Strategy
Five-Stage Digital Maturity Model Diagram Template for PowerPoint & Google Slides
Process
Onion Layer Infographic Diagram Template for PowerPoint & Google Slides
Process
Core Values Infographic Diagram Template for PowerPoint & Google Slides
Circular
Gear Process Diagram Template for PowerPoint & Google Slides
Process
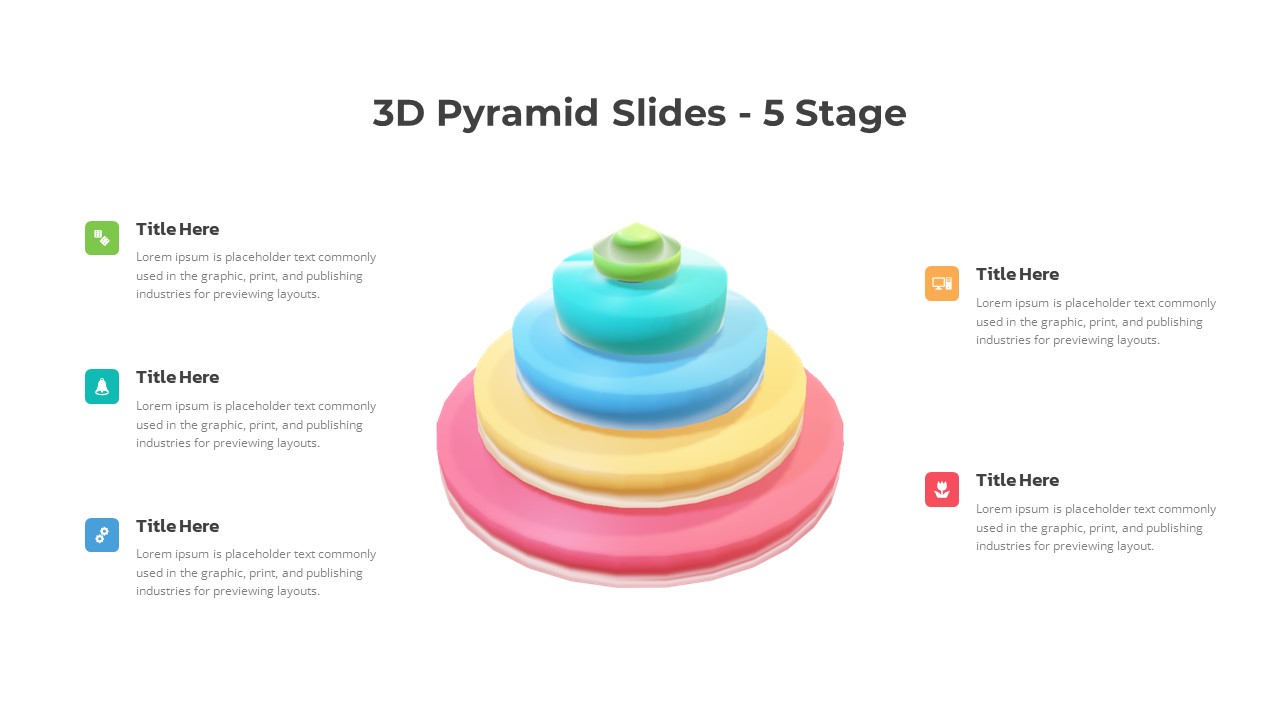
3D Five-Stage Pyramid Diagram Slide Template for PowerPoint & Google Slides
Pyramid
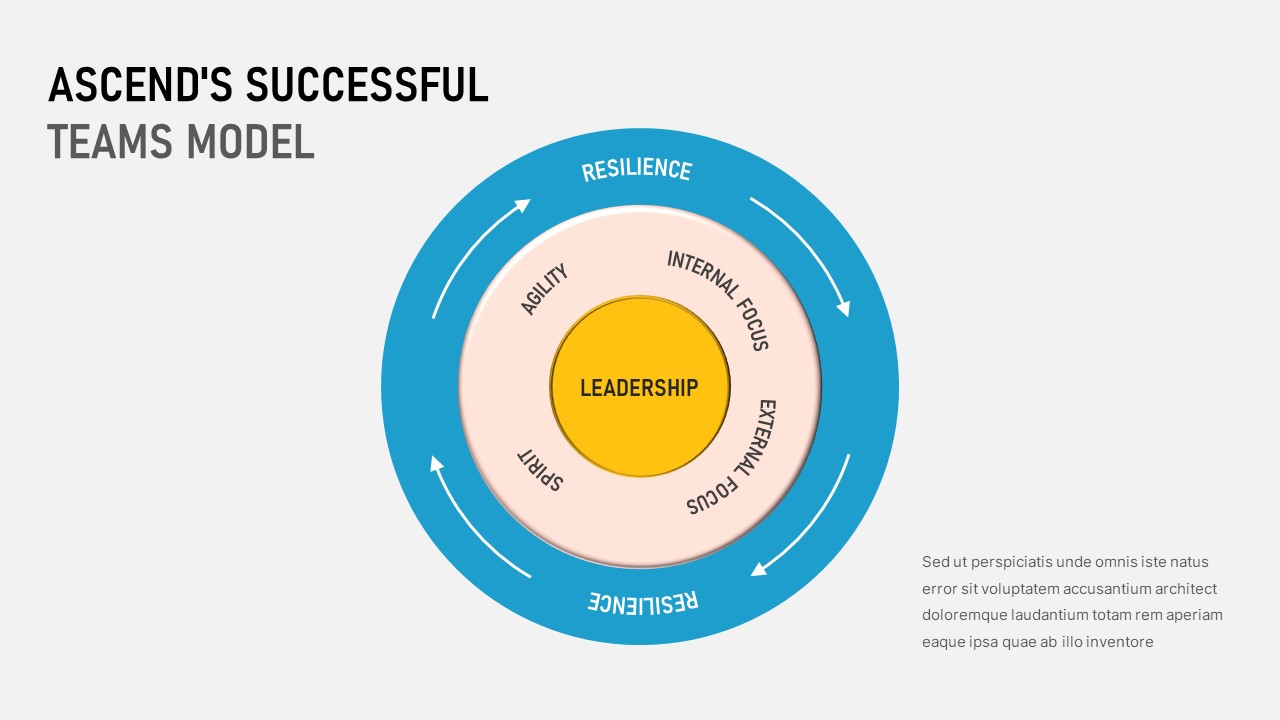
Ascend’s Successful Teams Diagram Template for PowerPoint & Google Slides
Circular
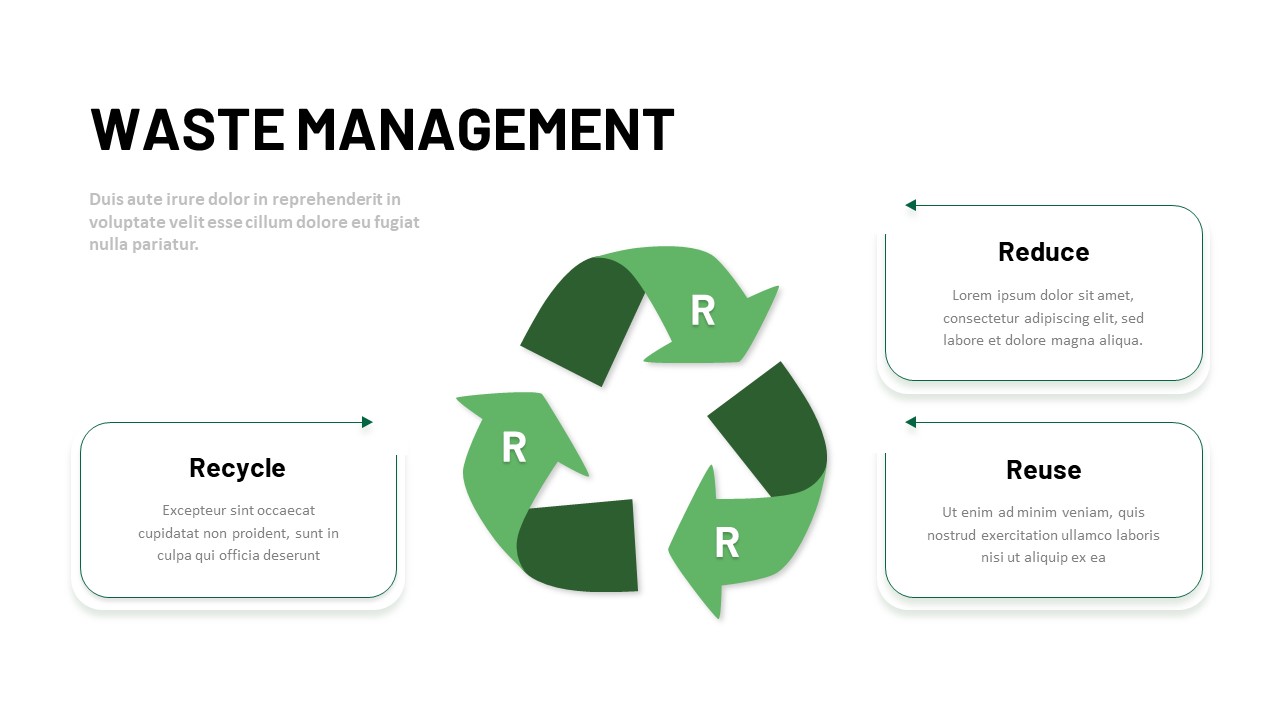
3R Waste Management Cycle Diagram Template for PowerPoint & Google Slides
Circular
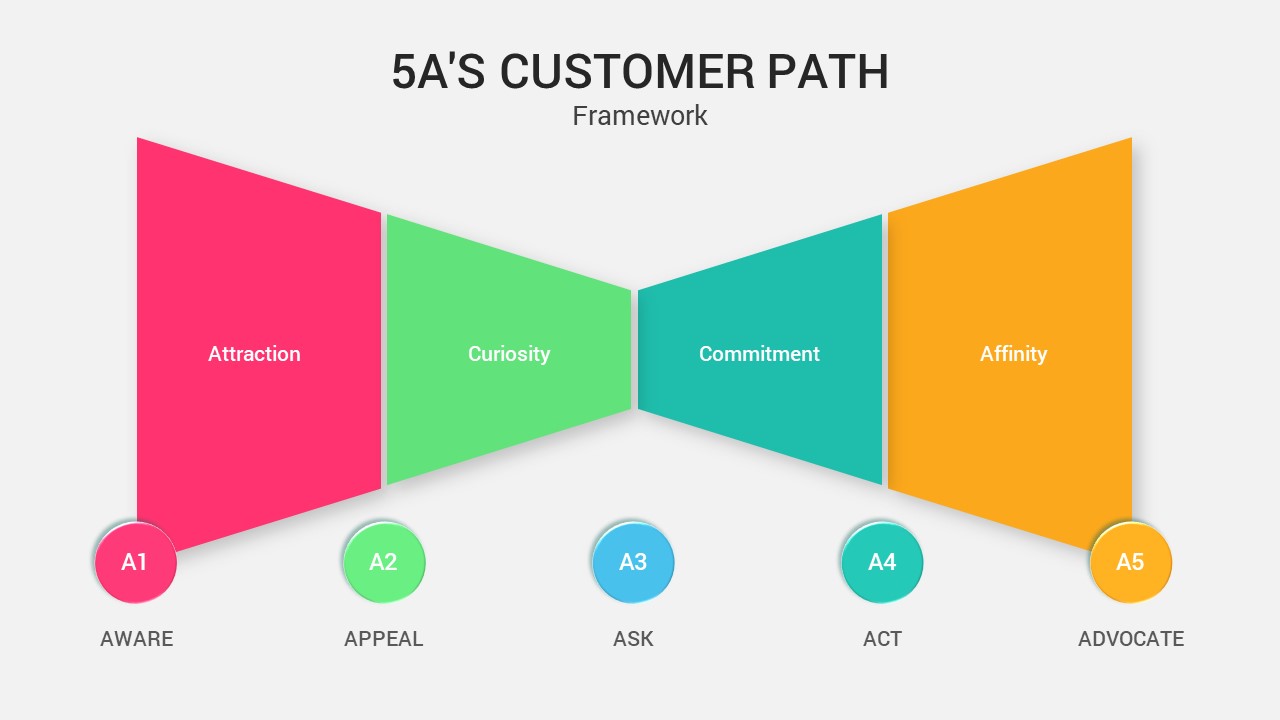
5A’s Customer Path Framework Diagram Template for PowerPoint & Google Slides
Process
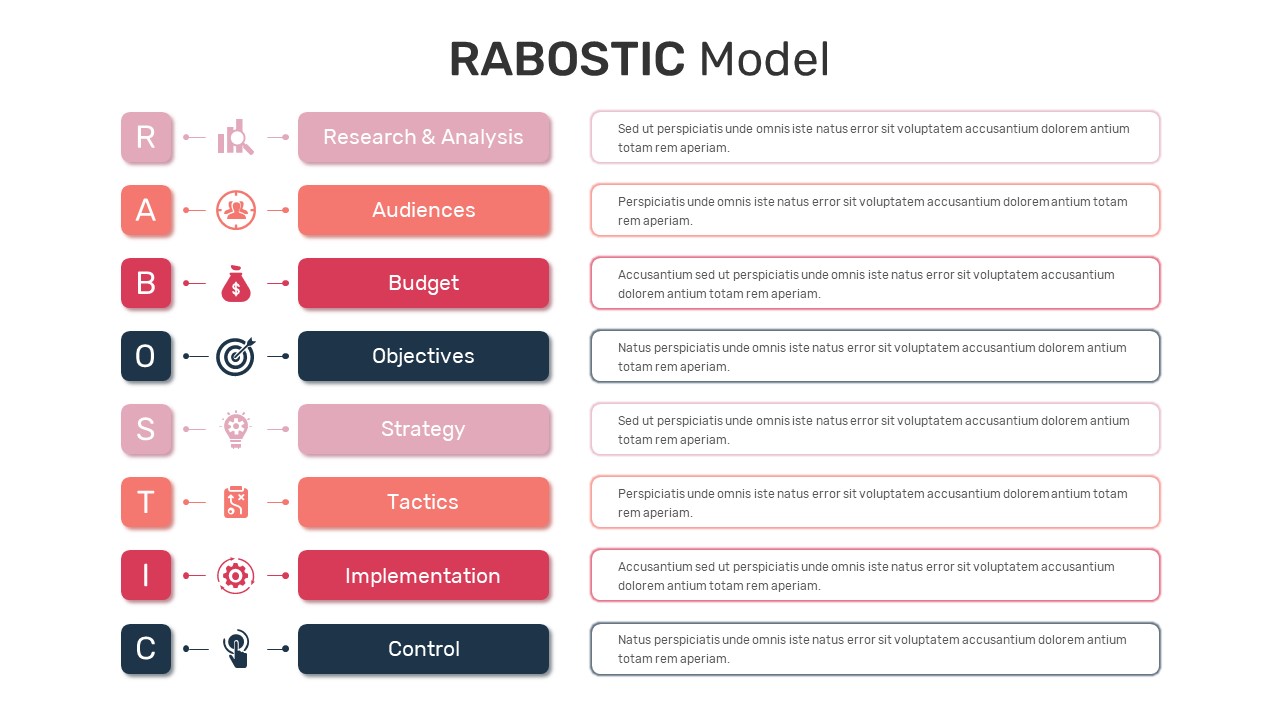
RABOSTIC Marketing Model Process Diagram Template for PowerPoint & Google Slides
Process
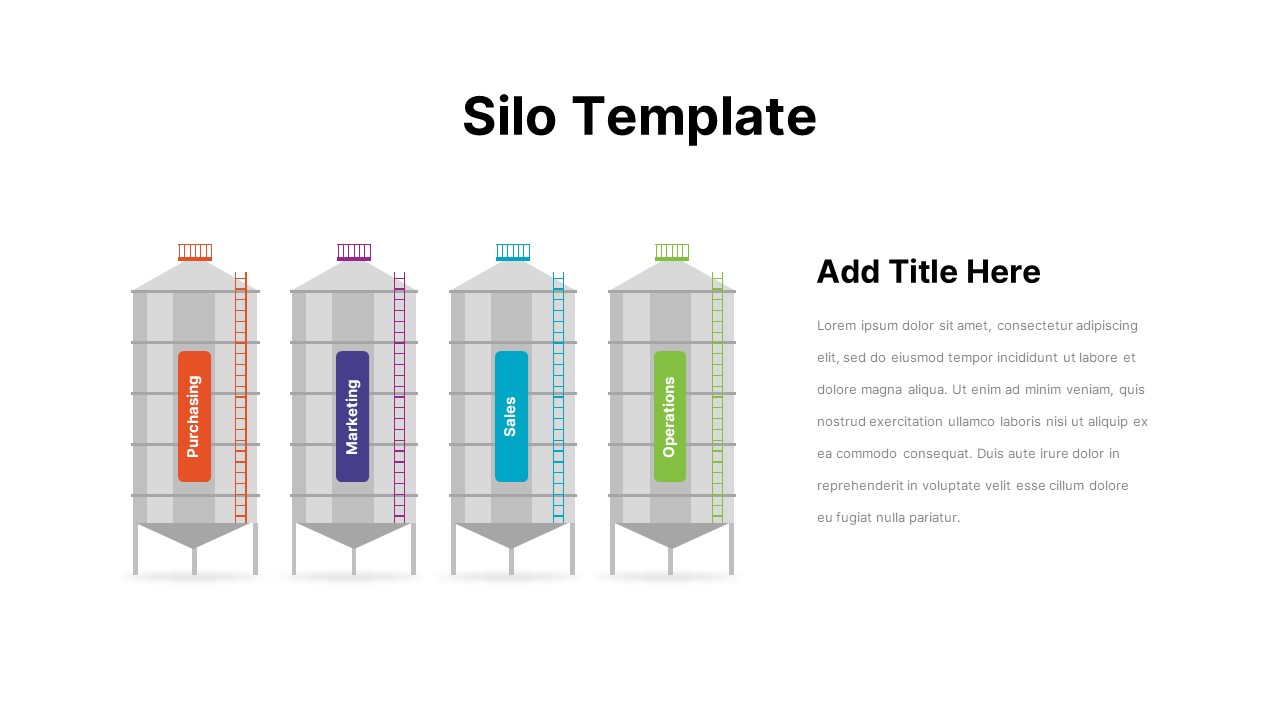
Business Silo Diagram Infographic Design Template for PowerPoint & Google Slides
Business
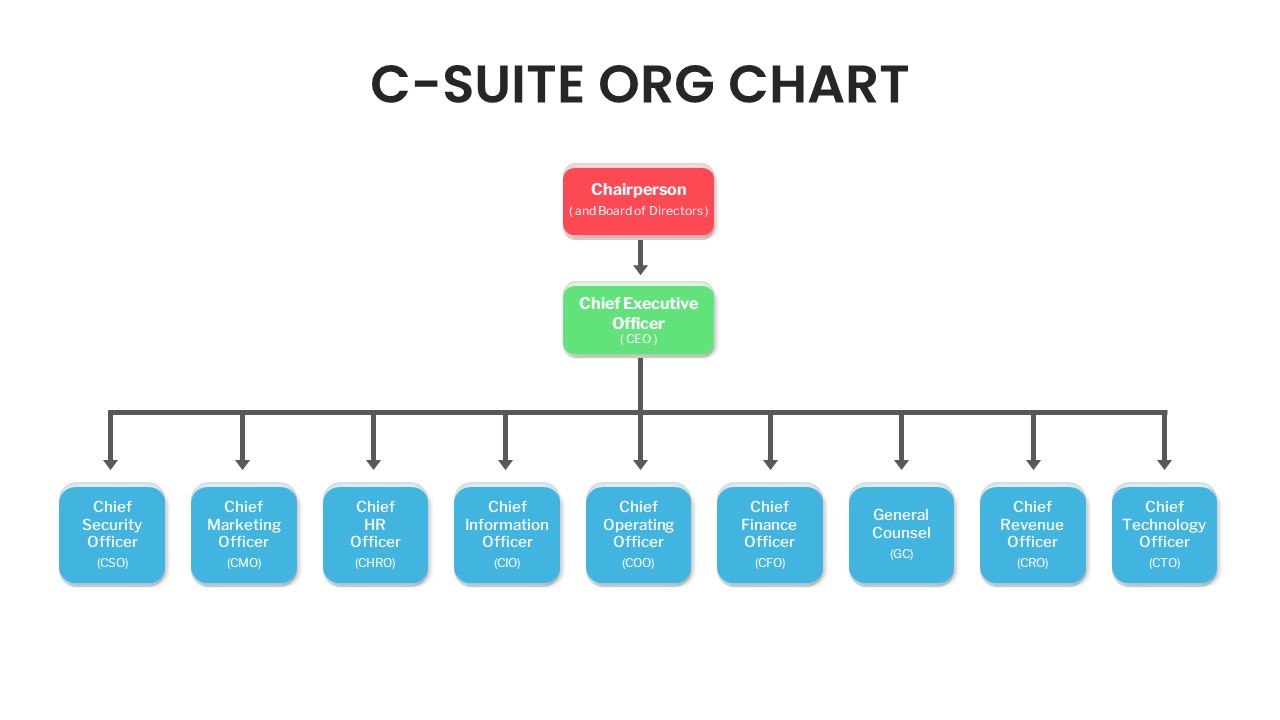
C-Suite Executive Org Chart Diagram Template for PowerPoint & Google Slides
Org Chart
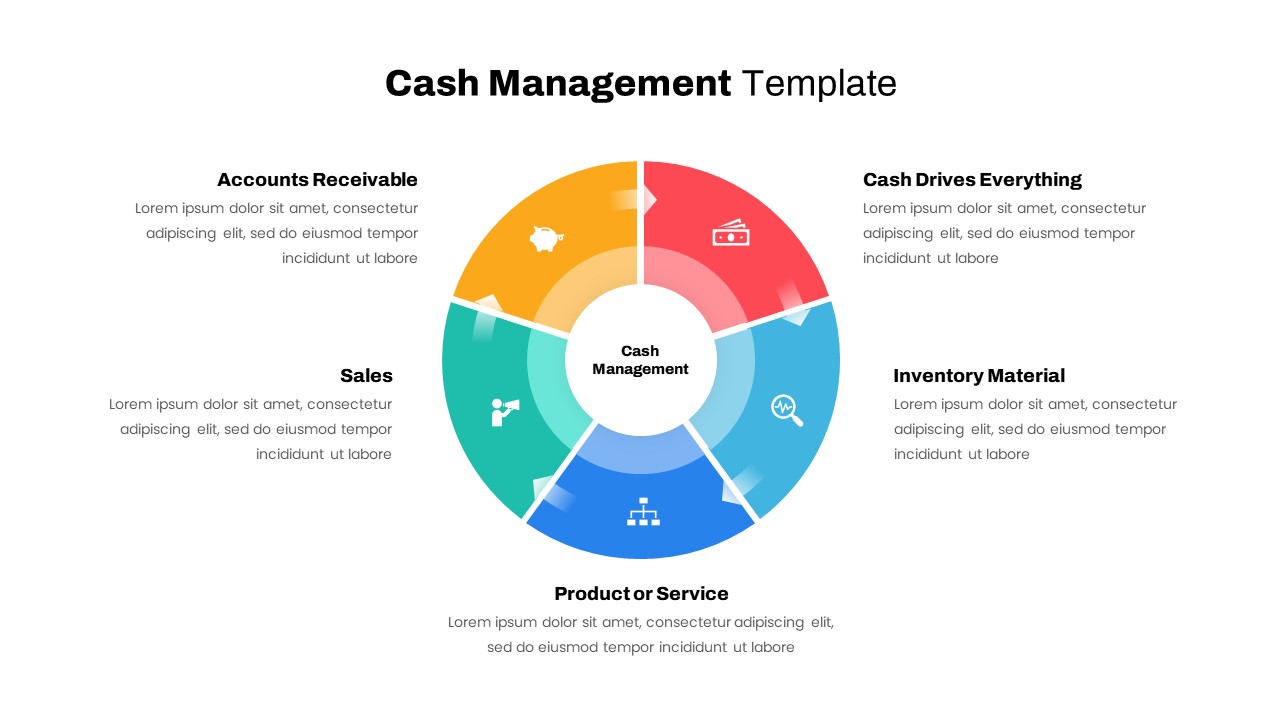
Cash Management Infographic Diagram Template for PowerPoint & Google Slides
Circular
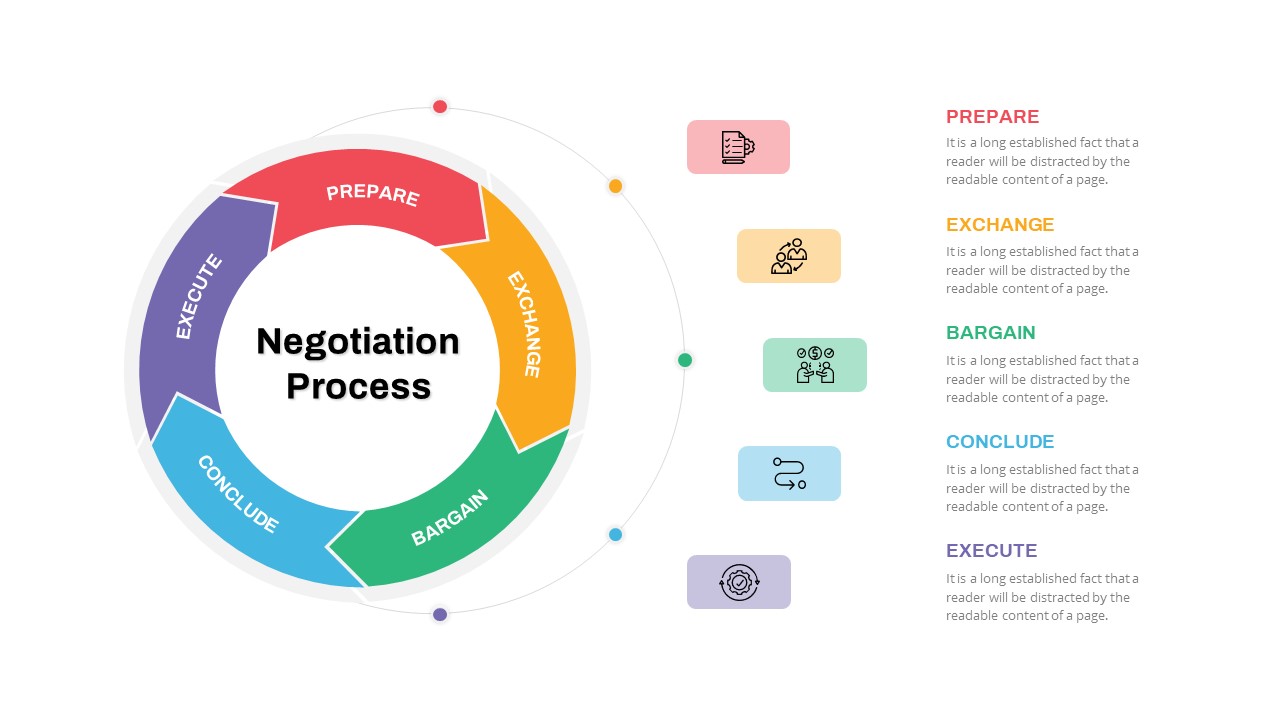
Negotiation Process Circular Diagram Template for PowerPoint & Google Slides
Circular
Business Process Analysis Cycle Diagram Template for PowerPoint & Google Slides
Business Strategy
Comprehensive Process Flow Diagram Template for PowerPoint & Google Slides
Process
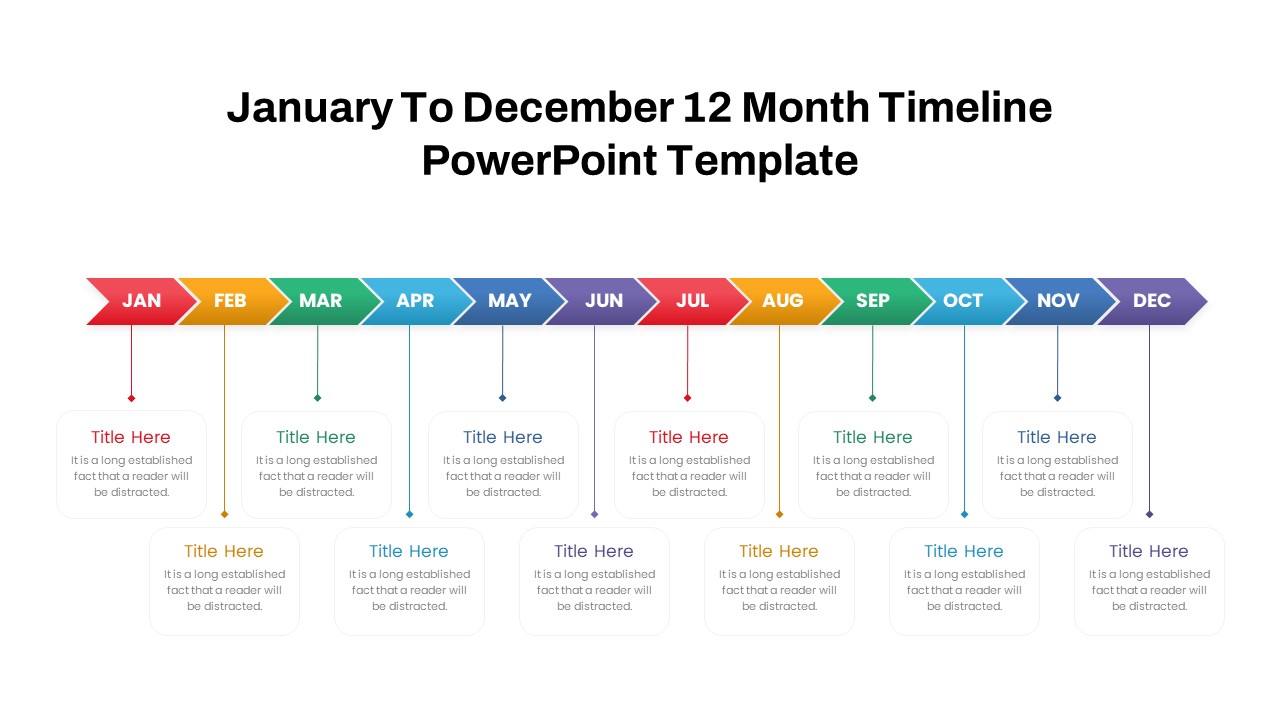
12-Month Timeline Diagram Template for PowerPoint & Google Slides
Timeline
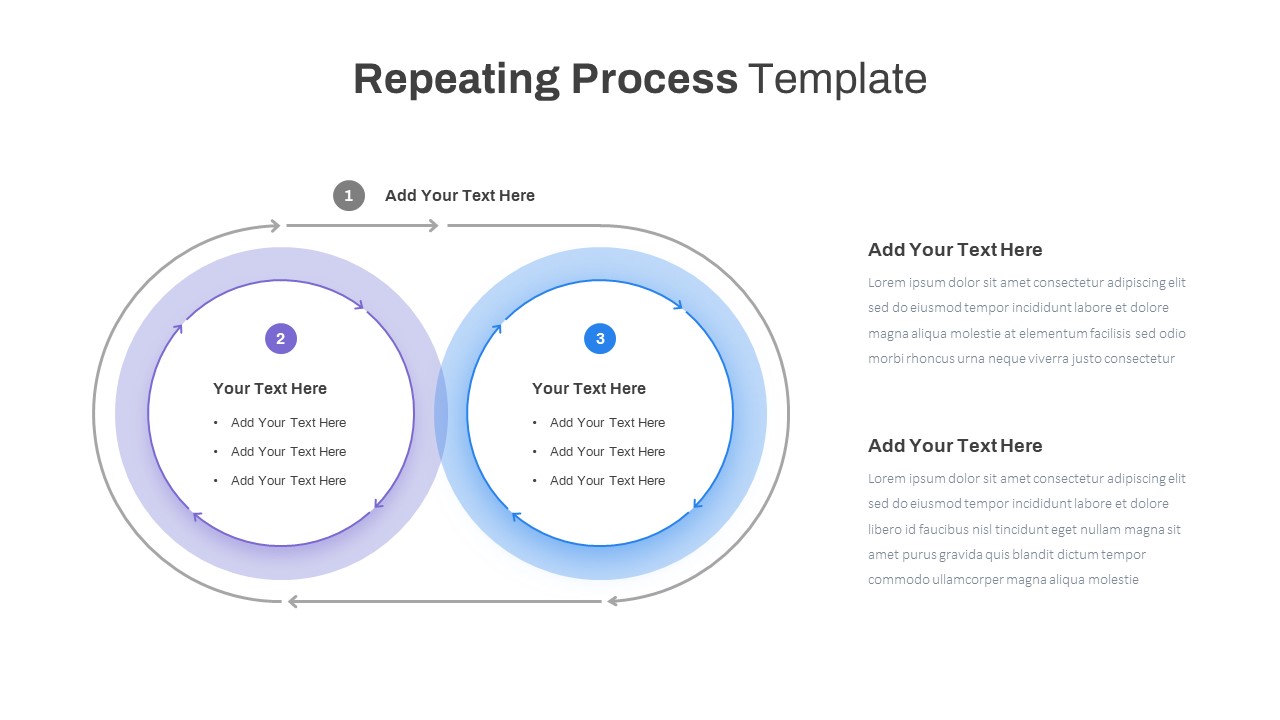
Repeating Overlapping Process Diagram Template for PowerPoint & Google Slides
Process
Animated Gears Process Flow Diagram Template for PowerPoint & Google Slides
Process
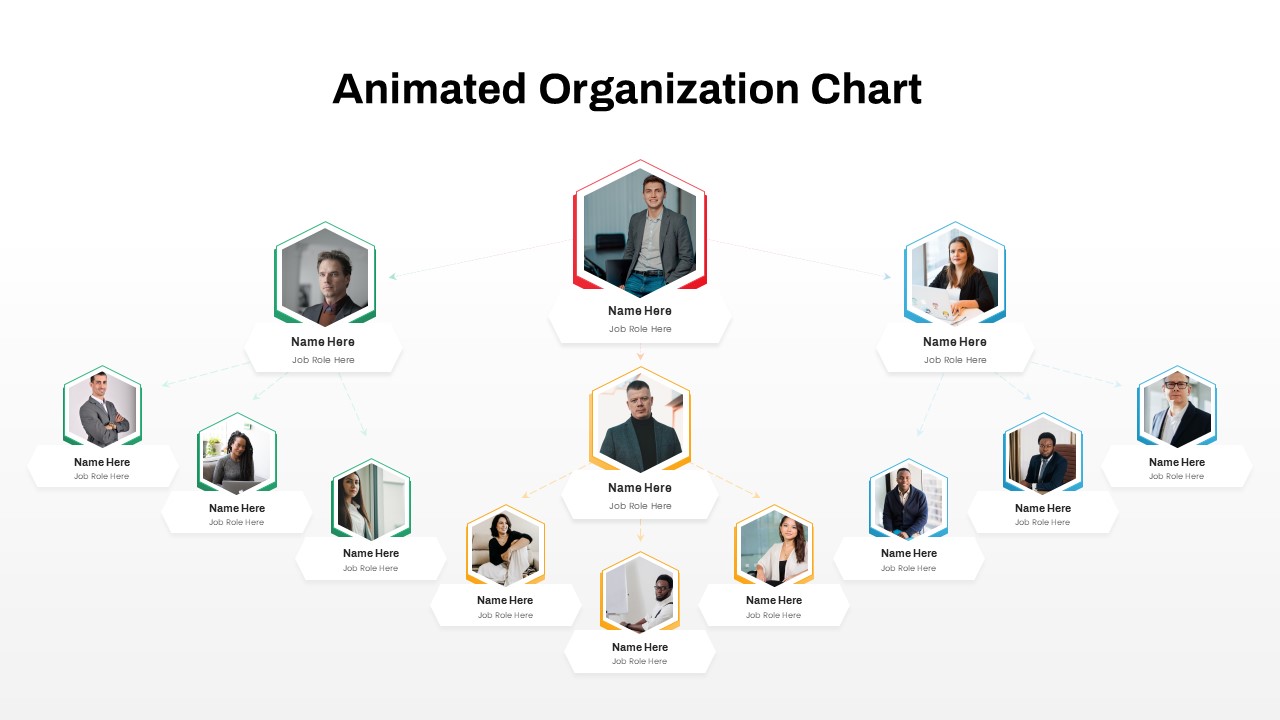
Animated Hexagon Org Chart Diagram Template for PowerPoint & Google Slides
Org Chart
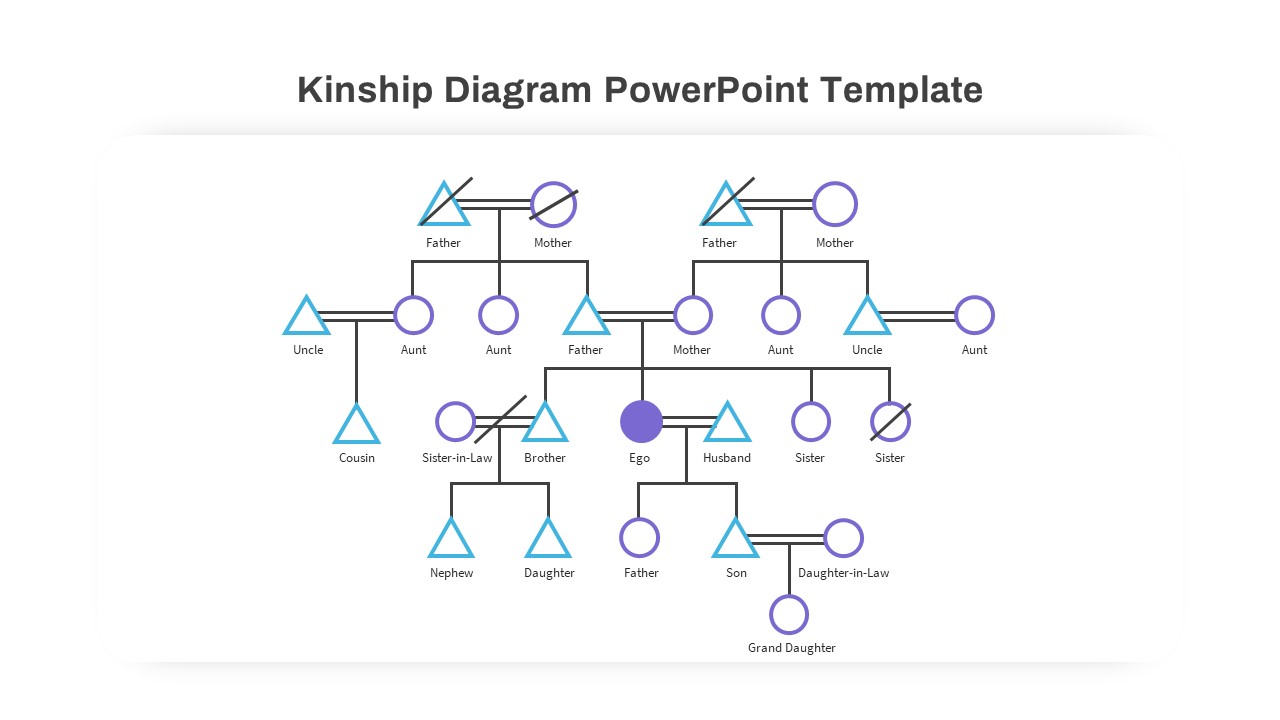
Elegant Kinship Diagram Family Tree Template for PowerPoint & Google Slides
Org Chart
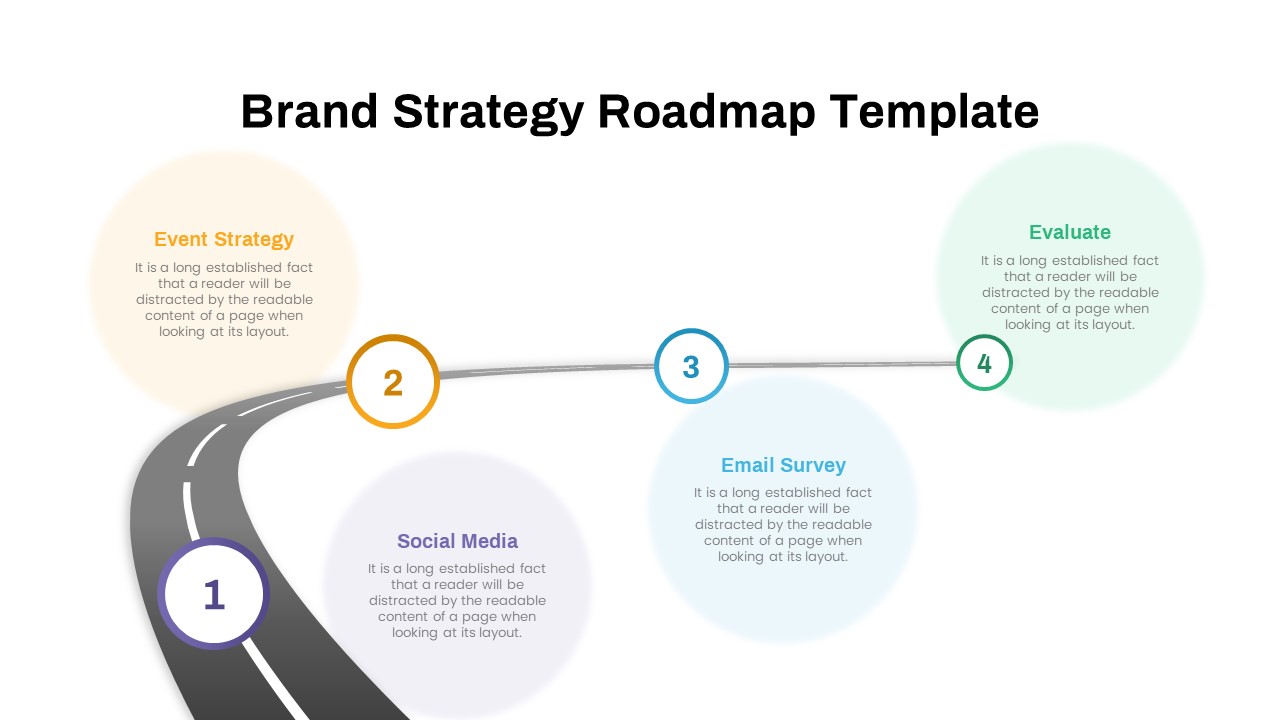
Brand Strategy Roadmap Diagram Template for PowerPoint & Google Slides
Roadmap
Multi-Level Wheel Chart Diagram template for PowerPoint & Google Slides
Pie/Donut
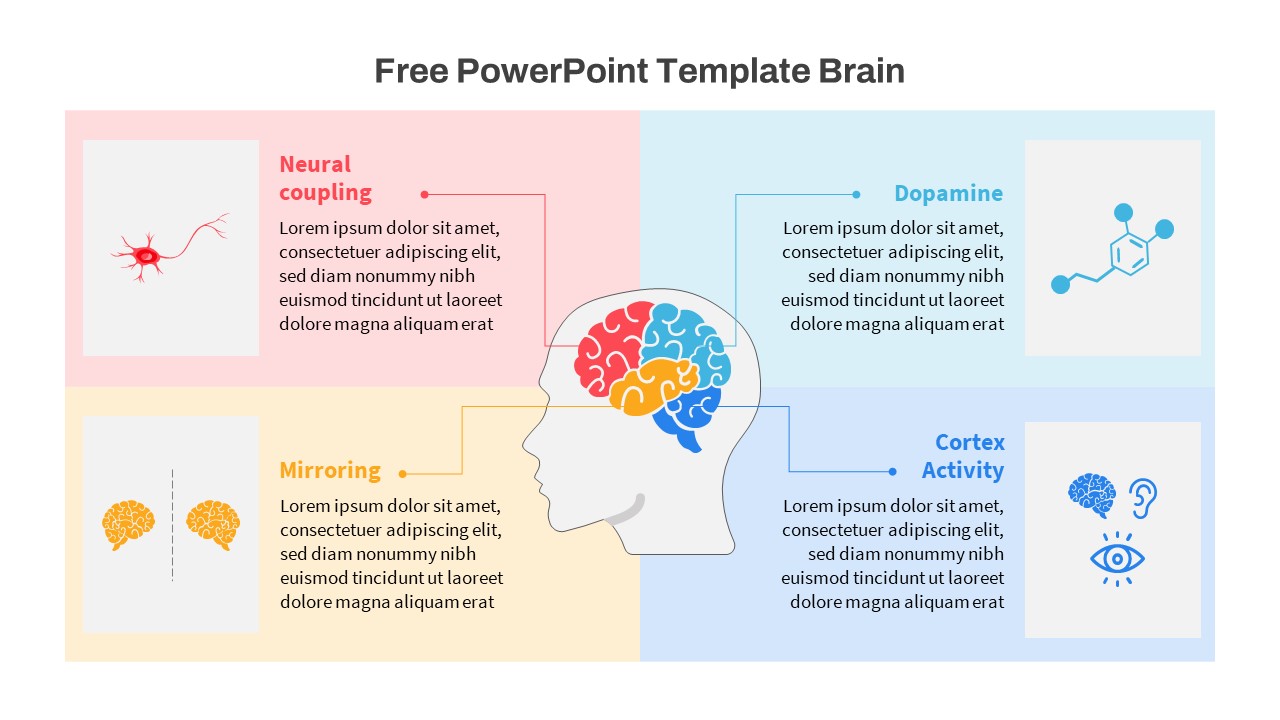
Free Brain Function Diagram Infographic Template for PowerPoint & Google Slides
Process
Free
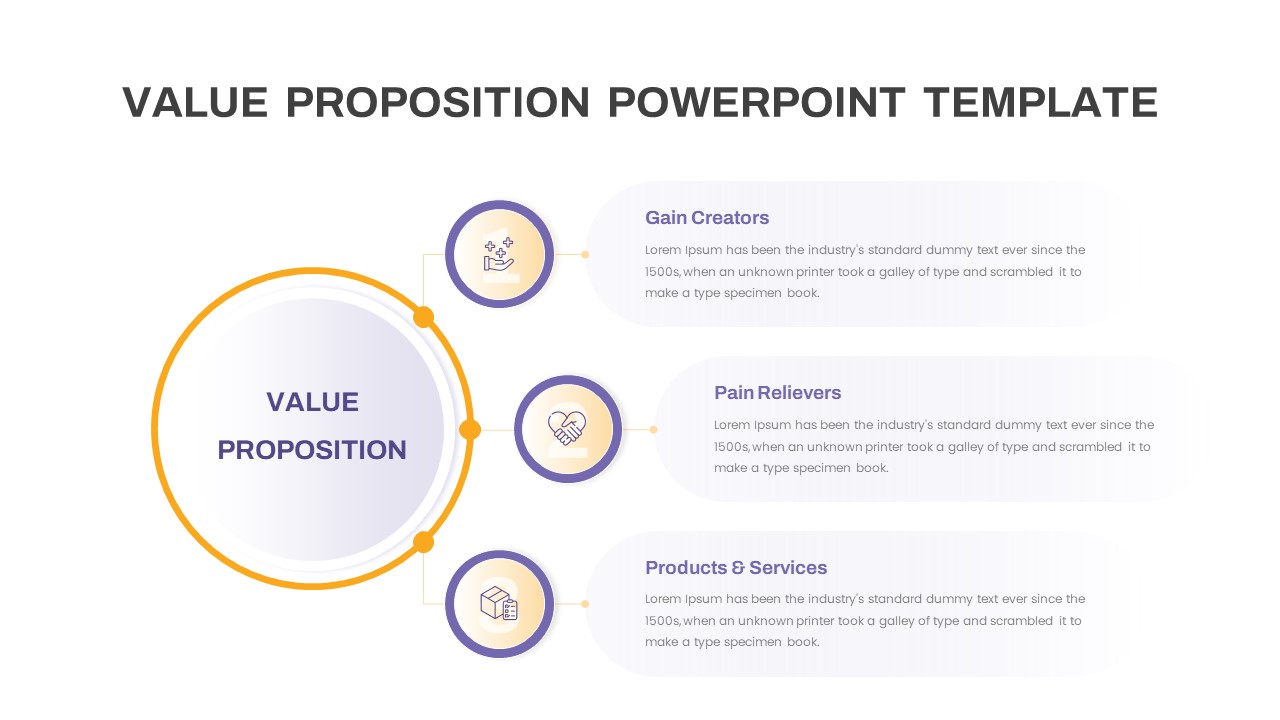
Free Value Proposition Diagram Template for PowerPoint & Google Slides
Business Strategy
Free
Impactful Newton’s Cradle Diagram Template for PowerPoint & Google Slides
Process
Colorful SWOT Analysis Diagram Template for PowerPoint & Google Slides
SWOT
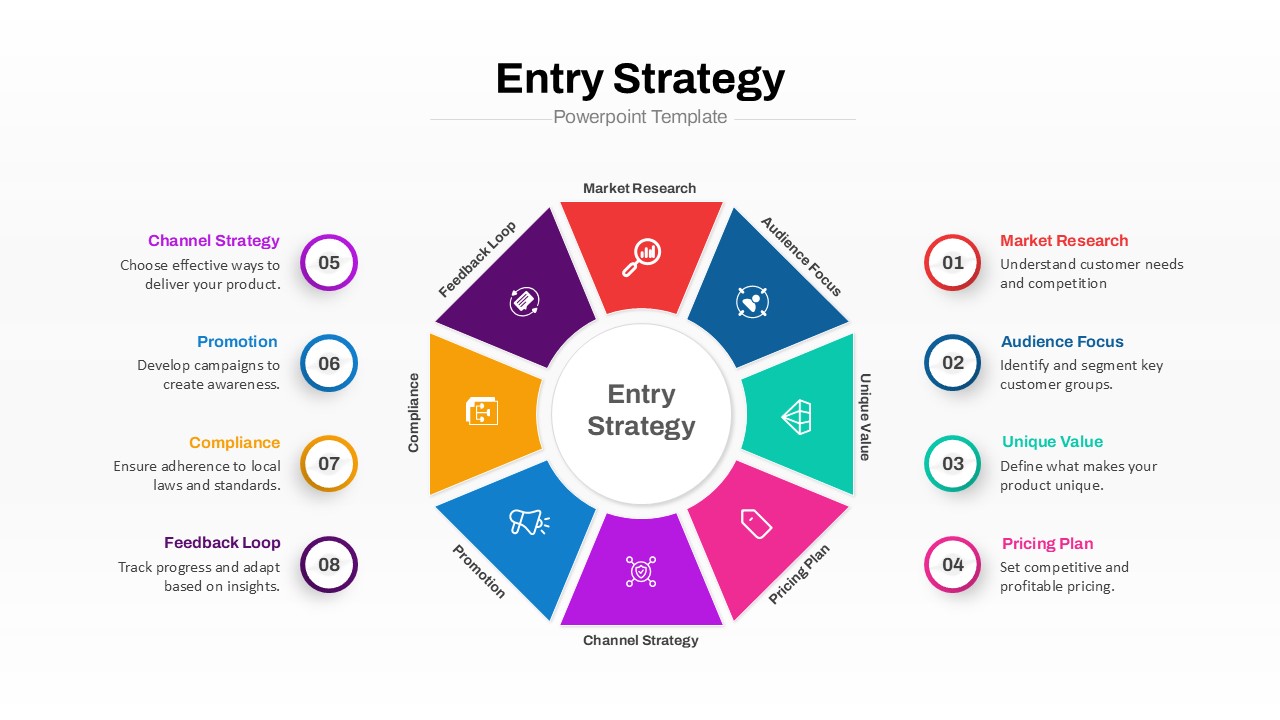
Entry Strategy Circular Diagram Template for PowerPoint & Google Slides
Circular
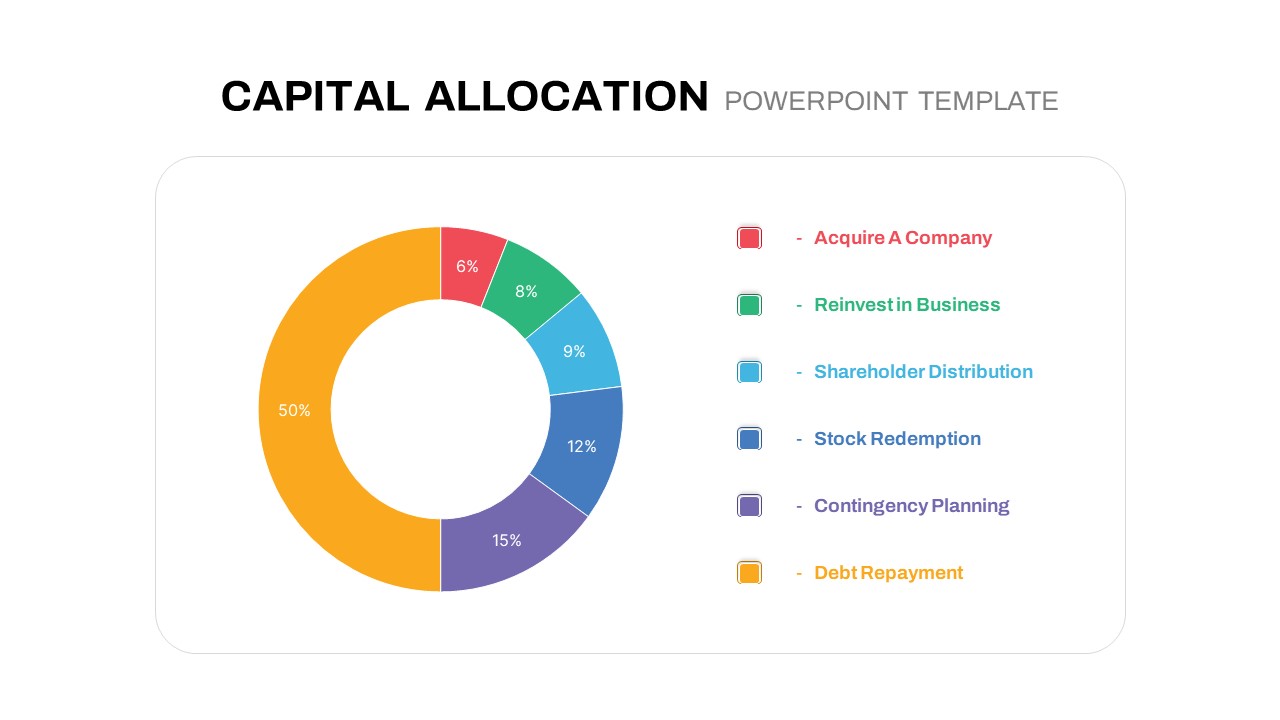
Circular Capital Allocation Diagram Template for PowerPoint & Google Slides
Business Models
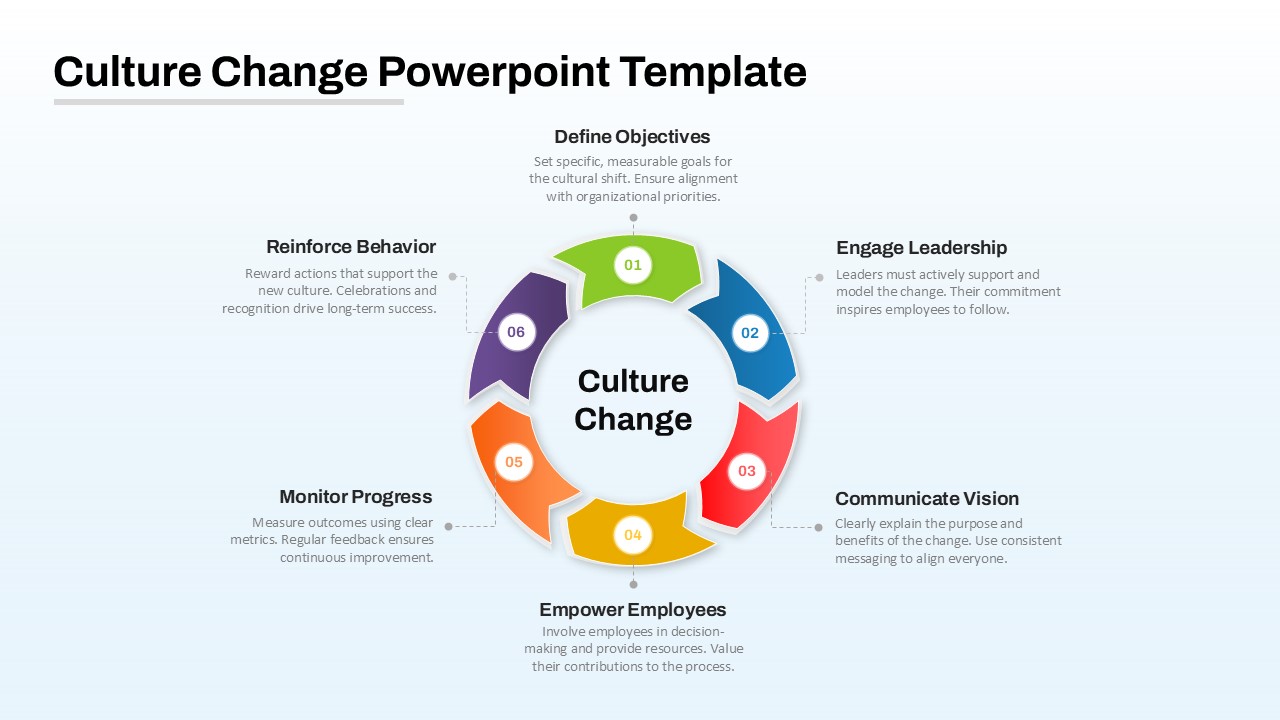
Culture Change Circular Process Diagram Template for PowerPoint & Google Slides
Process
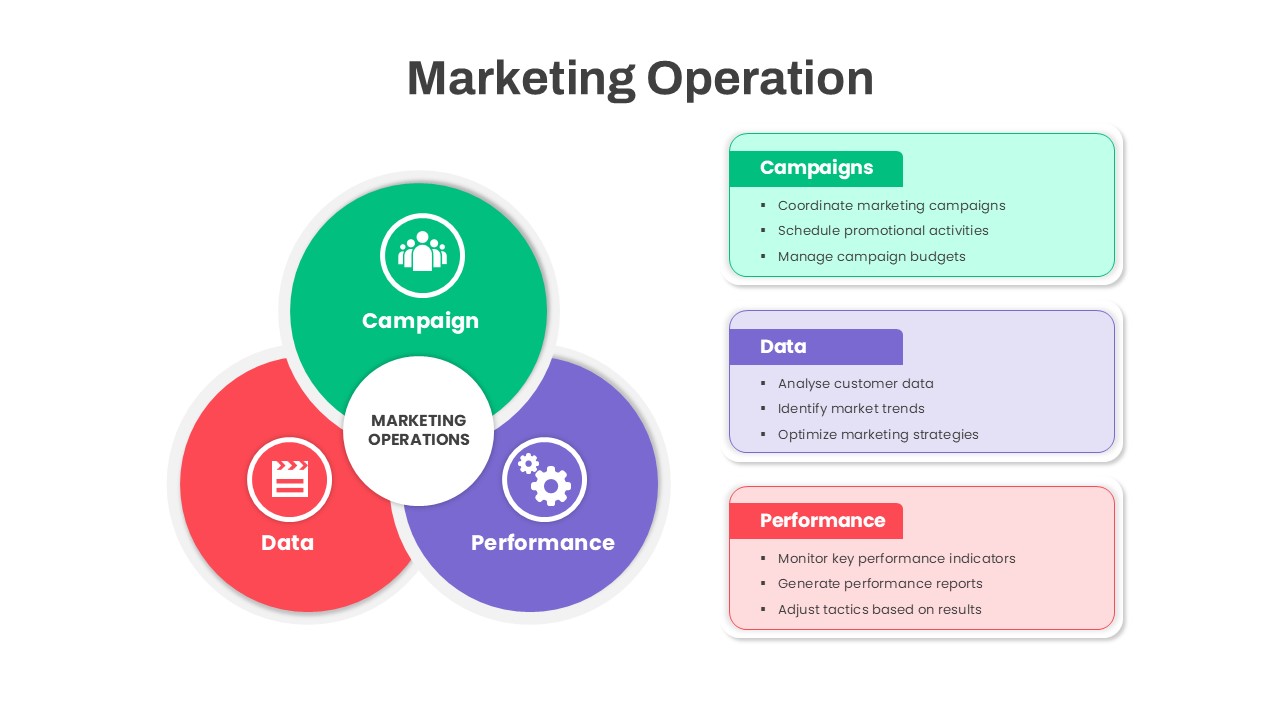
Marketing Operations Venn Diagram Template for PowerPoint & Google Slides
Circular
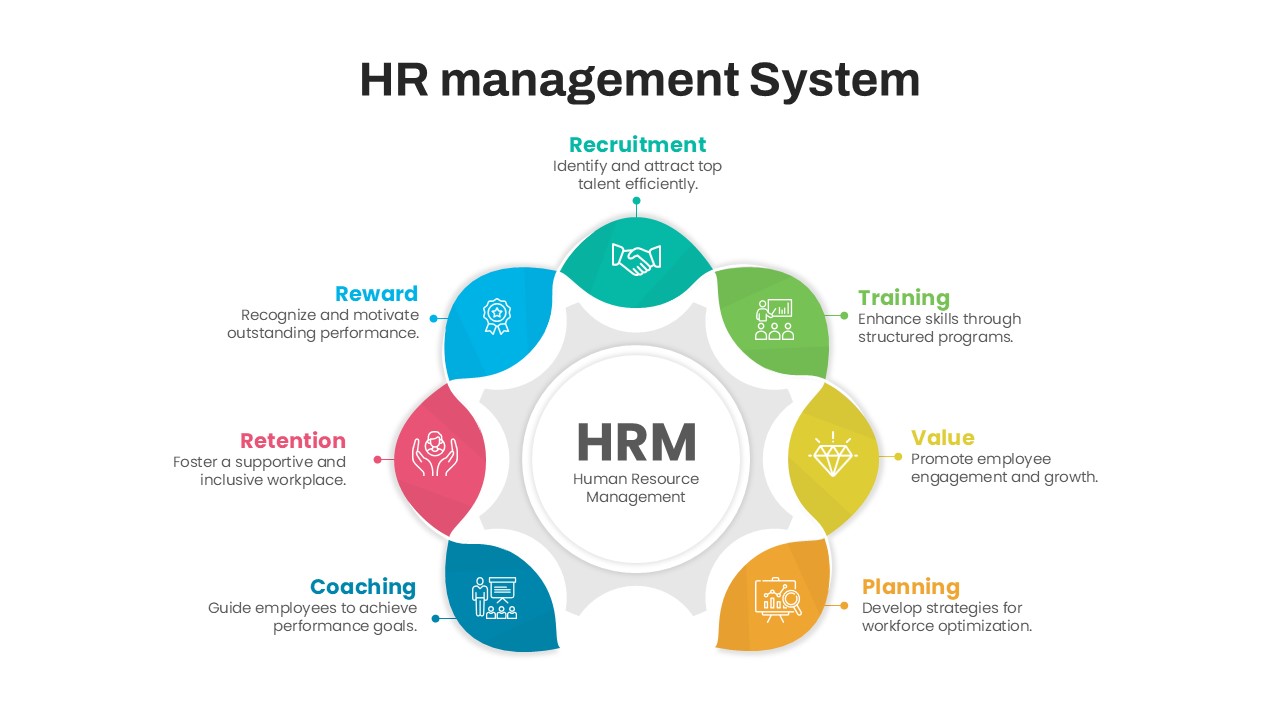
HR Management System Lifecycle Diagram Template for PowerPoint & Google Slides
Recruitment
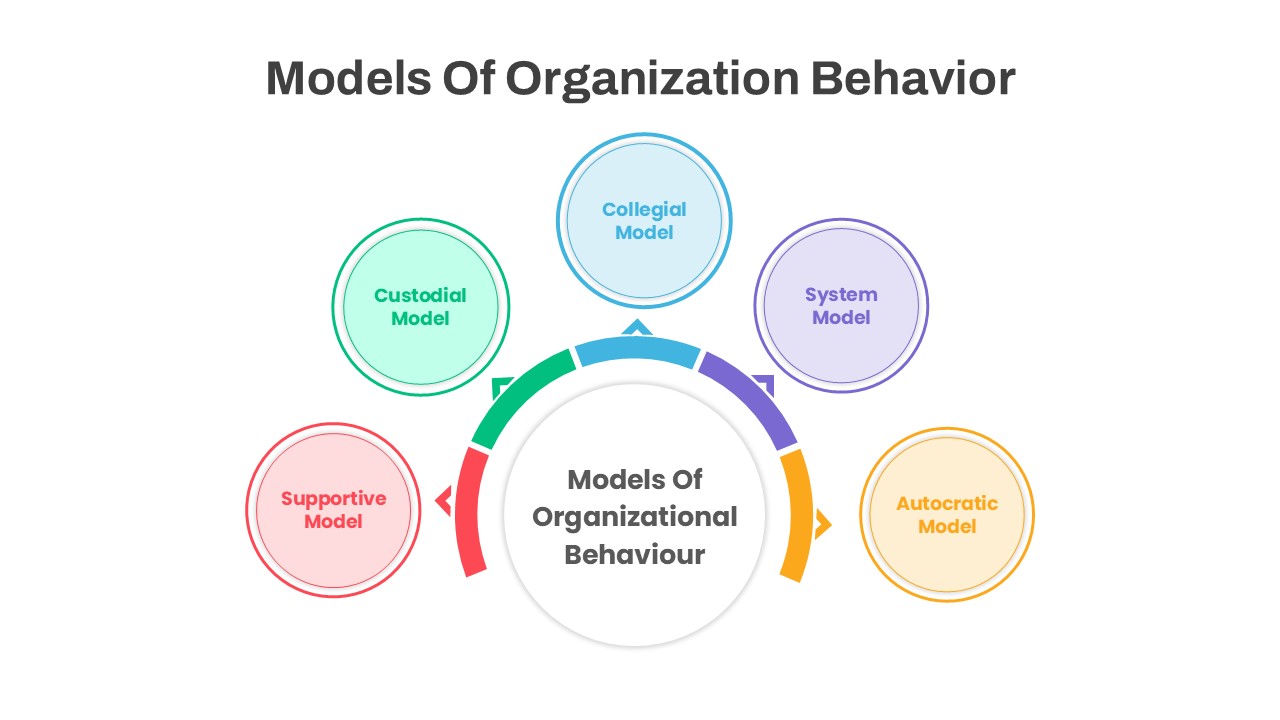
Organizational Behavior Hexagon Diagram Template for PowerPoint & Google Slides
Circular
Two-Sided Coin Comparison Diagram Template for PowerPoint & Google Slides
Comparison
Change Management Process Cycle Diagram Template for PowerPoint & Google Slides
Process
Data-Driven Marketing Lifecycle Diagram Template for PowerPoint & Google Slides
Process
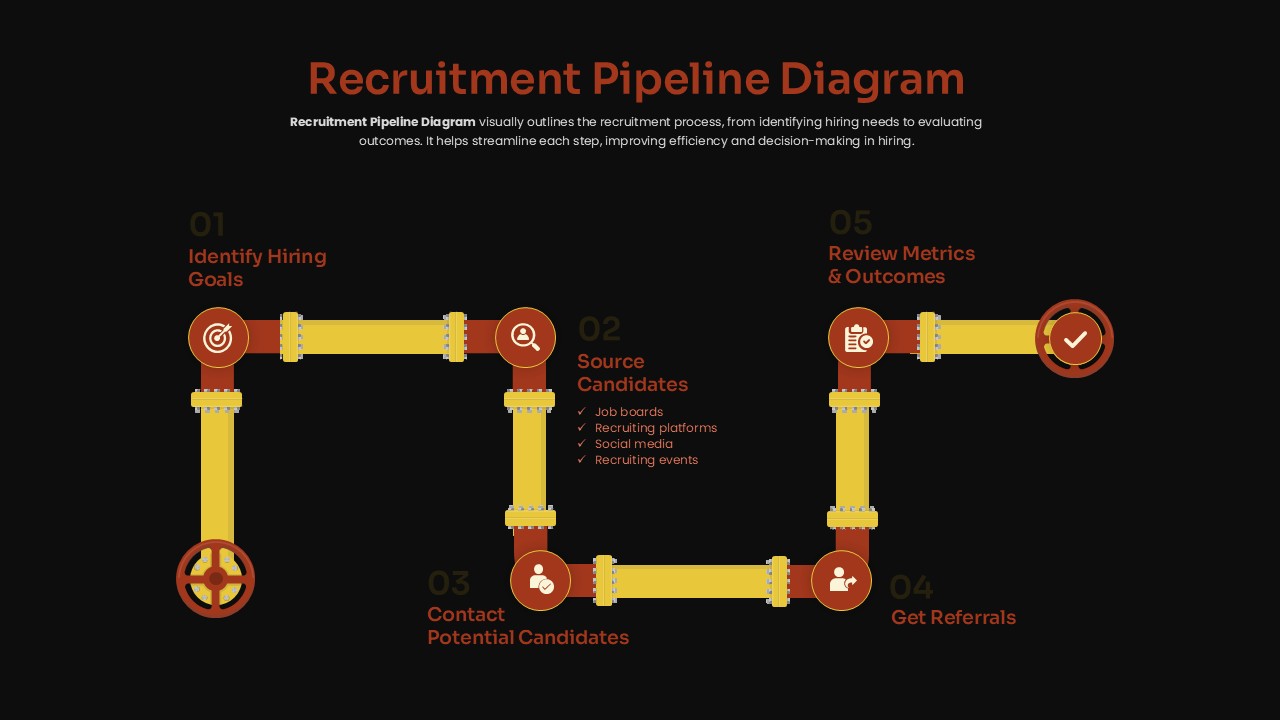
Recruitment Pipeline Flowchart Diagram Template for PowerPoint & Google Slides
Process
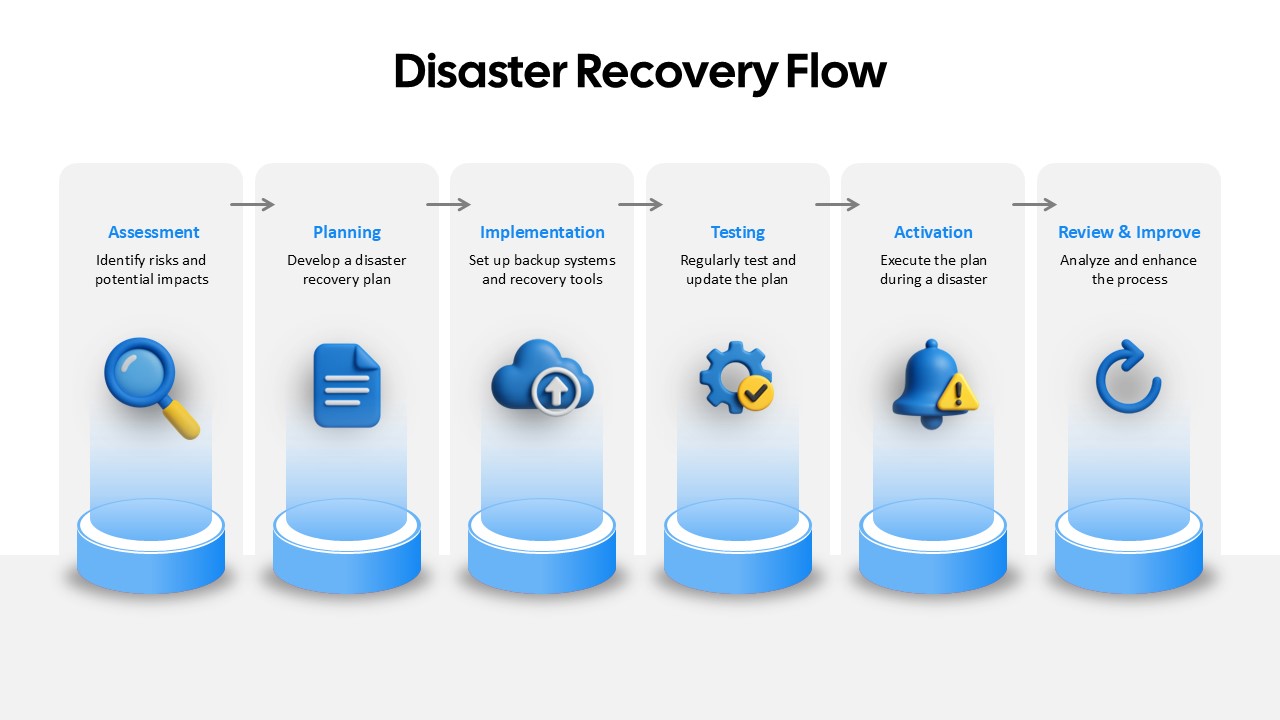
Disaster Recovery Flow Diagram Template for PowerPoint & Google Slides
Process
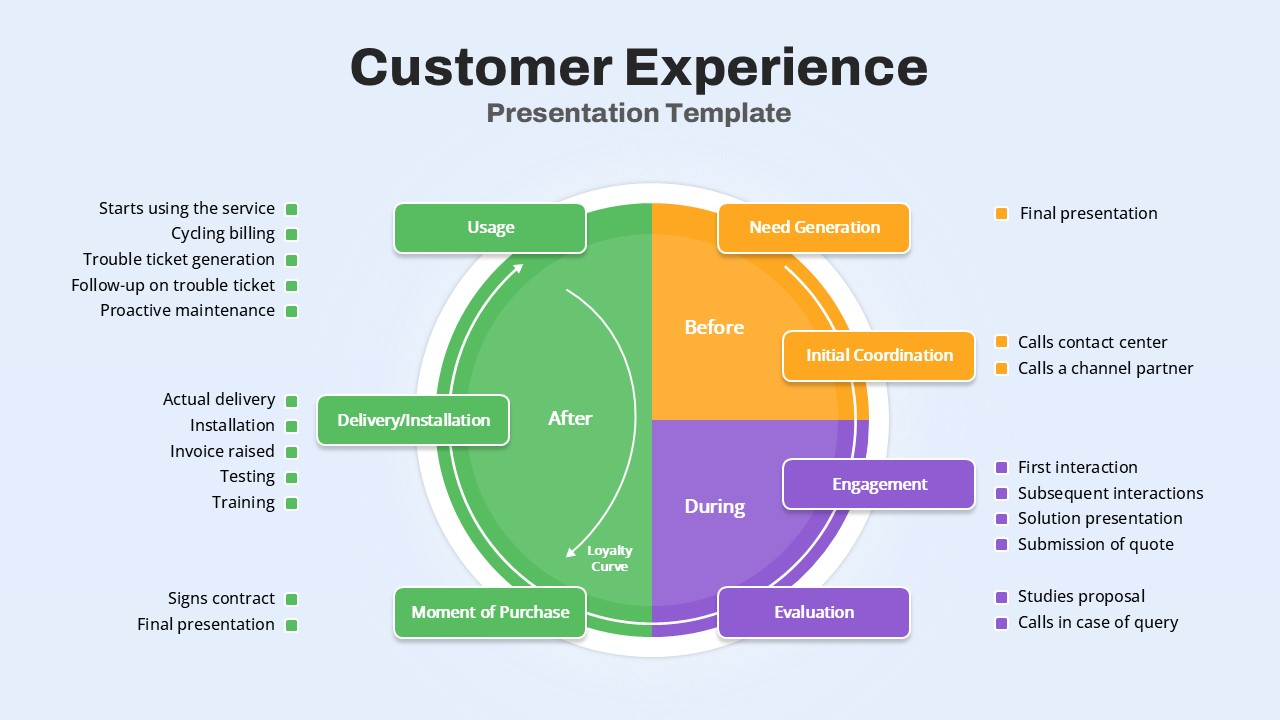
Customer Experience Journey Diagram Template for PowerPoint & Google Slides
Customer Journey
Tech Stack Diagram Template for PowerPoint & Google Slides
Information Technology
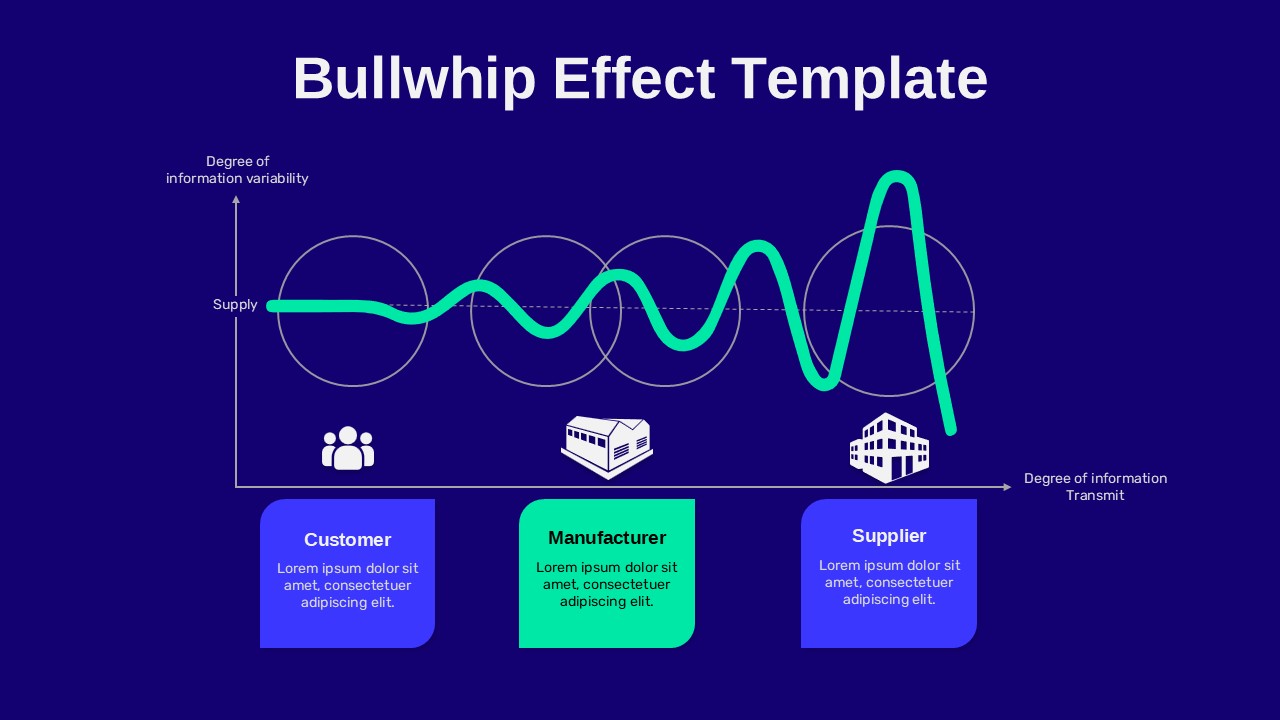
Bullwhip Effect Supply Chain Variability Diagram Template for PowerPoint & Google Slides
Business Models
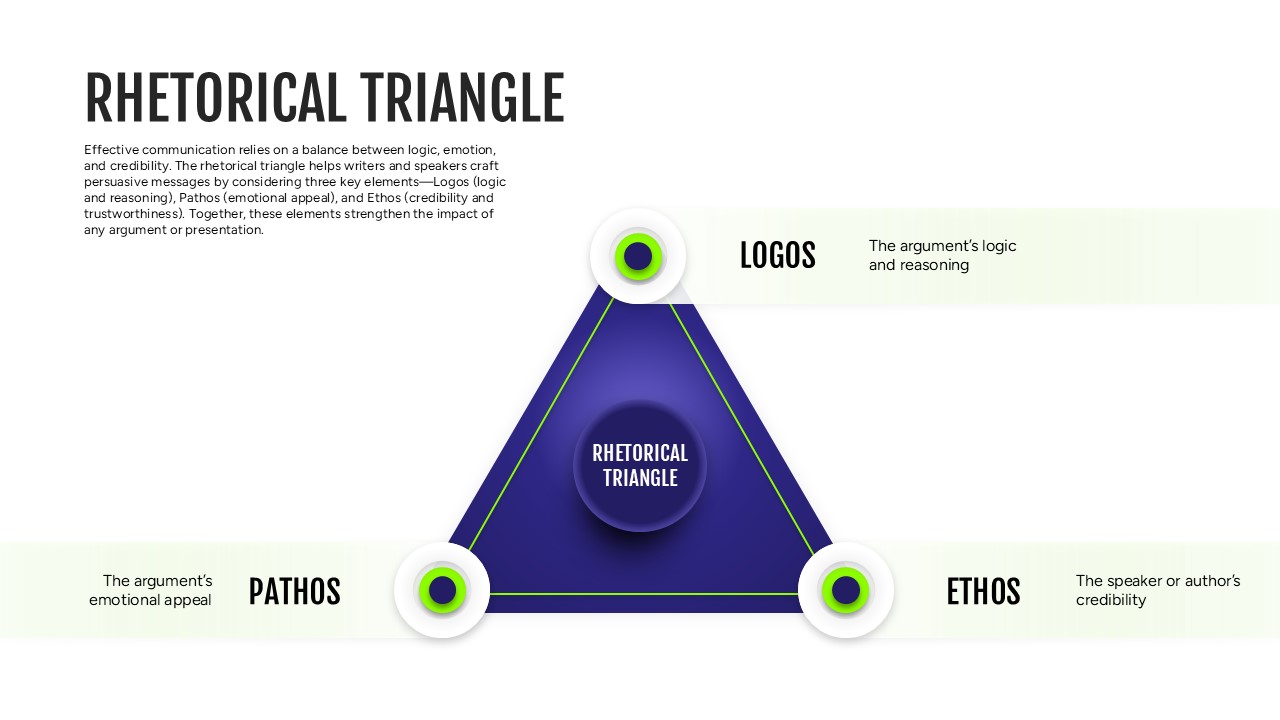
Rhetorical Triangle Model Diagram Template for PowerPoint & Google Slides
Leadership