Dynamic Fundraising Thermometer Slide Template for PowerPoint & Google Slides


Description
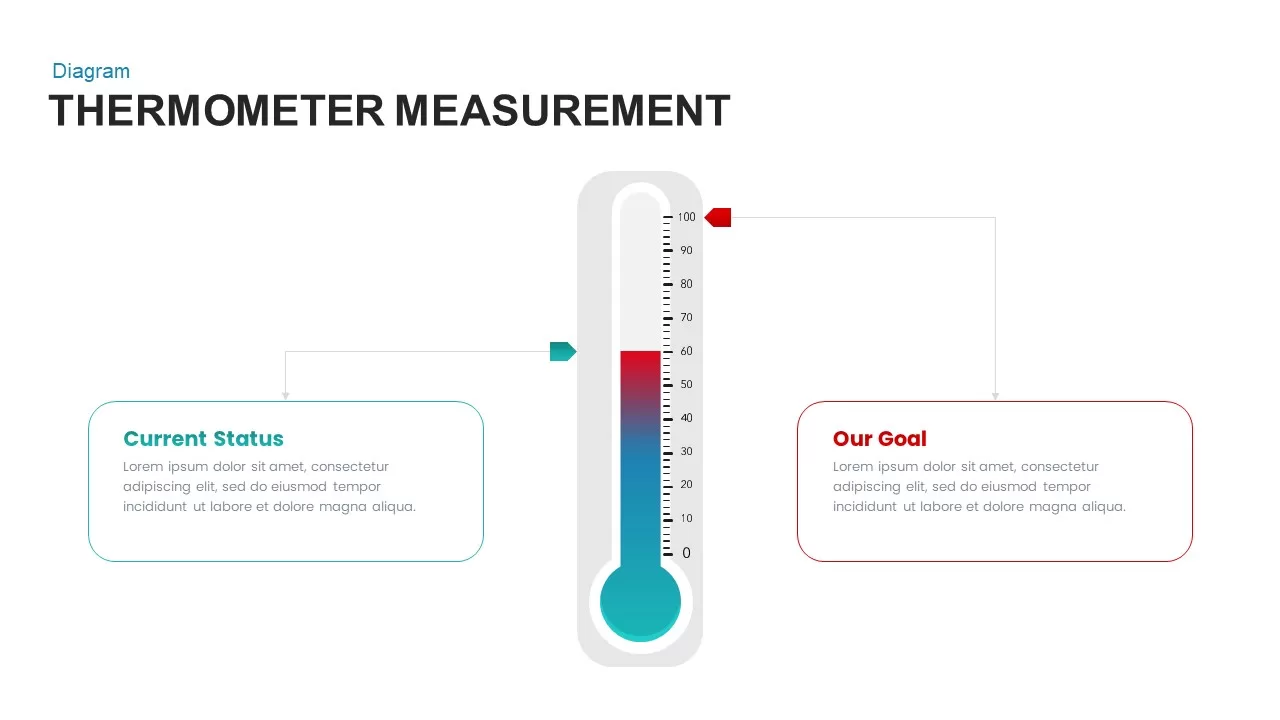
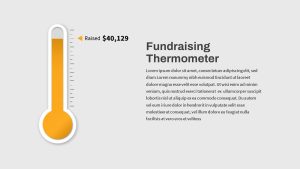
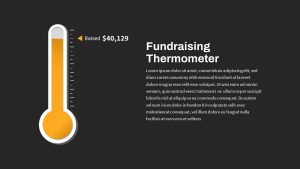
Leverage this fundraising thermometer slide template to showcase your campaign’s progress with visual clarity and impact. The oversized vertical thermometer graphic features a vibrant orange fill indicating the achieved donation level, a circular bulb highlighting total capacity, and calibrated tick marks alongside a triangular pointer and bold monetary label ($40,129) for immediate comprehension. Its clean flat design, subtle drop shadow, and high-contrast palette ensure readability on both desktop and projector screens.
Built on versatile master slides for PowerPoint and Google Slides, this layout offers fully editable components—adjust the mercury fill height to reflect new totals, recolor the bulb and fill to match your brand palette, reposition the pointer marker, or update the value label and supporting text with ease. Use hidden gridlines to align elements precisely and maintain consistent spacing across different layouts, speeding up your design workflow.
On the right side, a prominent title placeholder and a multi-line text block give you ample room to add context, campaign goals, or donor acknowledgments. Simply swap fonts, modify line spacing, or apply different theme colors in seconds. All objects are vector-based, guaranteeing crisp visuals at any resolution, and the slide is preconfigured for seamless compatibility—avoiding formatting shifts when sharing between PowerPoint and Google Slides.
Ideal for non-profit managers, fundraising committees, event planners, and school administrators, this thermometer chart slide enhances stakeholder reports, gala presentations, and internal updates by clearly communicating fundraising milestones and remaining targets. It also works well for sales goal tracking, project budget utilization, or performance KPI reporting. Duplicate, repurpose, or resize the thermometer graphic to suit any narrative, ensuring every audience instantly grasps your progress and next objectives.
With this slide in your toolkit, you can streamline collaboration, reduce manual data-entry errors, and maintain a consistent design language across your fundraising materials. Fast-track presentation creation, engage donors effectively, and spotlight achievements with a single, eye-catching visual that drives urgency and inspires generosity.
Who is it for
Non-profit managers, fundraising committees, event planners, and school administrators will benefit from this thermometer slide when reporting campaign progress, motivating donors, or planning events. Marketing teams, development officers, and grant coordinators can also use the visual gauge to illustrate budget utilization or project milestones.
Other Uses
Beyond fundraising campaigns, repurpose this thermometer graphic for sales quota tracking, budget consumption analysis, performance KPI monitoring, membership drives, or project milestone reporting. It also serves well in educational settings, internal finance reviews, or marketing presentations where clear progress visualization drives engagement.
Login to download this file

Item ID
SB04222
Related Templates

Free Fundraising Pitch Deck Timeline Template for PowerPoint & Google Slides
Pitch Deck
Free
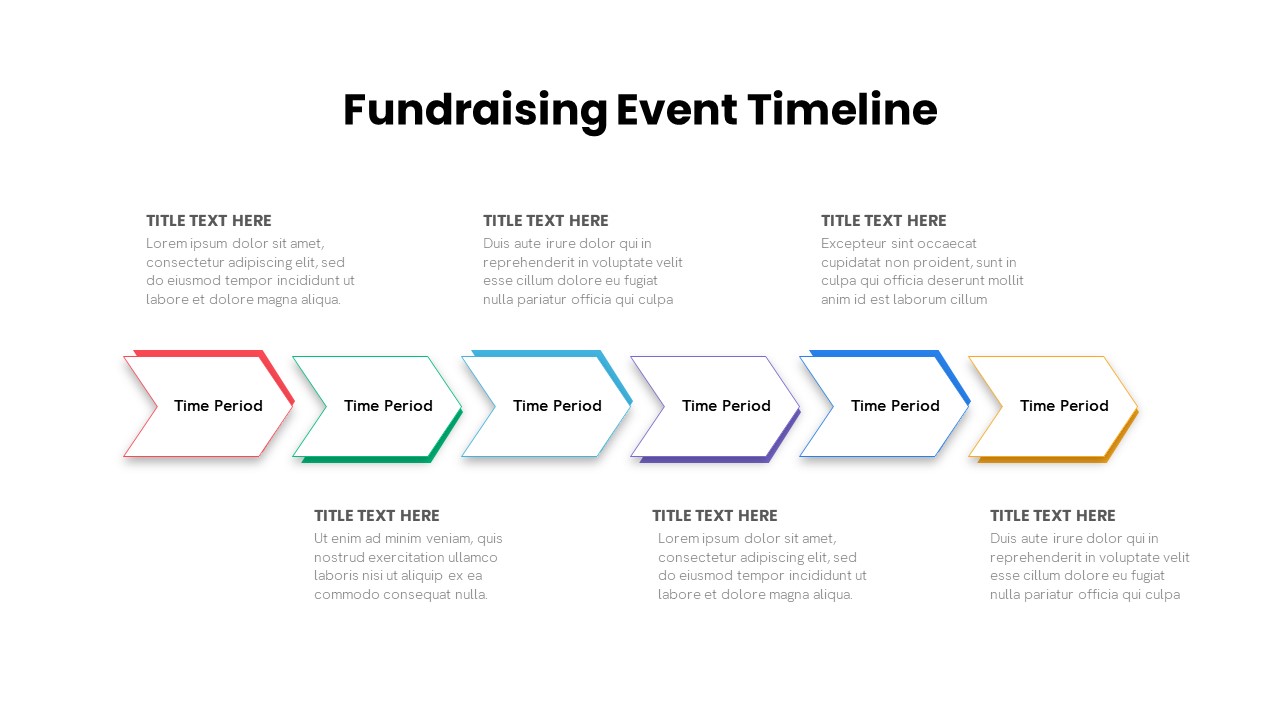
Fundraising Event Timeline Diagram Template for PowerPoint & Google Slides
Timeline
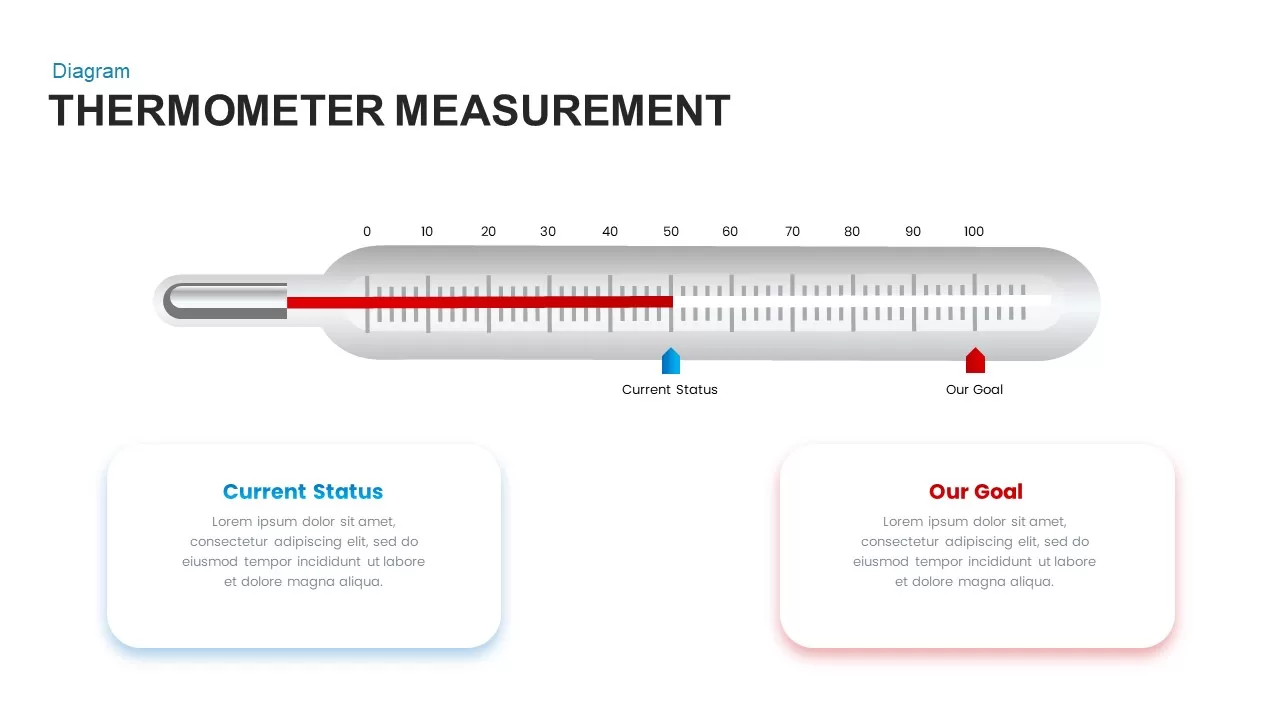
Thermometer Measurement Timeline Diagram Template for PowerPoint & Google Slides
Timeline
Thermometer Gauge Progress Measurement Template for PowerPoint & Google Slides
Comparison
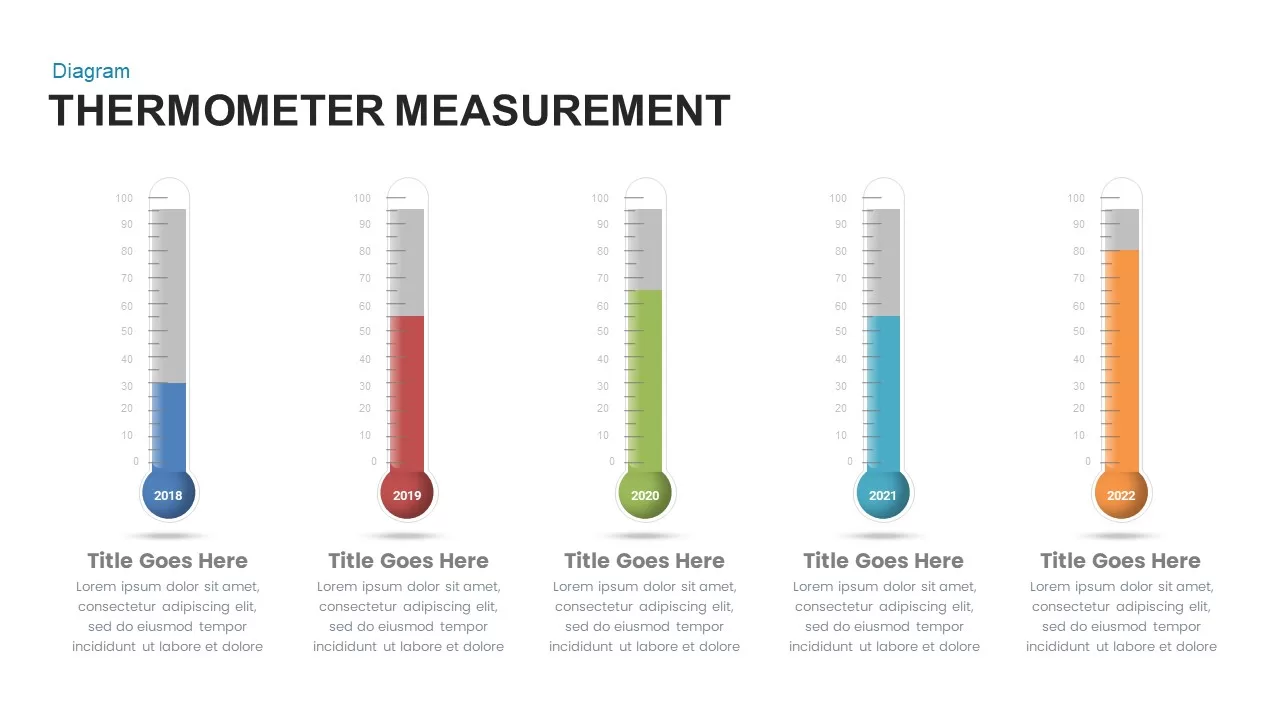
Multi-Variation Thermometer Chart Template for PowerPoint & Google Slides
Bar/Column
Thermometer Measurement Diagram for PowerPoint & Google Slides
Business
Dynamic Sprint Race Cover Slide Template for PowerPoint & Google Slides
Graphics
Dynamic Boxing Training Cover Slide Template for PowerPoint & Google Slides
Graphics
Dynamic Relay Race Presentation Slide Template for PowerPoint & Google Slides
Graphics
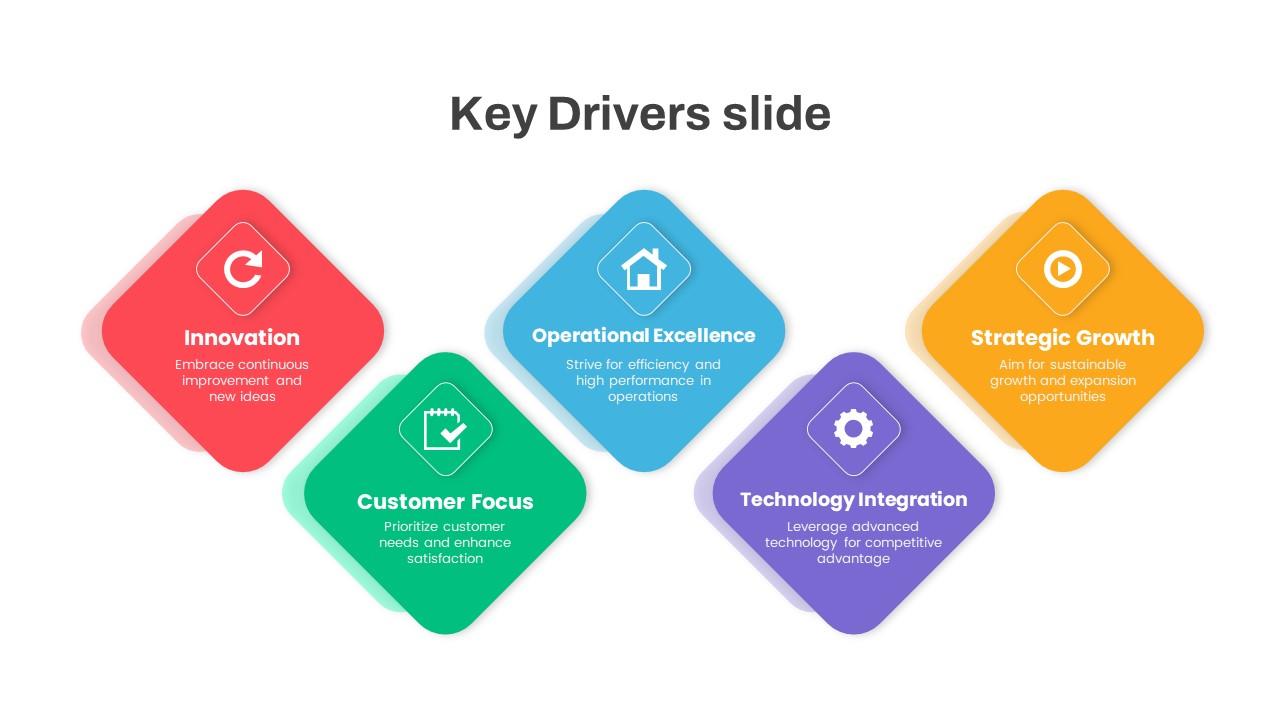
Dynamic Business Key Drivers Slide Template for PowerPoint & Google Slides
Process
Dynamic Tennis Sports Theme Slide for PowerPoint & Google Slides
Graphics
Creative Dynamic Gantt Chart Timeline Template for PowerPoint & Google Slides
Timeline
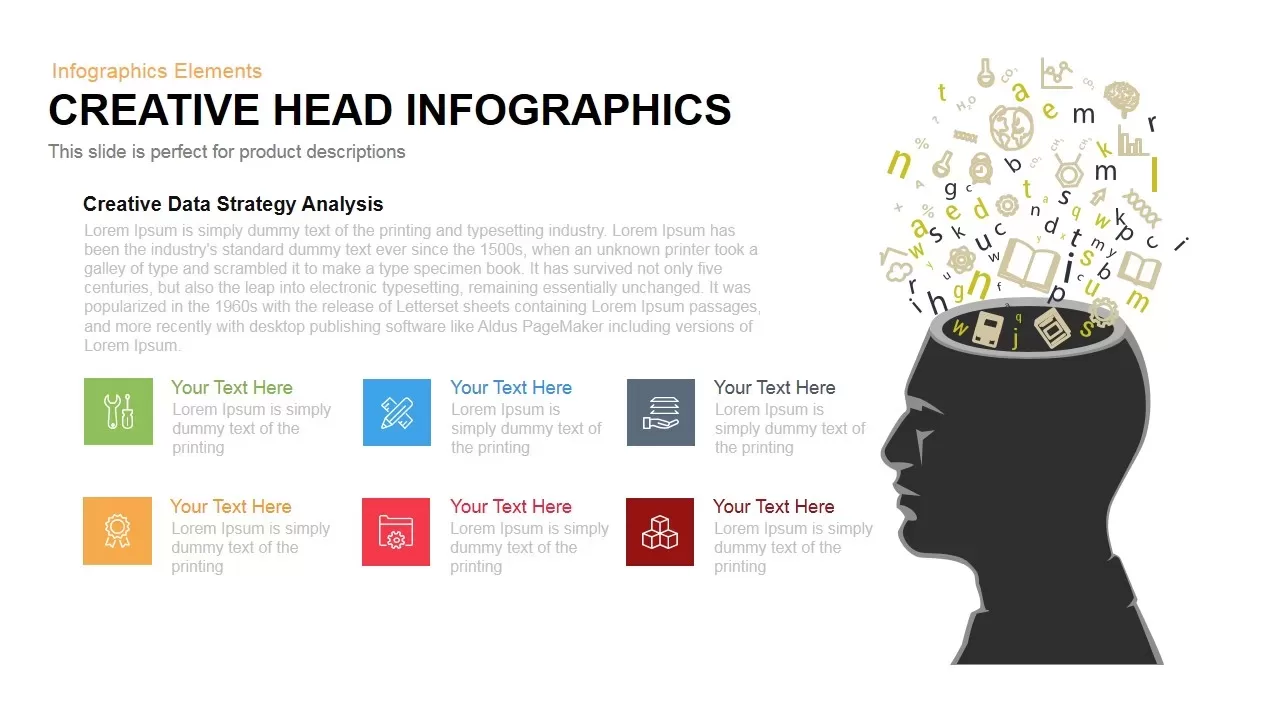
Dynamic Creative Head Infographics Template for PowerPoint & Google Slides
Circular
Dynamic Shield Process Flow Diagram template for PowerPoint & Google Slides
Process

Dynamic Circle Timeline Infographics template for PowerPoint & Google Slides
Timeline
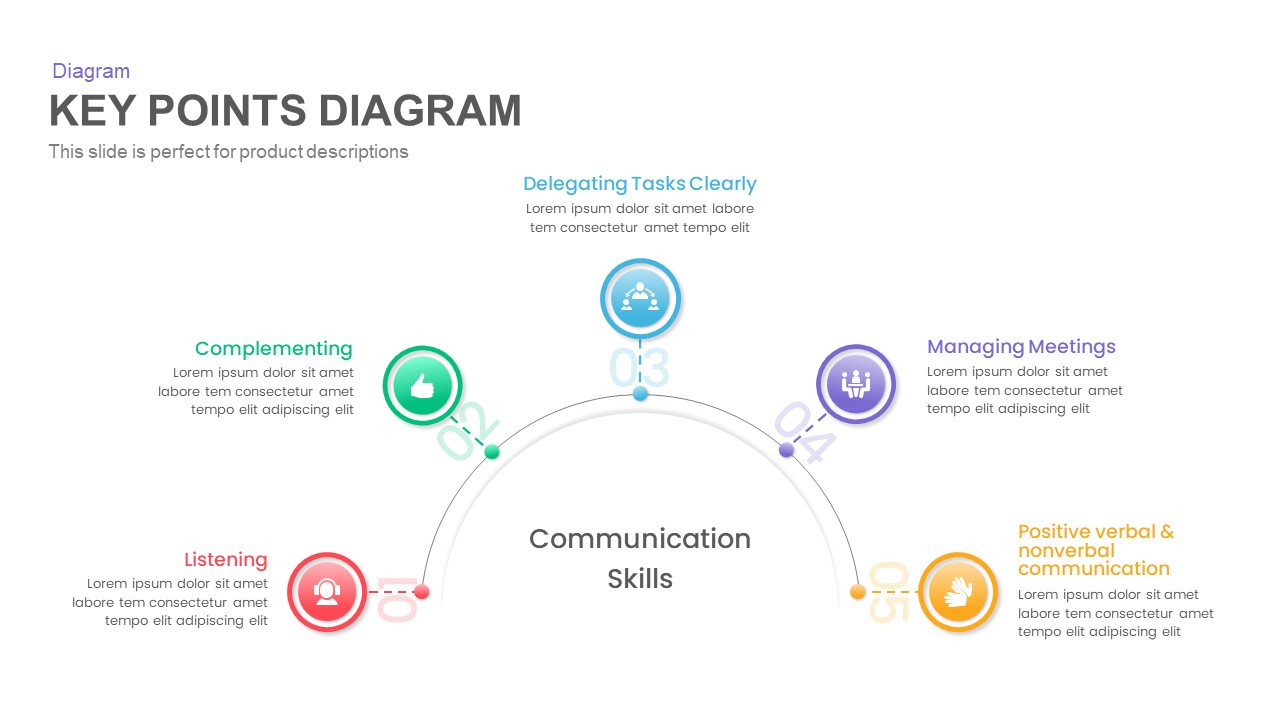
Dynamic Key Points Diagram Template for PowerPoint & Google Slides
Process

Dynamic Data Dashboard Infographic Template for PowerPoint & Google Slides
Bar/Column
Dynamic Arrow Process Template for PowerPoint & Google Slides
Process

Dynamic 4 Gear Process Diagram Template for PowerPoint & Google Slides
Process
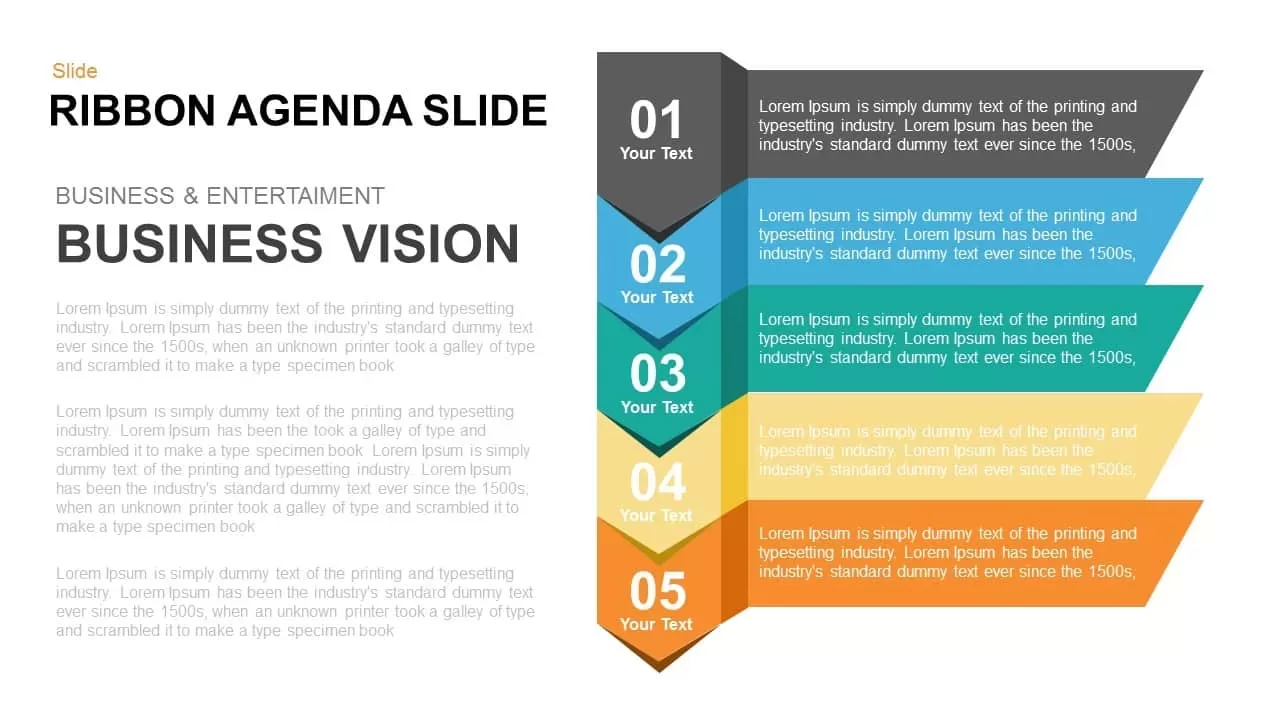
Dynamic Five-Step Ribbon Agenda Layout Template for PowerPoint & Google Slides
Agenda
Dynamic Multicolor Comparison Table Template for PowerPoint & Google Slides
Comparison
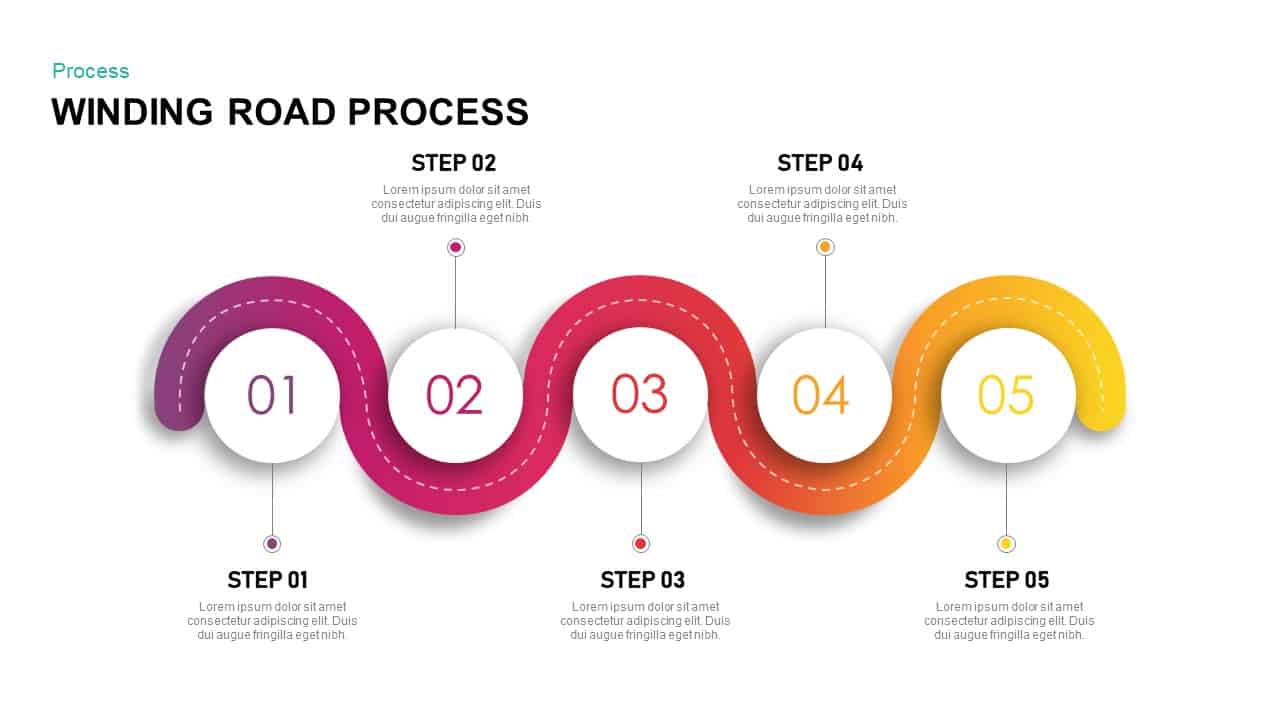
Dynamic Winding Road Process Timeline Template for PowerPoint & Google Slides
Process
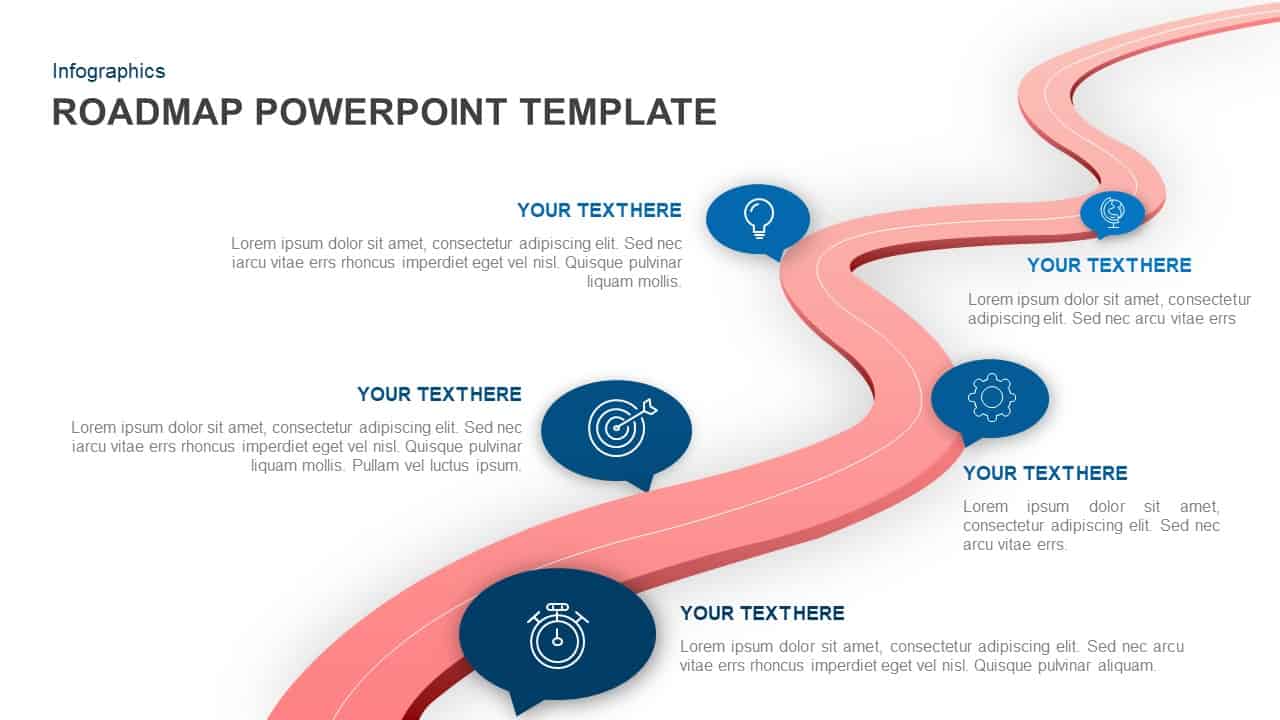
Dynamic Winding Roadmap Infographic Template for PowerPoint & Google Slides
Roadmap
Dynamic AI Applications Infographic Template for PowerPoint & Google Slides
AI
Dynamic Growth Arrow Step Infographic Template for PowerPoint & Google Slides
Process
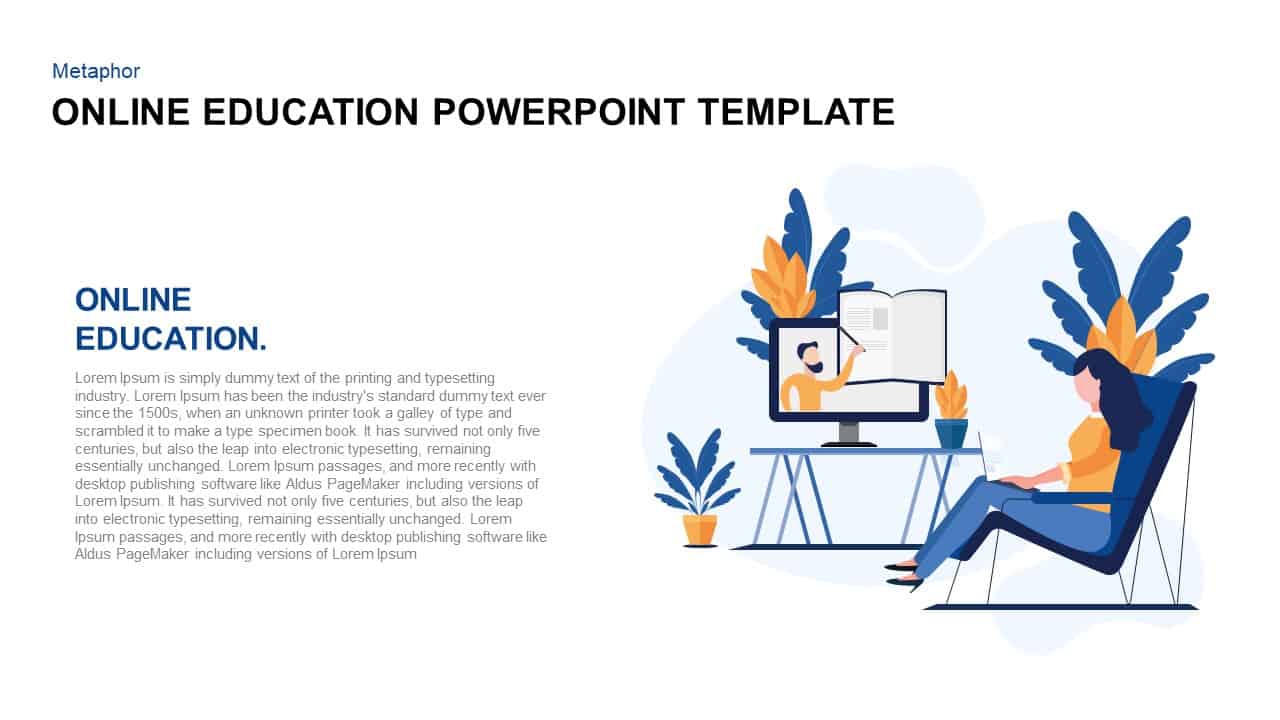
Dynamic Online Education Illustration Template for PowerPoint & Google Slides
Business Proposal
Capital Structure Dynamic Split Chart Template for PowerPoint & Google Slides
Comparison Chart

Dynamic Marketing Radar Chart Analytics Template for PowerPoint & Google Slides
Comparison
Dynamic Gear Diagram Infographics Template for PowerPoint & Google Slides
Process
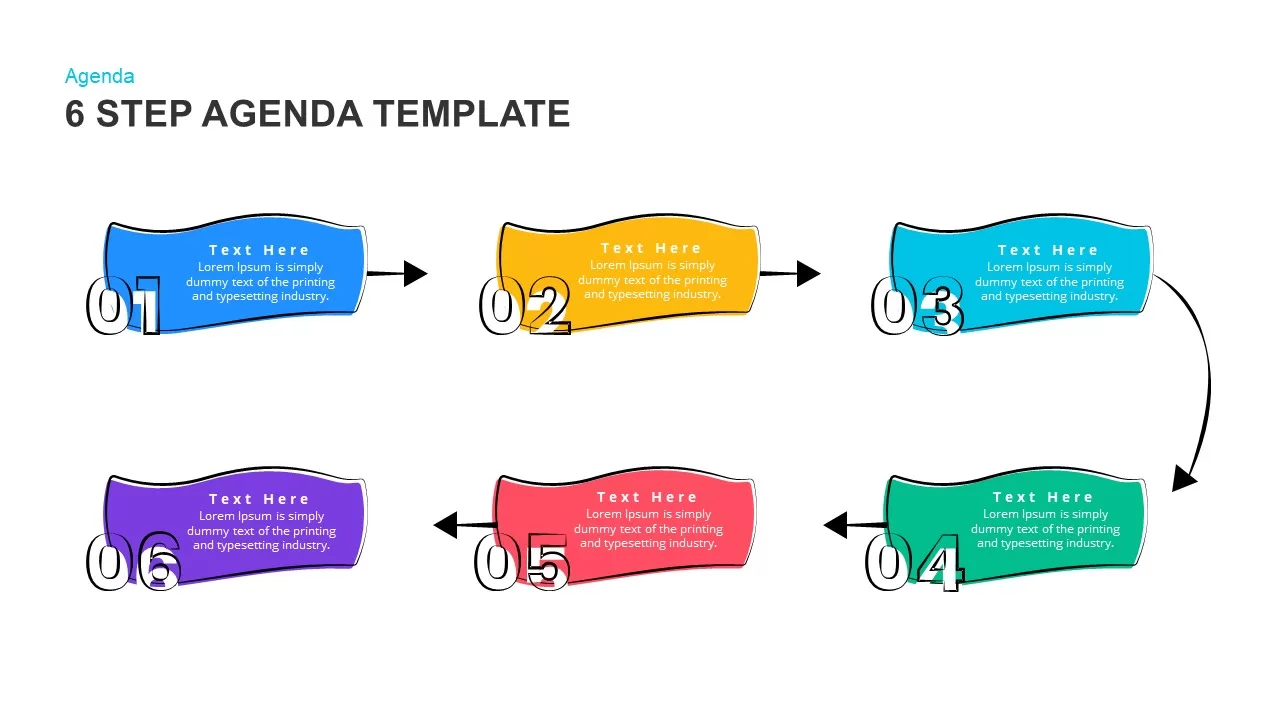
Modern & Dynamic 6-Step Agenda Sequence Template for PowerPoint & Google Slides
Agenda
Dynamic Curved Arrow Process Roadmap Template for PowerPoint & Google Slides
Process
Dynamic Benchmarking Comparison Chart Template for PowerPoint & Google Slides
Comparison Chart
Dynamic Conveyor Belt Process Flow Template for PowerPoint & Google Slides
Process
Dynamic Statistics & Progress Charts Template for PowerPoint & Google Slides
Pie/Donut
Dynamic Hub-and-Spoke Infographic Diagram Template for PowerPoint & Google Slides
Circular
Dynamic Circular Hub-and-Spoke Infographic Template for PowerPoint & Google Slides
Circular
Dynamic 3D Rubik’s Cube Diagram Pack Template for PowerPoint & Google Slides
Infographics
Dynamic Four-Step Gear Process Template for PowerPoint & Google Slides
Process
Dynamic Basketball Training Promotion Template for PowerPoint & Google Slides
Advertising
Dynamic Hurdle Race Presentation Template for PowerPoint & Google Slides
Advertising
Dynamic Soccer Stadium Presentation Template for PowerPoint & Google Slides
Graphics
Dynamic Cycling Presentation Template for PowerPoint & Google Slides
Graphics
Dynamic Chevron Timeline Infographic Template for PowerPoint & Google Slides
Timeline
Dynamic Animated Question Mark Template for PowerPoint & Google Slides
Graphics
Dynamic Three-Series Stacked Area Chart Template for PowerPoint & Google Slides
Comparison Chart
Dynamic Sunburst Chart Visualization Template for PowerPoint & Google Slides
Charts
Dynamic Abstract Corporate Theme Template for PowerPoint & Google Slides
Decks
Dynamic Investment & Finance Growth Template for PowerPoint & Google Slides
Finance
Dynamic Bar-of-Pie Chart Comparison Template for PowerPoint & Google Slides
Pie/Donut

Dynamic Green Field Sports Presentation Template for PowerPoint & Google Slides
Decks
Dynamic Financial Analysis Line Chart Template for PowerPoint & Google Slides
Finance

Free Dynamic Global Warming Presentation Template for PowerPoint & Google Slides
Pitch Deck
Free
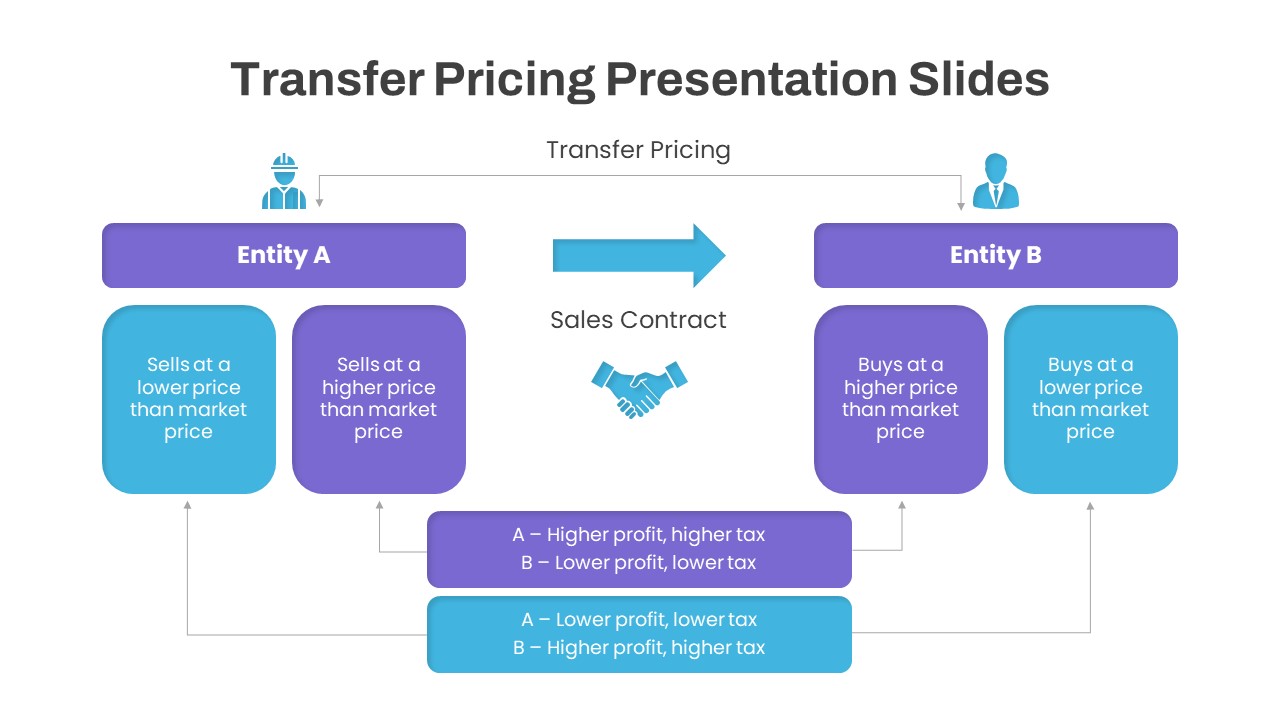
Dynamic Transfer Pricing Flow Diagram Template for PowerPoint & Google Slides
Finance
Dynamic Carousel Icon Hub Diagram Template for PowerPoint & Google Slides
Circular
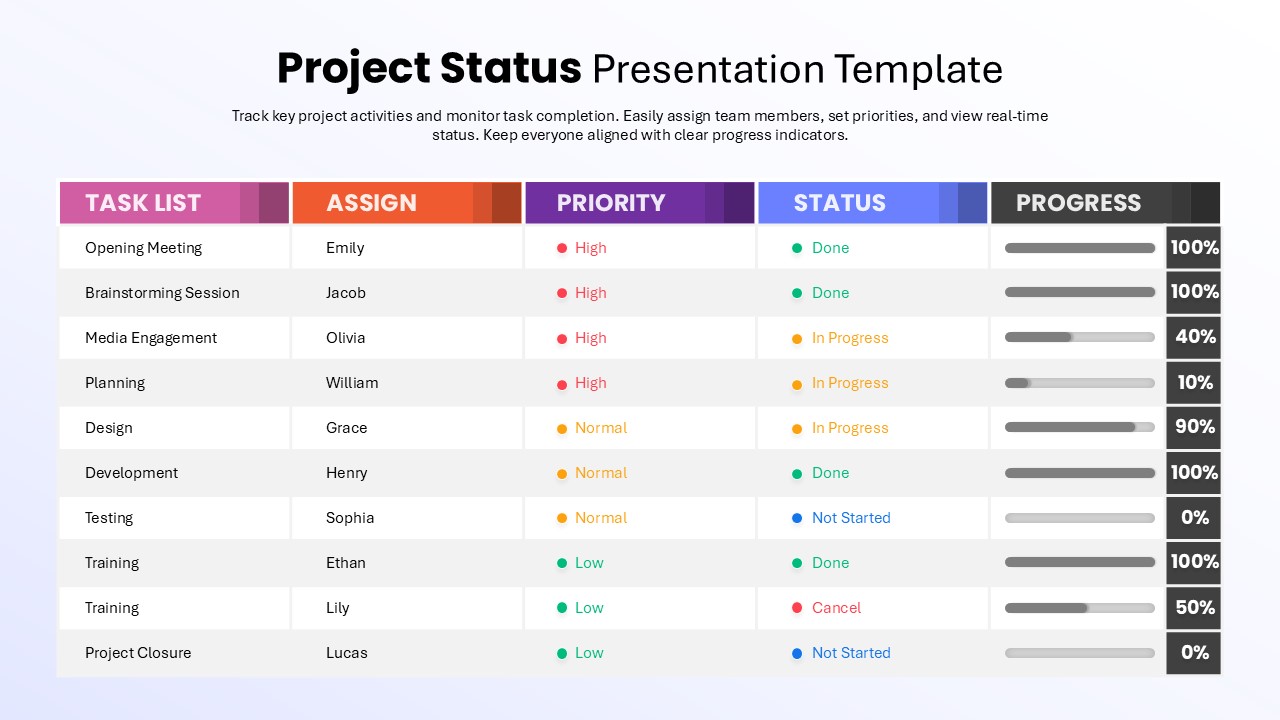
Dynamic Project Status Tracking Table Template for PowerPoint & Google Slides
Project Status
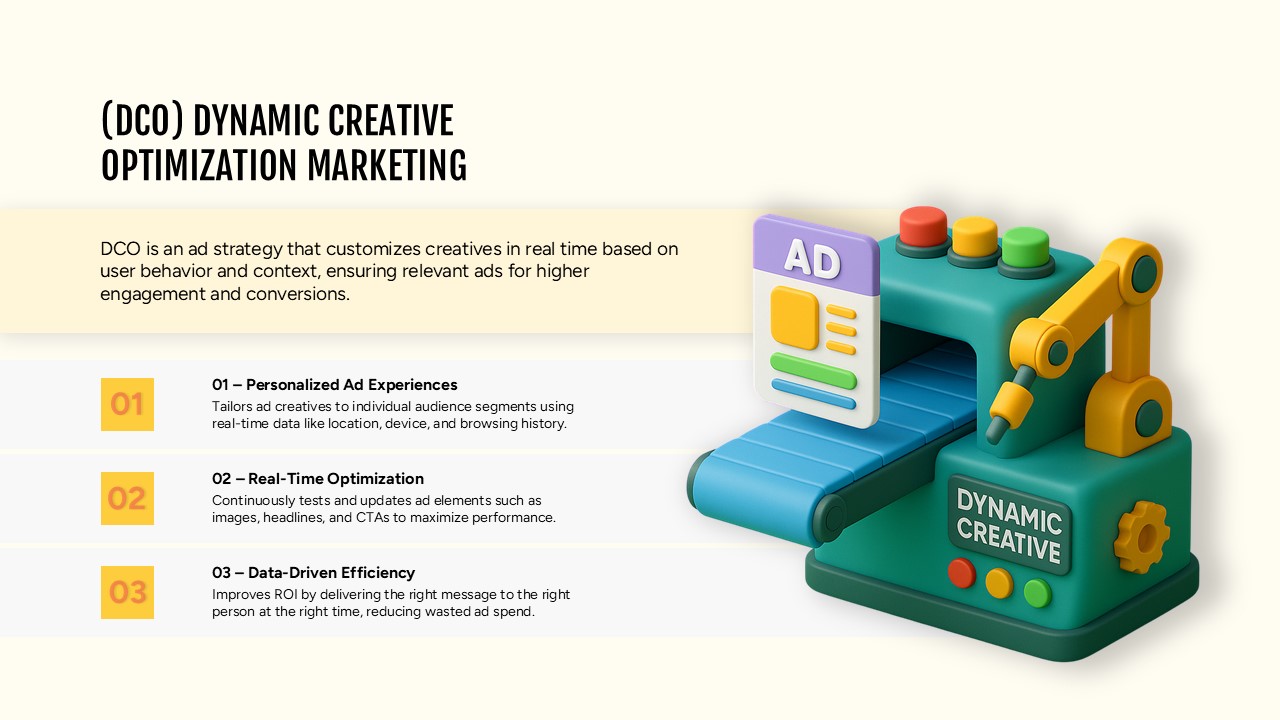
Dynamic Creative Optimization Marketing Template for PowerPoint & Google Slides
Digital Marketing