Revenue Presentation Templates for PowerPoint and Google Slides
Present financial growth and performance with impact using our Revenue Presentation Templates for PowerPoint and Google Slides. These templates are designed to showcase revenue data, profit margins, earnings forecasts, and sales performance in a professional and engaging format. Whether you’re preparing for stakeholder meetings, board reviews, or internal reports, these revenue slides help you turn raw numbers into meaningful visual insights.
Fully editable and compatible with Microsoft PowerPoint (PPT) and Google Slides, these templates are ideal for finance professionals, sales teams, business analysts, and company executives.
![]() Filter
Filter
Filter
-

Quarterly Financial Summary Dashboard Template for PowerPoint & Google Slides
Business Report
-
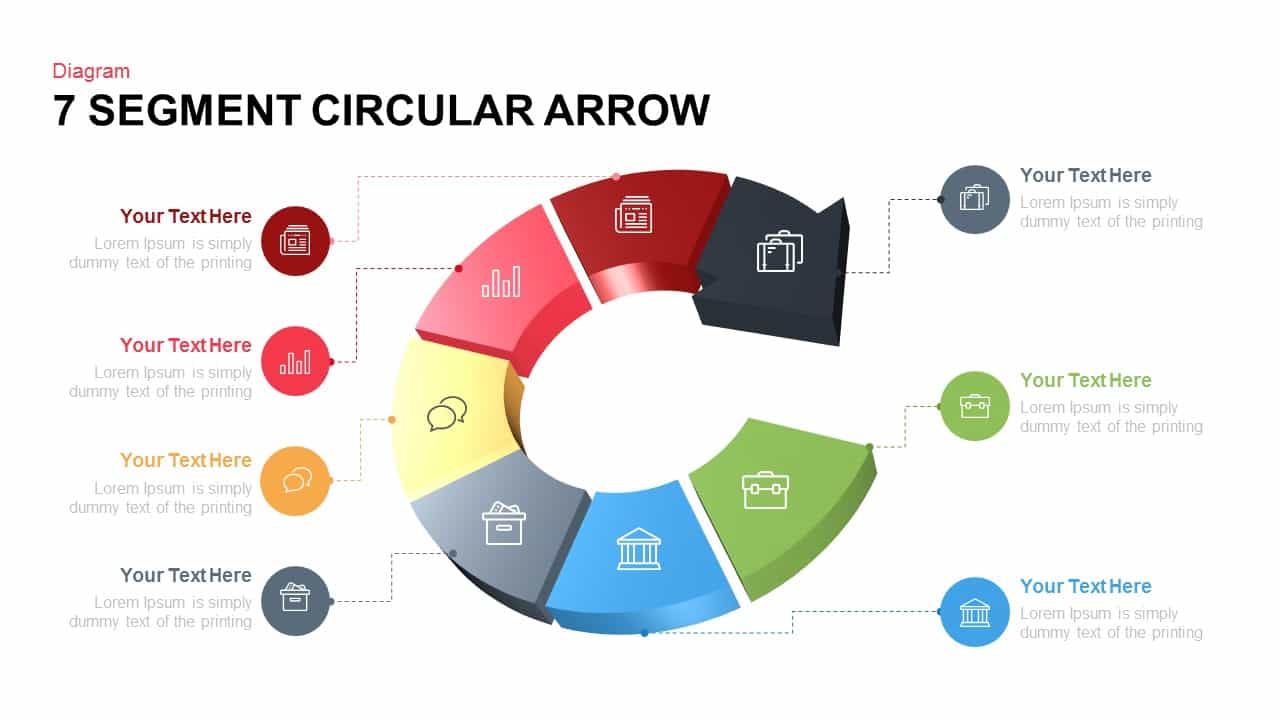
Seven-Segment Circular Arrow Diagram Template for PowerPoint & Google Slides
Arrow
-
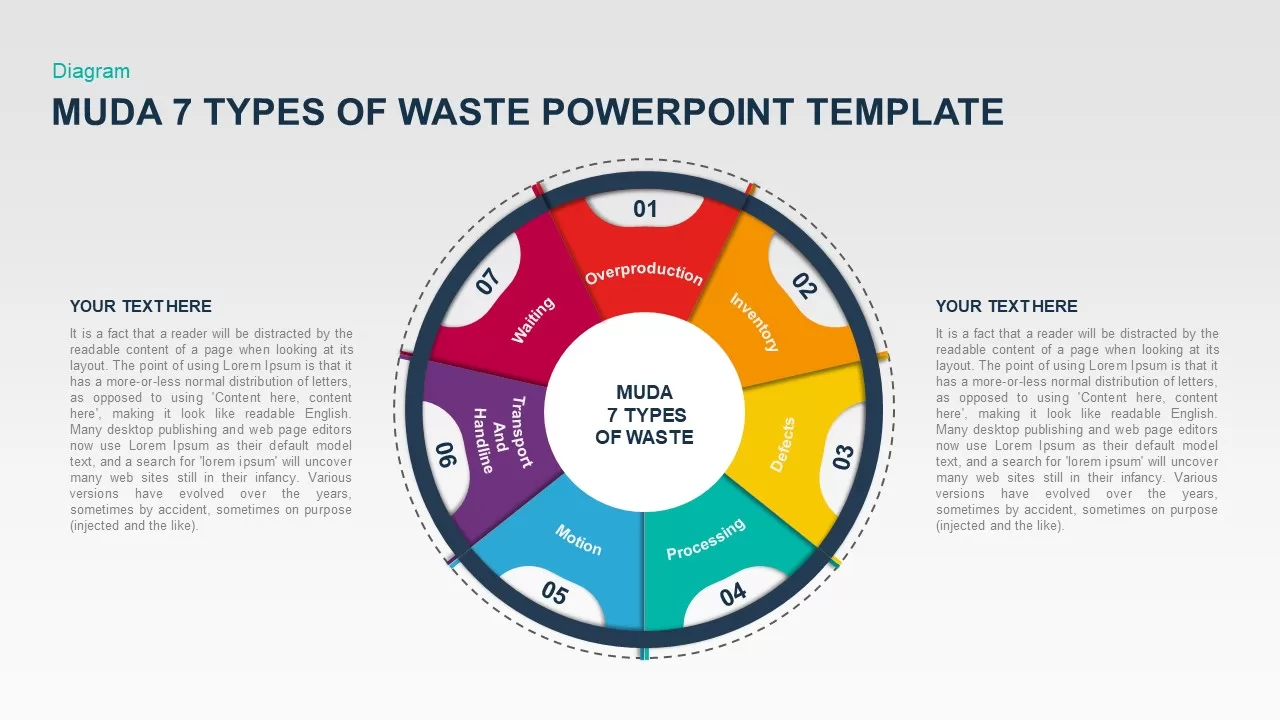
MUDA Seven Types of Waste Diagram Template for PowerPoint & Google Slides
Circular
-

Break-Even Analysis template for PowerPoint & Google Slides
Process
-
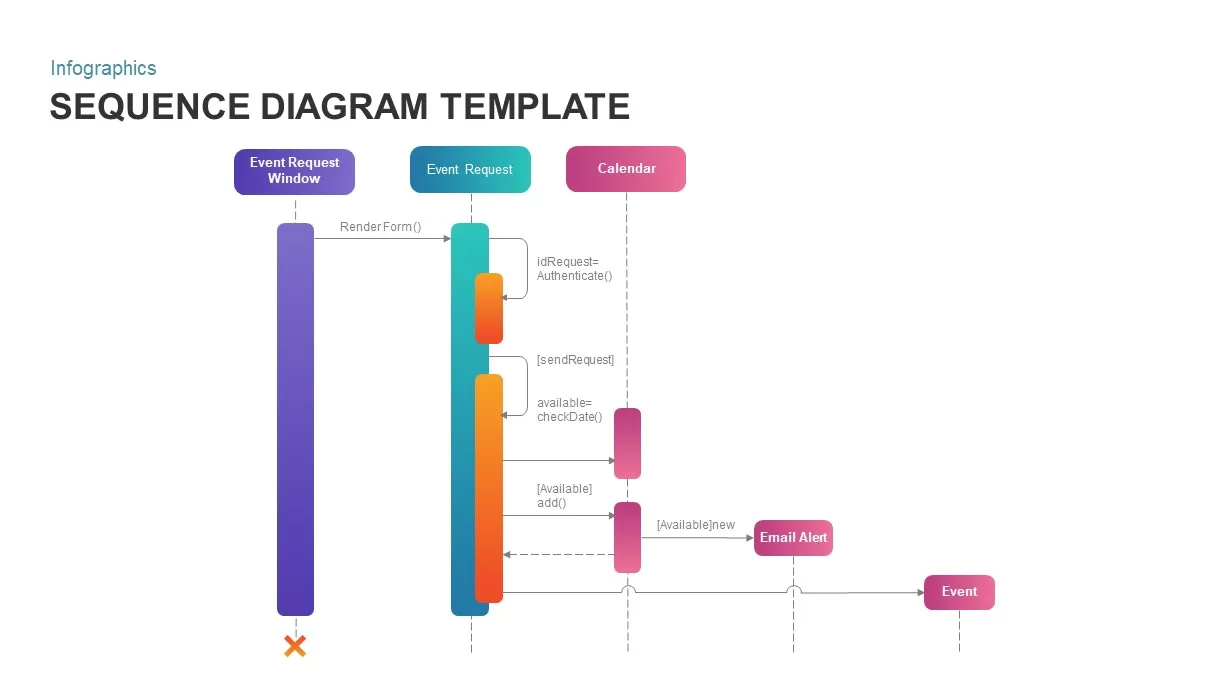
Event Request Sequence Diagram template for PowerPoint & Google Slides
Process
-
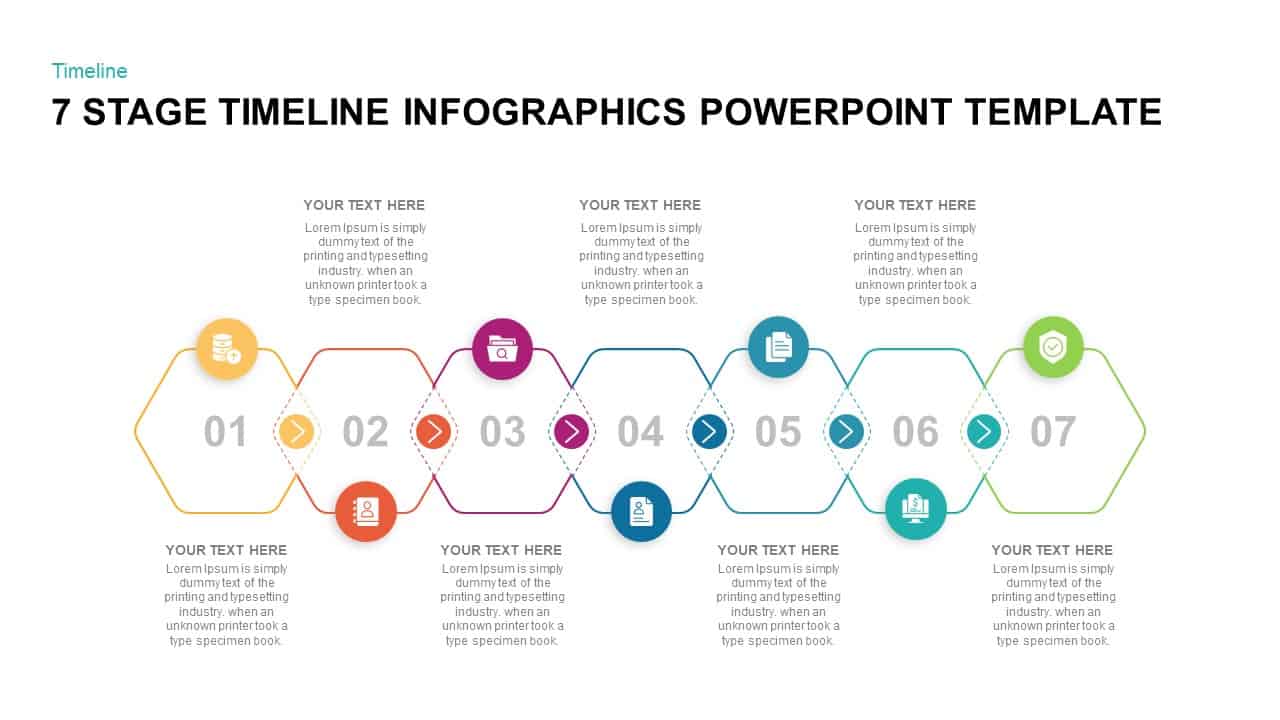
Seven-Stage Hexagon Timeline Infographic Template for PowerPoint & Google Slides
Timeline
-
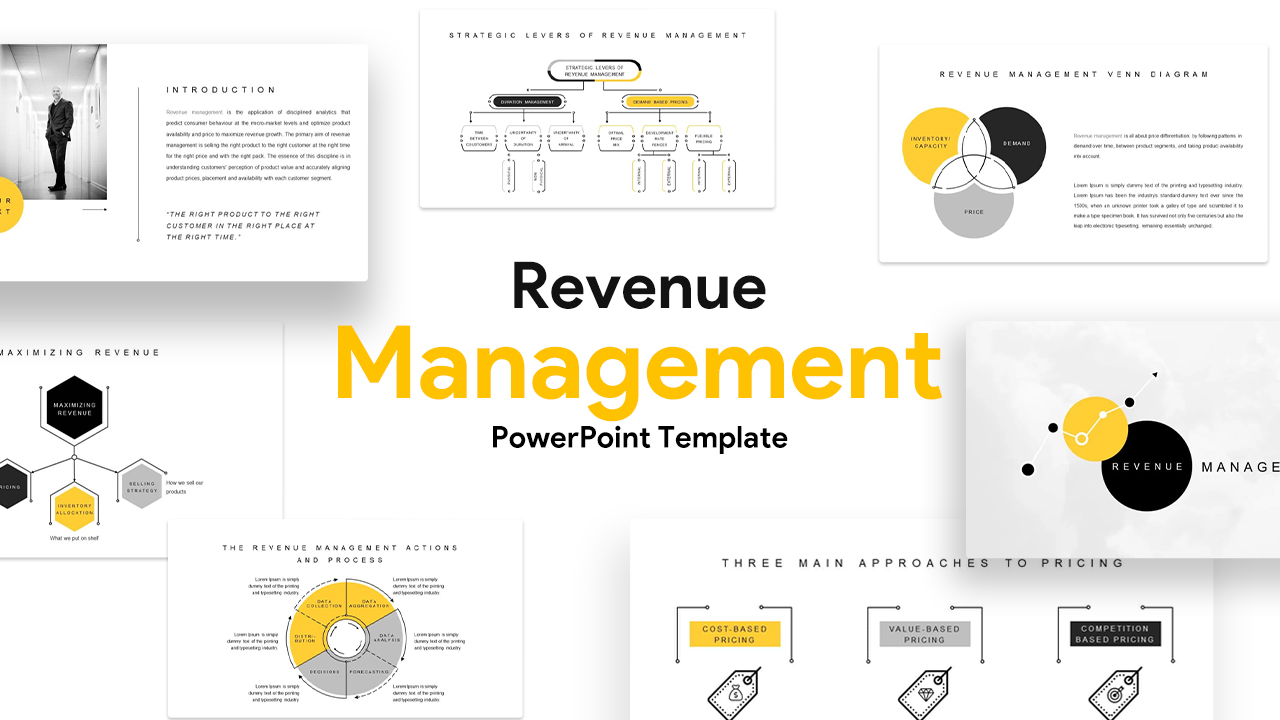
Revenue Management Business Strategy Template for PowerPoint & Google Slides
Revenue
-
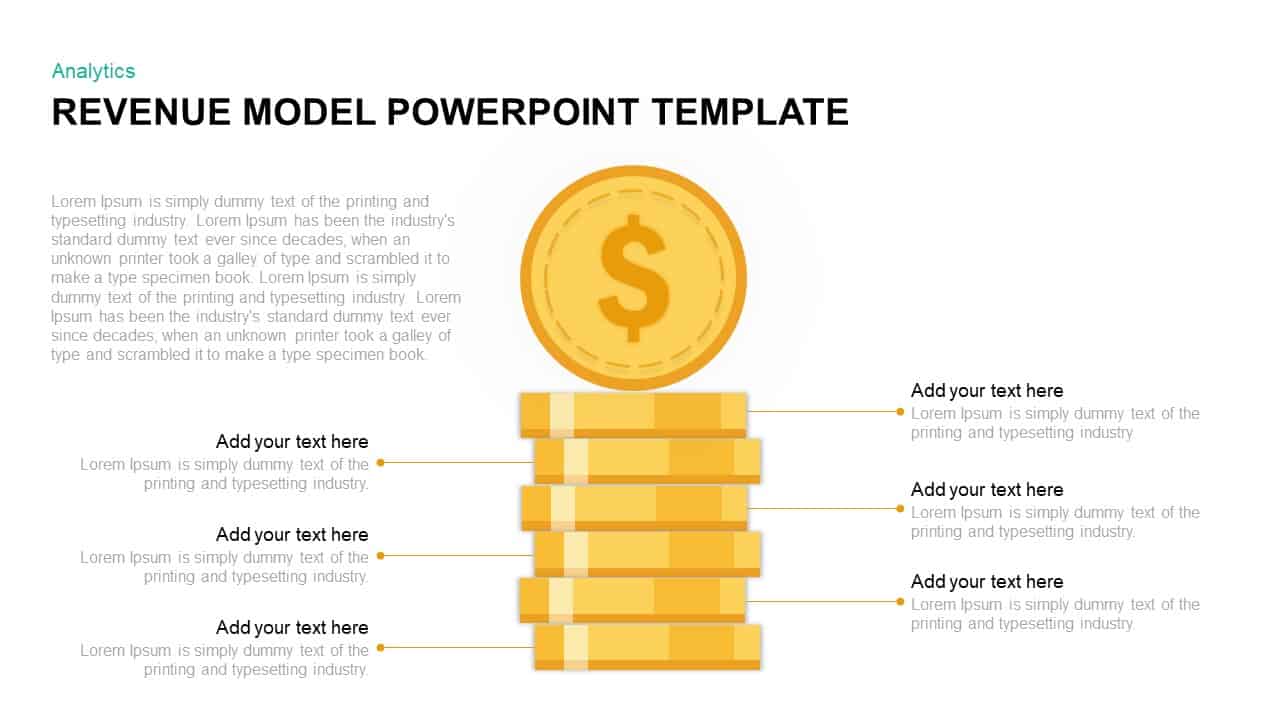
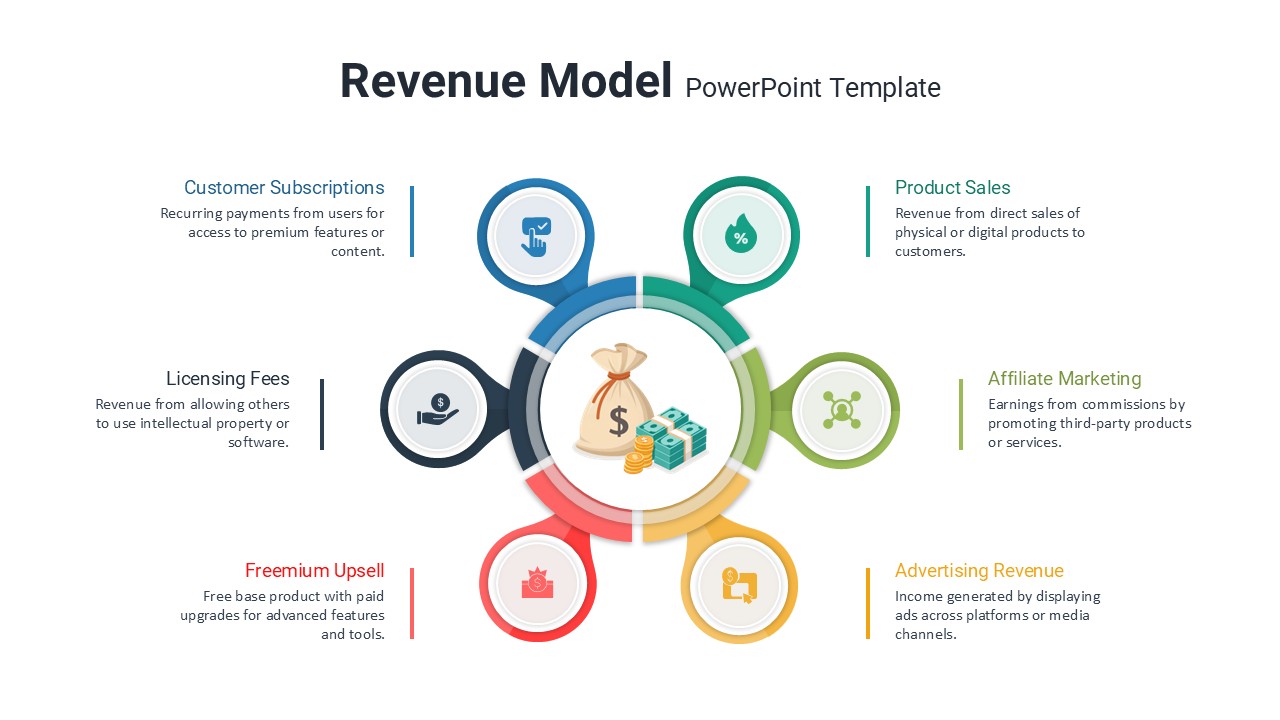
Revenue Model PowerPoint Template
Finance
-

Entertainment Industry Revenue Bar Chart Template for PowerPoint & Google Slides
Bar/Column
-
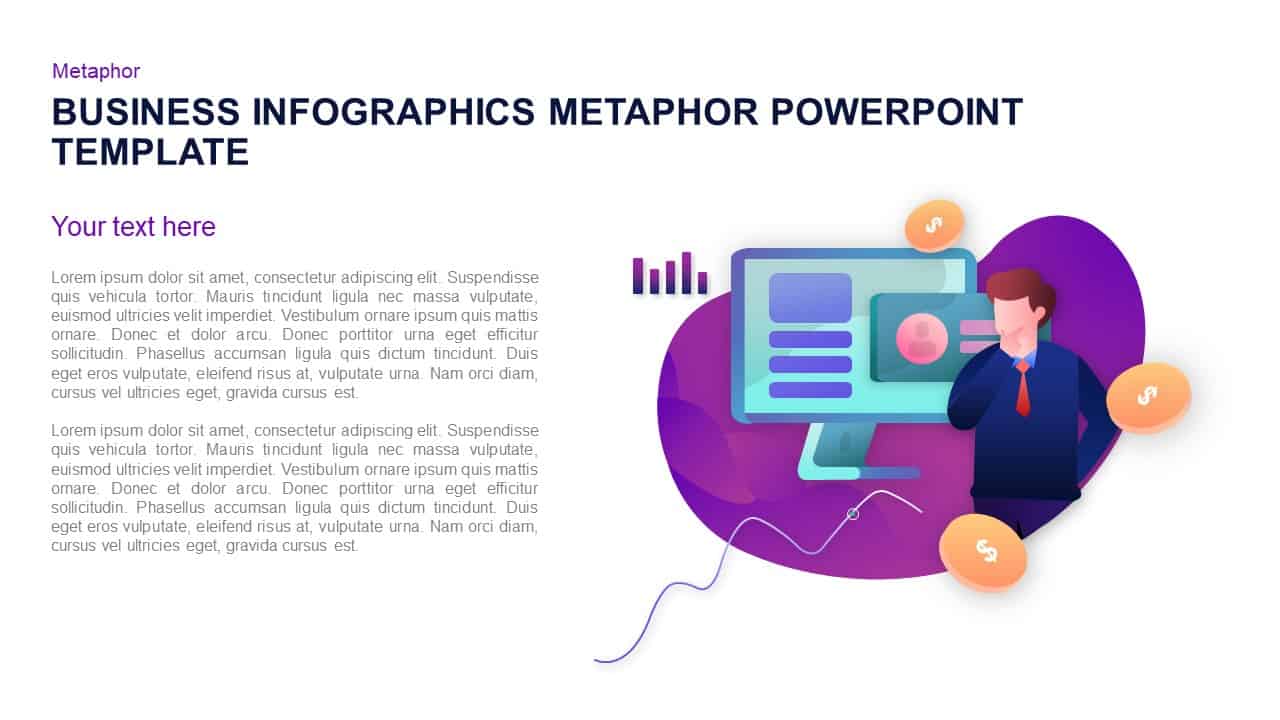
Business Growth Infographic Metaphor Template for PowerPoint & Google Slides
Revenue
-

4 Step Revenue Growth Flow Diagram Template for PowerPoint & Google Slides
Process
-

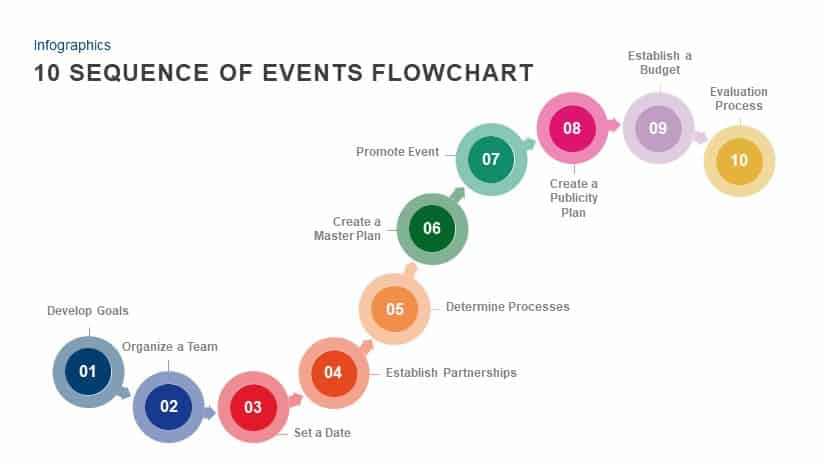
10 Sequence of Events Flowchart template for PowerPoint & Google Slides
Flow Charts
-
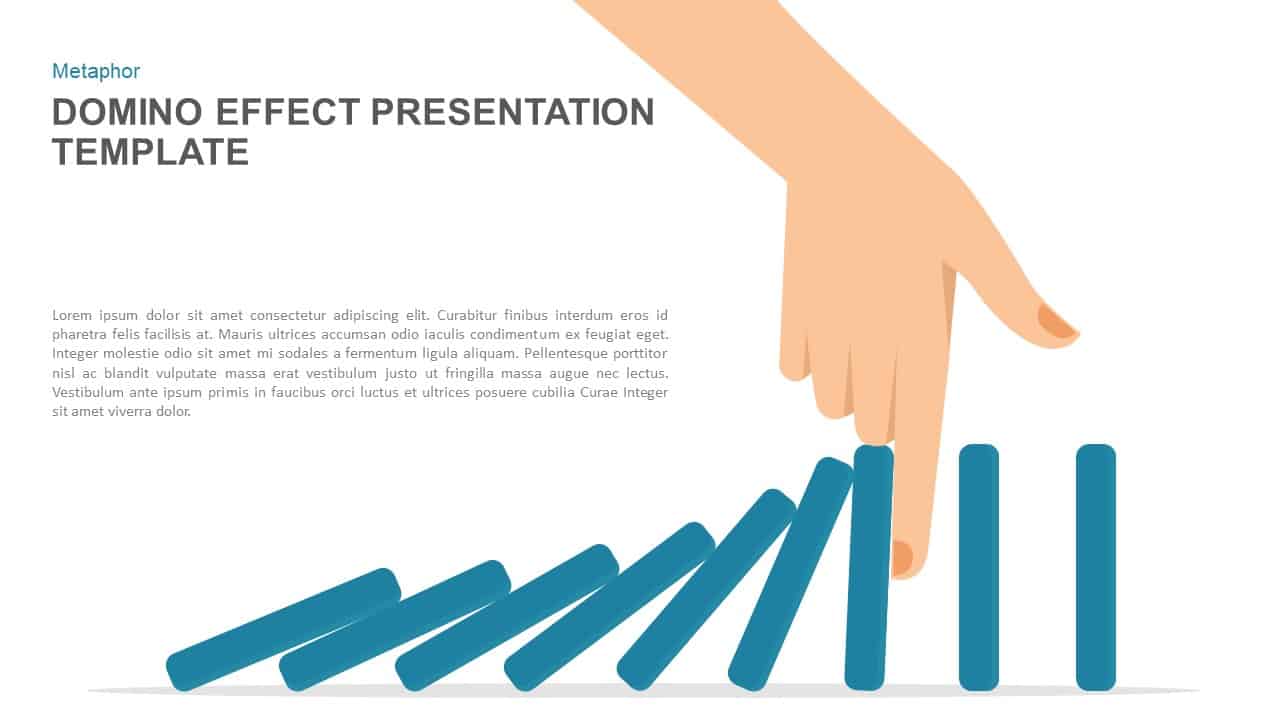
Domino Effect Prevention Presentation Template for PowerPoint & Google Slides
Process
-

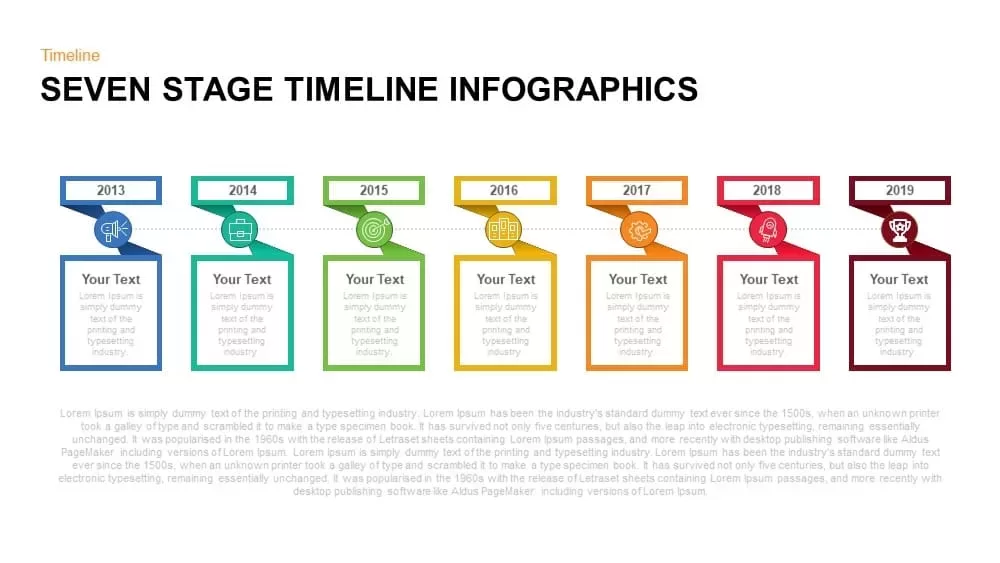
Seven-Stage Timeline Infographics Template for PowerPoint & Google Slides
Timeline
-
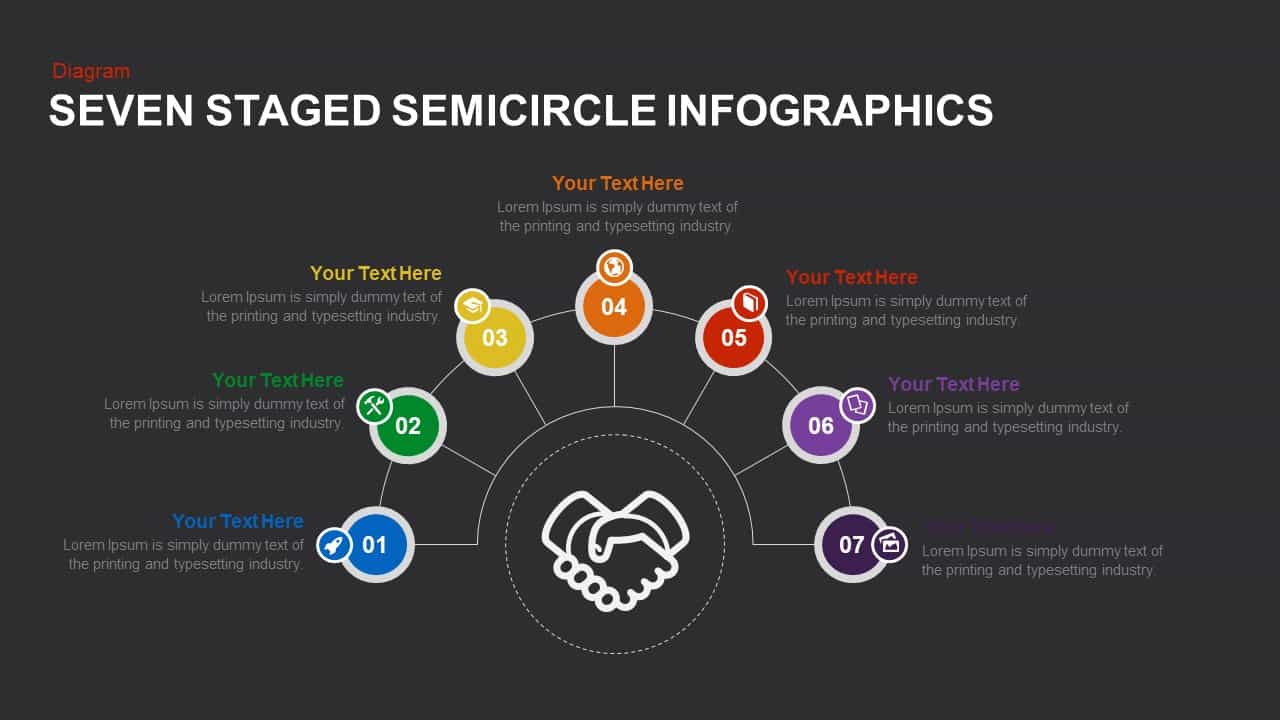
Seven Stage Semicircle Infographic Template for PowerPoint & Google Slides
Process
-

Timeline Infographic Design Seven Stage template for PowerPoint & Google Slides
Timeline
-
Seven-Step Vertical Sales Process Template for PowerPoint & Google Slides
Process
-
Seven-Step Flower Diagram Template for PowerPoint & Google Slides
Circular
-
Seven-Stage Arrow Process Diagram Template for PowerPoint & Google Slides
Process
-
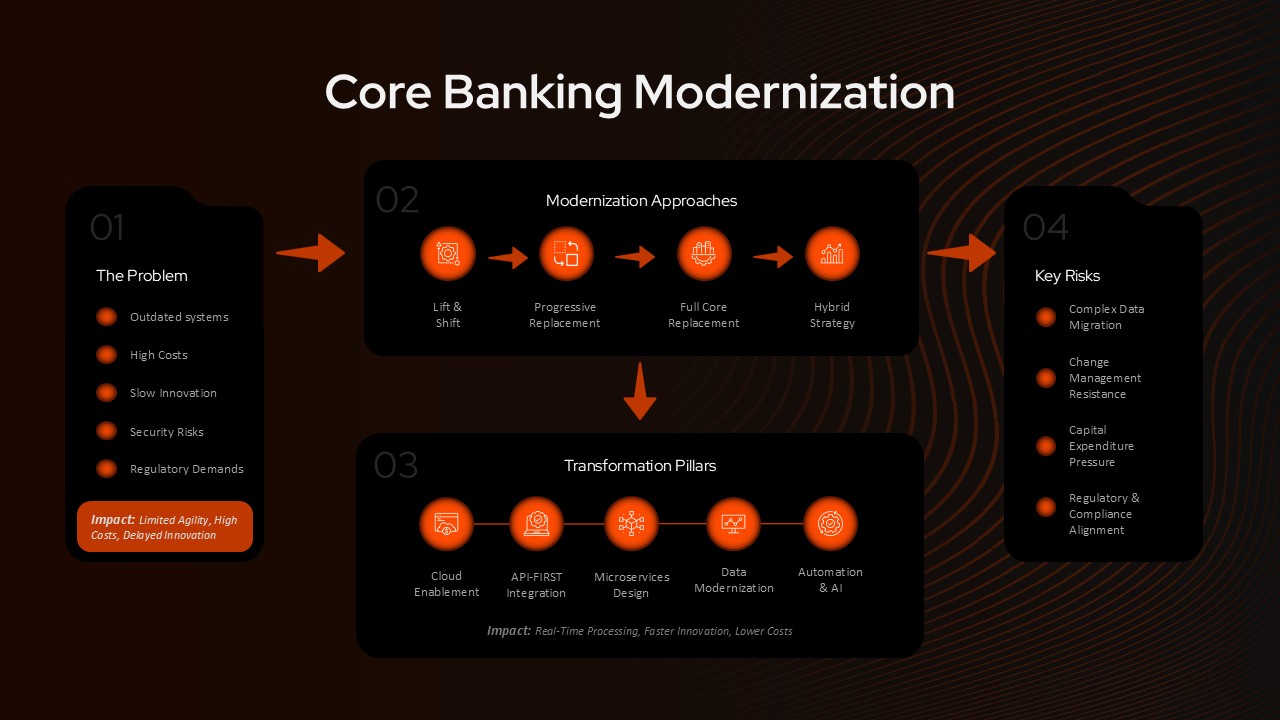
Core Banking Modernization Finance Presentation Template
Information Technology
-
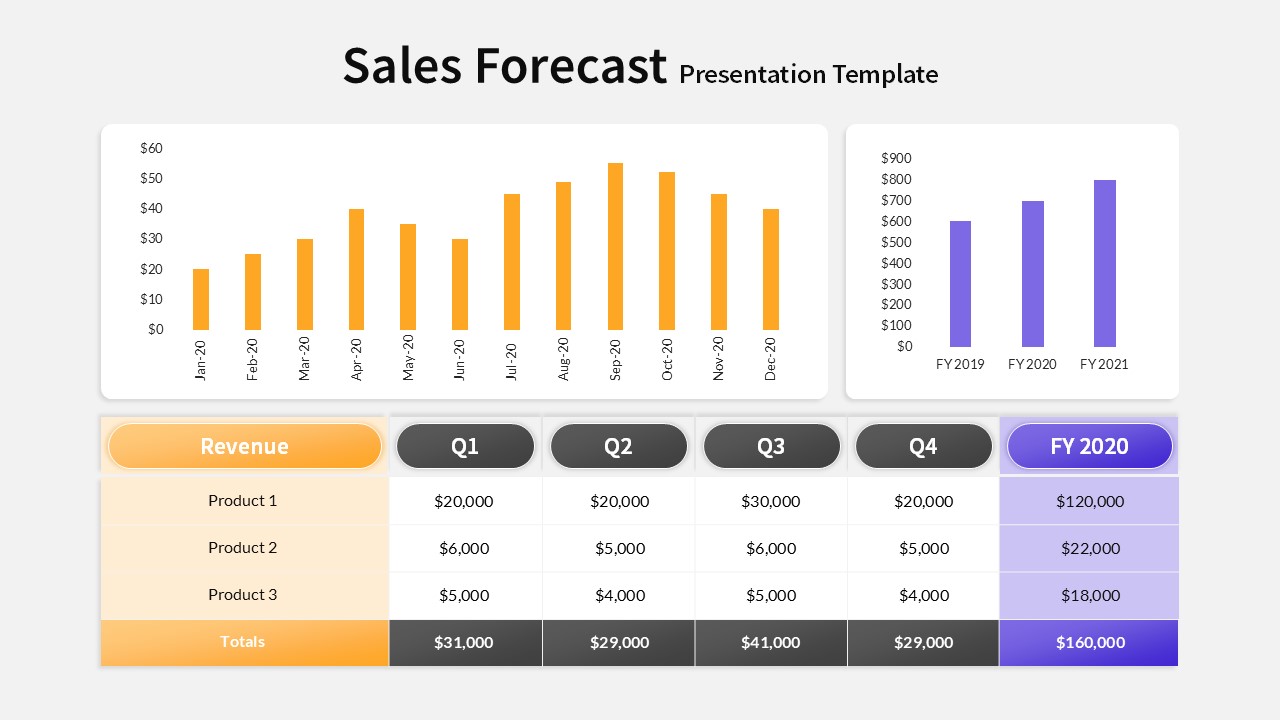
Editable Sales Forecast PPT Template & Slides
Revenue
-
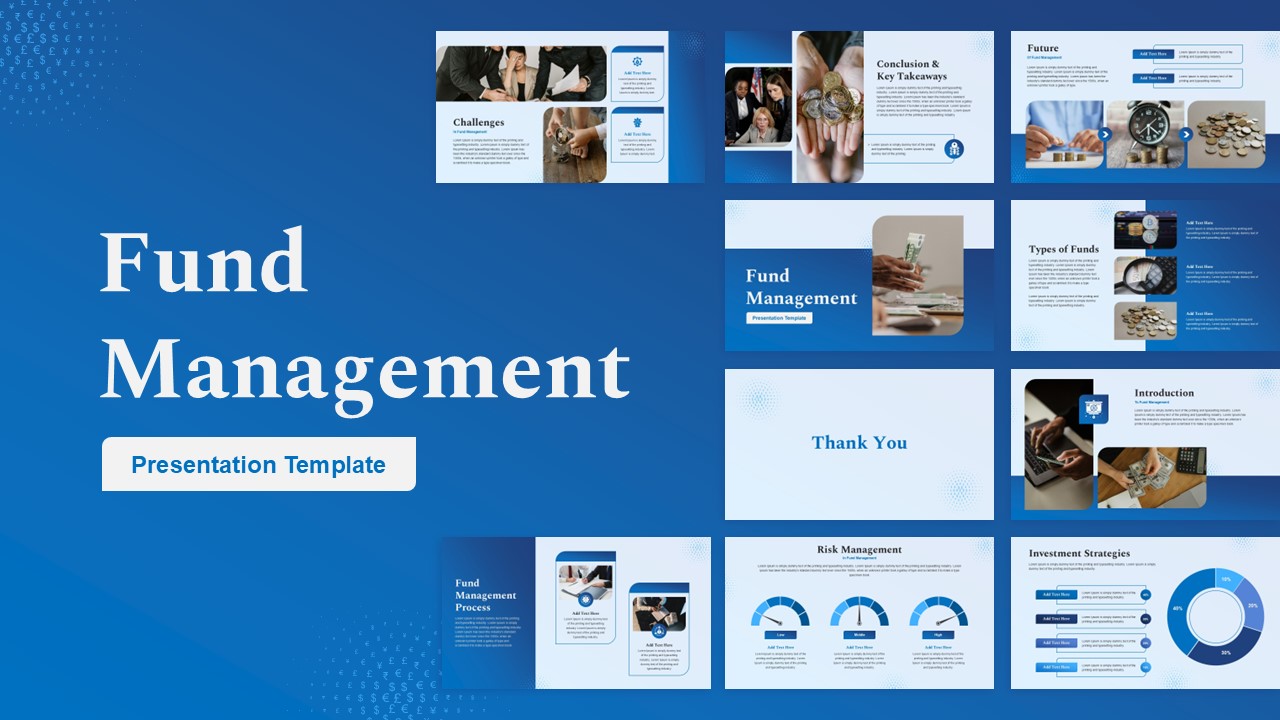
Fund Management Business Strategy Template for PowerPoint & Google Slides
Finance
-

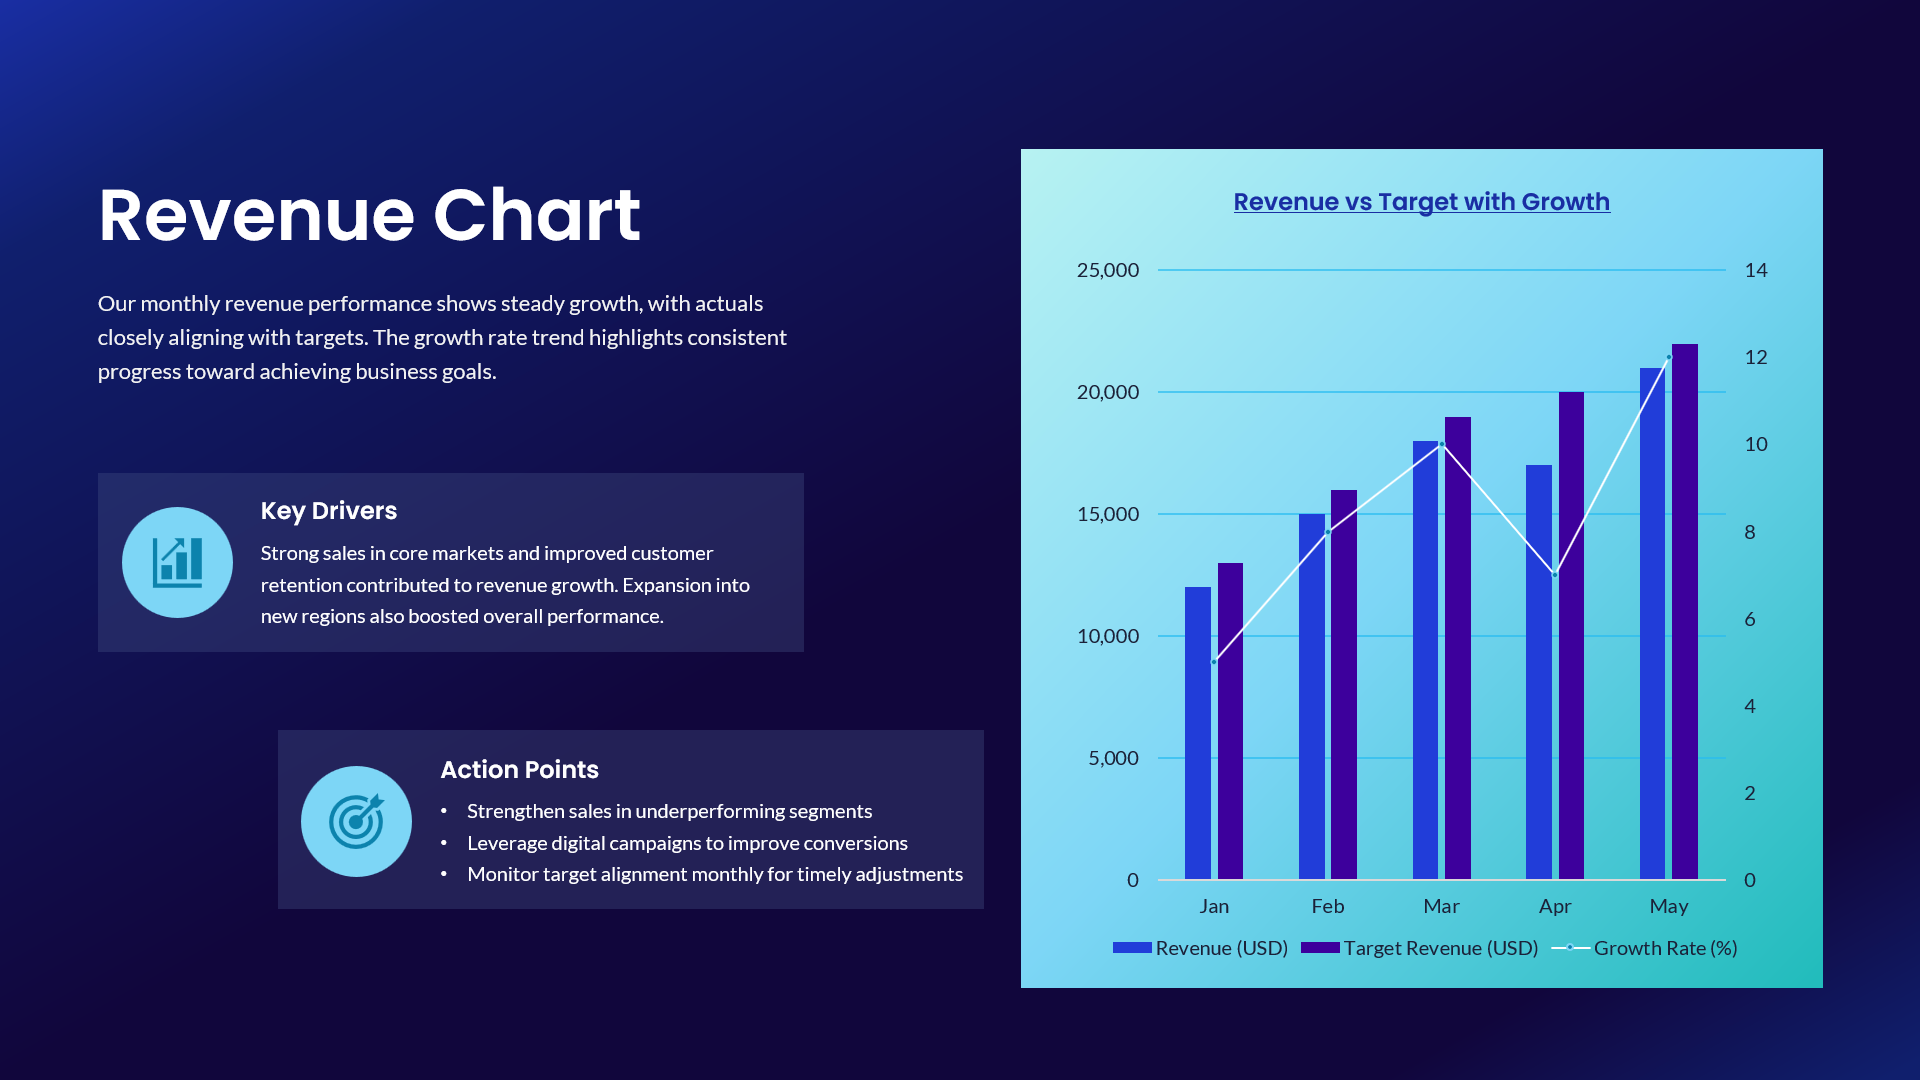
Revenue vs Target Growth Chart Template for PowerPoint & Google Slides
Revenue
-
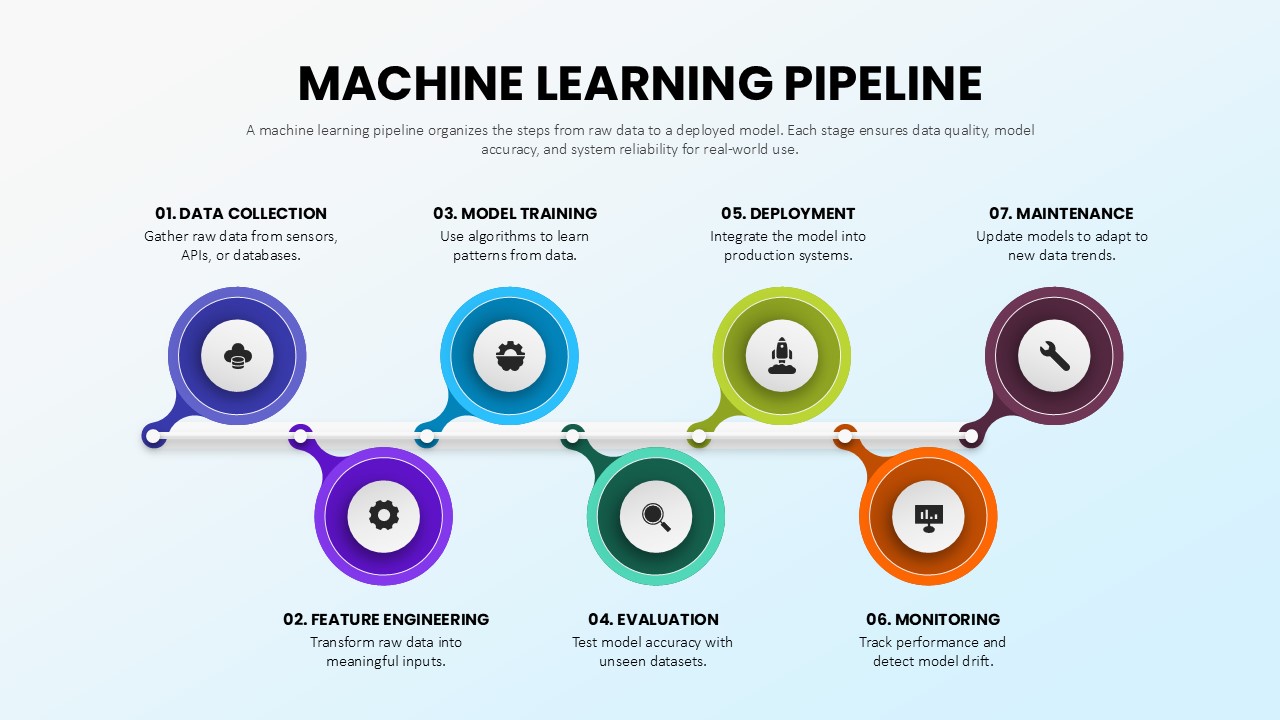
Seven Stage Machine Learning Pipeline Template for PowerPoint & Google Slides
Machine Learning
-
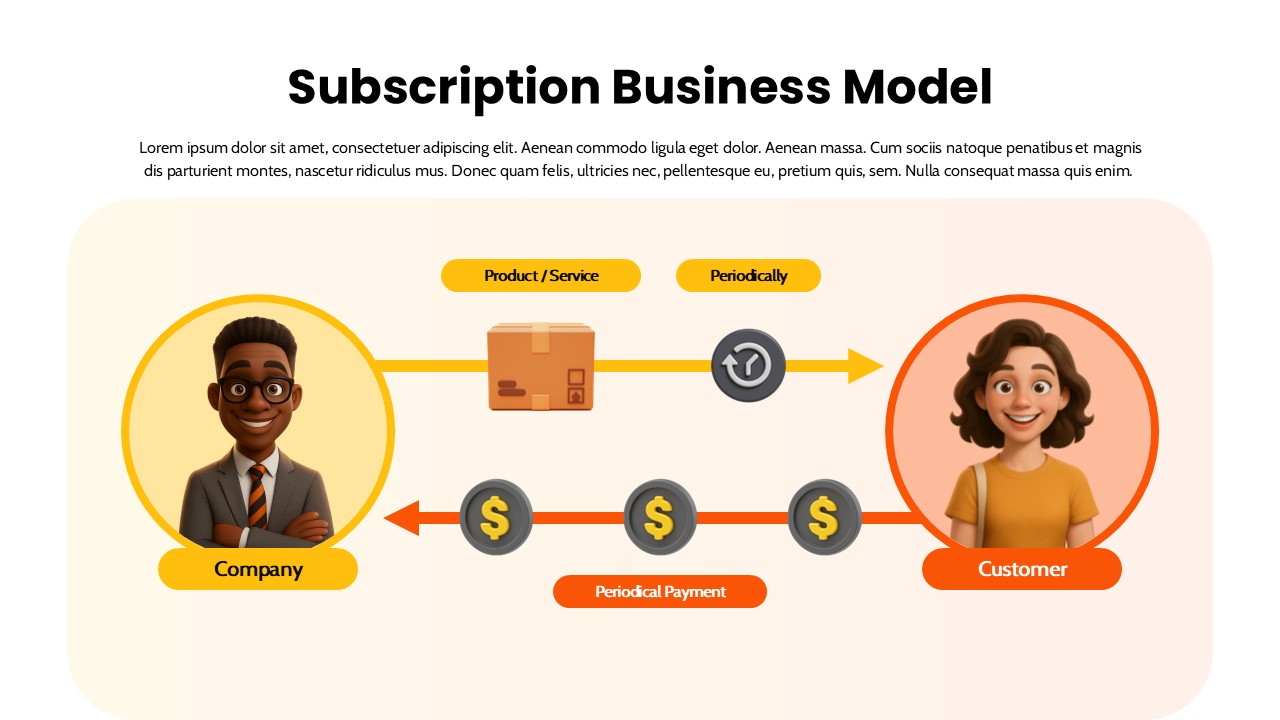
Subscription Business Model Flow Diagram Template for PowerPoint & Google Slides
Business Models
-
Cohort Analysis Retention Dashboard Template for PowerPoint & Google Slides
Comparison Chart
-
Event Planning Gantt Chart template for PowerPoint & Google Slides
Business
-
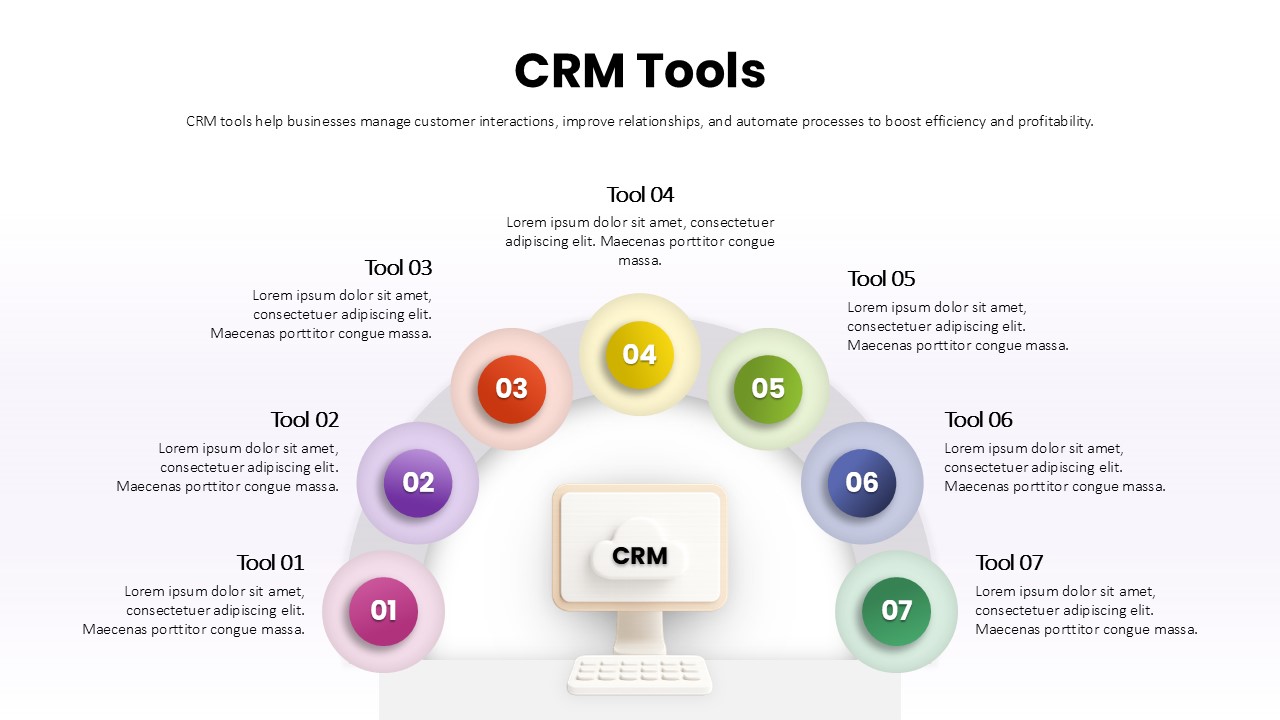
Seven-Part CRM Tools Arc Diagram Template for PowerPoint & Google Slides
Digital Marketing
-
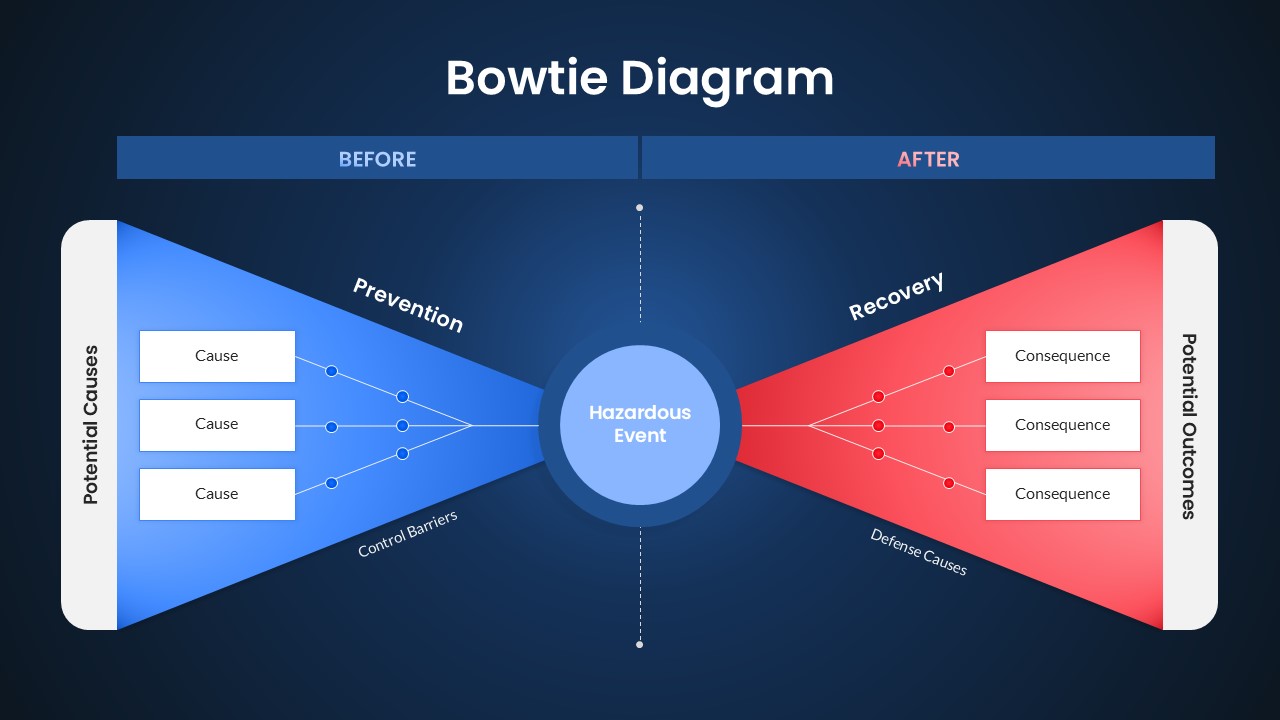
Bowtie Diagram Prevention & Recovery Template for PowerPoint & Google Slides
Decision Tree
-
Six Revenue Stream Model Infographic Template for PowerPoint & Google Slides
Circular
-
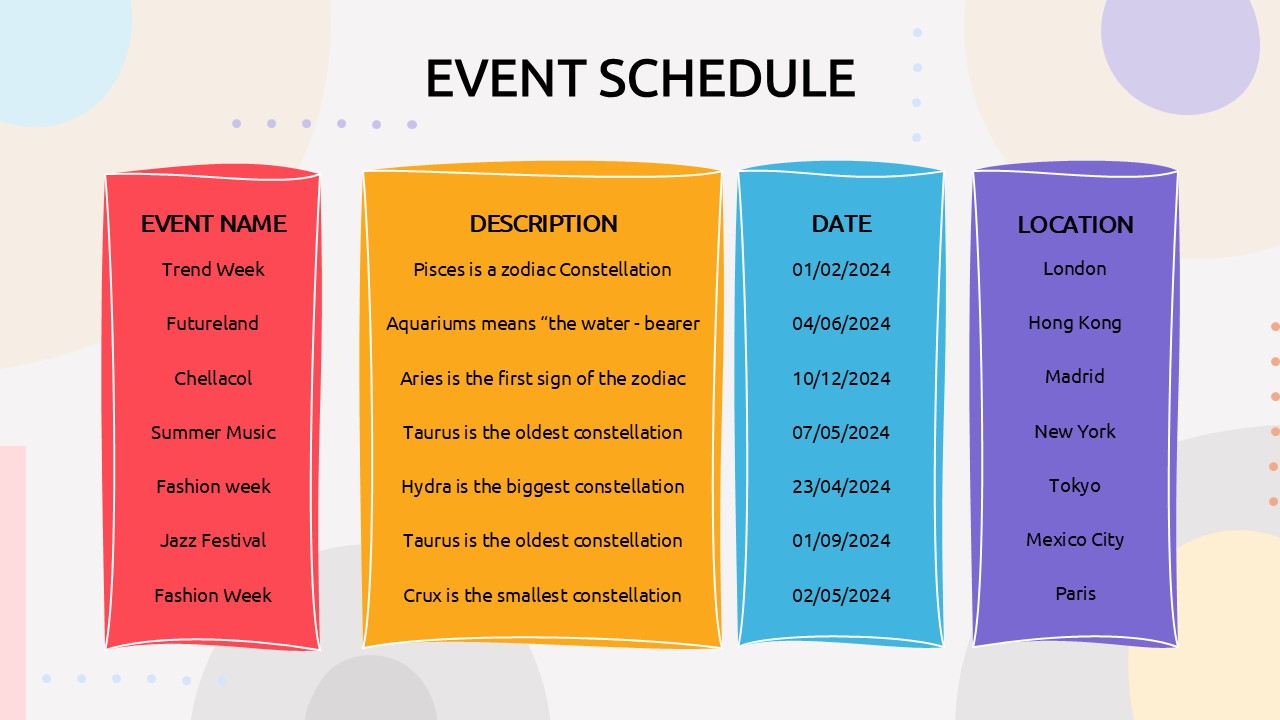
Event Schedule Framework for PowerPoint & Google Slides
Agenda
-
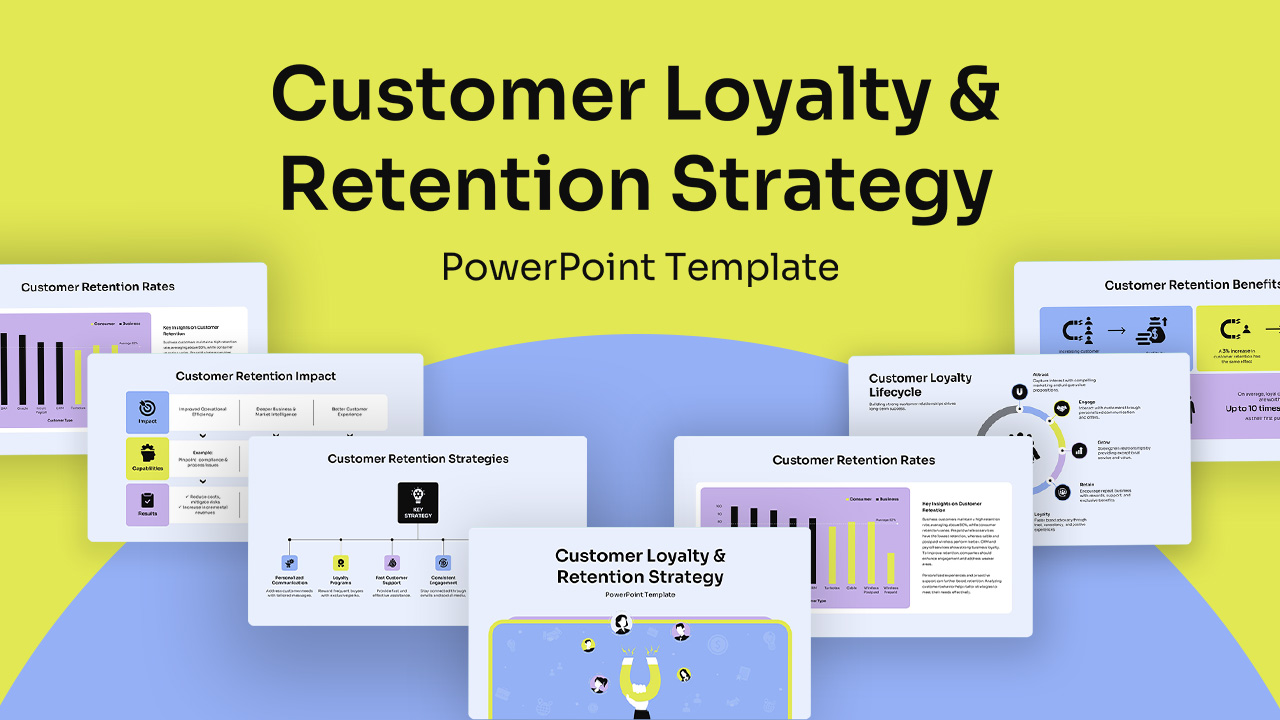
Customer Loyalty and Retention Strategy PowerPoint Template
Business Strategy
-
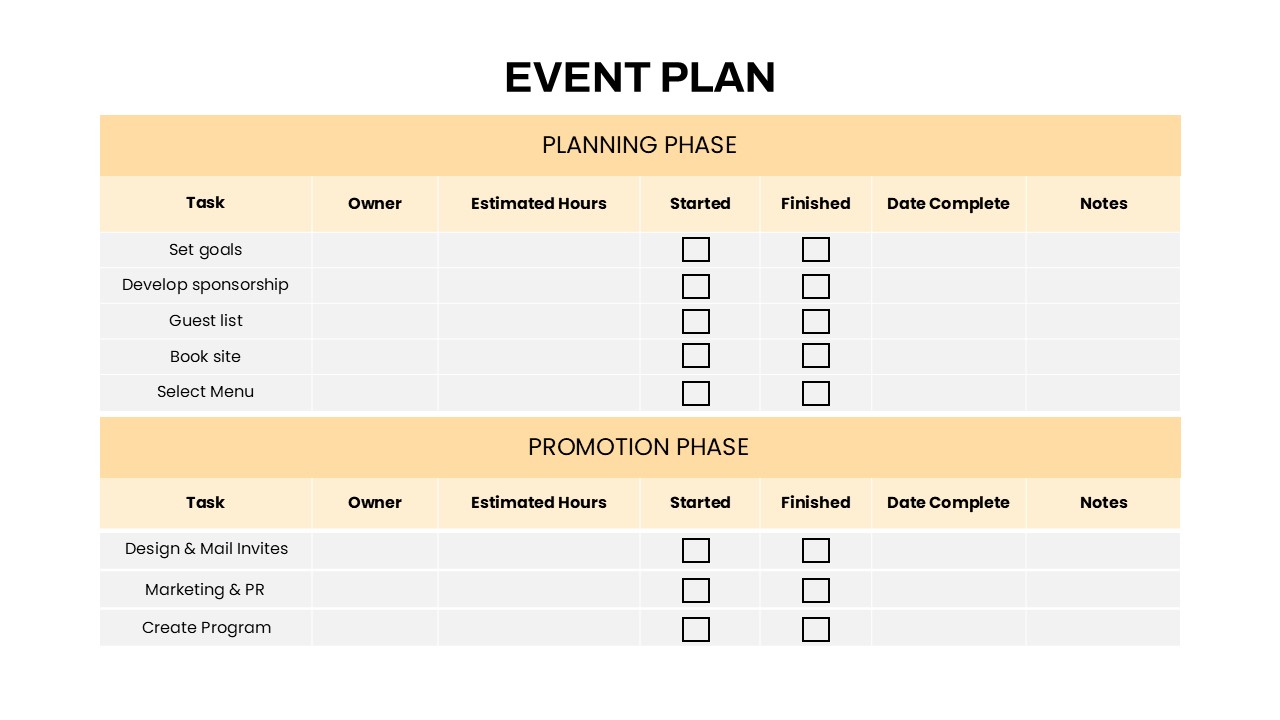
Event Plan Checklist for PowerPoint & Google Slides
Business Plan
-
Mortgage Process Infographic Template for PowerPoint & Google Slides
Finance
-
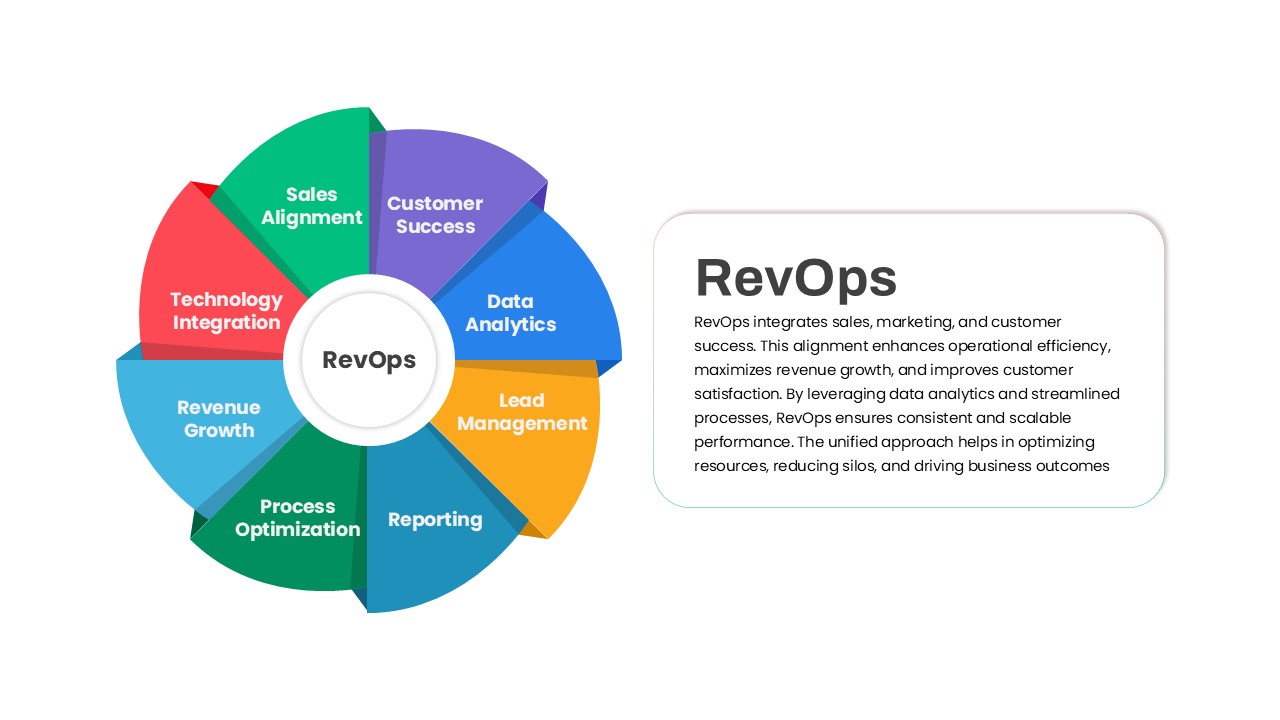
RevOps Revenue Operations Diagram Template for PowerPoint & Google Slides
Revenue