Dashboard Presentation Templates for PowerPoint and Google Slides
![]() Filter
Filter
Filter
-
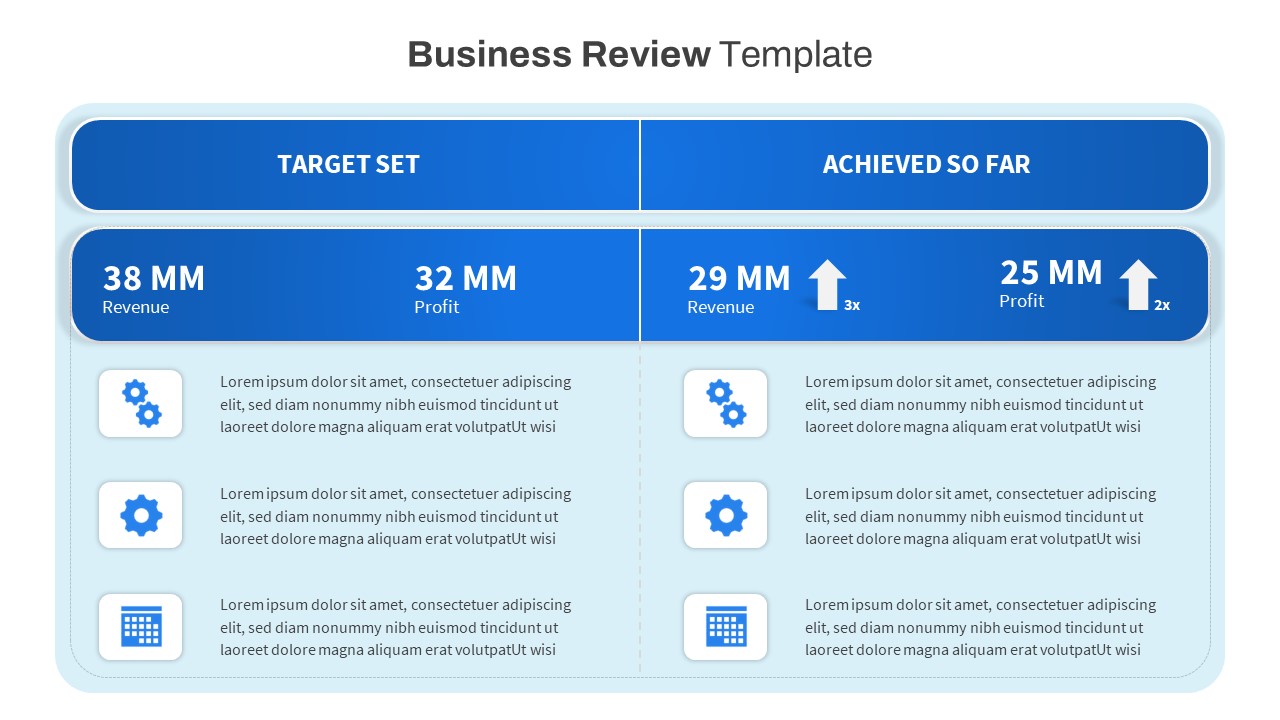
Free Business Review Comparison Slide for PowerPoint & Google Slides
Business Report
Free
-
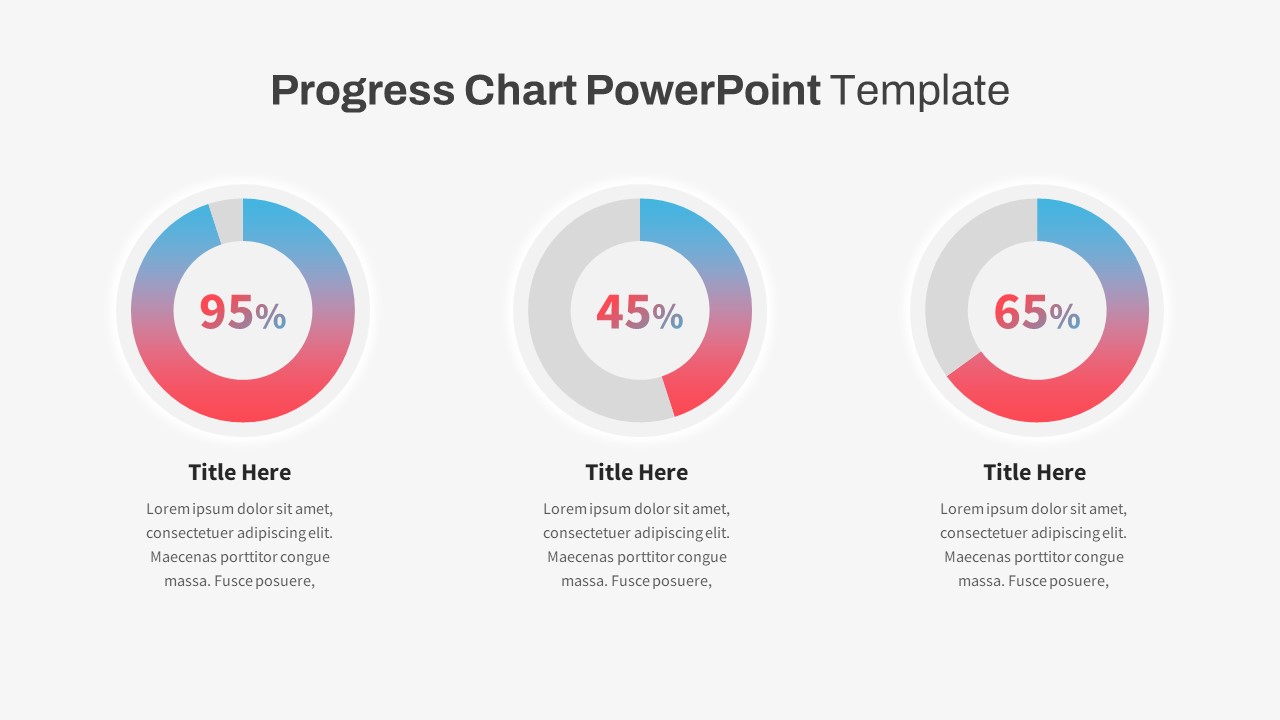
Progress Chart Slide for PowerPoint & Google Slides
Charts
-

Stacked Area Chart with Financial Highlights for PowerPoint & Google Slides
Finance
-
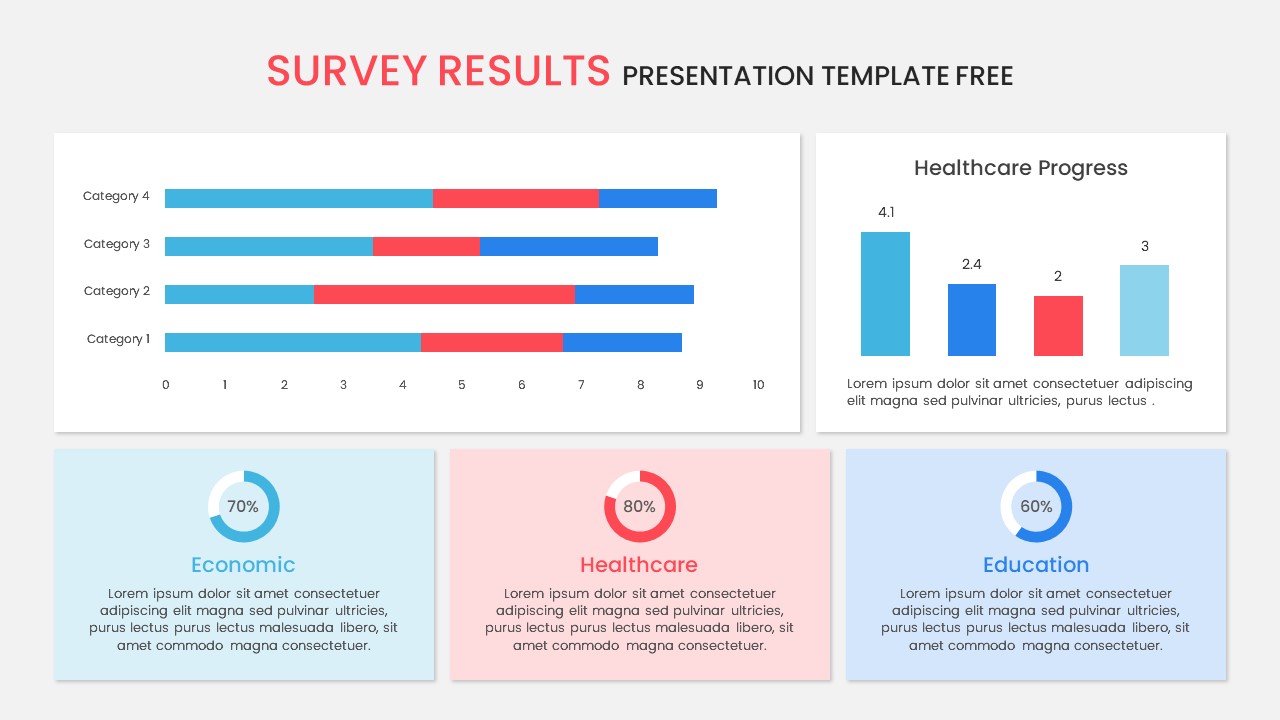
Free Survey Results Analysis Slide for PowerPoint & Google Slides
Business Report
Free
-

Year in Review KPI Highlights Slide for PowerPoint & Google Slides
Business Report
-

Engineering Maintenance Dashboard Slide for PowerPoint & Google Slides
Software Development
-
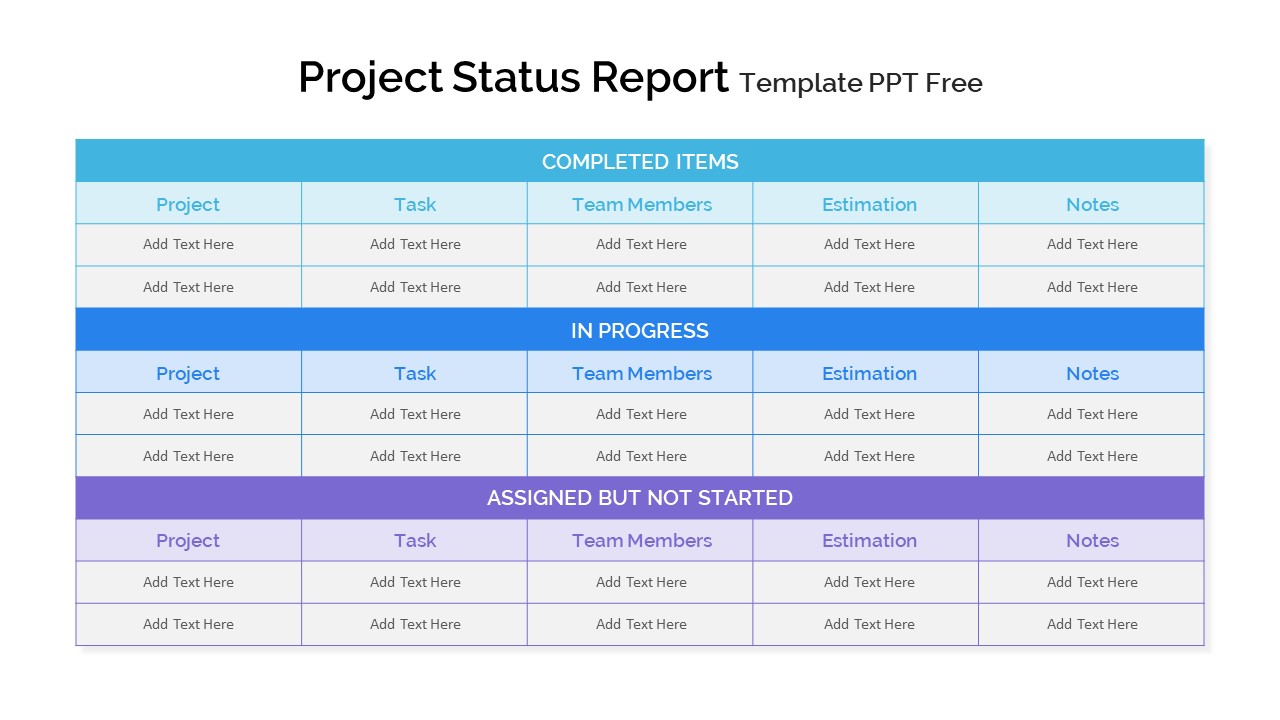
Project Status Report Tracker Slide for PowerPoint & Google Slides
Project Status
-
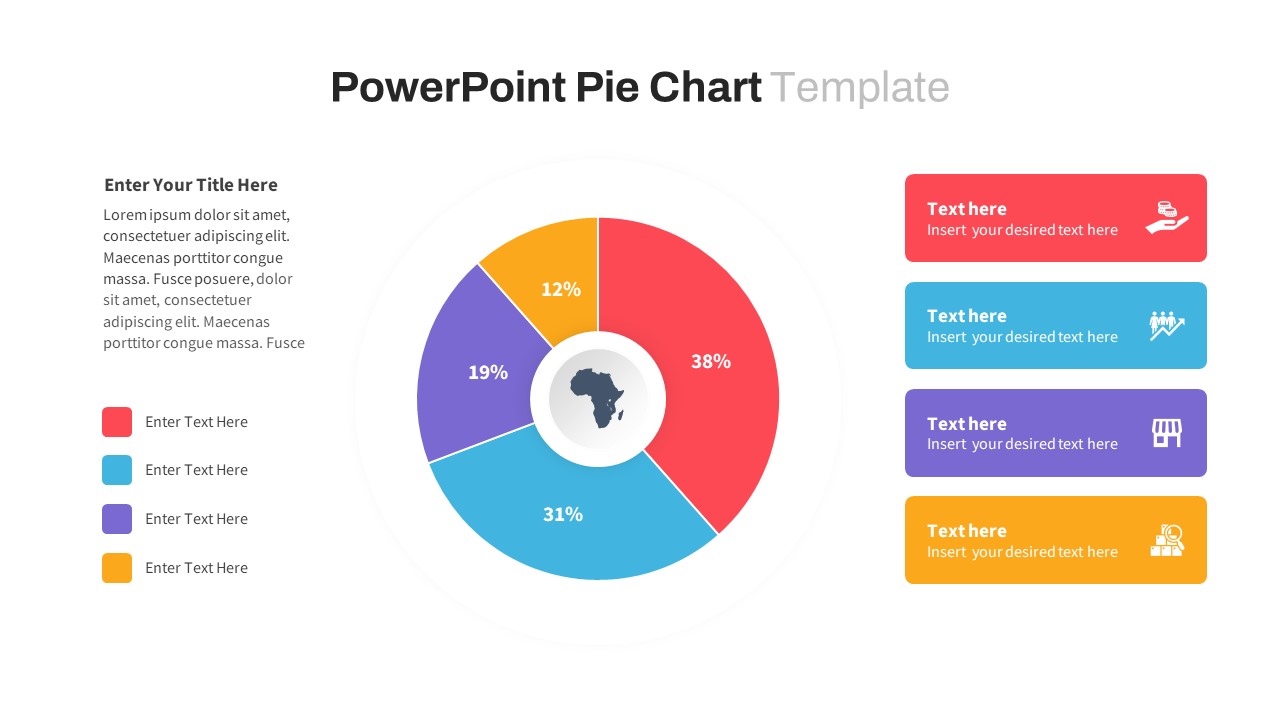
Segmented Pie Chart Infographic with Icons for PowerPoint & Google Slides
Pie/Donut
-

Free Infographic Statistics Dashboard Slide for PowerPoint & Google Slides
Bar/Column
Free
-

Cost Cutting Savings Dashboard Template for PowerPoint & Google Slides
Pie/Donut
-

Interactive Jump Line Data Chart Template for PowerPoint & Google Slides
Comparison Chart
-
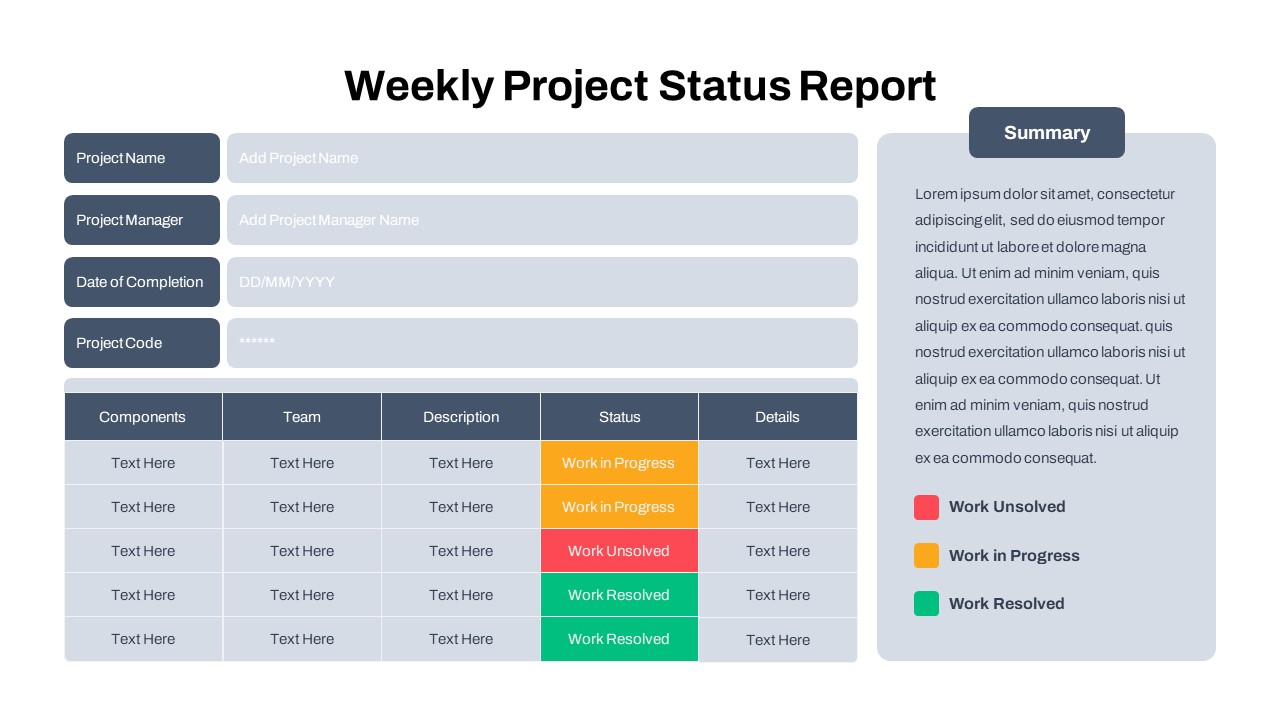
Free Simple Weekly Project Status Report Template for PowerPoint & Google Slides
Project Status
Free
-
Free Quarterly Business Review Dashboard Template for PowerPoint & Google Slides
Business
Free
-
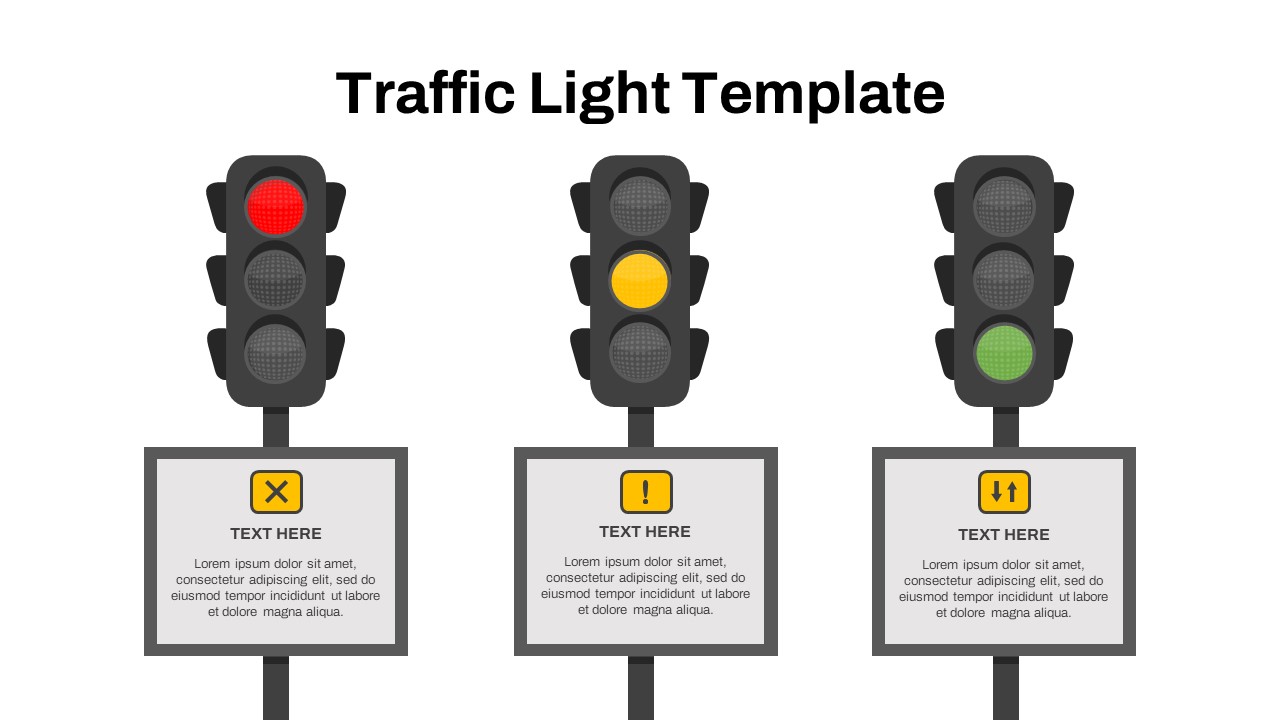
Free Traffic Light Status Indicator Slide Template for PowerPoint & Google Slides
Project Status
Free
-

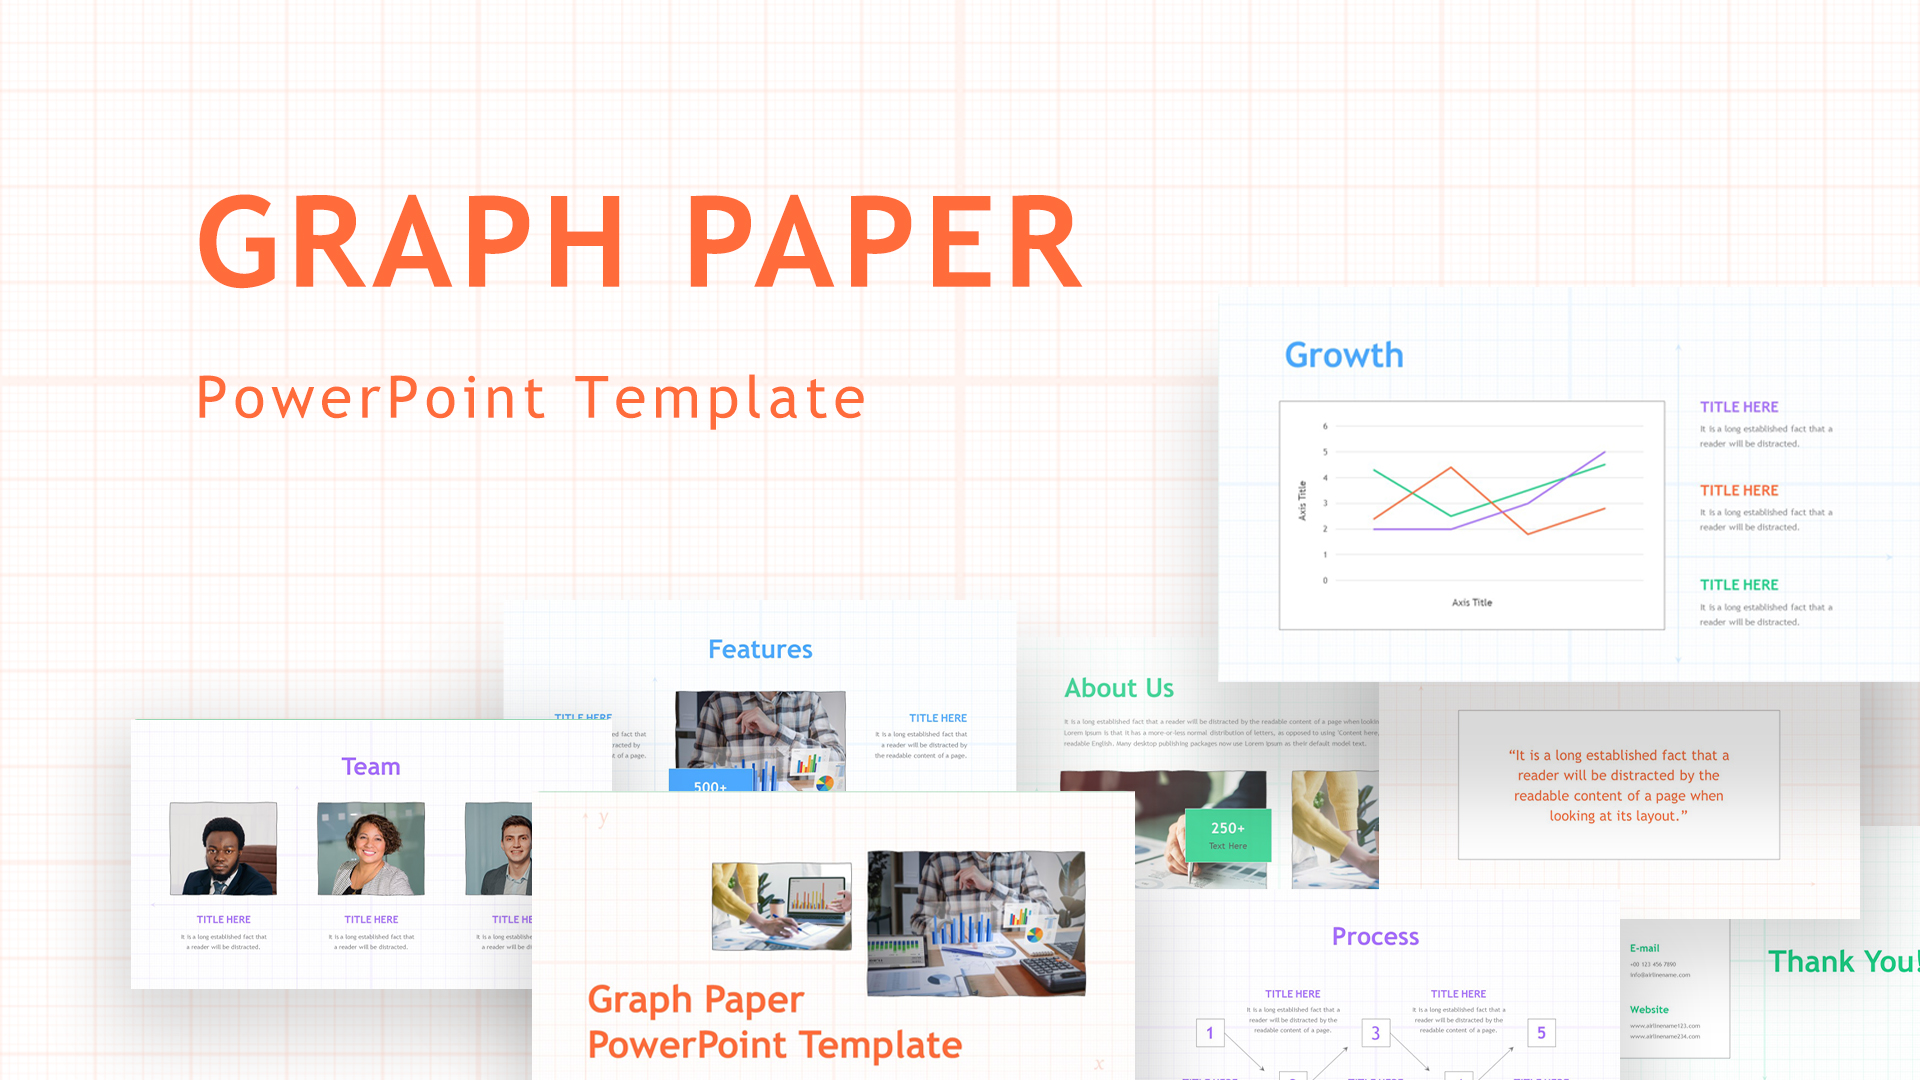
Graph Paper Background Presentation Template for PowerPoint & Google Slides
Company Profile
-
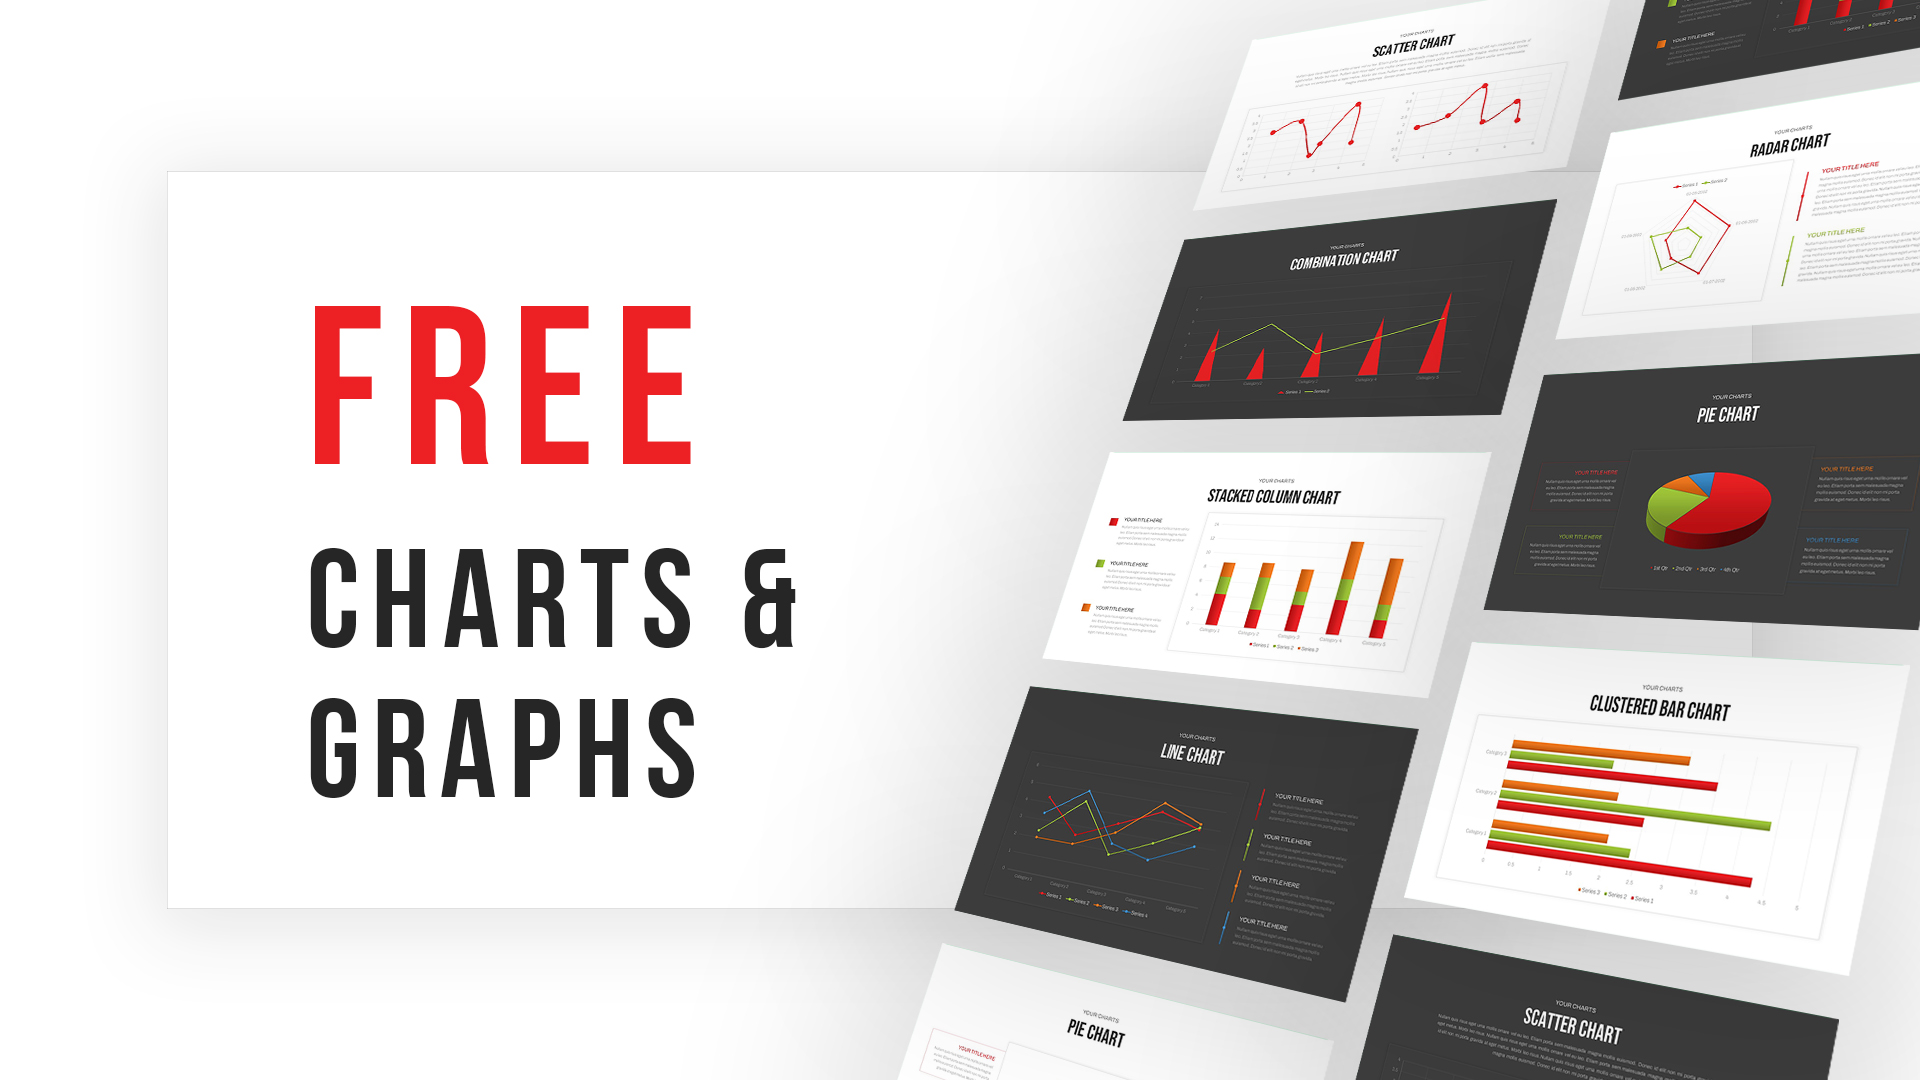
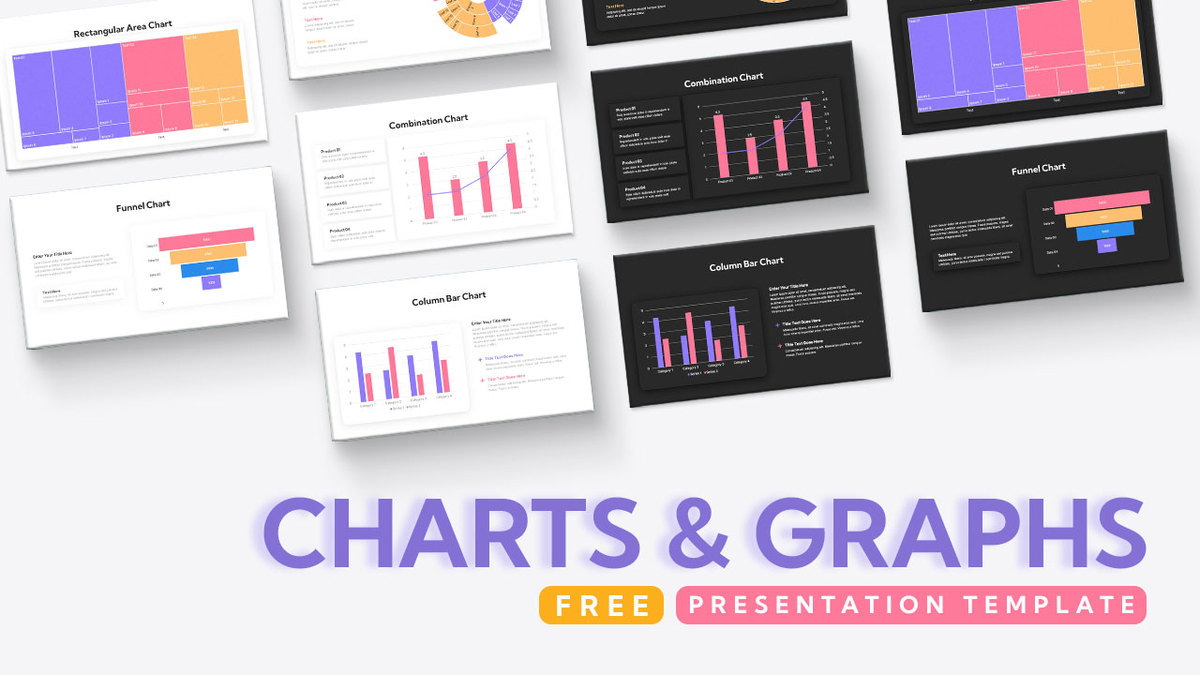
Free Charts & Graphs Presentation Deck Template for PowerPoint & Google Slides
Pitch Deck
Free
-
Progress Bar and Milestone Visualization Template for PowerPoint & Google Slides
Timeline
-

Free Comprehensive Charts & Graphs Template for PowerPoint & Google Slides
Charts
Free
-
Free Clean Company Profile Presentation Template for PowerPoint & Google Slides
Company Profile
Free
-
Multipurpose Spline Chart Data Trend Template for PowerPoint & Google Slides
Bar/Column
-
Multi-Variation Thermometer Chart Template for PowerPoint & Google Slides
Bar/Column
-
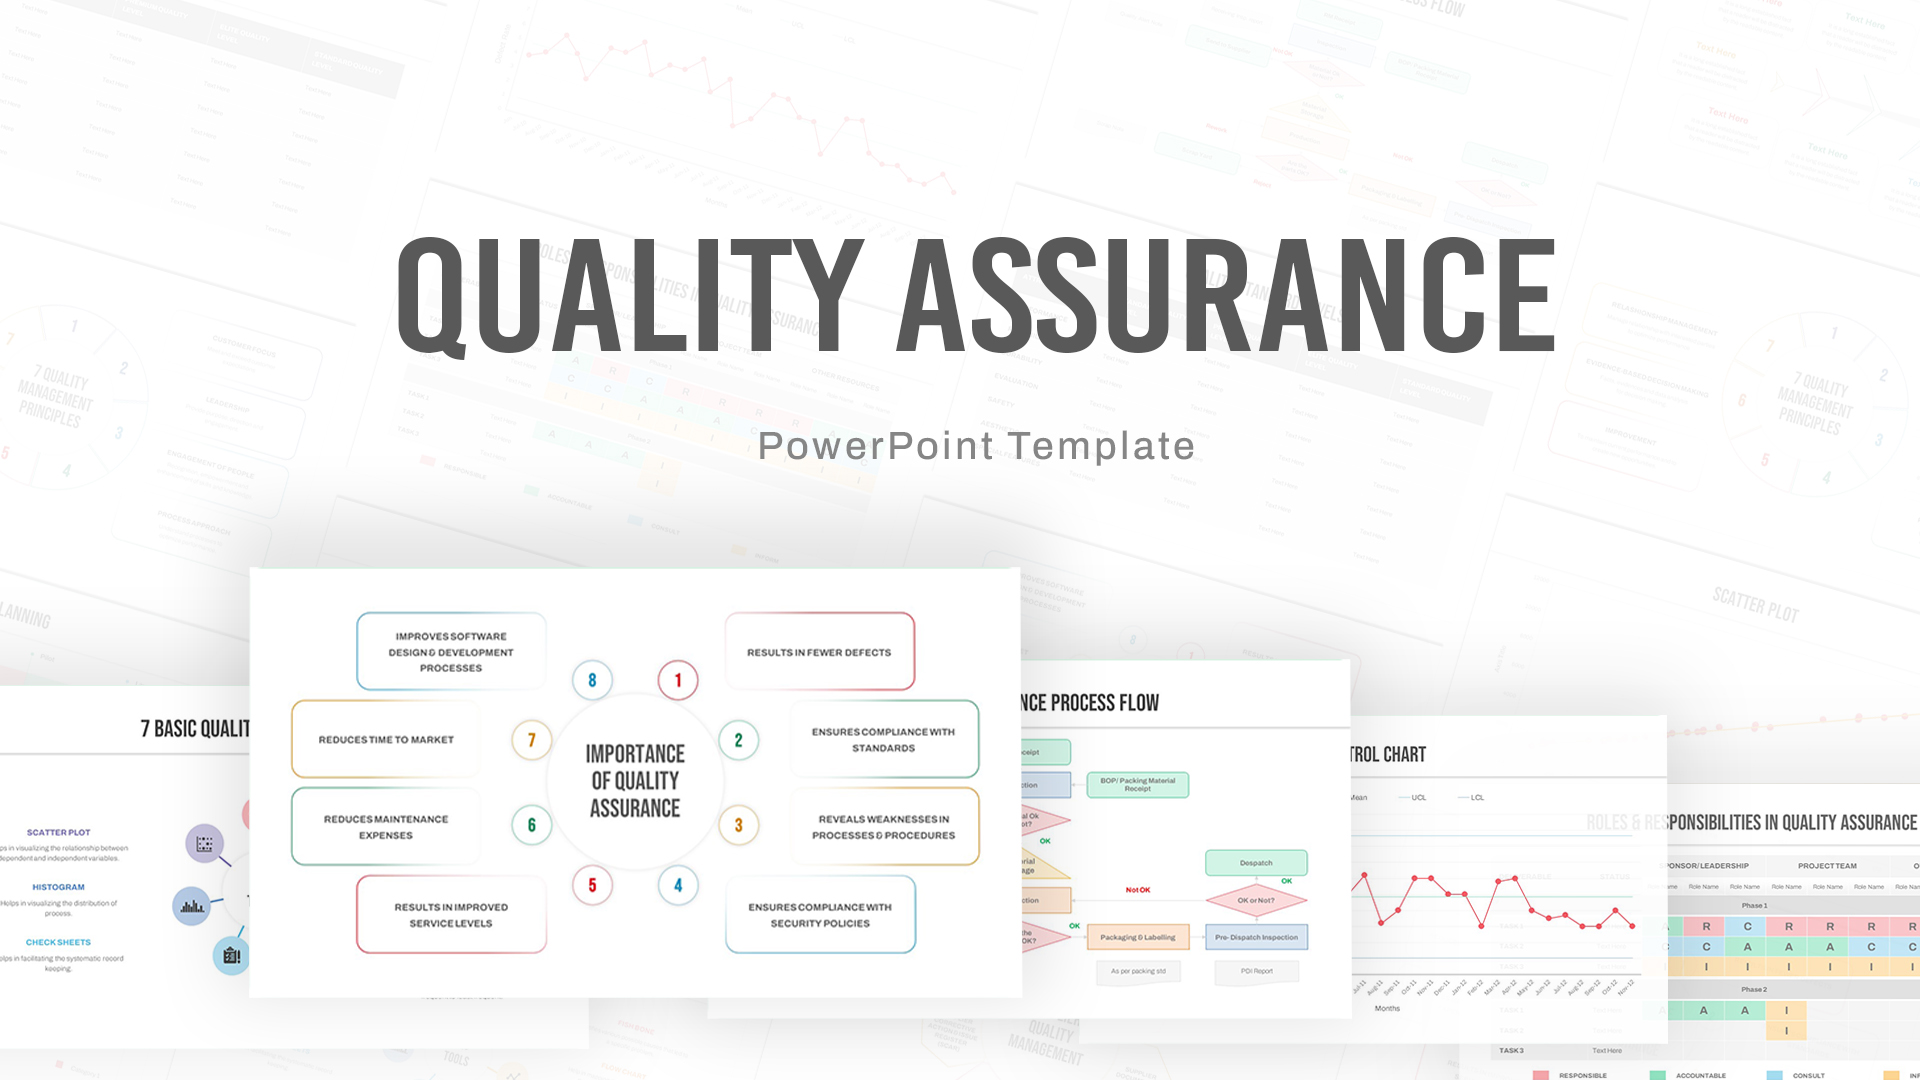
Comprehensive Quality Assurance Workflow Template for PowerPoint & Google Slides
Company Profile
-
Multi-Series Vertical Dot Chart Template for PowerPoint & Google Slides
Comparison Chart
-
Multi-Series Line Chart with Icons Template for PowerPoint & Google Slides
Comparison Chart
-
Nuclear Energy Presentation Deck Template for PowerPoint & Google Slides
Pitch Deck
-
Waterfall Chart Data Visualization Template for PowerPoint & Google Slides
Comparison Chart
-
Year-over-Year Stacked Gender Bar Chart Template for PowerPoint & Google Slides
Bar/Column
-
Multiple Line Chart Comparison Template for PowerPoint & Google Slides
Comparison Chart
-
Freight Logistics Dashboard Infographic Template for PowerPoint & Google Slides
Comparison Chart
-
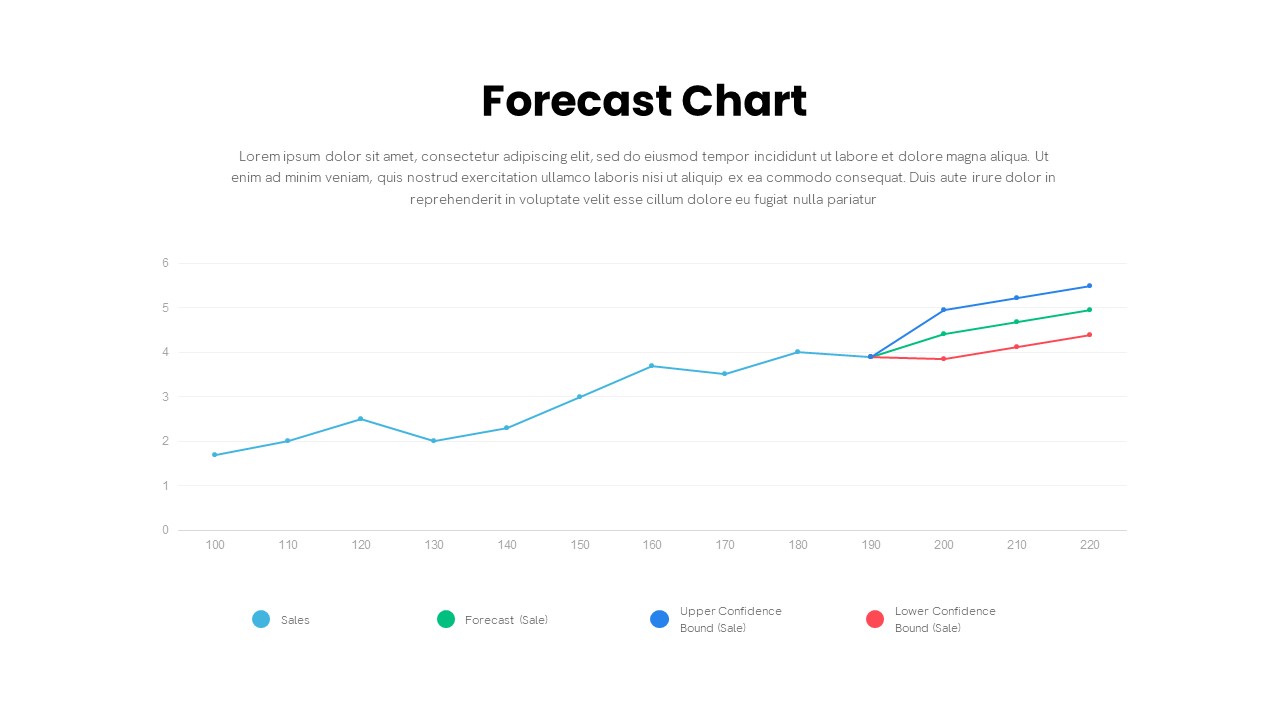
Forecast Chart with Confidence Bounds Template for PowerPoint & Google Slides
Comparison Chart
-
Arrow Line Chart Template for PowerPoint & Google Slides
Comparison Chart
-
Simple Area Chart Data Trends Analysis Template for PowerPoint & Google Slides
Comparison Chart
-
Editable Multi-Series Peak Line Chart Template for PowerPoint & Google Slides
Comparison Chart
-
Minimal Multi-Year Column Chart Template for PowerPoint & Google Slides
Bar/Column
-
Simple Bar Chart Data Visualization Template for PowerPoint & Google Slides
Bar/Column