Current vs Future State Comparison Slide Template for PowerPoint & Google Slides


Description
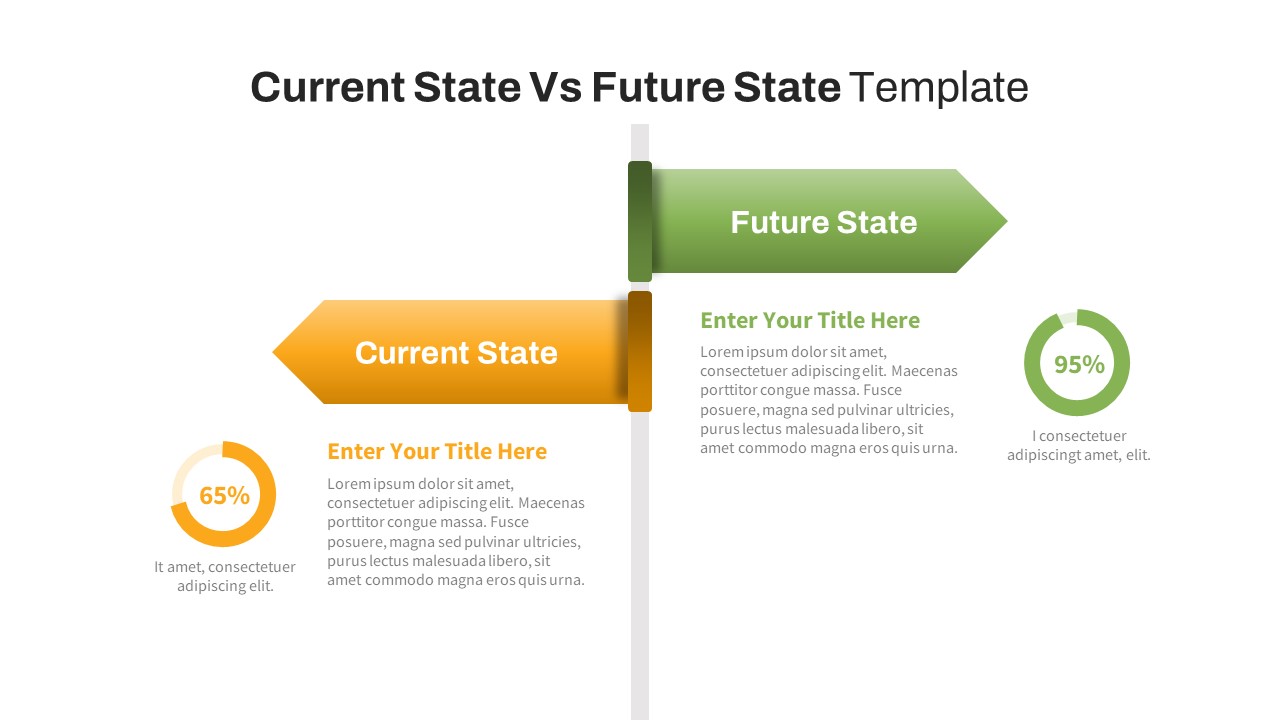
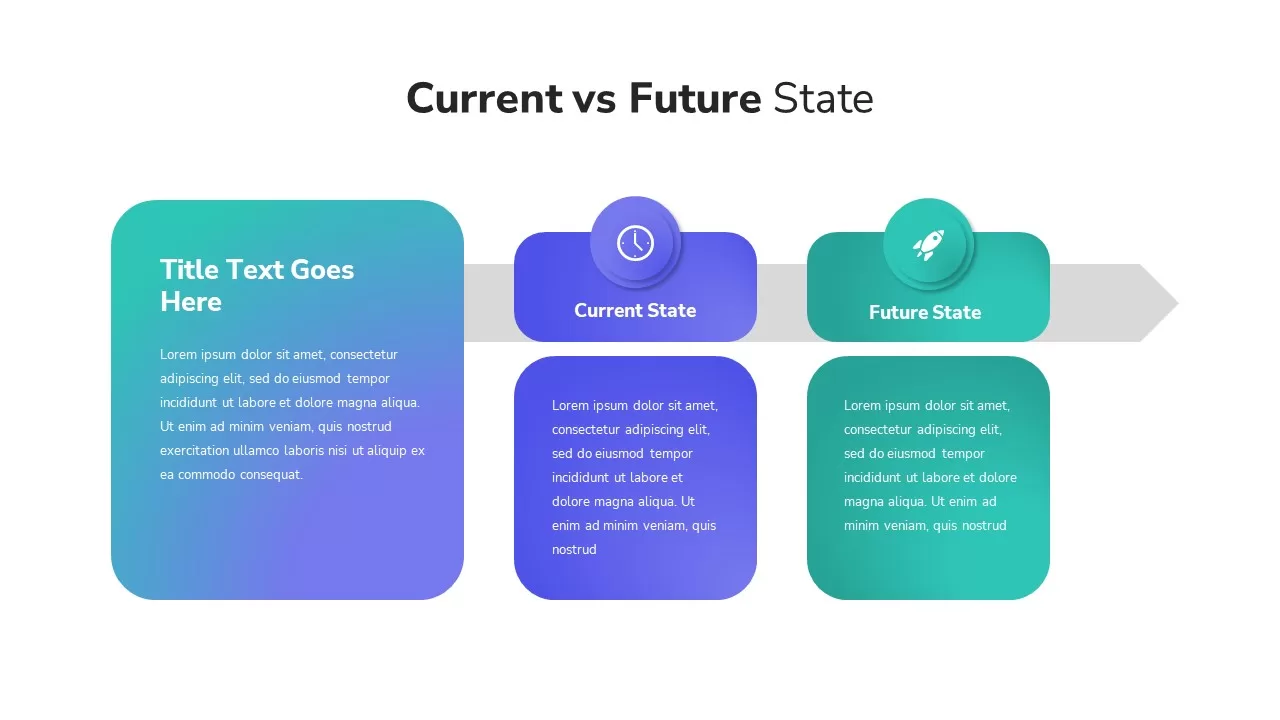
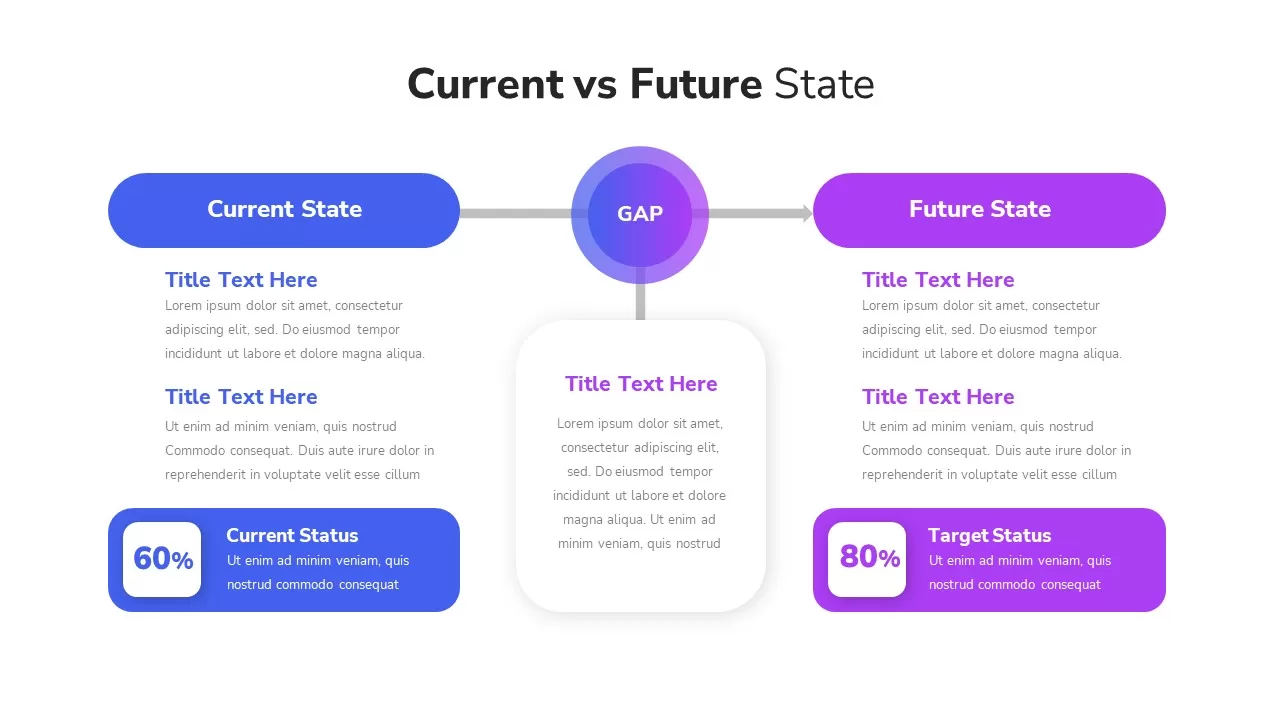
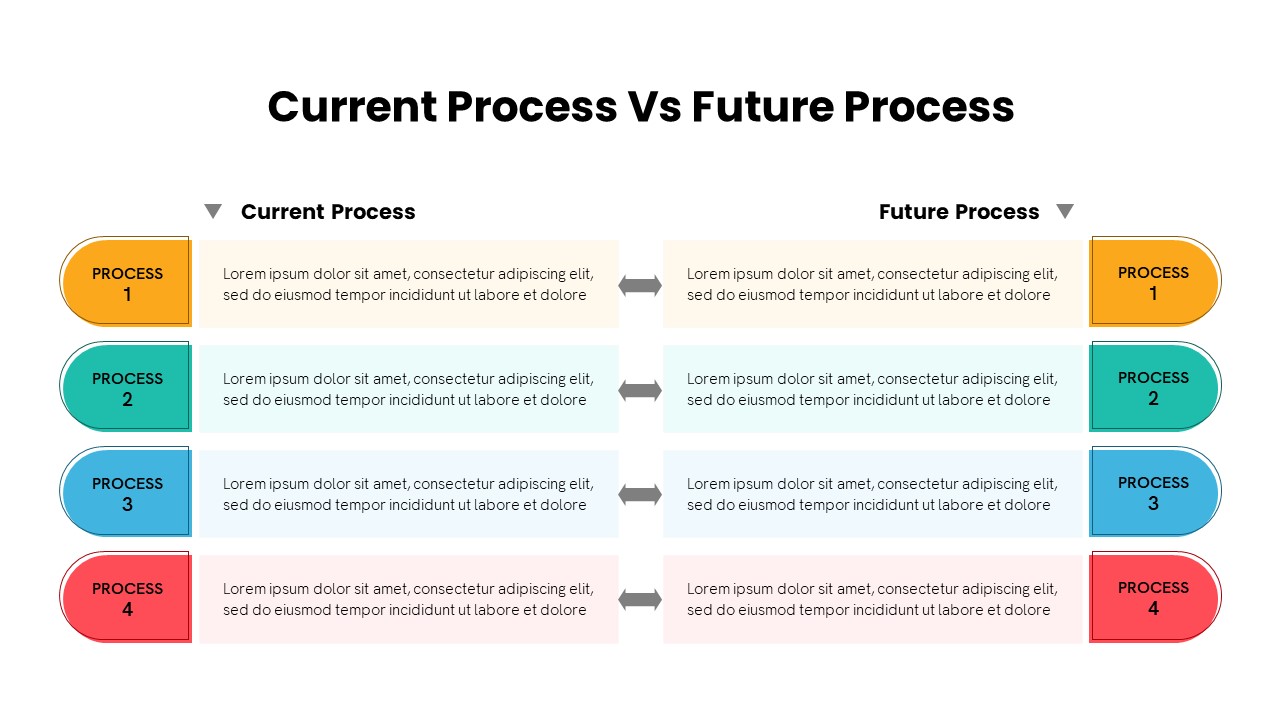
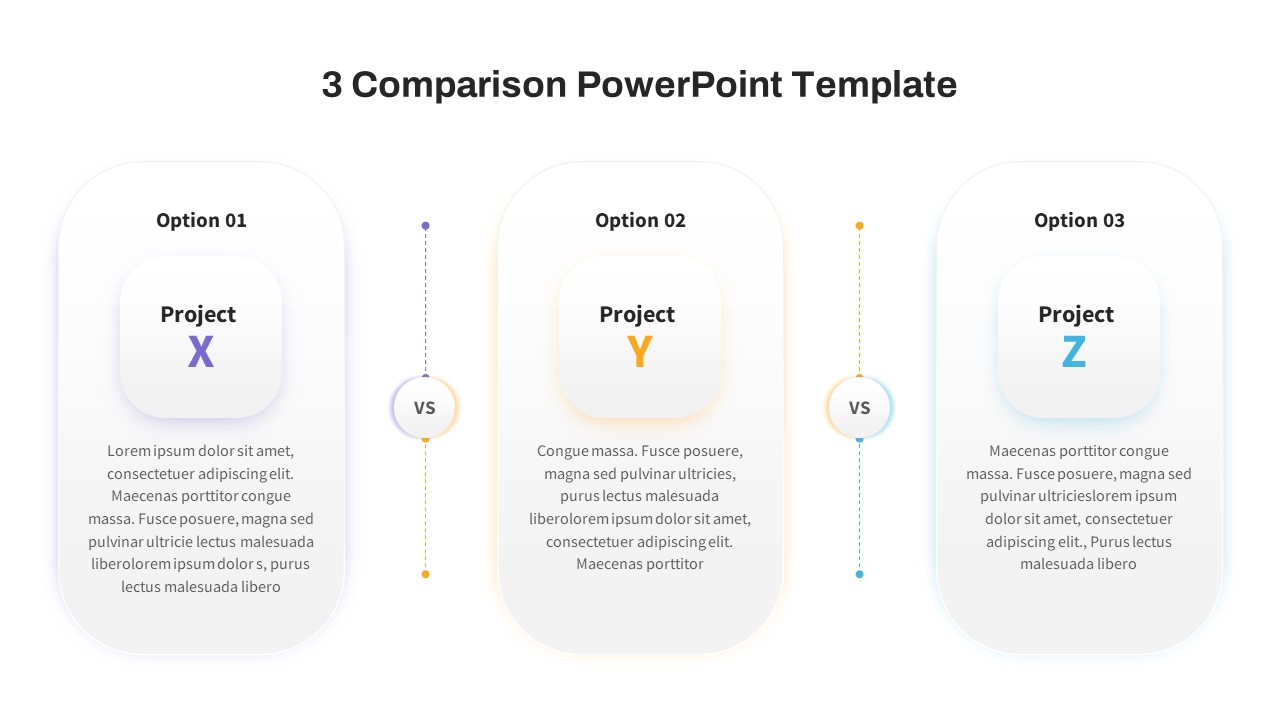
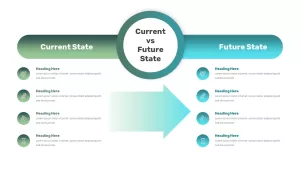
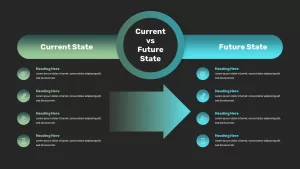
This slide showcases a dual-state comparison layout, positioning a large gradient arrow at its center to guide viewers from left to right. On the left, a rounded pill shape tinted in a soothing green gradient serves as the “Current State” header, while its counterpart on the right appears in vibrant cyan to denote the “Future State.” These contrasting color blocks anchor the design and immediately convey progression. Between them, a central circular hub links the two phases, reinforcing the theme of transformation. Subtle drop shadows add depth, and the smooth gradient transitions create a modern, visually engaging aesthetic.
Beneath each header, four icon-accented text placeholders align vertically. Each item comprises a circular icon background matched to its section’s color scheme—green icons on the left, cyan icons on the right—coupled with clean sans-serif headings and neutral gray body text. This structured arrangement allows presenters to outline key attributes, challenges, opportunities, or action items associated with both states. A large gradient arrow in the center, fading from green to cyan, further highlights the directional flow from present to future, while dashed connector lines link the arrow to specific text markers for clarity.
Built on fully editable master slides for both PowerPoint and Google Slides, the template features vector shapes, gradient fills, and hidden alignment guides. Users can effortlessly modify gradient directions, adjust pill sizes, swap icons, and update text without manual realignment. Predefined text styles and snap-to-grid functionality guarantee consistent formatting across devices and eliminate version control headaches. Whether illustrating a process improvement analysis, organizational transformation roadmap, or performance gap assessment, this layout streamlines complex data into an intuitive visual narrative.
Who is it for
Business strategists, project managers, and change leaders who need to compare current operations with desired future outcomes. Ideal for organizational transformation workshops, performance reviews, and executive briefings where clear before-and-after visuals drive alignment.
Other Uses
Repurpose this slide for gap analyses, maturity assessments, or risk versus reward comparisons. Use it to map technology migrations, customer journey improvements, or training program rollouts—simply adjust icons, headings, and gradients to suit any dual-state scenario.
Login to download this file

Item ID
SB02775
Related Templates

Free Current State vs Future State Template for PowerPoint & Google Slides
Business Strategy
Free
Current vs Future State Comparison Slide Template for PowerPoint & Google Slides
Comparison Chart
Current vs Future State Comparison Template for PowerPoint & Google Slides
Comparison Chart
Modern Current vs Future State Template for PowerPoint & Google Slides
Comparison
Current vs Future State Venn Diagram Template for PowerPoint & Google Slides
Comparison
Current vs Future State Analysis template for PowerPoint & Google Slides
Comparison
Current vs Future State Gap Analysis template for PowerPoint & Google Slides
Comparison
Current VS Future State PowerPoint Presentation Template
Comparison Chart
Current State Assessment Template for PowerPoint & Google Slides
Gap
Current vs Future Process Flow Template for PowerPoint & Google Slides
Comparison
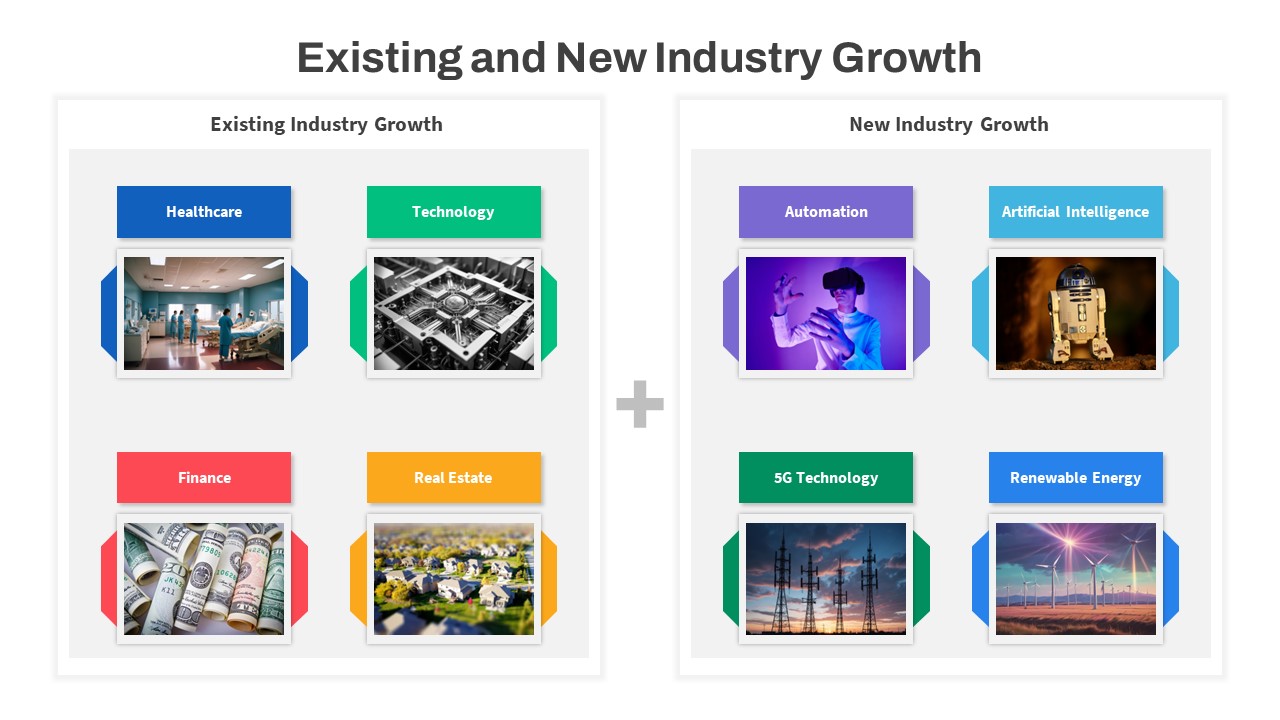
Current and Future Industry Innovations Template for PowerPoint & Google Slides
Comparison
Customizable USA Map With State Markers Template for PowerPoint & Google Slides
World Maps
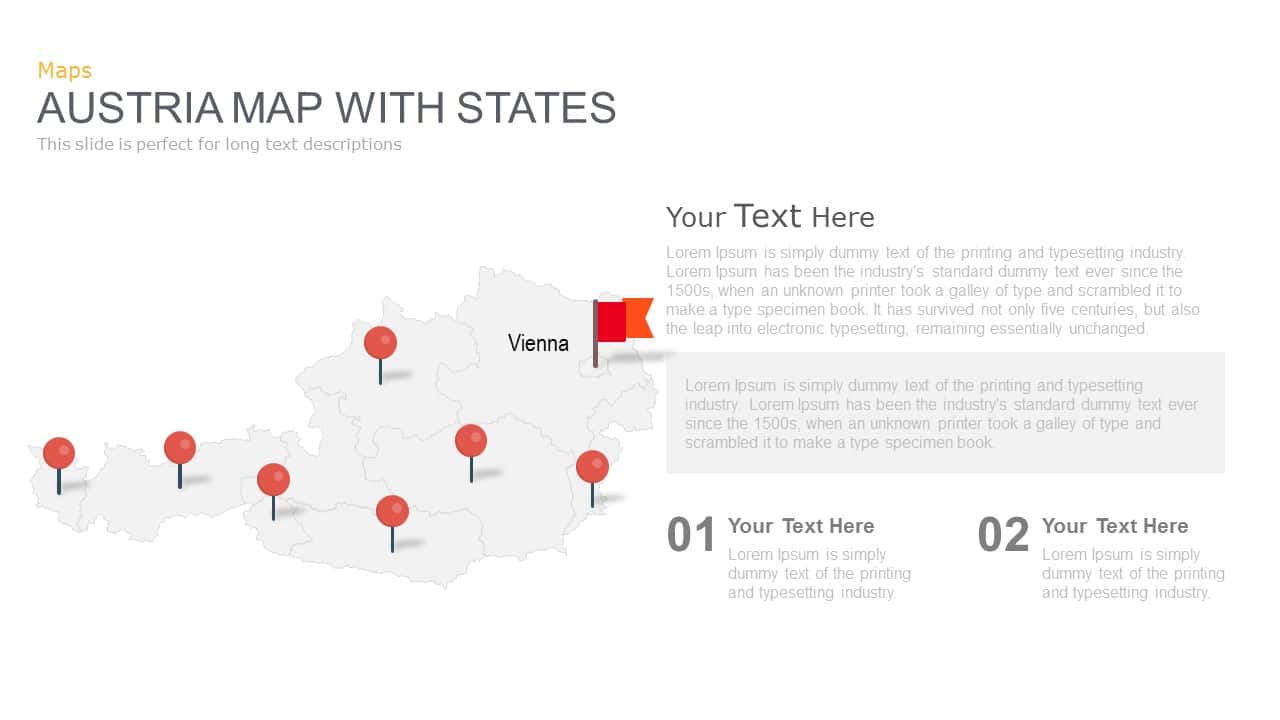
Austria Map With State Markers Template for PowerPoint & Google Slides
World Maps

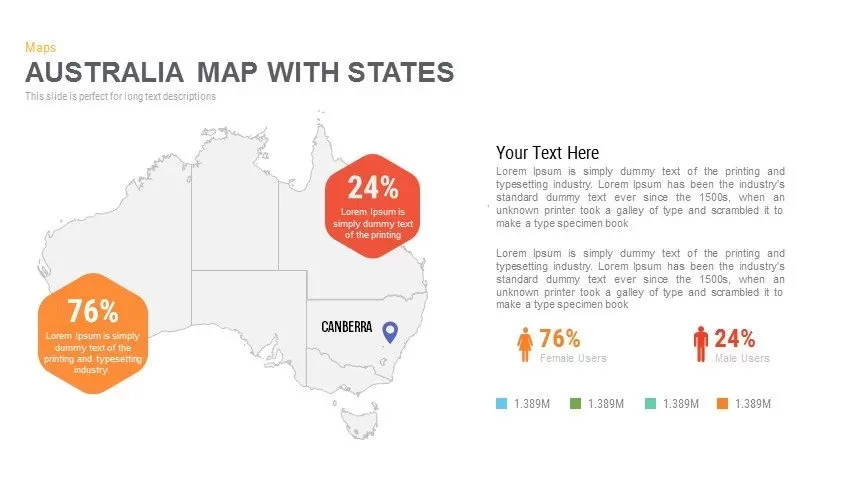
Australia Map with State Markers Template for PowerPoint & Google Slides
Maps
Pennsylvania State Map Diagram Template for PowerPoint & Google Slides
World Maps
AI & Future of Work Gradient Cover Slide Template for PowerPoint & Google Slides
AI
Future Outlook and Growth Strategy Slide Template for PowerPoint & Google Slides
Infographics
Past, Present & Future Venn Diagram Template for PowerPoint & Google Slides
Comparison
Diagonal Future Timeline Template for PowerPoint & Google Slides
Timeline
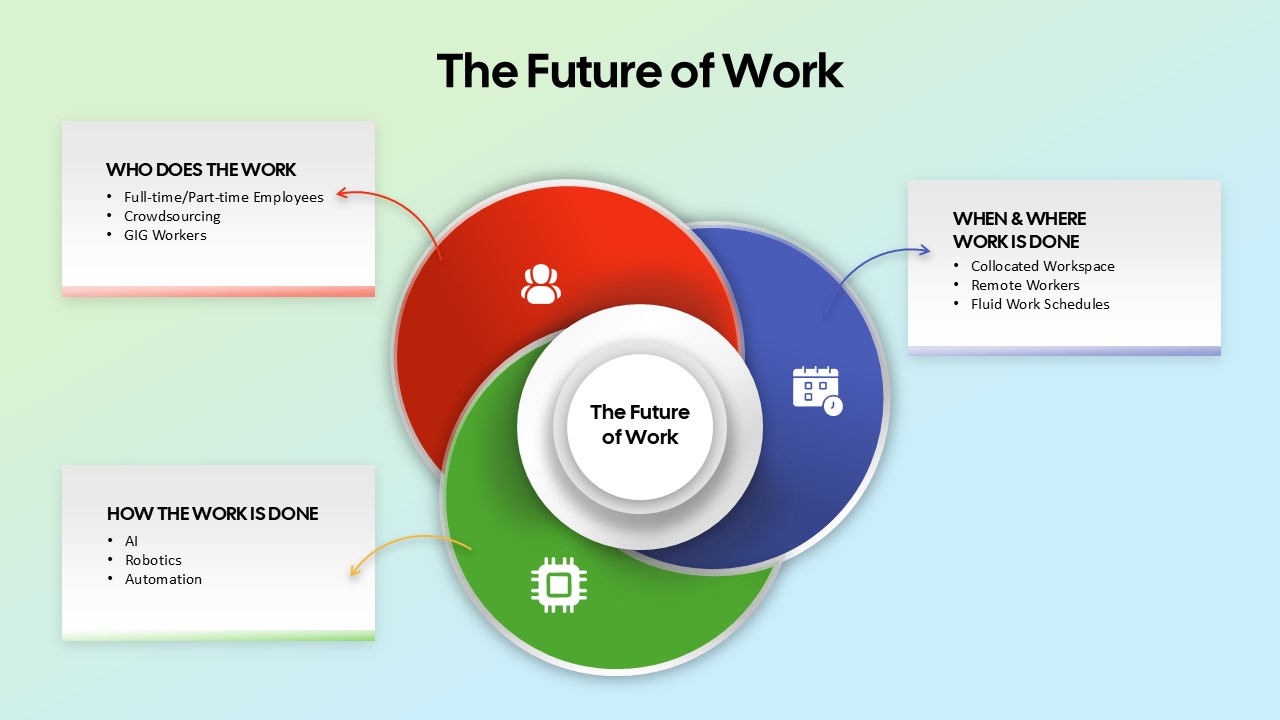
The Future of Work Venn Diagram Template for PowerPoint & Google Slides
Circular
Clean Mobile Service Comparison Slide Template for PowerPoint & Google Slides
Comparison
Tornado Chart Data Comparison Slide Template for PowerPoint & Google Slides
Bar/Column
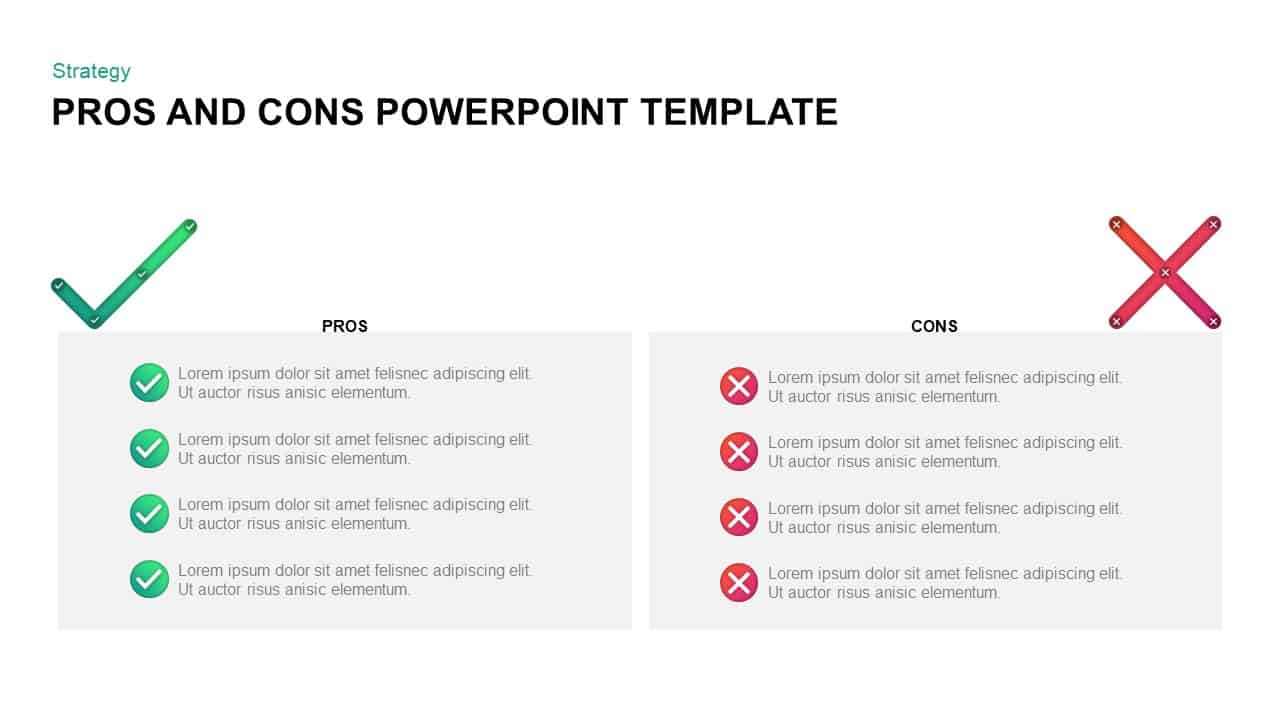
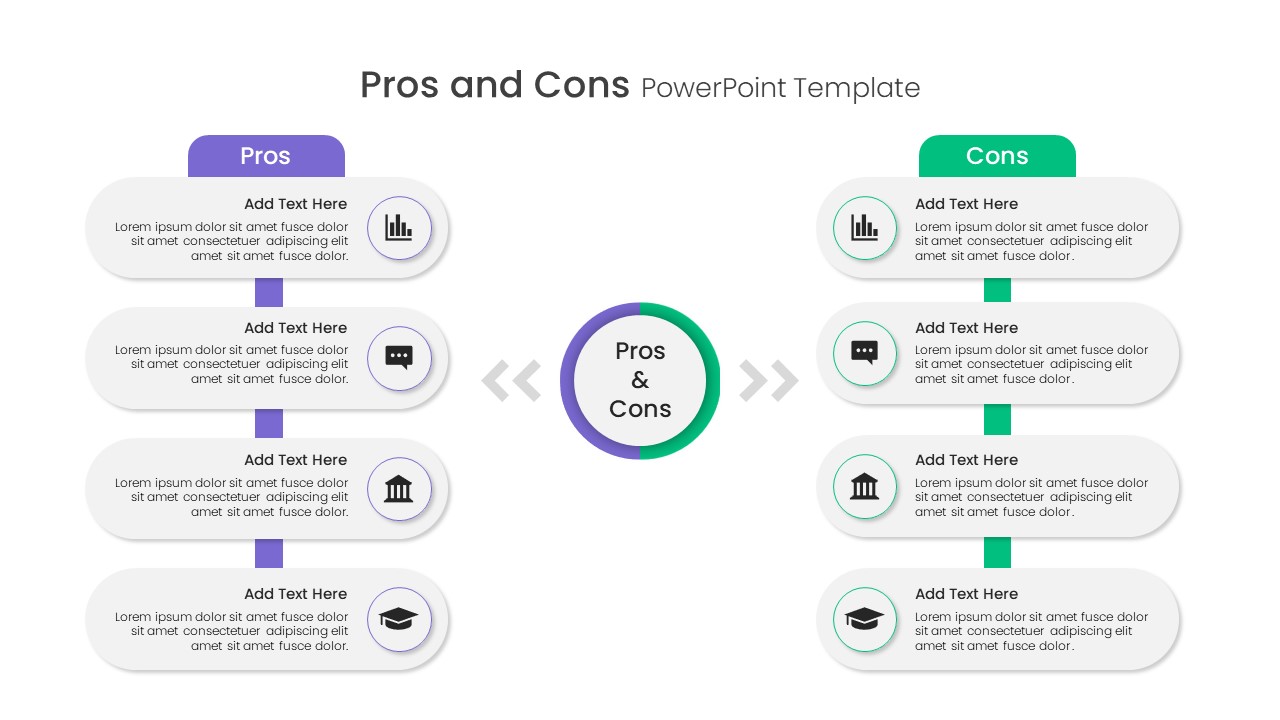
Pros and Cons Comparison Slide Template for PowerPoint & Google Slides
Comparison
Two-Column Comparison Infographic Slide Template for PowerPoint & Google Slides
Comparison
Fact and Figures Comparison Slide Template for PowerPoint & Google Slides
Business Report
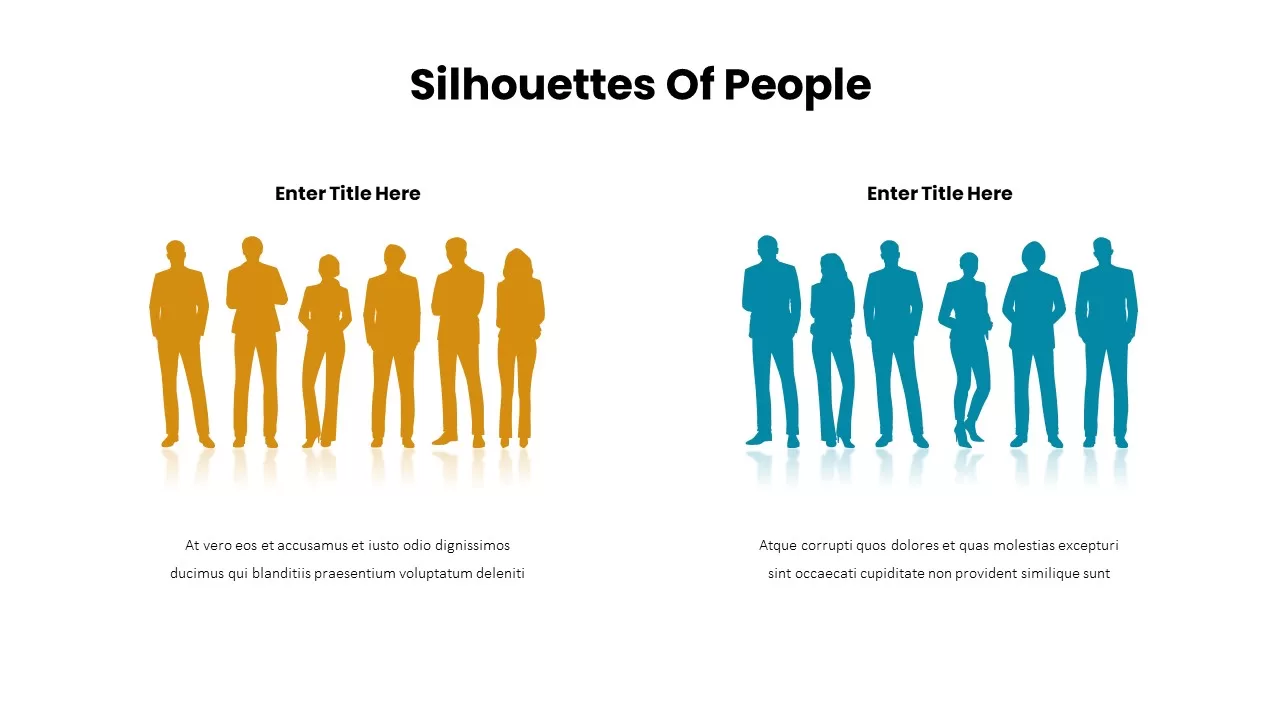
Business Silhouettes Comparison Slide Template for PowerPoint & Google Slides
HR
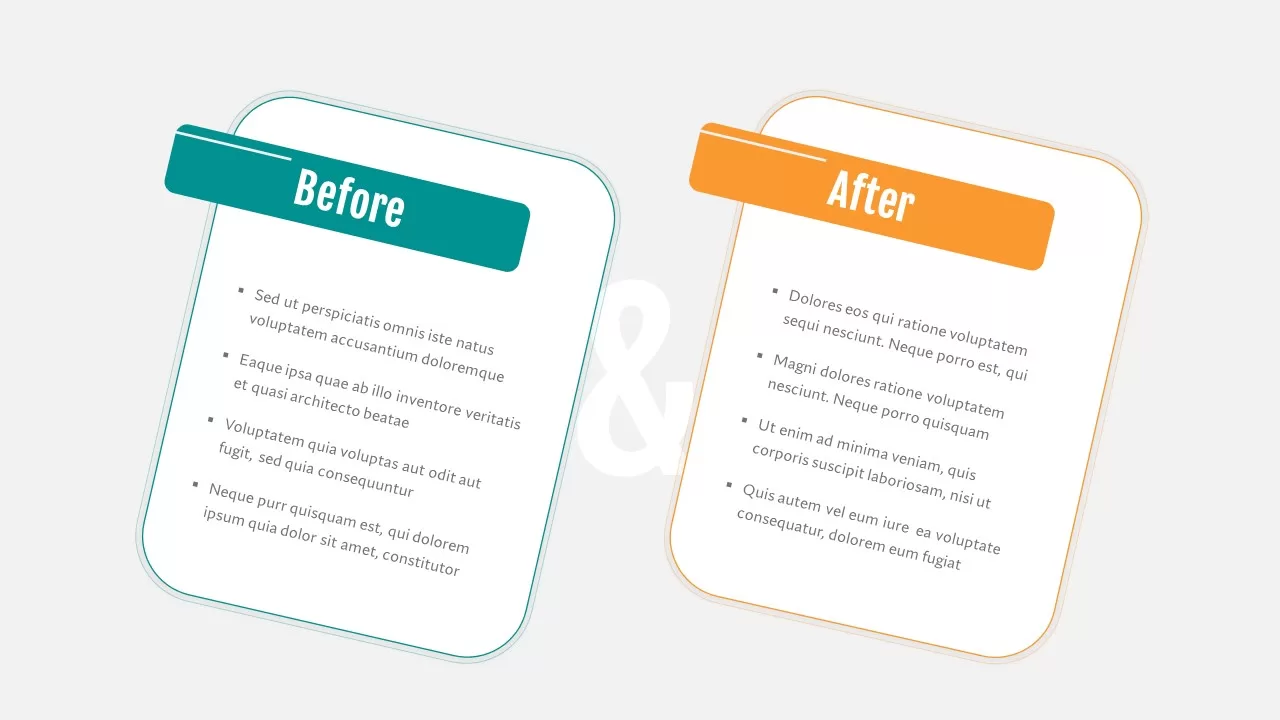
Before and After Comparison Slide Template for PowerPoint & Google Slides
Comparison
Benchmarking Metrics Comparison Slide Template for PowerPoint & Google Slides
Pie/Donut
Casino Poker Chips Comparison Slide Template for PowerPoint & Google Slides
Comparison
Modern Tradeoffs Comparison Slide Template for PowerPoint & Google Slides
Comparison
Challenges and Opportunities Comparison Slide for PowerPoint & Google Slides
Opportunities Challenges
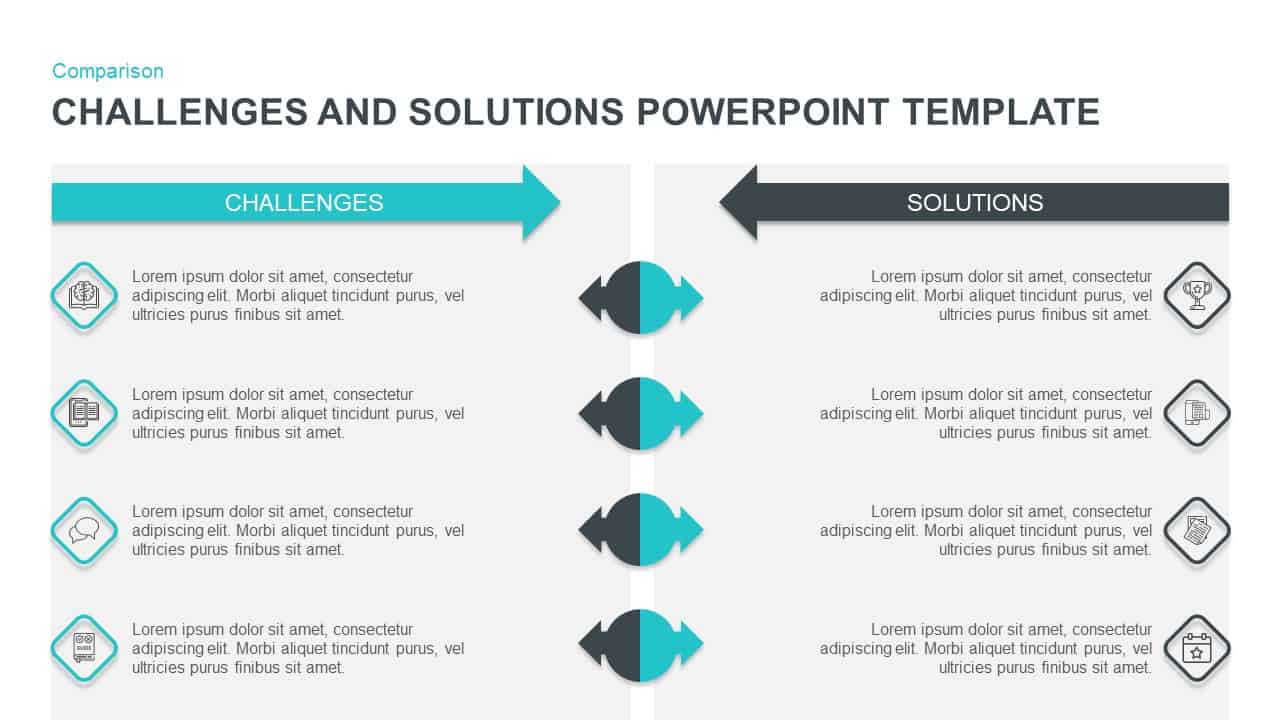
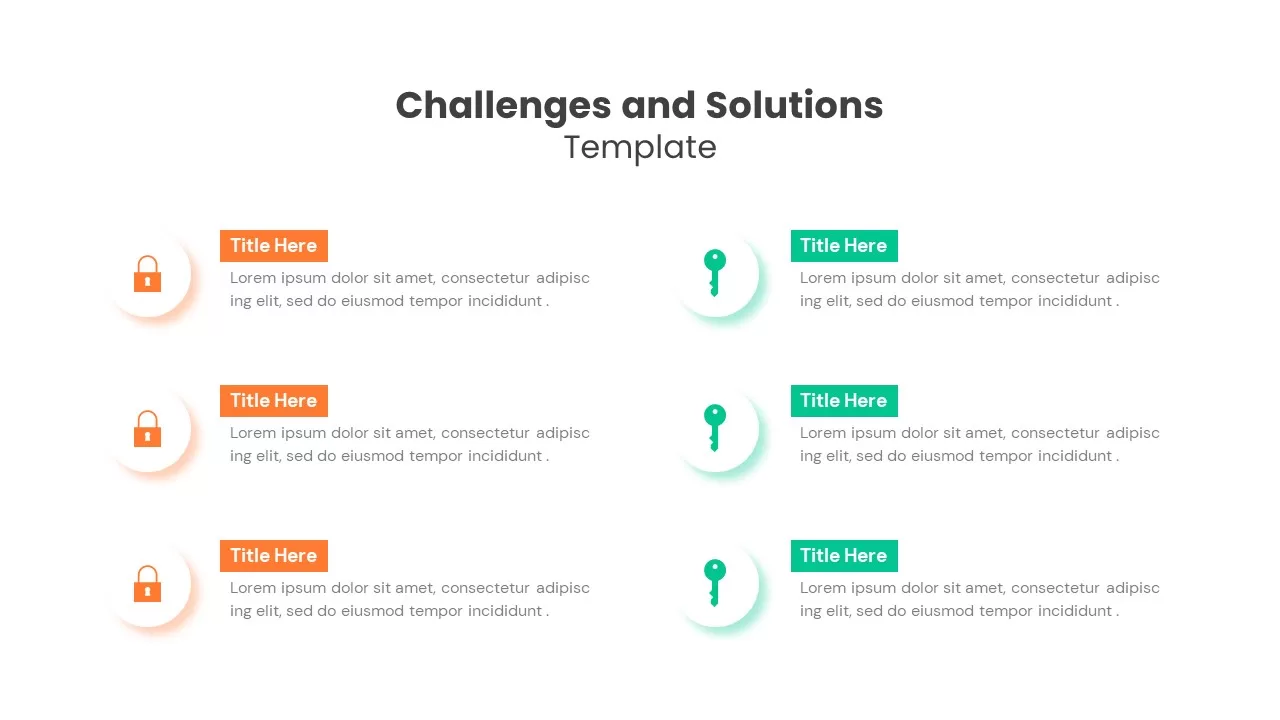
Challenges and Solutions Comparison Slide for PowerPoint & Google Slides
Opportunities Challenges
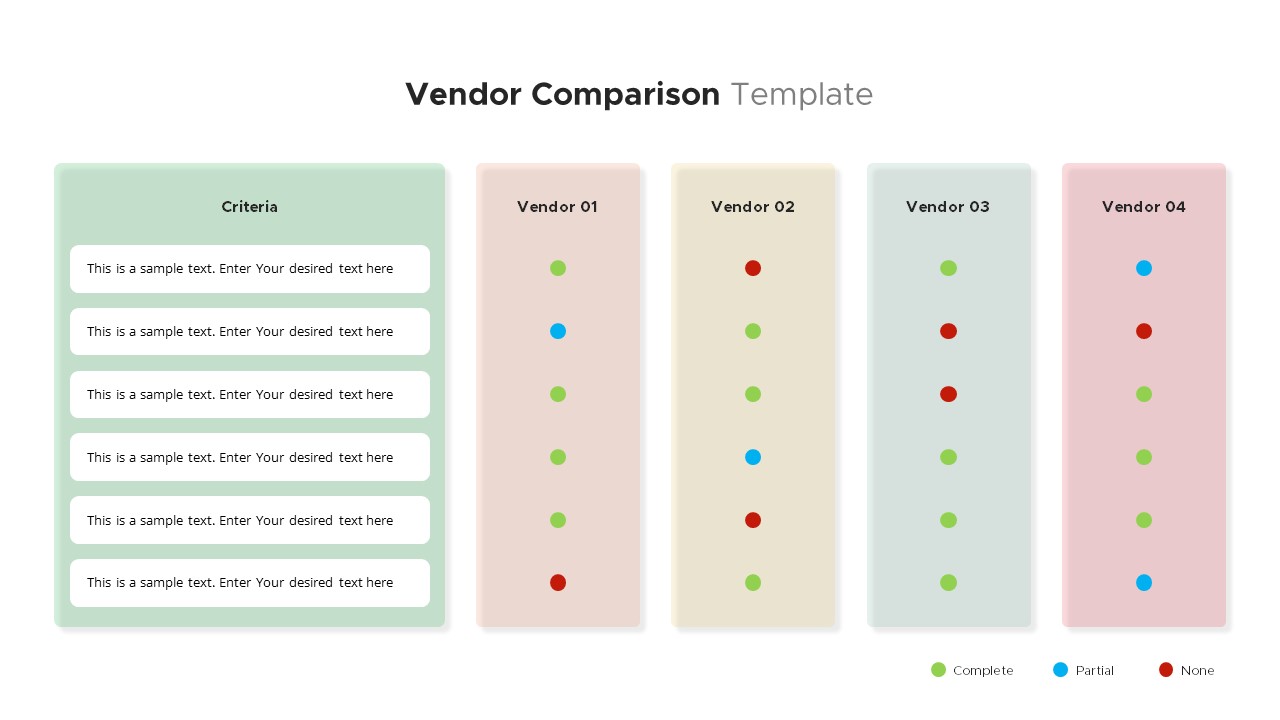
Vendor Comparison Slide for PowerPoint & Google Slides
Comparison
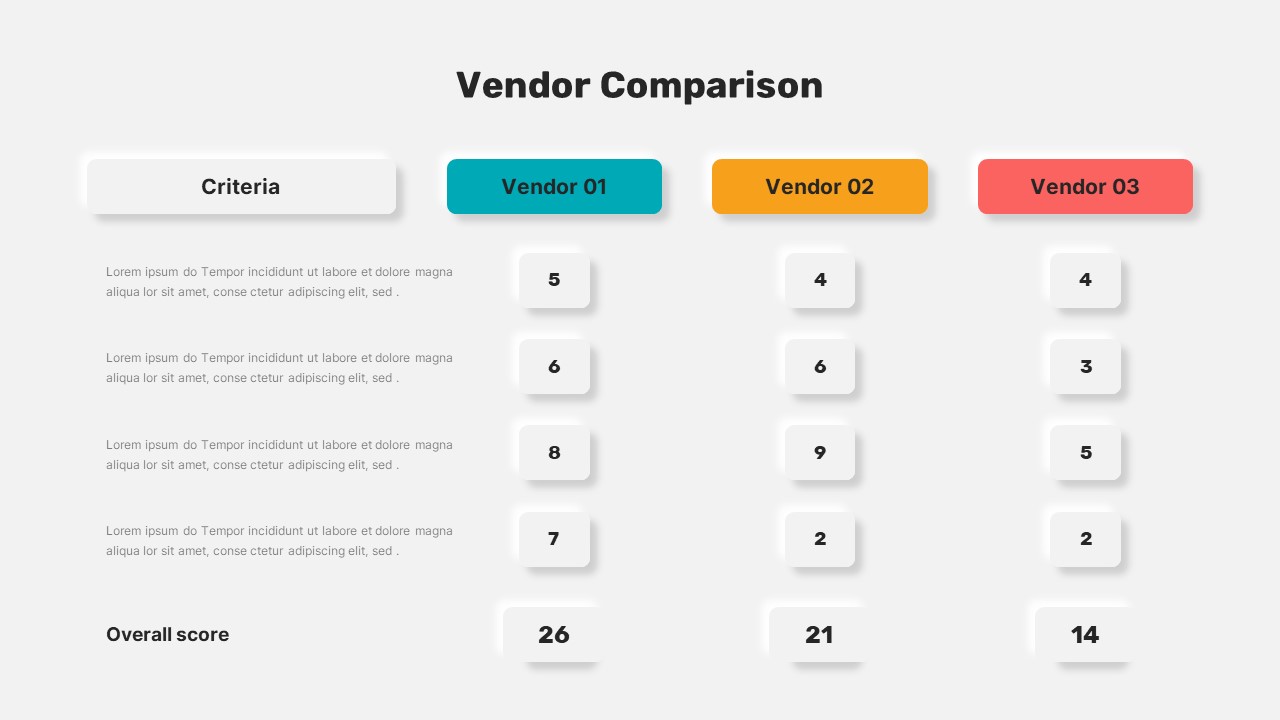
Vendor Comparison Slide for PowerPoint & Google Slides
Business Proposal
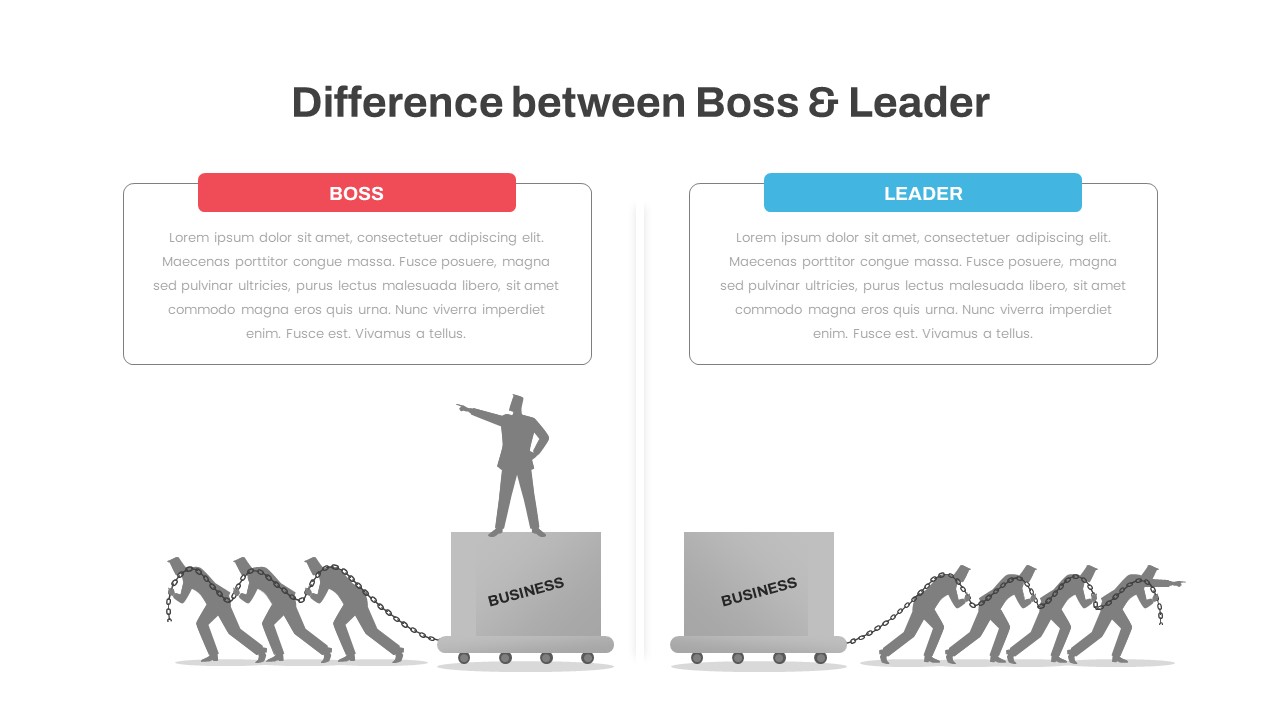
Boss vs Leader Comparison Slide for PowerPoint & Google Slides
Leadership
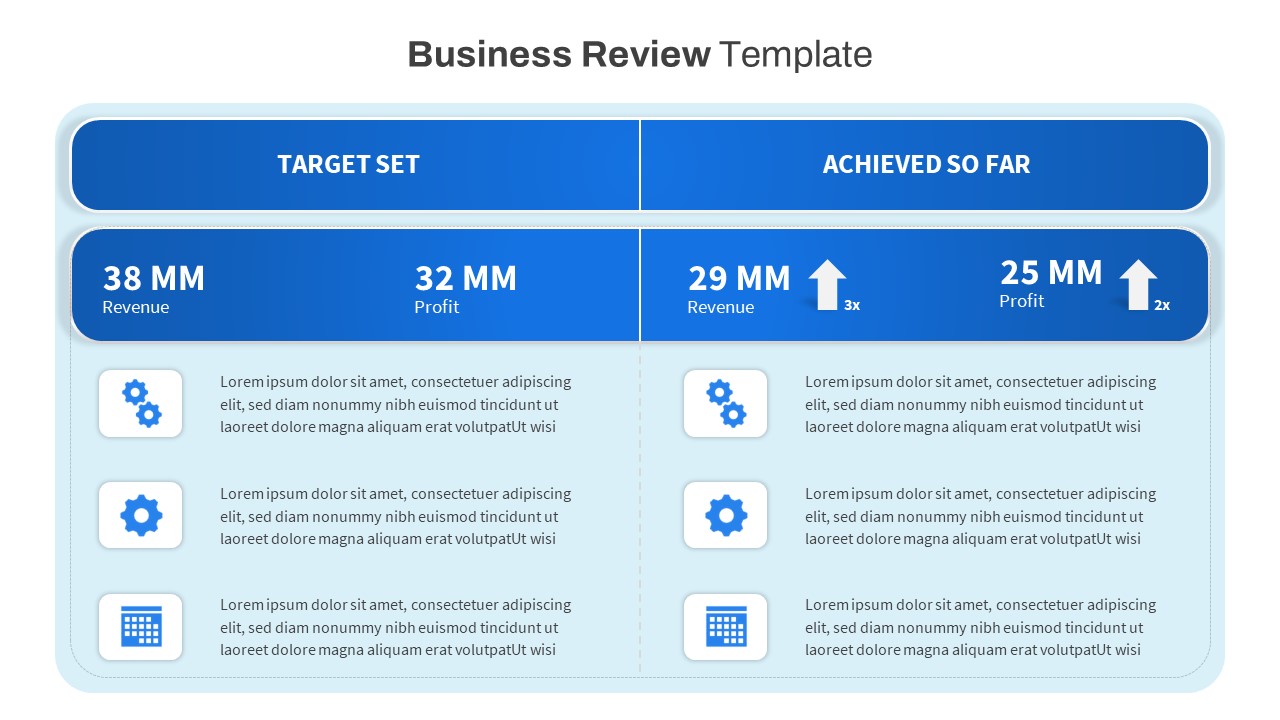
Free Business Review Comparison Slide for PowerPoint & Google Slides
Business Report
Free
Free Three-Option Comparison Slide for PowerPoint & Google Slides
Comparison
Free
Service Zoom Feature Slides Comparison template for PowerPoint & Google Slides
Process
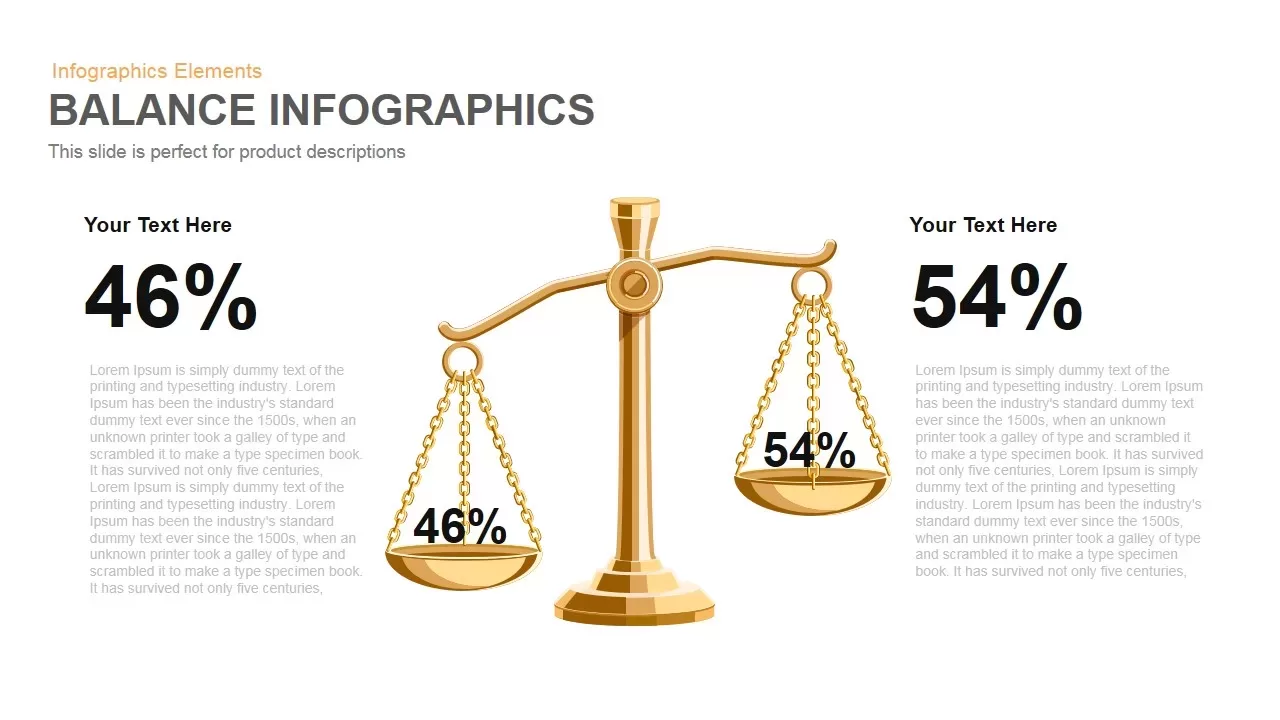
Gold Scales Balance Comparison Template for PowerPoint & Google Slides
Comparison
Four-Tier Pricing Comparison Table Template for PowerPoint & Google Slides
Comparison
Comparison Bar Chart template for PowerPoint & Google Slides
Comparison Chart
3-Column Comparison template for PowerPoint & Google Slides
Comparison
A/B Testing Comparison Infographic template for PowerPoint & Google Slides
Comparison
Four-Plan Pricing Table Comparison Template for PowerPoint & Google Slides
Comparison
Interactive Product Comparison Bar Chart Template for PowerPoint & Google Slides
Bar/Column
Gender Comparison People Infographic Template for PowerPoint & Google Slides
Comparison

Comparison Pricing Table Infographic Template for PowerPoint & Google Slides
Comparison Chart
Interactive Pricing Plan Comparison Template for PowerPoint & Google Slides
Comparison
Six-Metric Green Product Comparison Template for PowerPoint & Google Slides
Comparison
Challenges vs Solutions Comparison Template for PowerPoint & Google Slides
Comparison

BMI Category Comparison Chart Template for PowerPoint & Google Slides
Comparison
Isometric 3D Block Comparison Diagram Template for PowerPoint & Google Slides
Comparison
Generations Comparison Infographic Template for PowerPoint & Google Slides
Timeline
Circular Product Comparison Chart Template for PowerPoint & Google Slides
Comparison Chart
Theory X and Theory Y Comparison Template for PowerPoint & Google Slides
Comparison
Competitive Landscape Comparison Template Pack for PowerPoint & Google Slides
Comparison
Before and After Comparison Infographics Template for PowerPoint & Google Slides
Comparison
Dynamic Benchmarking Comparison Chart Template for PowerPoint & Google Slides
Comparison Chart
Challenges & Solutions Comparison Template for PowerPoint & Google Slides
Opportunities Challenges
Adam’s Equity Theory Scale Comparison Template for PowerPoint & Google Slides
Comparison
Vendor Comparison Analysis template for PowerPoint & Google Slides
Comparison Chart
Vendor Comparison Matrix with High-Level Requirements template for PowerPoint & Google Slides
Comparison Chart
Popular Social Media Comparison Grid Template for PowerPoint & Google Slides
Digital Marketing
Hits and Misses Performance Comparison Template for PowerPoint & Google Slides
Comparison
Conflict Infographics Comparison Template for PowerPoint & Google Slides
Infographics
Clustered Bar Chart Comparison Template for PowerPoint & Google Slides
Bar/Column
Business Timeline Comparison Bar Chart Template for PowerPoint & Google Slides
Comparison Chart
Grouped Column Chart Comparison Template for PowerPoint & Google Slides
Bar/Column
Multiple Line Chart Comparison Template for PowerPoint & Google Slides
Comparison Chart
Interactive Multi-Use Cost Comparison Template for PowerPoint & Google Slides
Comparison
Free Pros and Cons Comparison Template for PowerPoint & Google Slides
Comparison
Free
Free Versatile Product Comparison Chart Template for PowerPoint & Google Slides
Charts
Free
Dynamic Bar-of-Pie Chart Comparison Template for PowerPoint & Google Slides
Pie/Donut
Types of AI Comparison Infographic Template for PowerPoint & Google Slides
AI
AI vs. Human Intelligence Comparison Template for PowerPoint & Google Slides
Comparison
Quarterly Revenue Comparison Bar Chart Template for PowerPoint & Google Slides
Bar/Column
Regional Revenue Comparison Overview Template for PowerPoint & Google Slides
Comparison
Project Comparison Timeline Roadmap Template for PowerPoint & Google Slides
Comparison
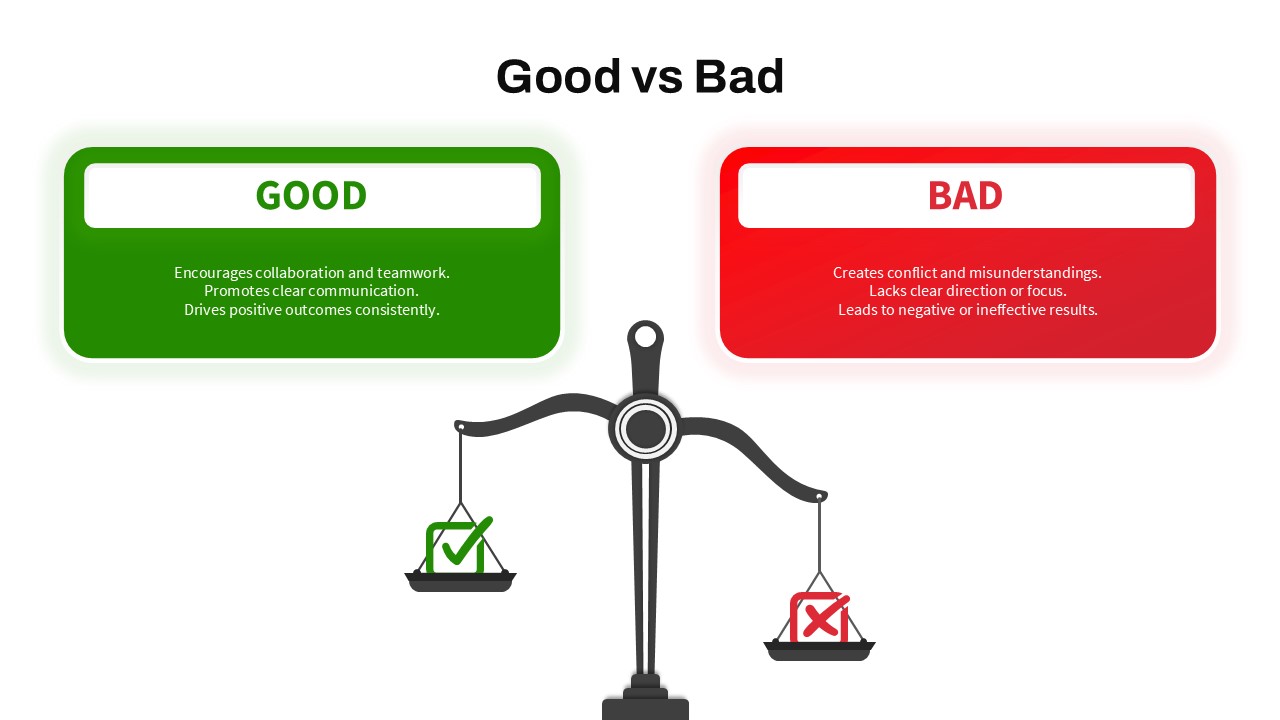
Good vs Bad Comparison with Scale Template for PowerPoint & Google Slides
Comparison
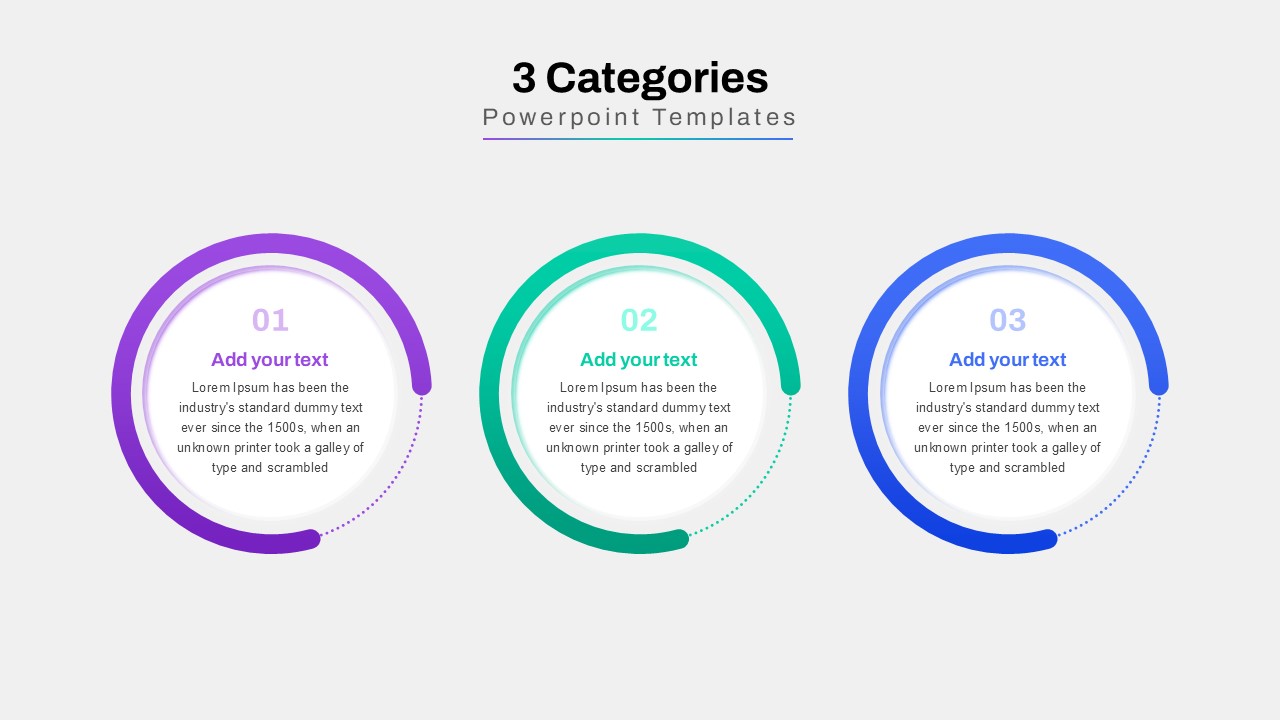
Three-Category Comparison Template for PowerPoint & Google Slides
Comparison
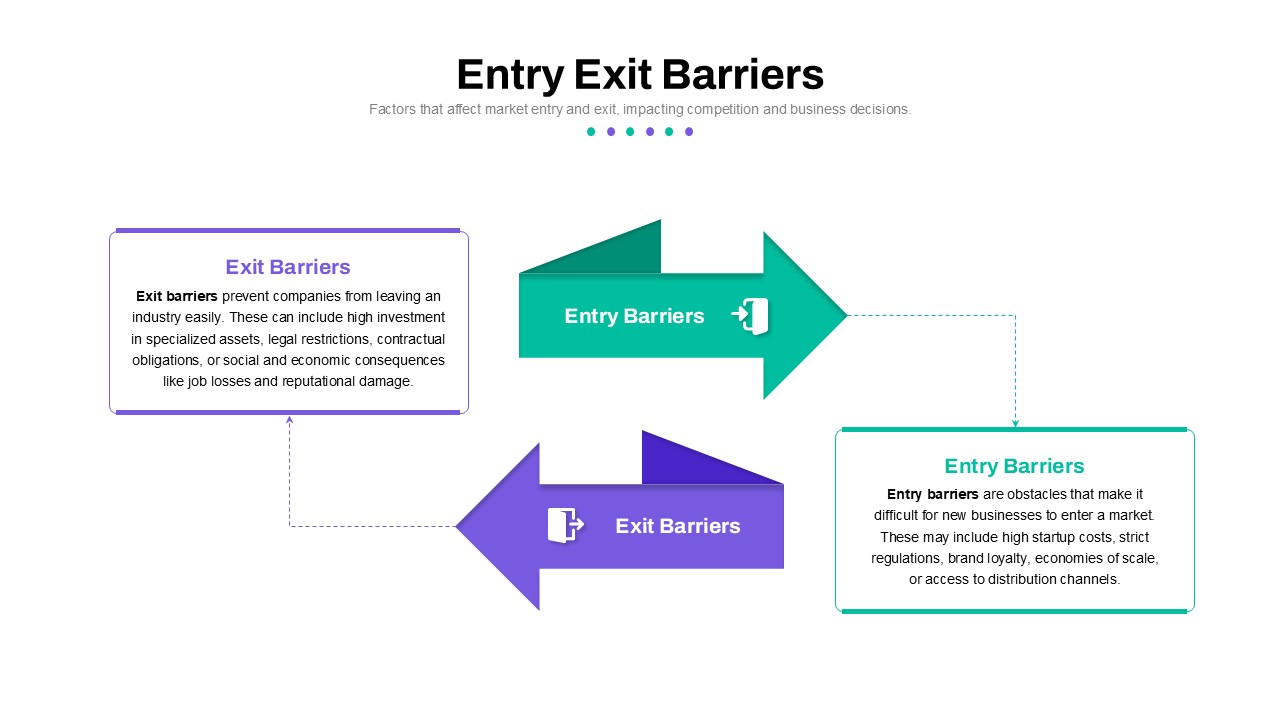
Entry and Exit Barriers Comparison Template for PowerPoint & Google Slides
Comparison
Competitor Comparison Chart Design Template for PowerPoint & Google Slides
Comparison
Two-Option Bar Chart Comparison Table Template for PowerPoint & Google Slides
Comparison
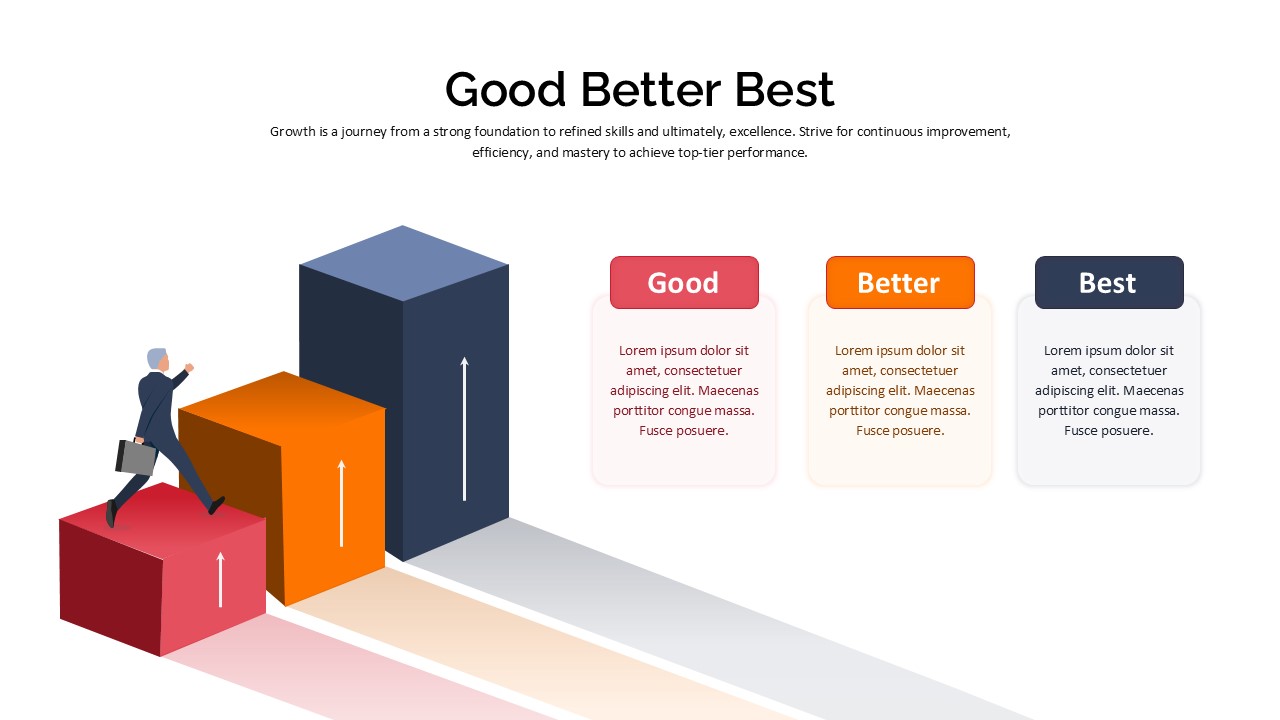
Good Better Best Comparison template for PowerPoint & Google Slides
Comparison
Product Feature Comparison Table Template for PowerPoint & Google Slides
Comparison Chart
Market Share Comparison Diagram Template for PowerPoint & Google Slides
Comparison Chart
Competitor Profile Matrix Comparison Template for PowerPoint & Google Slides
Comparison Chart
Two-Sided Coin Comparison Diagram Template for PowerPoint & Google Slides
Comparison
Two-Box Analysis & Target Comparison Template for PowerPoint & Google Slides
Comparison
VUCA vs BANI Comparison Infographic Template for PowerPoint & Google Slides
Comparison
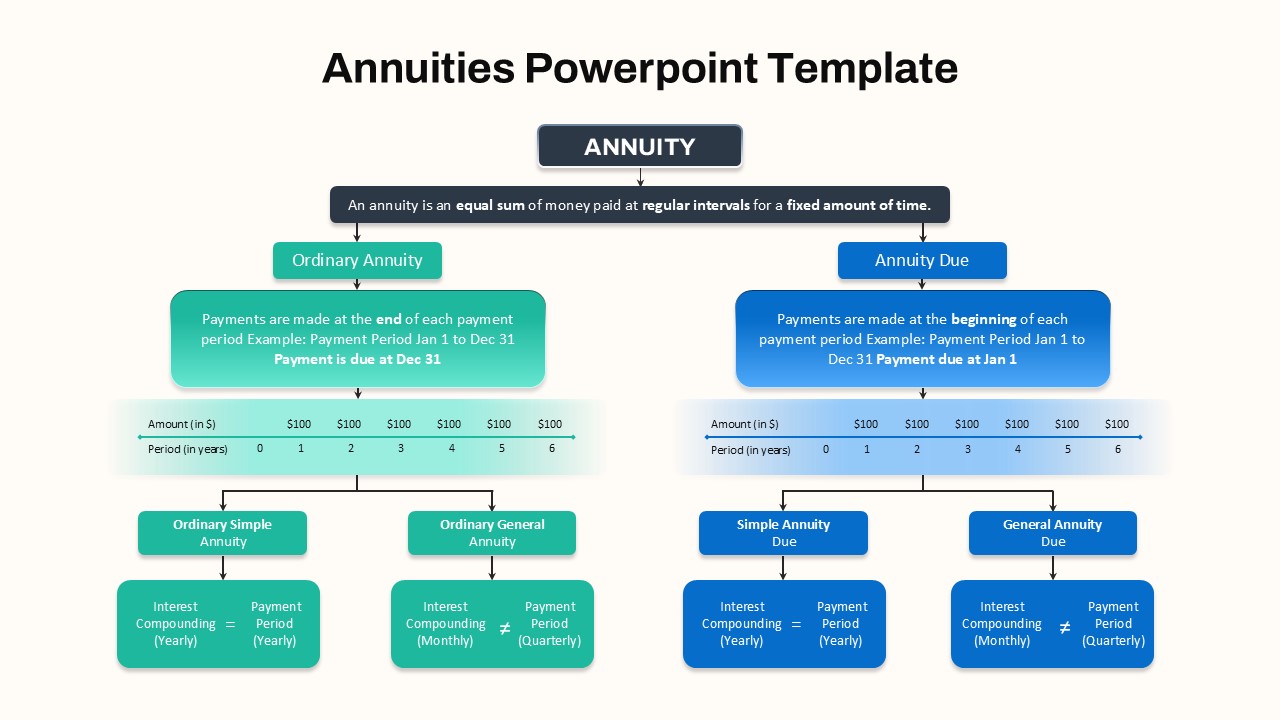
Hierarchical Annuity Comparison Flowchart Template for PowerPoint & Google Slides
Business Report
Feasibility Matrix Comparison Chart Template for PowerPoint & Google Slides
Comparison Chart
Funnel and Flywheel Thinking Comparison template for PowerPoint & Google Slides
Infographics
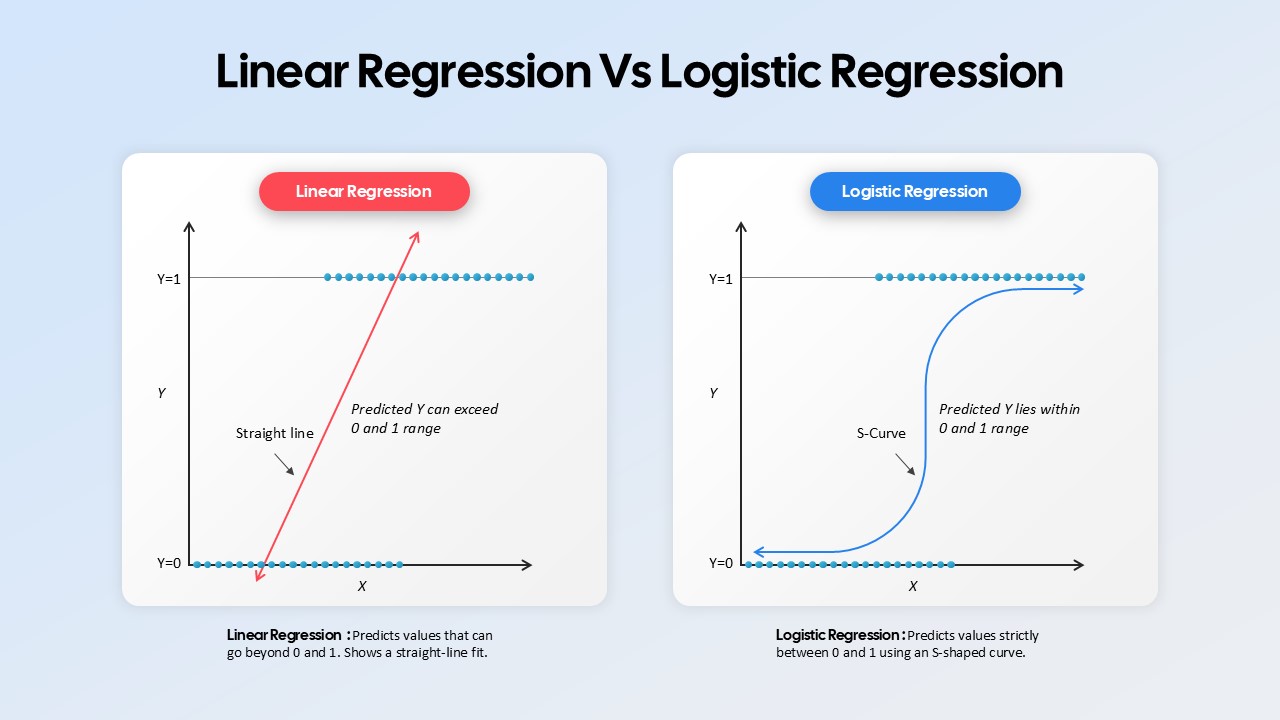
Linear Regression vs Logistic Regression Comparison template for PowerPoint & Google Slides
Comparison
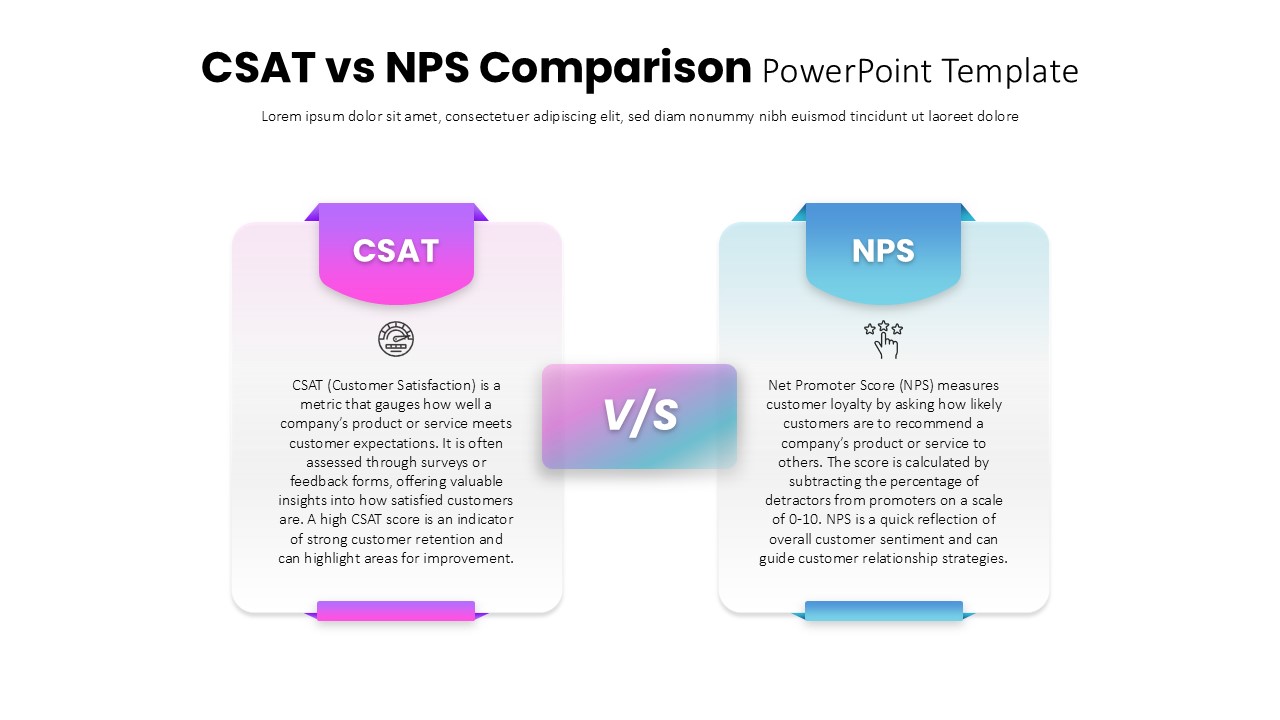
CSAT vs NPS Comparison template for PowerPoint & Google Slides
Business Strategy
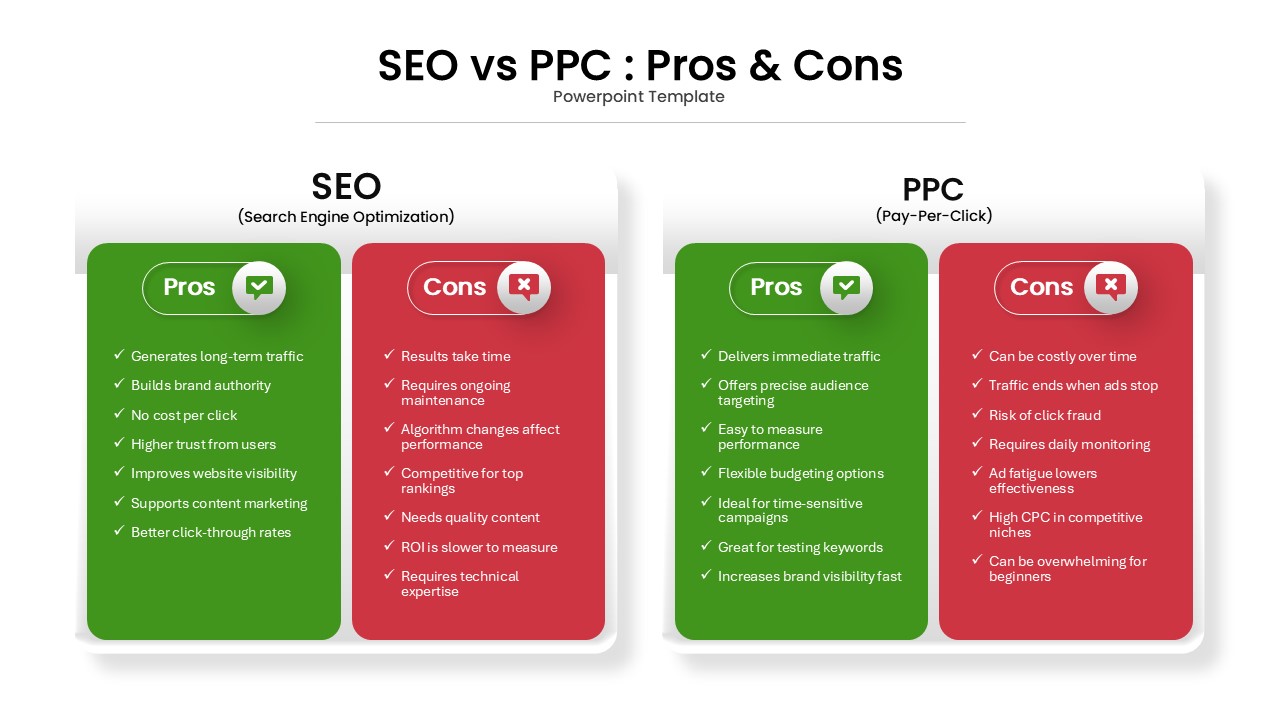
SEO vs PPC: Pros & Cons Comparison Template for PowerPoint & Google Slides
Comparison
Risk vs Reward Comparison Template for PowerPoint & Google Slides
Opportunities Challenges
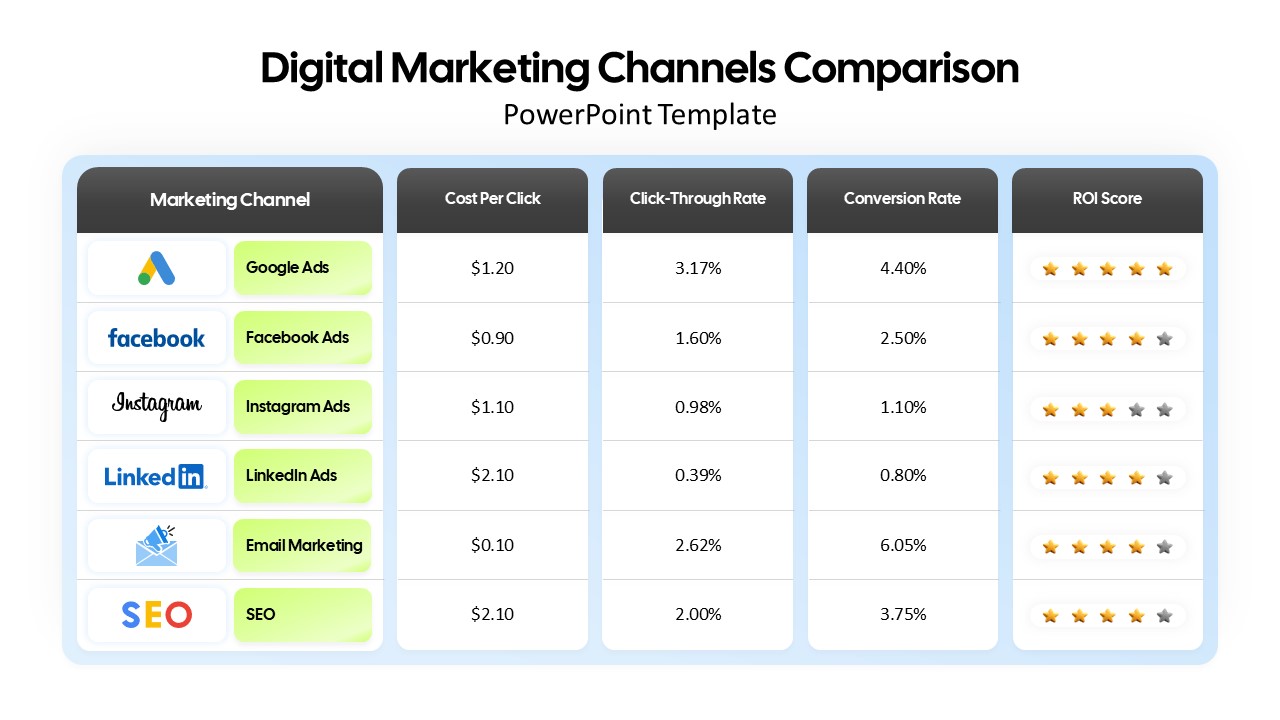
Digital Marketing Channels Comparison template for PowerPoint & Google Slides
Business
Colorful Business Data Comparison Table Template for PowerPoint & Google Slides
Table
Operating Channels Comparison Diagram Template for PowerPoint & Google Slides
Business Models