Before and After Comparison Infographics Template for PowerPoint & Google Slides
Description
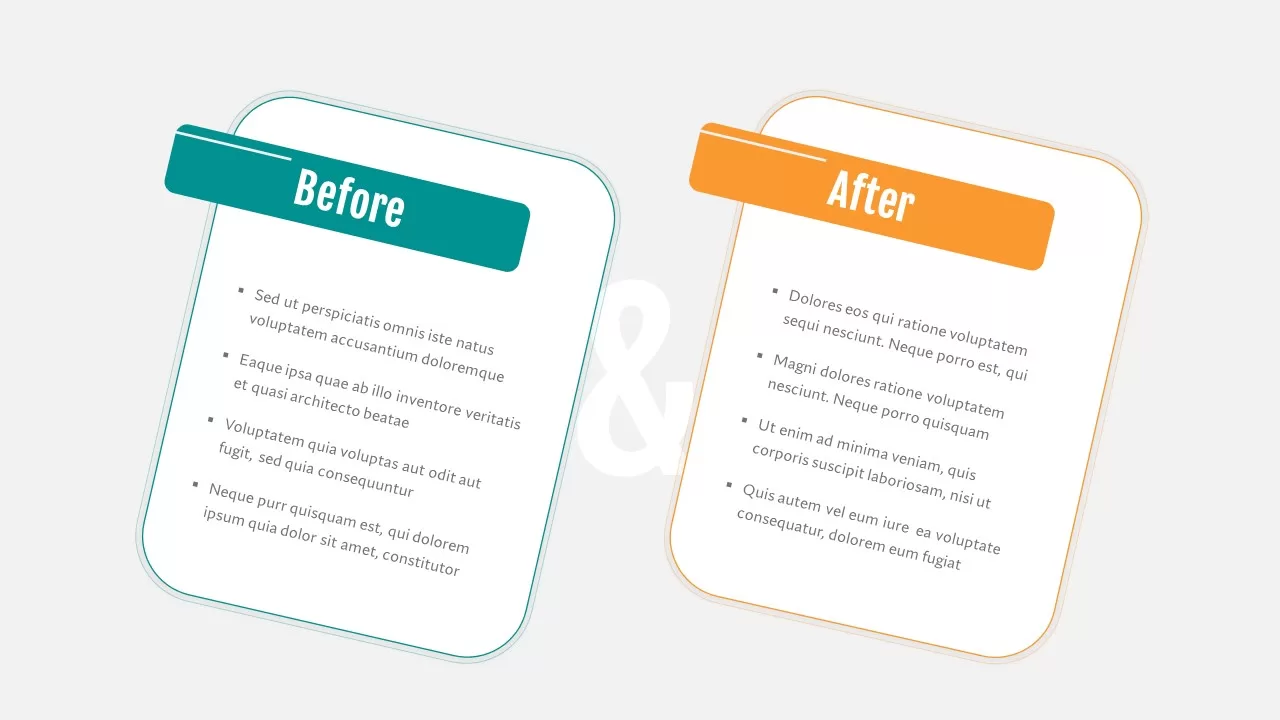
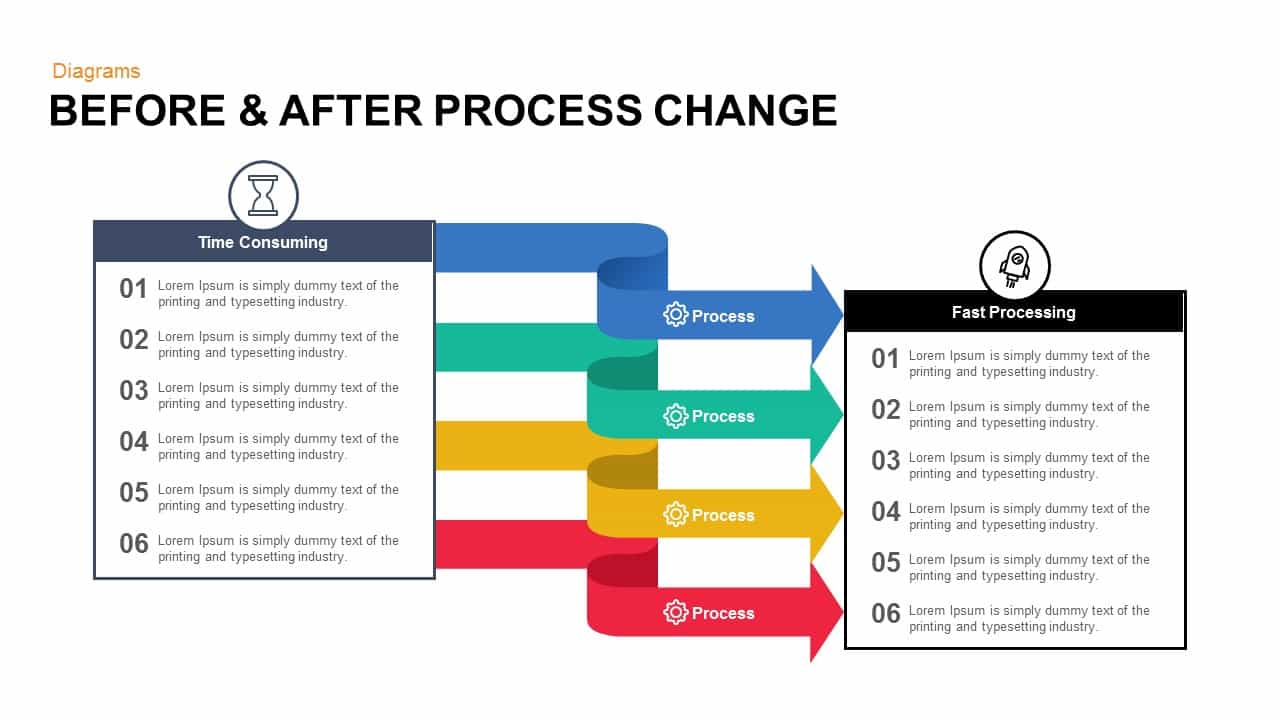
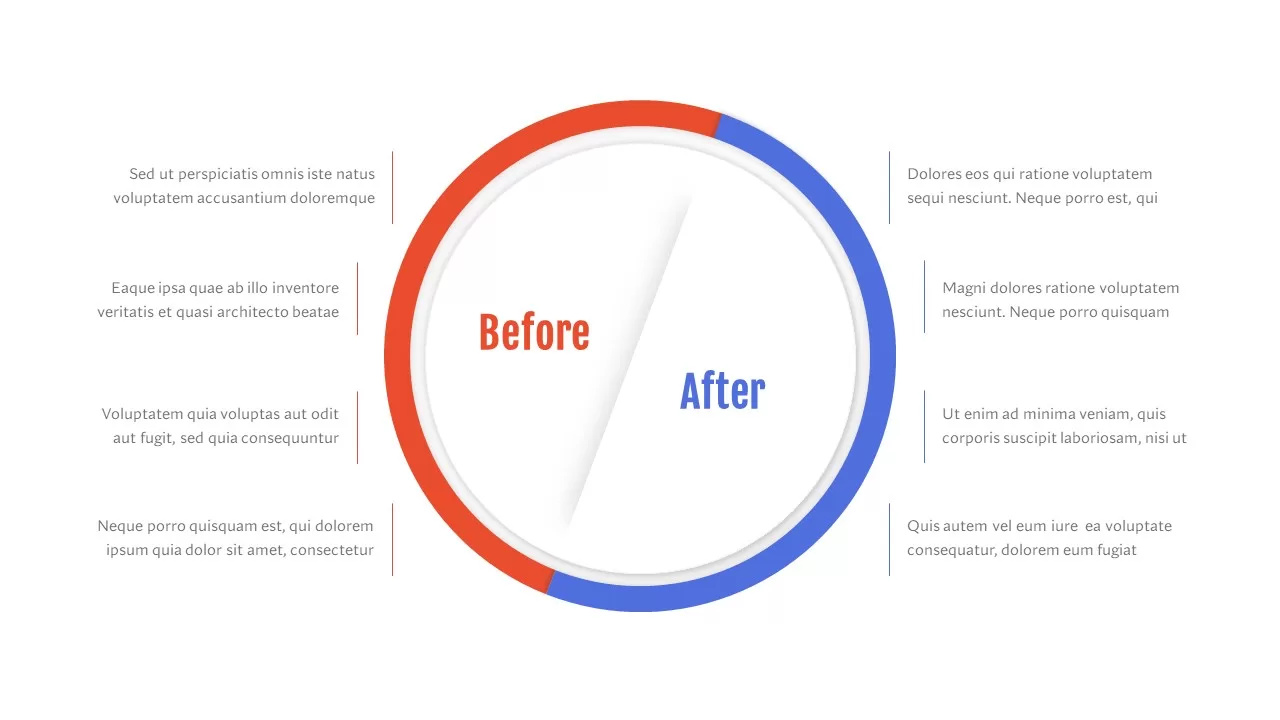
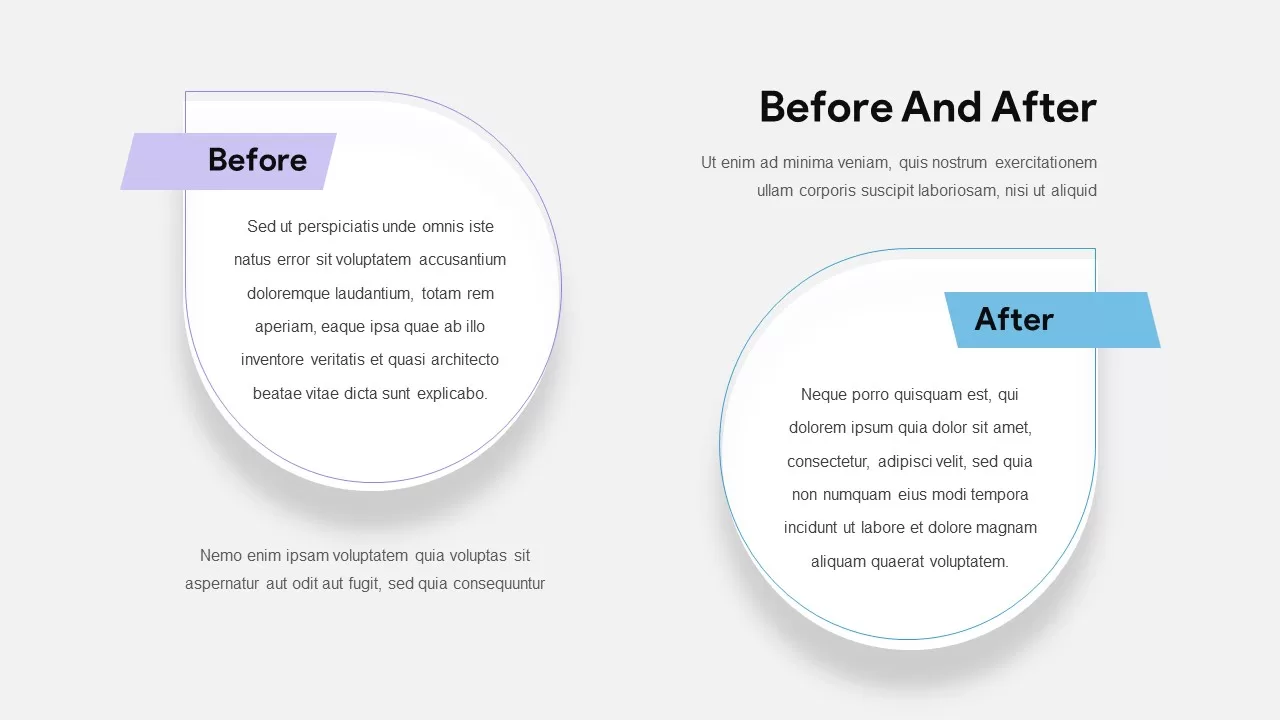
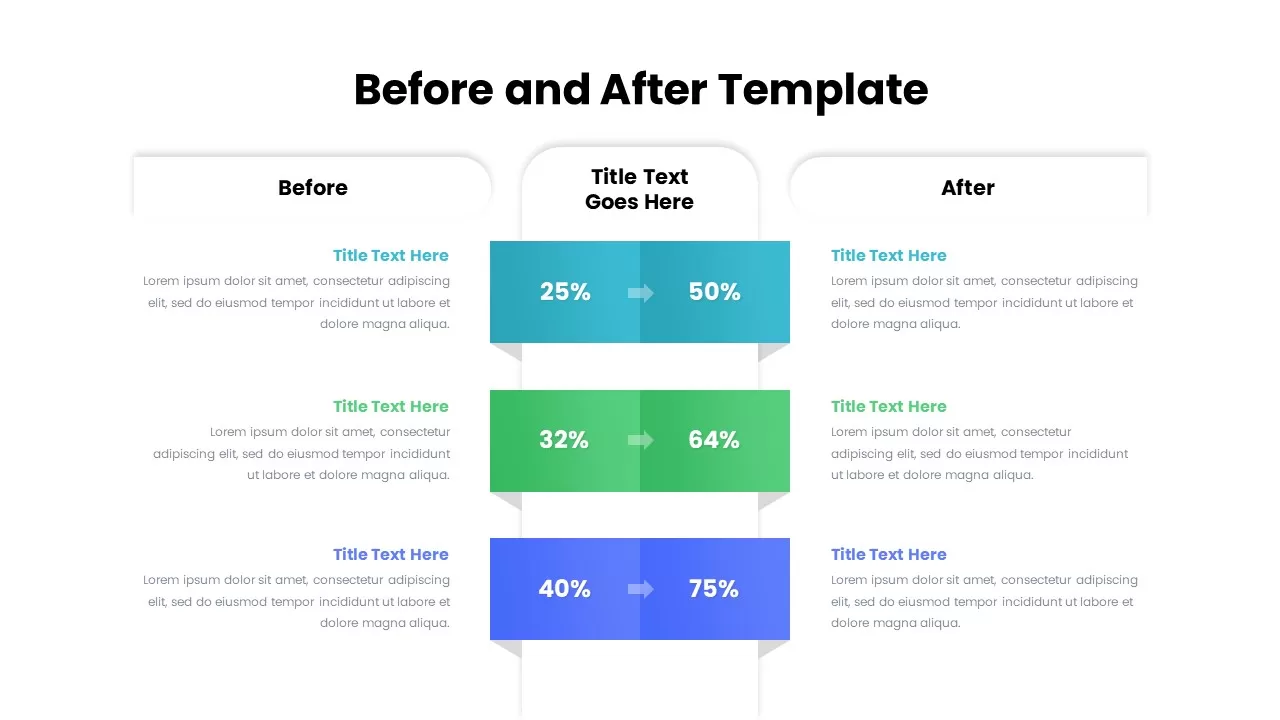
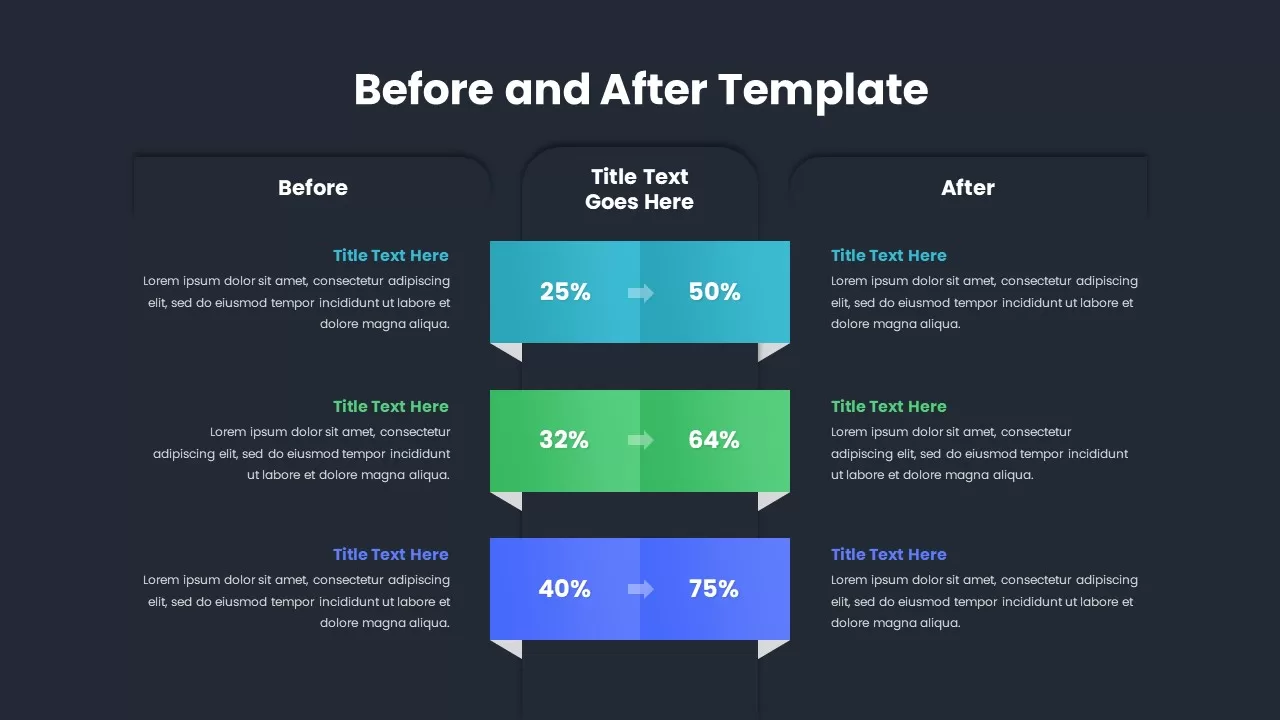
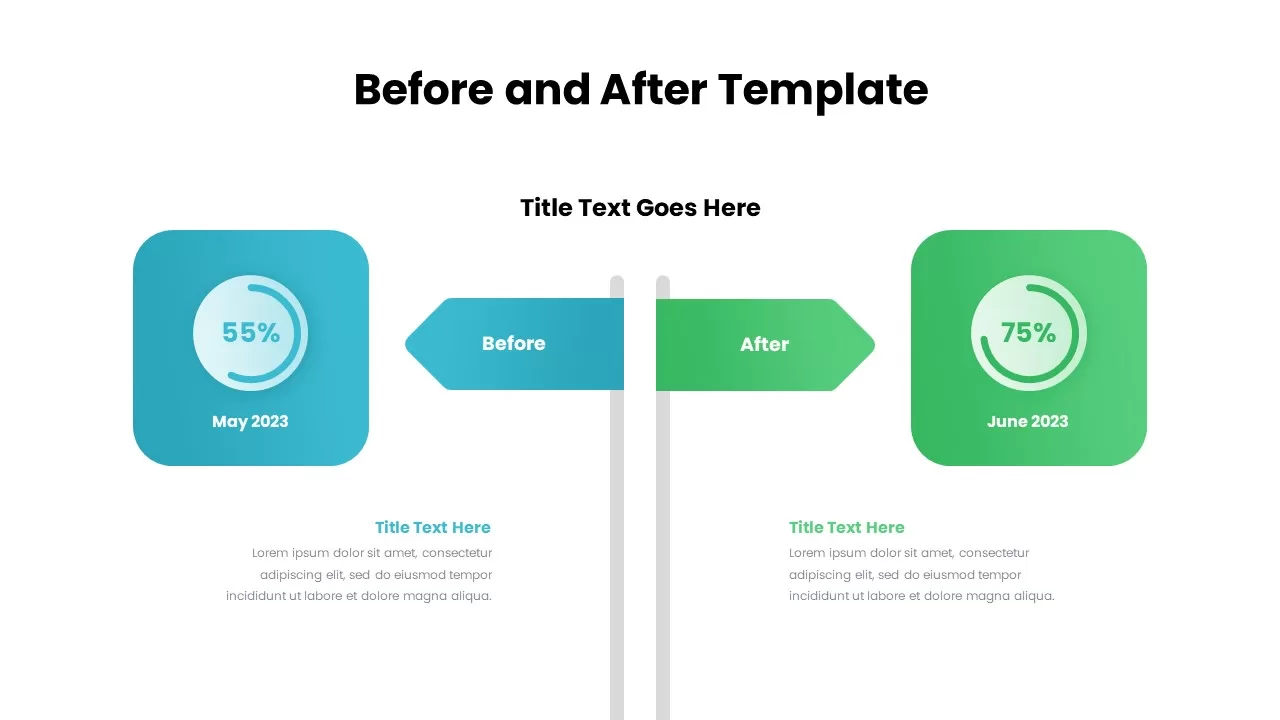
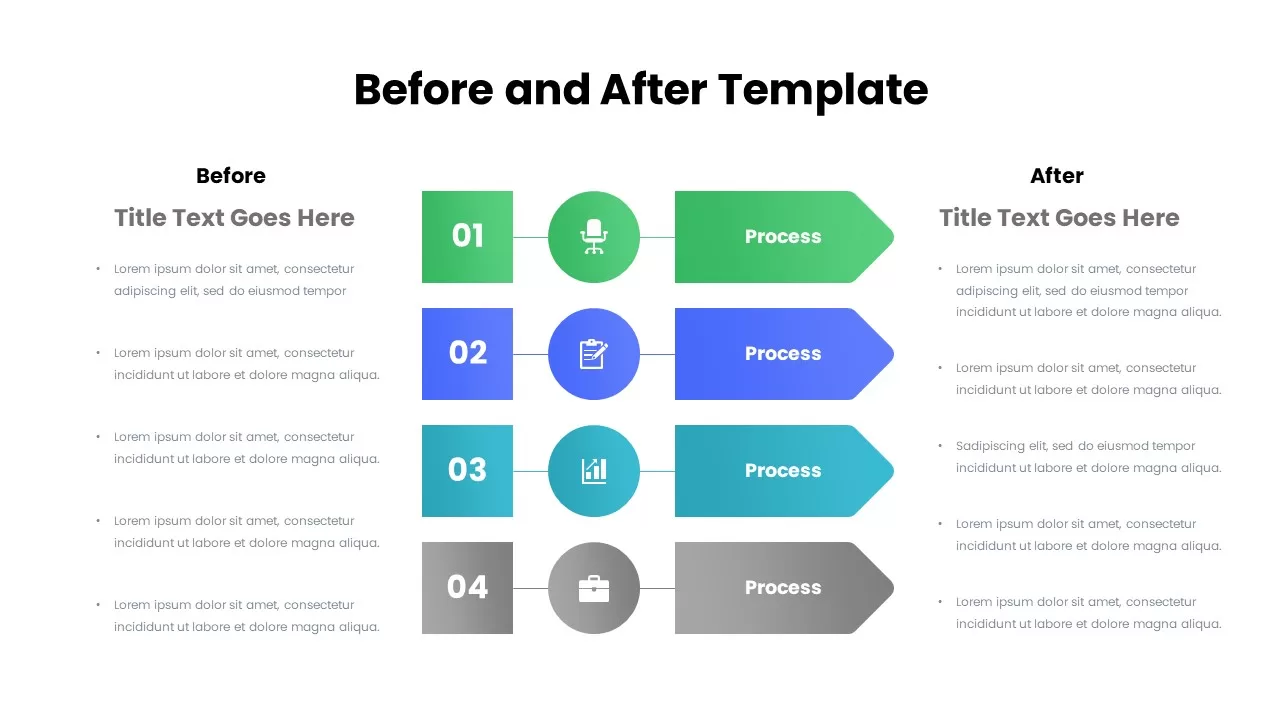
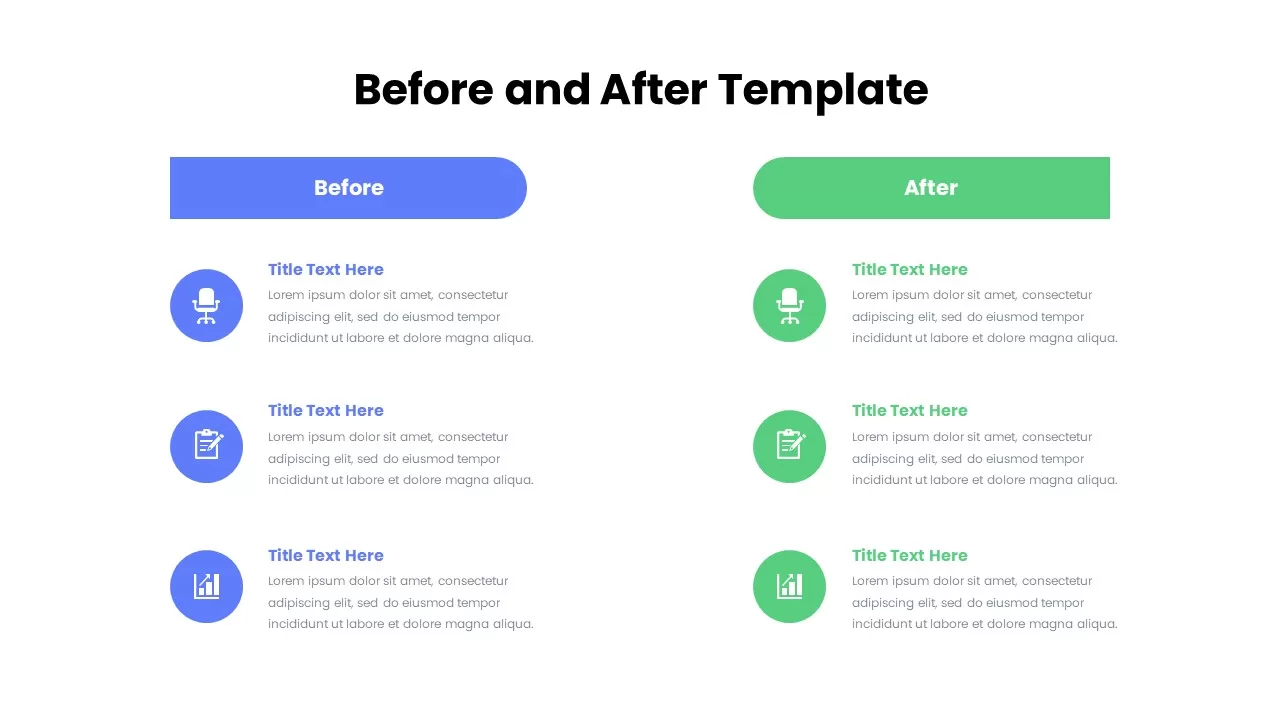
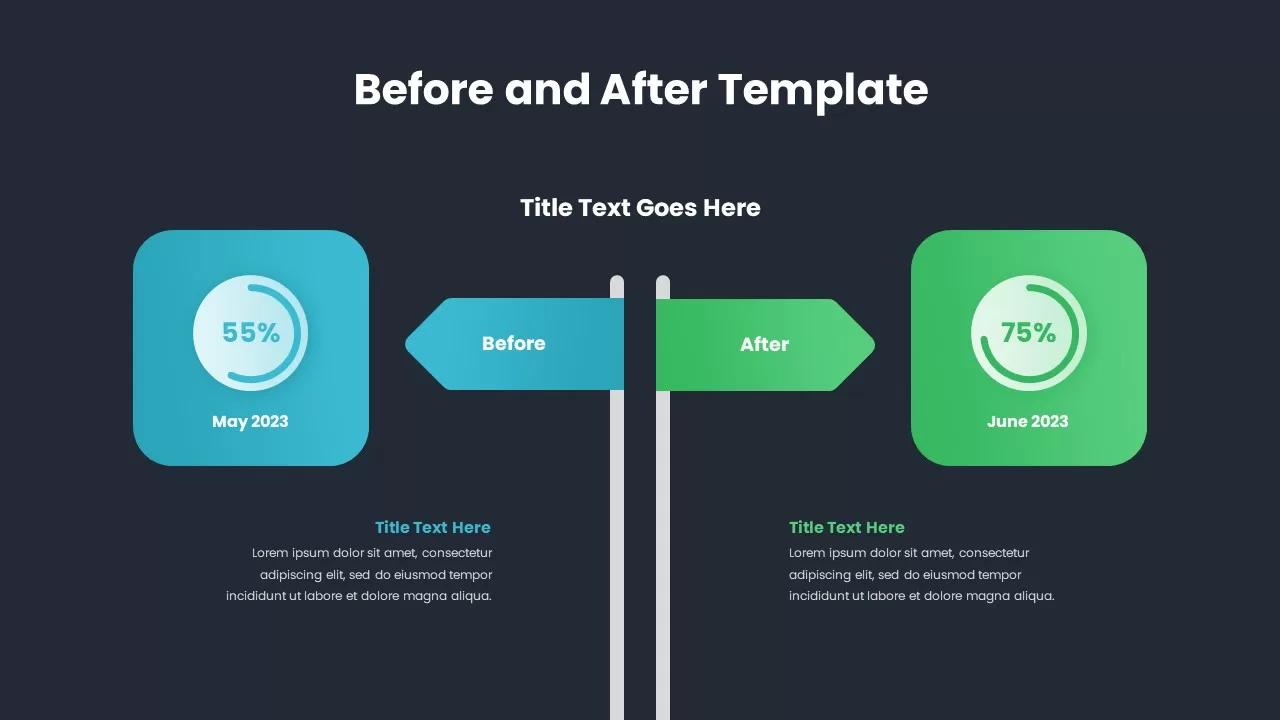
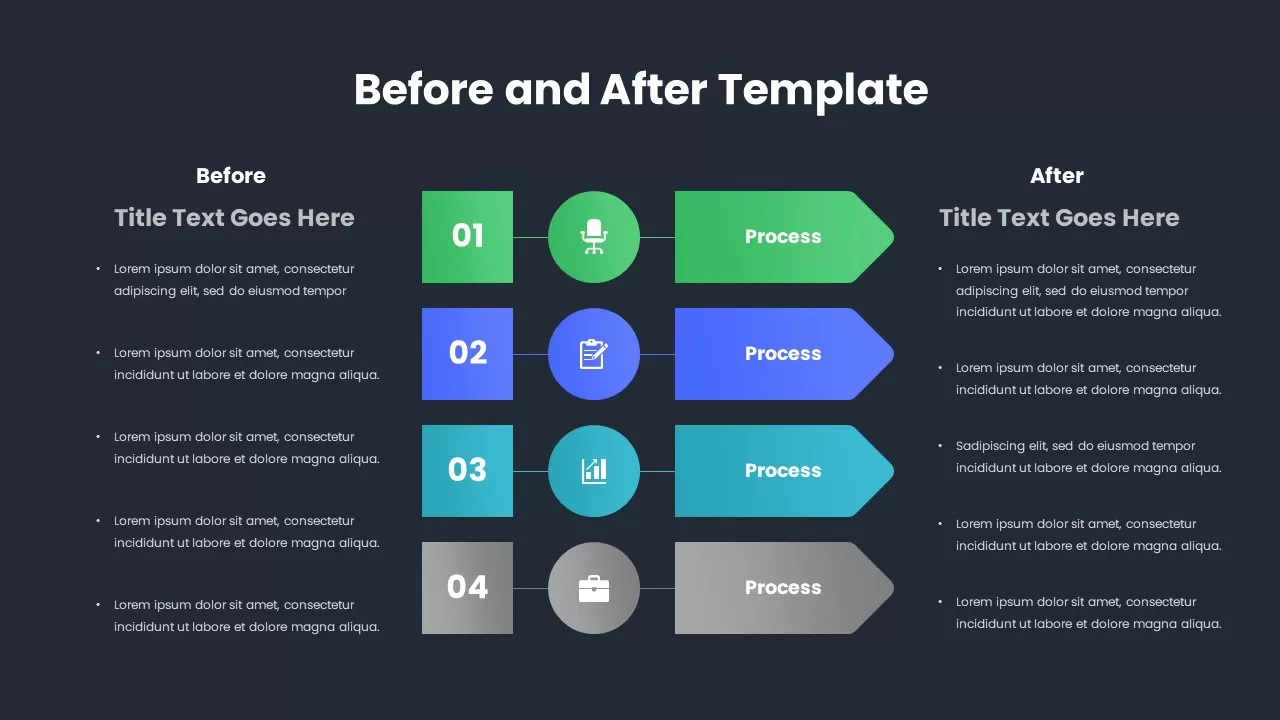
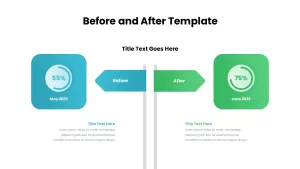
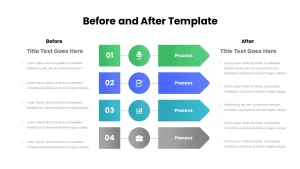
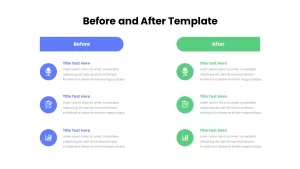
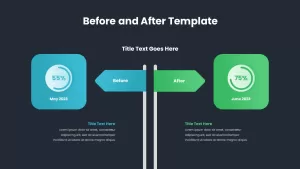
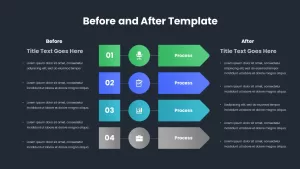
This pack of four before-and-after infographic slides provides a clean, modern way to visualize changes across multiple metrics. Each layout features side-by-side comparison bars with customizable gradient fills—cyan, green, and blue by default—paired with text placeholders for titles, descriptions, and percentage labels. A central title column anchors each slide, while left and right sections clearly demarcate “Before” and “After” content blocks. Vector-based shapes, auto-fit text boxes, and drag-and-drop image masks ensure seamless editing: simply update percentage values, swap color gradients, or adjust placeholder text to fit your brand. Ample white space ensures legibility across all slides. This structure aligns smoothly with the broader library of comparison templates that support metric-focused storytelling.
Designed for deployment in PowerPoint and Google Slides, this template pack leverages master slides, built-in animation triggers, and theme color palettes. Swap gradient presets to match corporate branding, reorder rows to highlight priority metrics, or duplicate infographic elements to create additional comparison sets. All shapes are fully editable vectors, and placeholder text supports various font styles and sizes. Whether you need to illustrate performance improvements, project milestones, or survey results, these slides streamline data-driven storytelling and cut presentation prep time in half.
Optional fade and wipe animations deliver smooth transitions for engaging storytelling. Use this infographic pack for executive summaries, marketing reports, product demos, and progress reviews to ensure every audience quickly grasps key insights.
Who is it for
Business analysts, project managers, and marketing professionals will benefit from these slides to showcase metric improvements, highlight KPI changes, or compare benchmarks over time. Consultants, educators, and startup founders can also leverage the clean comparison layouts for pitches, training sessions, and stakeholder presentations.
Other Uses
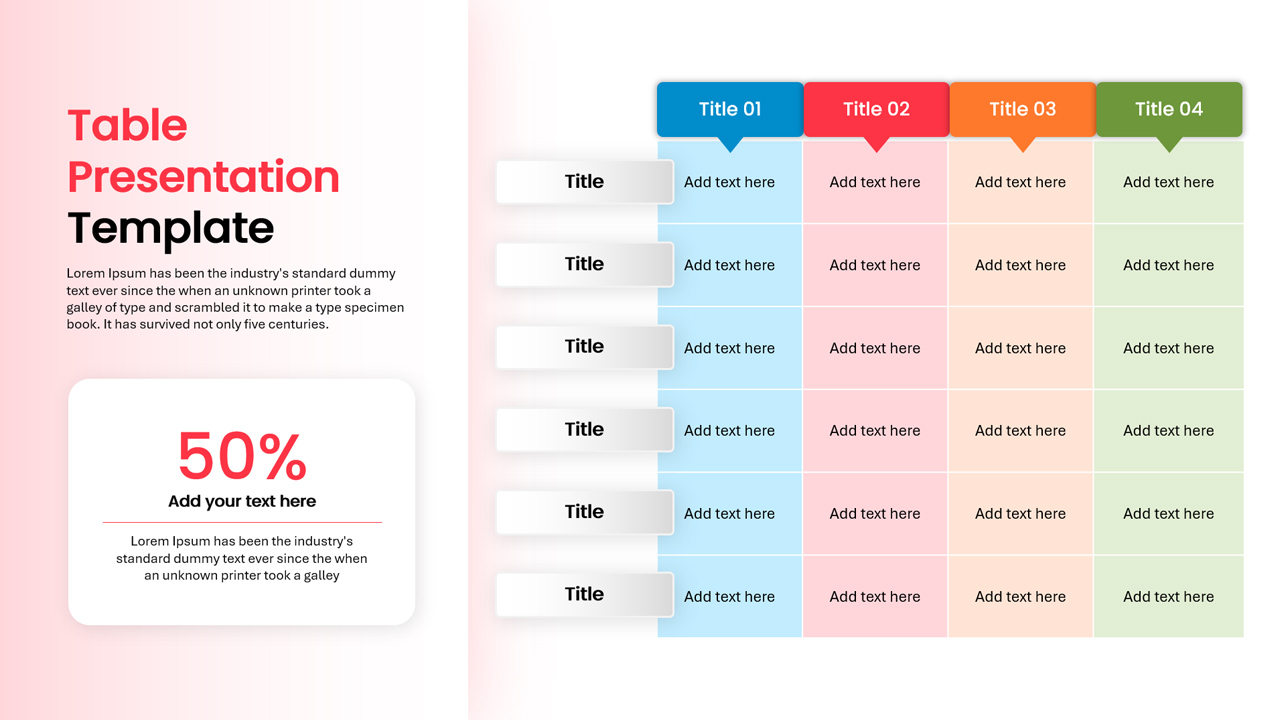
Beyond performance metrics, repurpose these infographics for A/B test results, process optimizations, budget versus actual comparisons, or customer satisfaction shifts. A structured grid layout like the table with columns template can complement these slides when presenting side-by-side data. A scenario-focused framework such as the current state vs future state comparison can support teams that need to map transitions across workflows or capability upgrades.
Login to download this file

Item ID
SB02609


Related Templates

Before and After Comparison Template for PowerPoint & Google Slides
Comparison
Before & After Process Change PowerPoint Template
Process
Free Before And After Slide PowerPoint Template
Comparison
Free
Before And After Template
Infographics
3-Column Comparison template for PowerPoint & Google Slides
Comparison

Circular Product Comparison Chart Template for PowerPoint & Google Slides
Comparison Chart
Regional Revenue Comparison Overview Template for PowerPoint & Google Slides
Comparison
Cross Sell & Up Sell Strategy Comparison template
Comparison
Product Feature Comparison Table Template
Comparison Chart
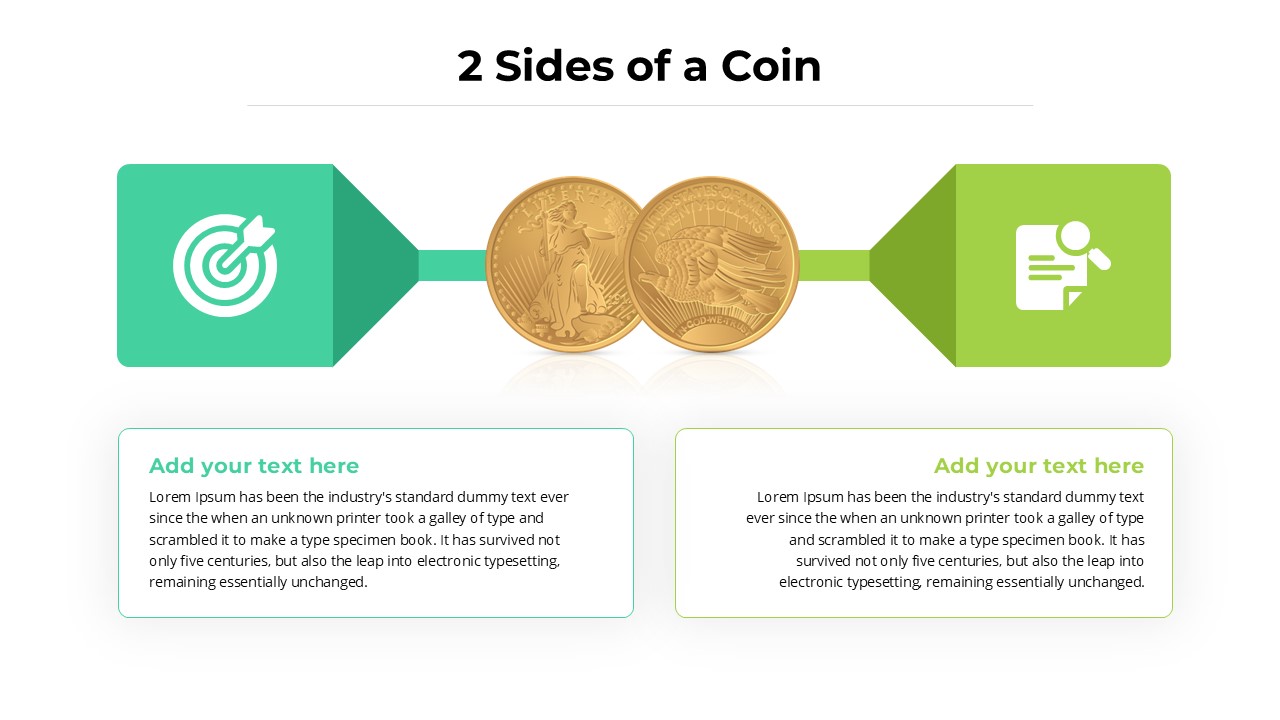
Two-Sided Coin Comparison Diagram Template for PowerPoint & Google Slides
Comparison
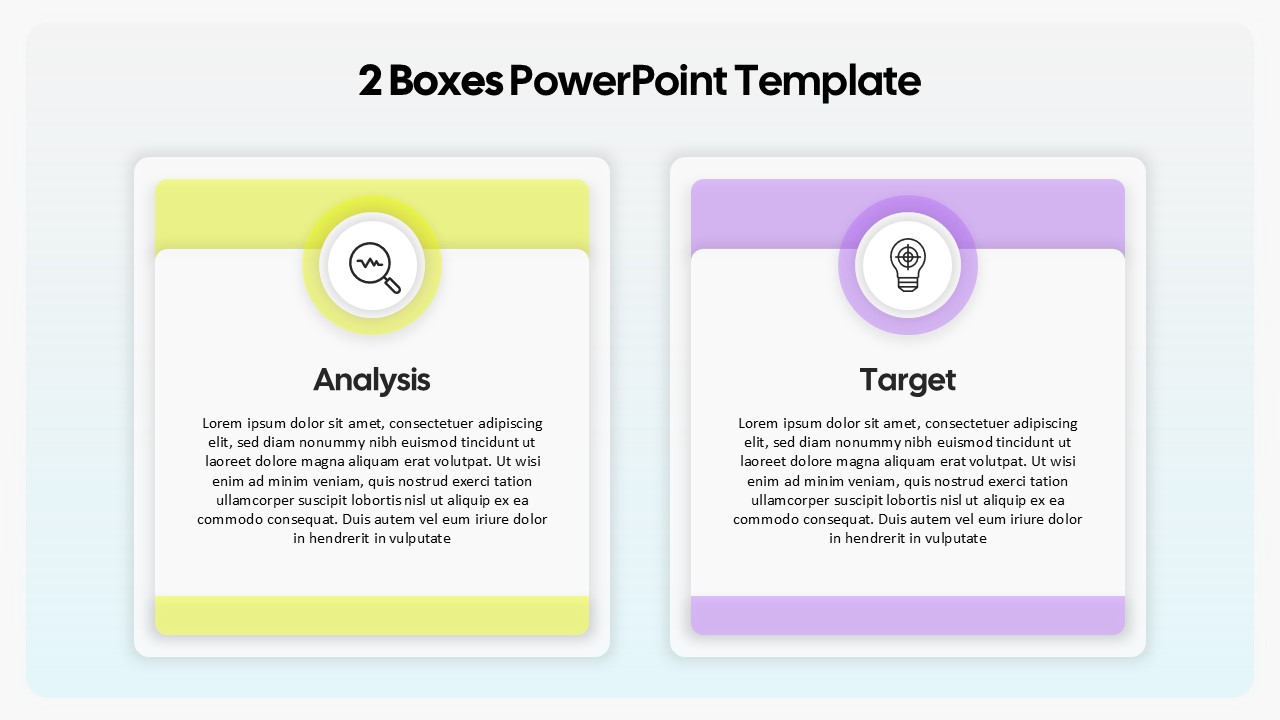
2 Boxes PowerPoint Template for Presentations
Comparison
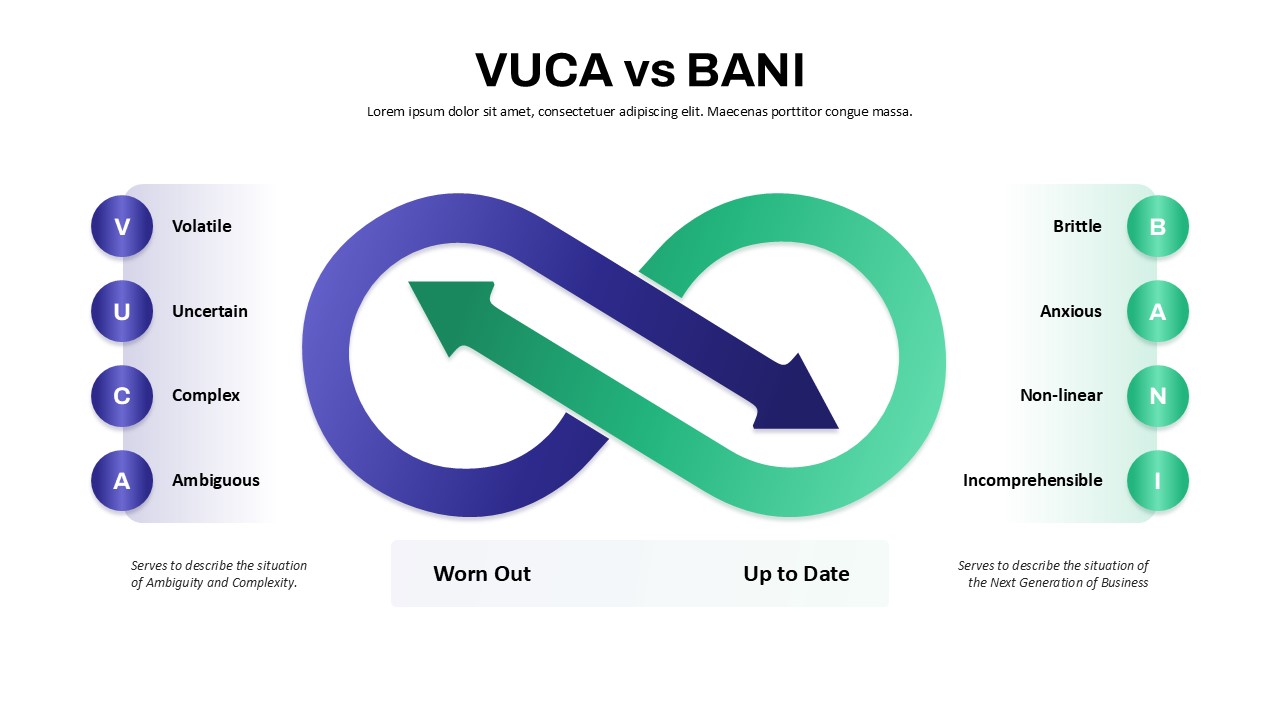
VUCA vs BANI Comparison Template
Comparison
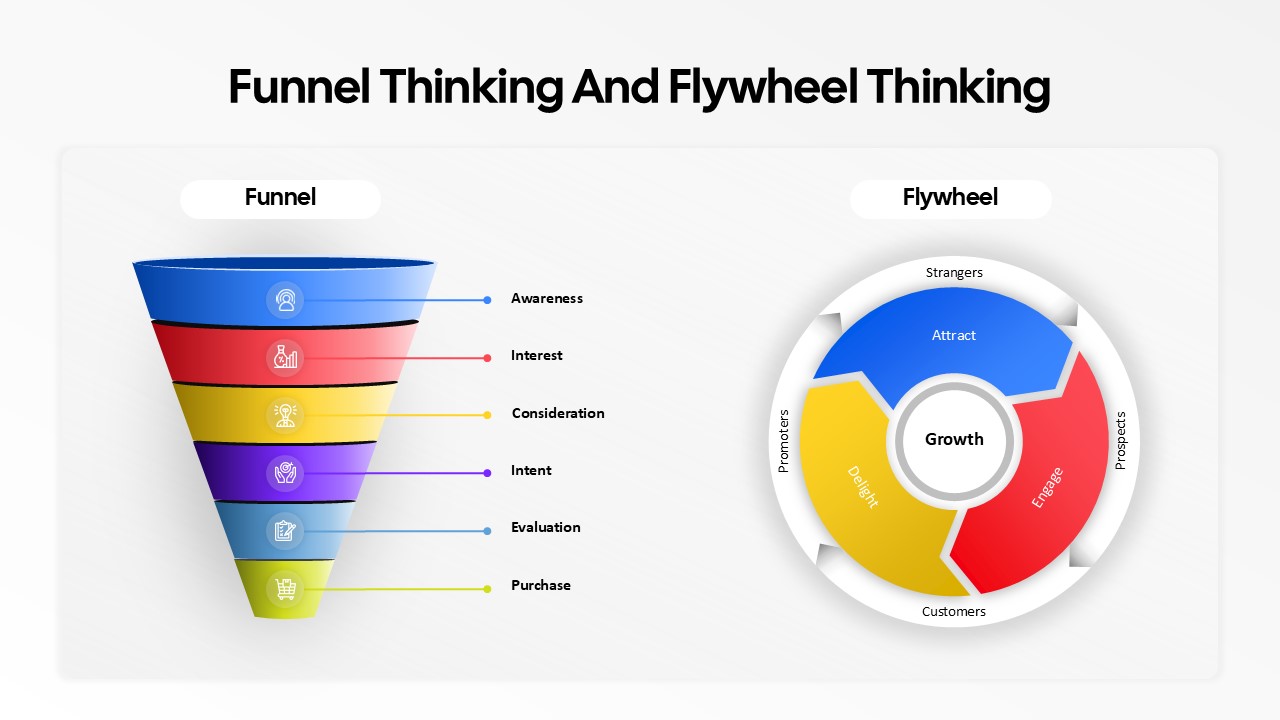
Funnel and Flywheel Thinking Comparison template PPT
Infographics
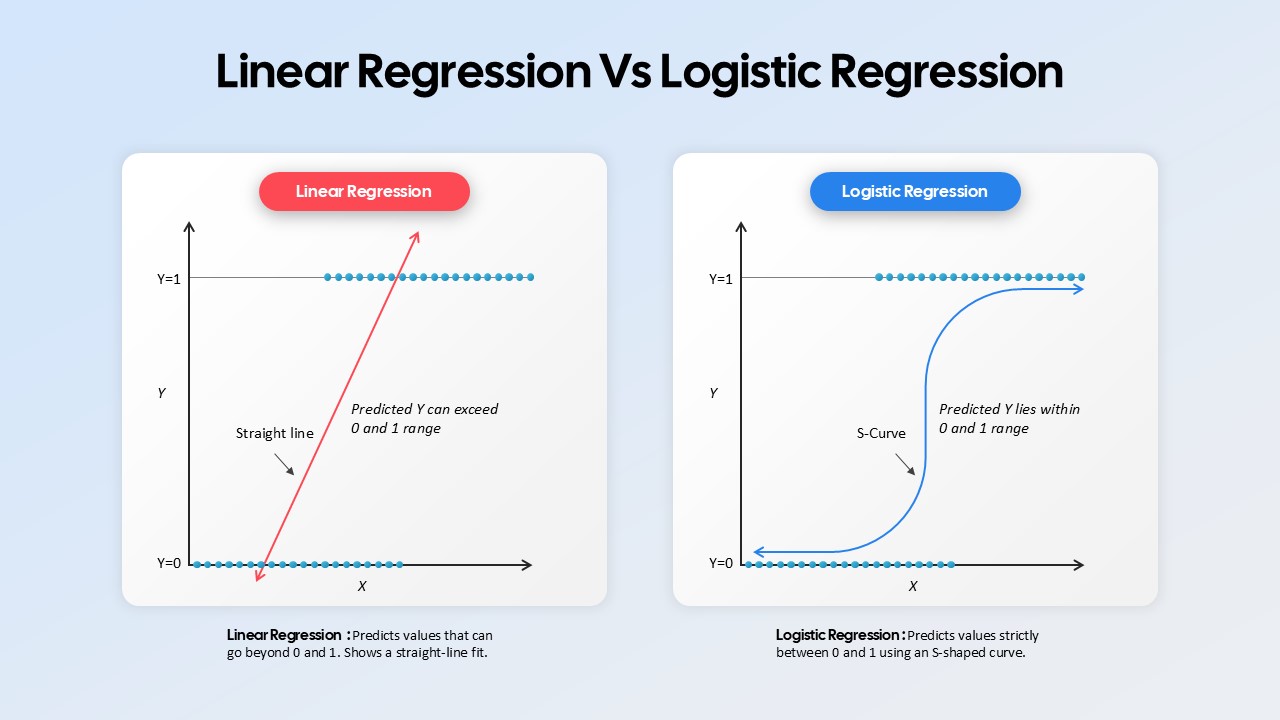
Linear Regression Vs Logistic Regression Comparison Diagram
Comparison
CSAT vs NPS Comparison template for PowerPoint & Google Slides
Business Strategy
Risk vs. Reward PowerPoint Template
Opportunities Challenges
Table Presentation PowerPoint Template
Table
4-Column Data Table PowerPoint Template
Table
Operating Channels Comparison Diagram Template for PowerPoint & Google Slides
Business Models
Blank Comparison Chart PowerPoint Template
Comparison Chart