Half Year Gantt Chart Templat for PowerPoint & Google Slides
Description
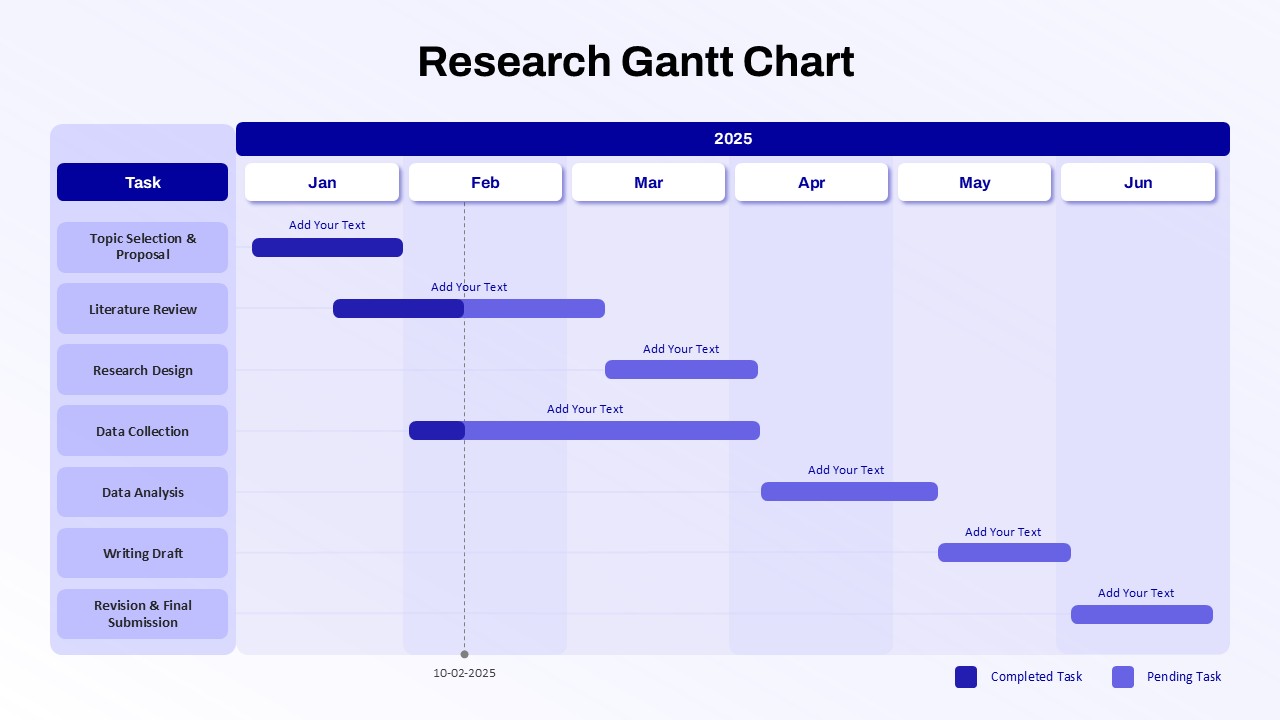
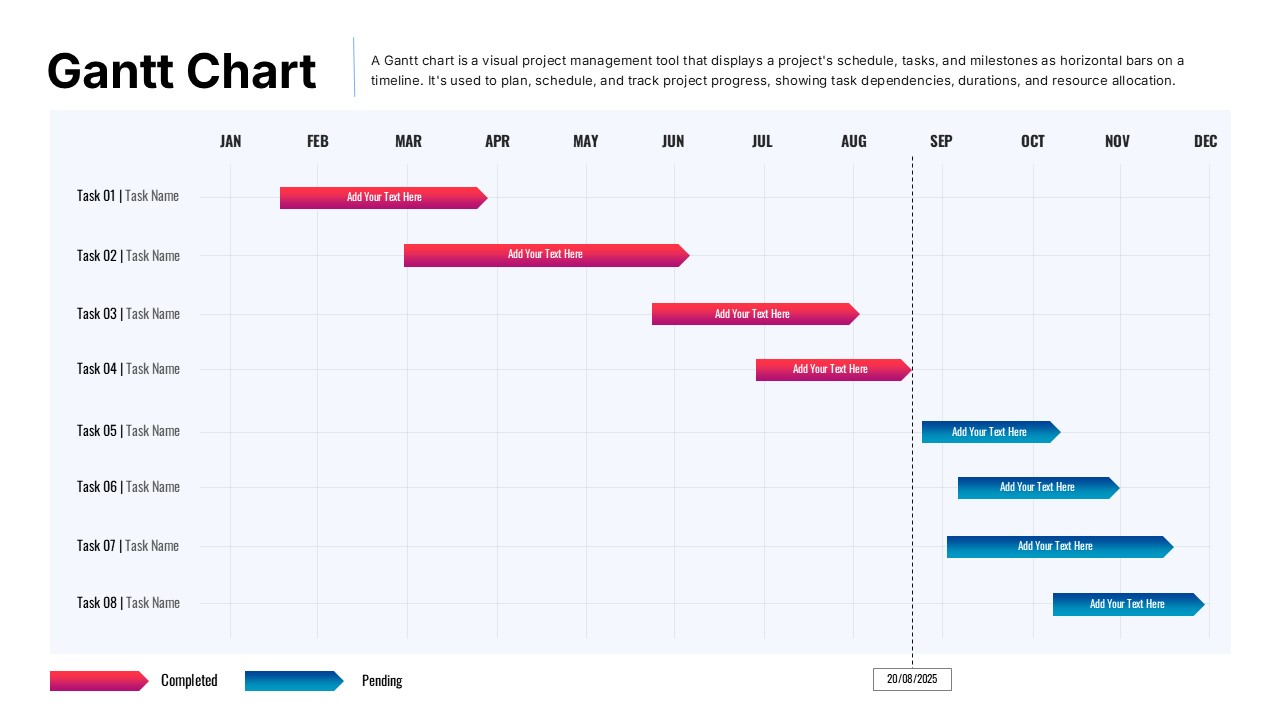
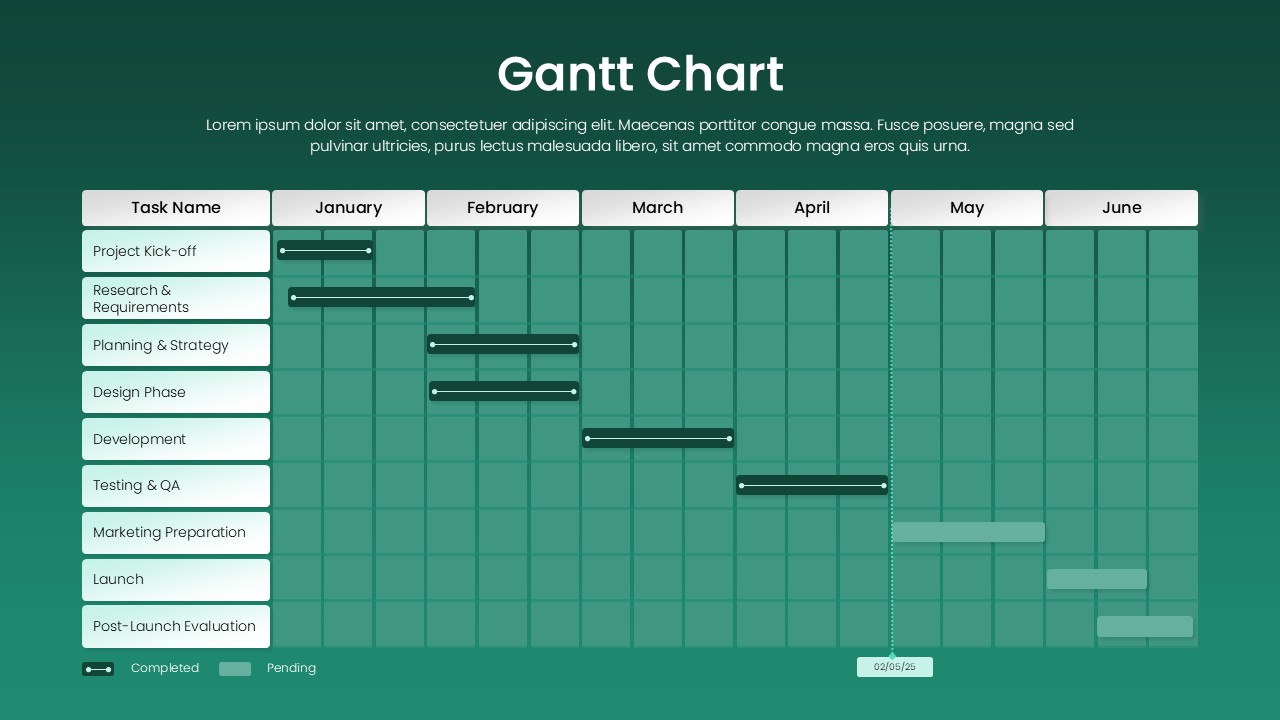
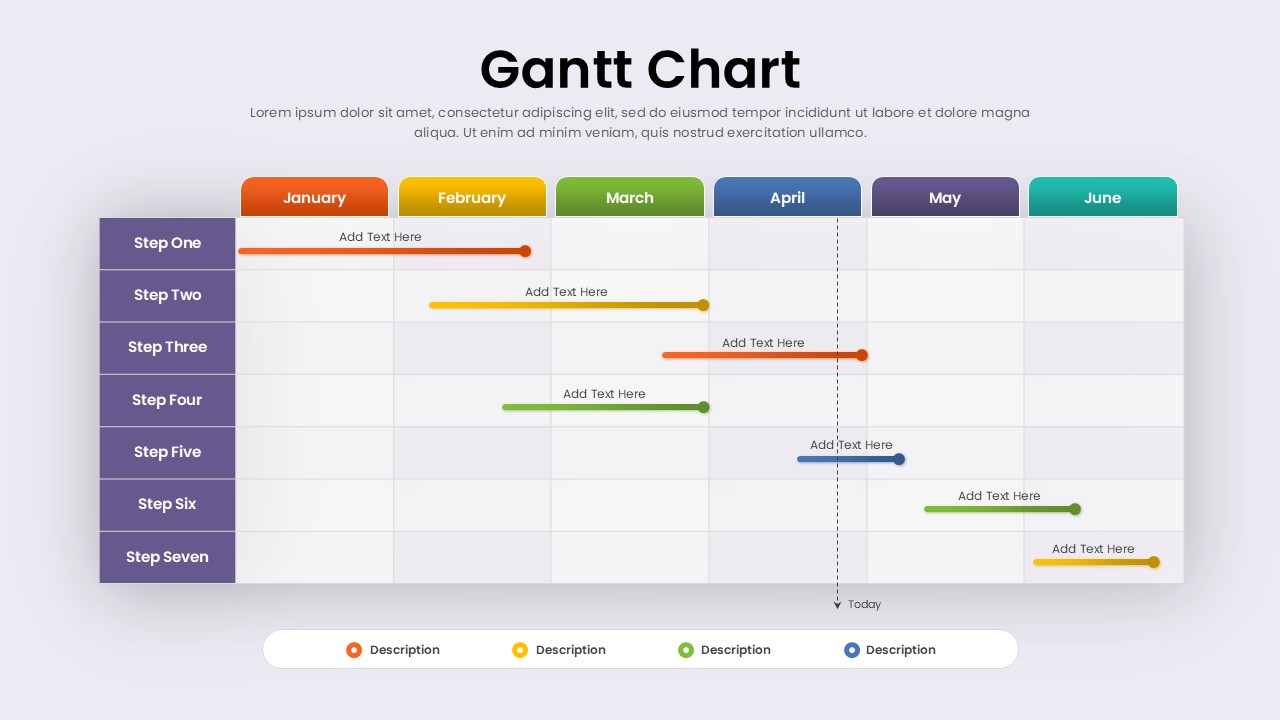
Visualize project timelines with this Colorful Gantt Chart slide, designed to help teams track task progress, deadlines, and dependencies with ease. The chart spans from January to June, with tasks aligned vertically and progress bars mapped across the timeline. Completed work is represented by dotted bars with percentage labels, while pending activities are highlighted in solid bars—making it simple to distinguish between finished and ongoing tasks.
The template uses a clean, grid-based structure with a mix of purple and yellow tones that enhance readability while maintaining a modern, professional appeal. Each task row includes editable placeholders, allowing you to add task names, milestones, and progress notes. A vertical marker highlights the current date for real-time tracking, enabling teams to assess whether activities are on schedule.
This Gantt Chart is fully editable in both PowerPoint and Google Slides, letting you adjust colors, durations, and task labels to suit any project. Whether for weekly updates, quarterly reviews, or large-scale project planning, the layout supports clarity and collaboration, helping stakeholders quickly identify bottlenecks, delays, or completed milestones.
Who is it for
This slide is ideal for project managers, team leads, and PMO specialists who need to present schedules in client meetings or internal reviews. It also serves consultants, executives, and educators managing academic or organizational projects.
Other Uses
Beyond project planning, this Gantt chart can be used for event scheduling, product launches, agile sprint tracking, HR onboarding plans, and marketing campaign management. It is also effective for educational coursework planning or nonprofit activity tracking.
Login to download this file

Item ID
SB05442Designed By
Naseeba
Related Templates

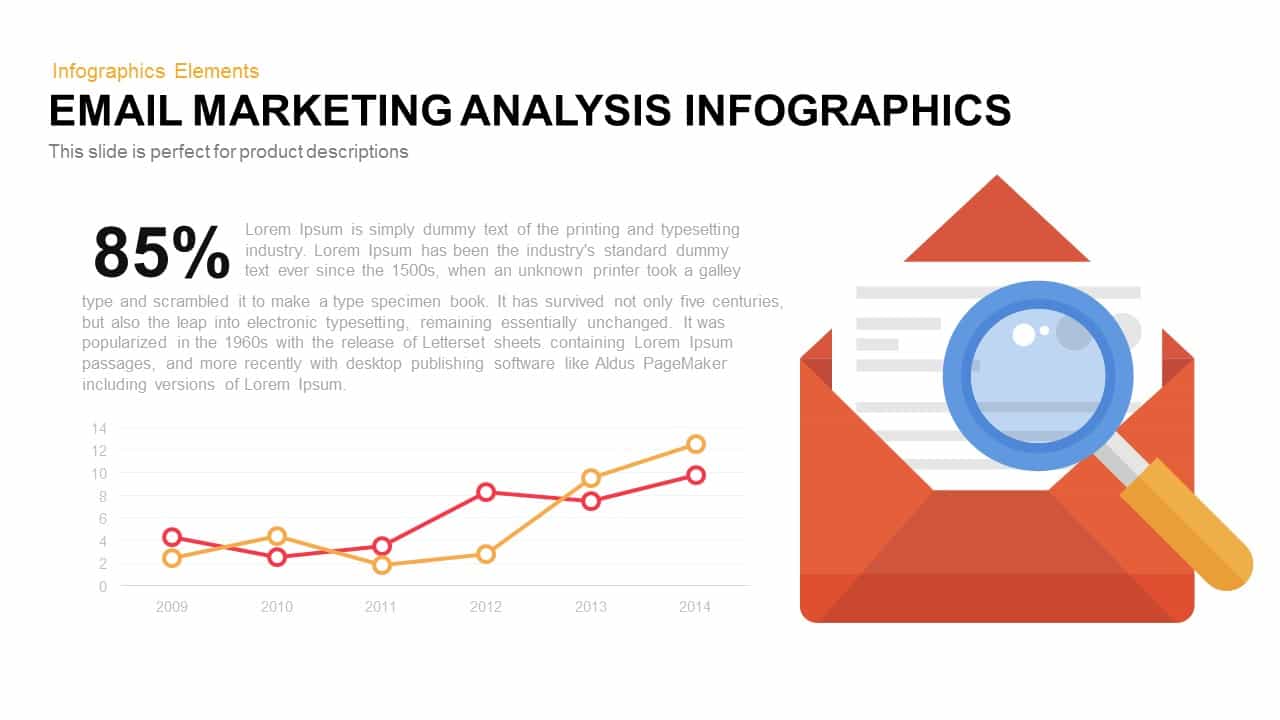
Email Marketing Analysis Infographics Templat for PowerPoint & Google Slides
Marketing
Year-over-Year Stacked Gender Bar Chart Template for PowerPoint & Google Slides
Bar/Column
Year-over-Year Performance Comparison Template for PowerPoint & Google Slides
Comparison Chart
Free Professional Gantt Chart Pack – 4 Slides Template for PowerPoint & Google Slides
Gantt Chart
Free
Creative Dynamic Gantt Chart Timeline Template for PowerPoint & Google Slides
Timeline

Fully Editable Gantt Chart Timeline template for PowerPoint & Google Slides
Gantt Chart

Product Roadmap Gantt Chart Timeline template for PowerPoint & Google Slides
Gantt Chart
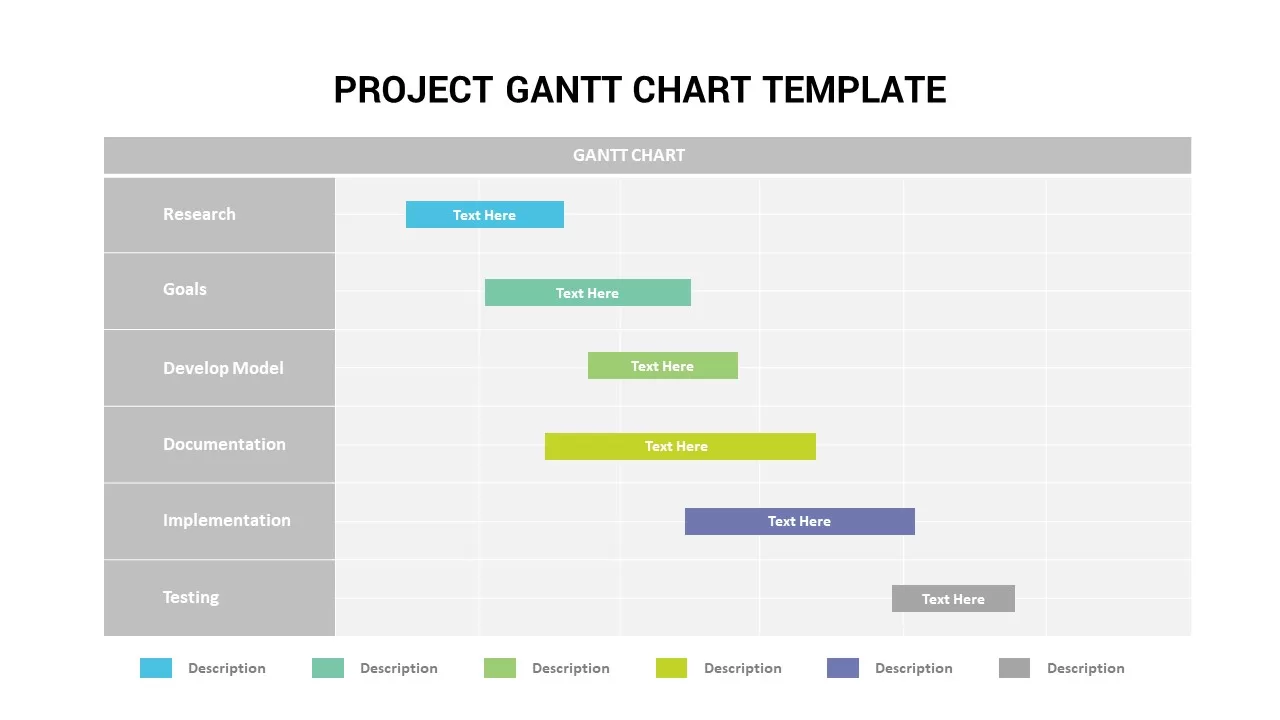
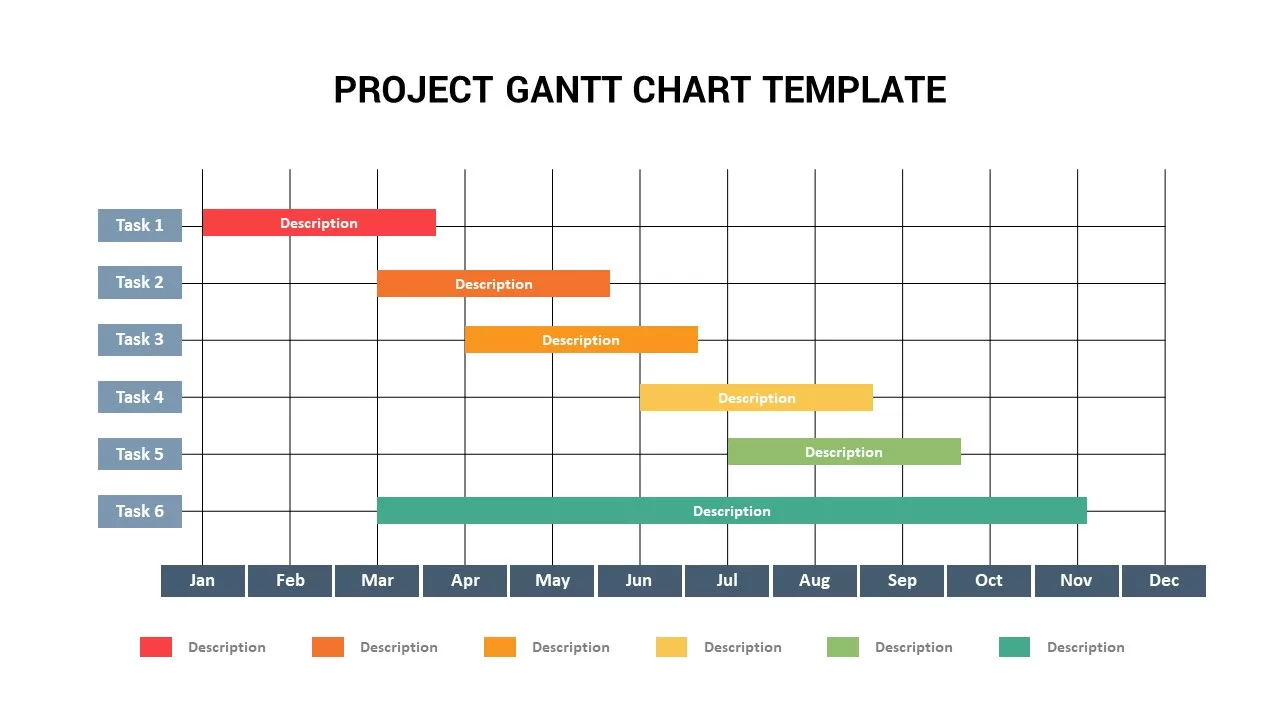
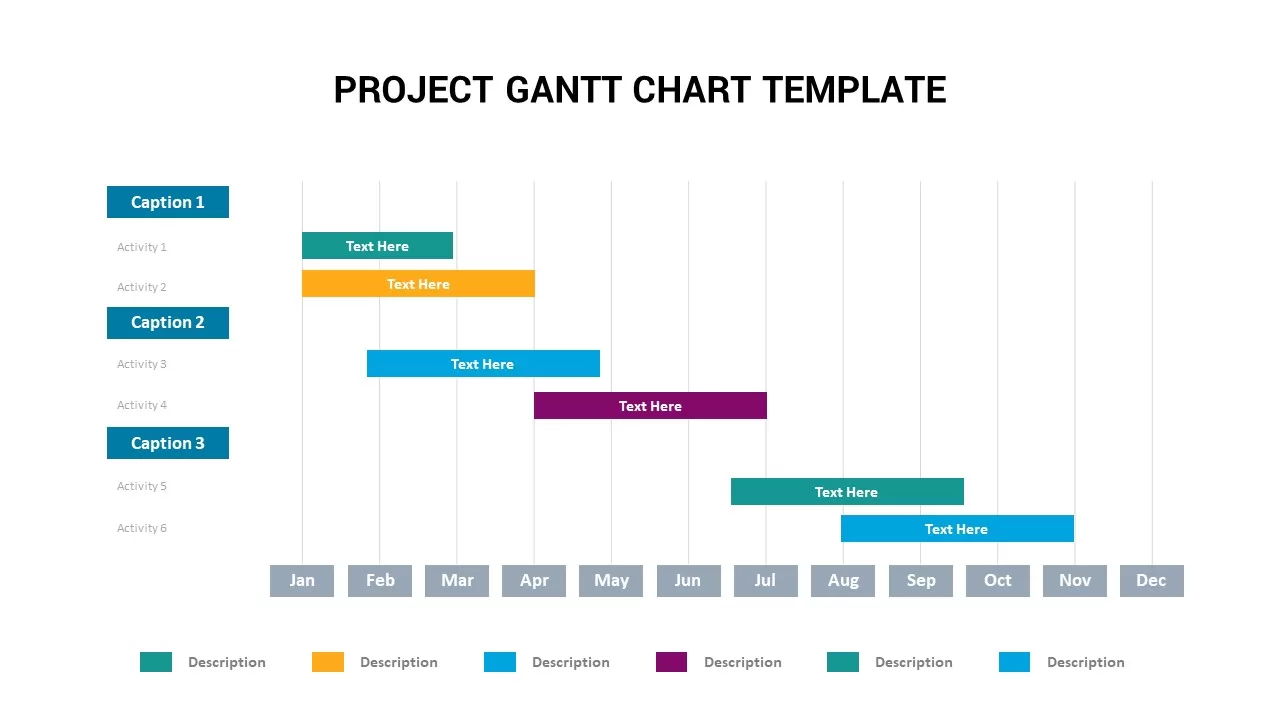
Project Gantt Chart template for PowerPoint & Google Slides
Gantt Chart
Interactive Project Gantt Chart Timeline Template for PowerPoint & Google Slides
Gantt Chart
Annual Project Gantt Chart Timeline Template for PowerPoint & Google Slides
Gantt Chart
Project Gantt Chart Template for PowerPoint & Google Slides
Gantt Chart
Overlapping Timeline Gantt Chart Diagram Template for PowerPoint & Google Slides
Timeline
Project Tracker Timeline Gantt Chart Template for PowerPoint & Google Slides
Project Status
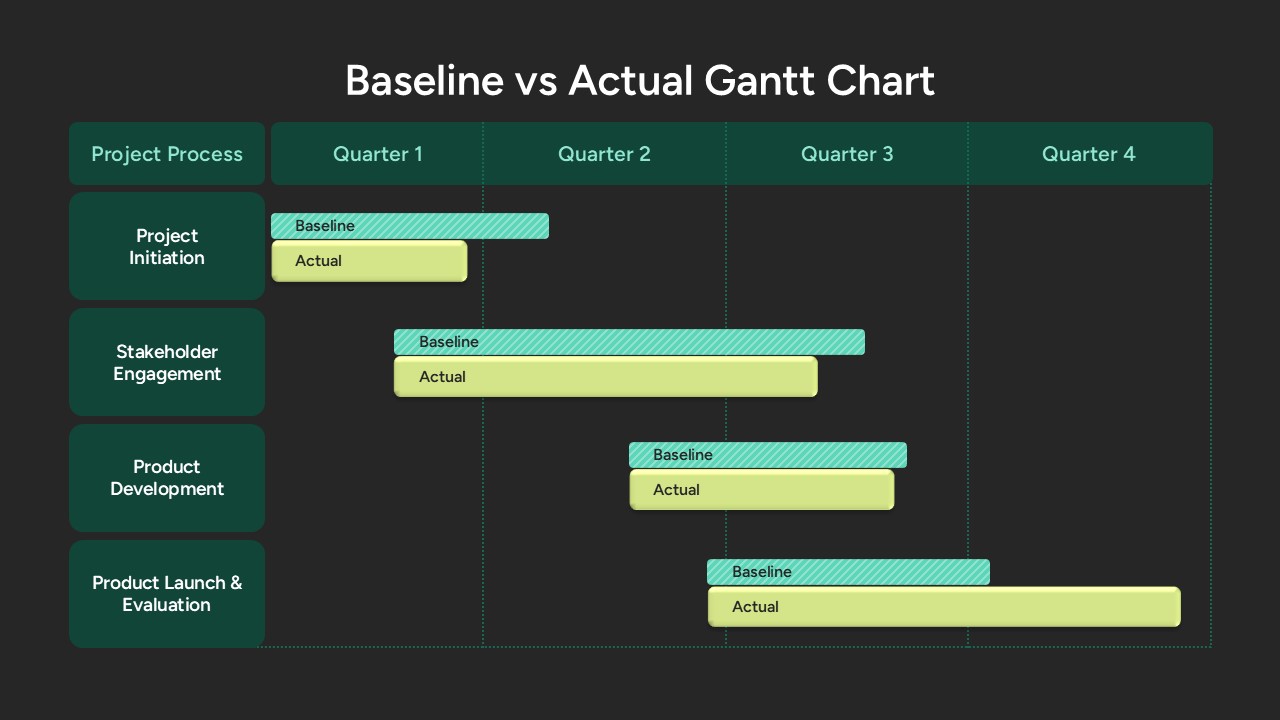
Baseline vs Actual Gantt Chart Template for PowerPoint & Google Slides
Gantt Chart
Weekly Gantt Chart Project Timeline Template for PowerPoint & Google Slides
Gantt Chart
Event Planning Gantt Chart template for PowerPoint & Google Slides
Business
Color-Coded Gantt Chart template for PowerPoint & Google Slides
Business
Team Gantt Chart Overview template for PowerPoint & Google Slides
Project Status
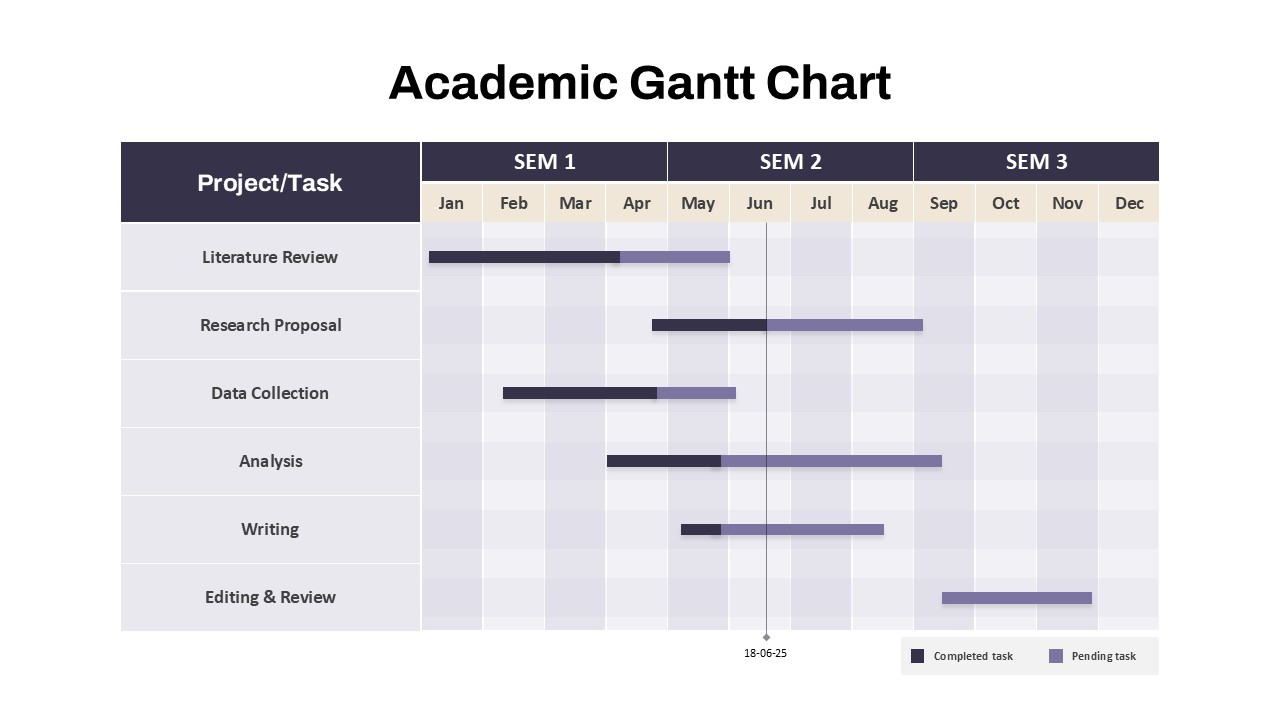
Academic Gantt Chart template for PowerPoint & Google Slides
Business
Stacked Gantt Chart Timeline Slide Template for PowerPoint & Google Slides
Gantt Chart
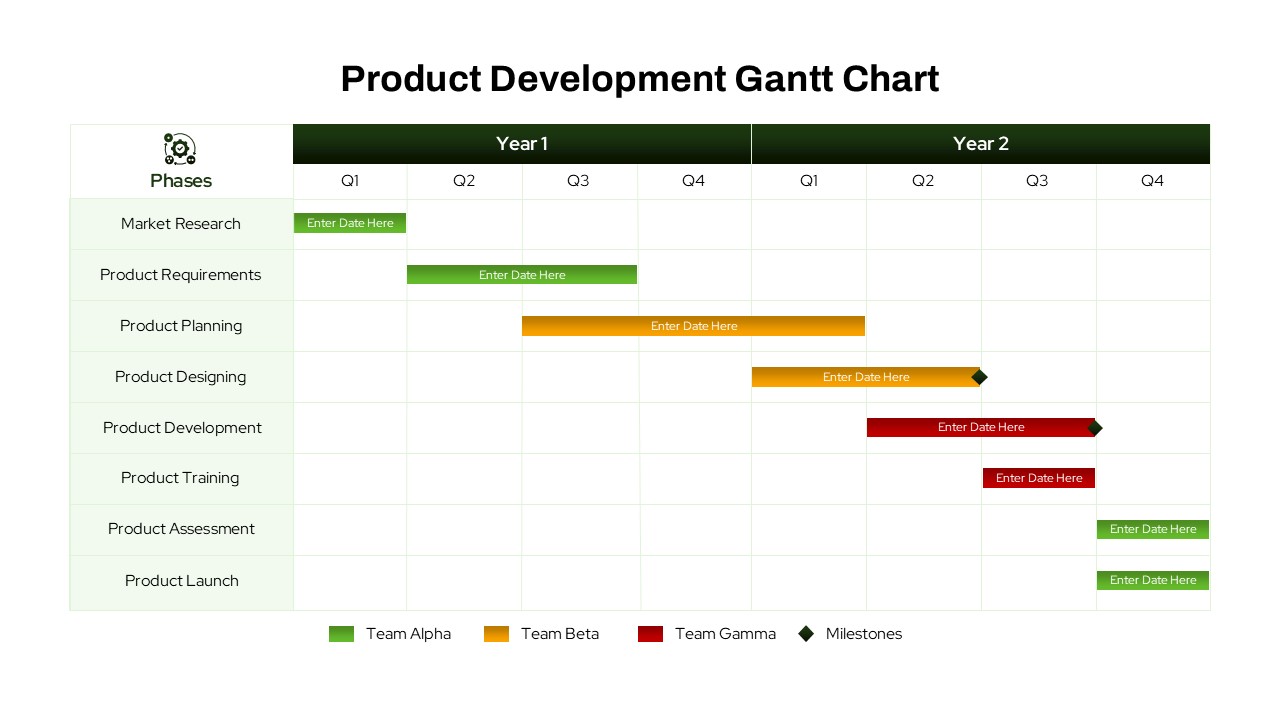
Product Development Gantt Chart template for PowerPoint & Google Slides
Gantt Chart
Static Gantt Chart Overview template for PowerPoint & Google Slides
Project Status
Bar Gantt Chart Template for PowerPoint & Google Slides
Gantt Chart
Research Gantt Chart template for PowerPoint & Google Slides
Project
Project Gantt Chart Template for PowerPoint & Google Slides
Gantt Chart
Green Gantt Chart Template for PowerPoint & Google Slides
Gantt Chart
Project Timeline Gantt Chart Template for PowerPoint & Google Slides
Gantt Chart
Colorful Annual Gantt Chart Project Planner Template for PowerPoint & Google Slides
Gantt Chart
Weekly Gantt Chart with Milestones Template for PowerPoint & Google Slides
Gantt Chart
7 Step 6 Month Gantt Chart Timeline Template for PowerPoint & Google Slides
Gantt Chart
Yearly Gantt Chart with Presentation Template for PowerPoint & Google Slides
Gantt Chart
Quarterly Gantt Chart with Today Marker Template for PowerPoint & Google Slides
Gantt Chart
Colorful Annual Gantt Chart Timeline Template for PowerPoint & Google Slides
Gantt Chart
Three-Year Bar Chart template for PowerPoint & Google Slides
Charts
Minimal Multi-Year Column Chart Template for PowerPoint & Google Slides
Bar/Column
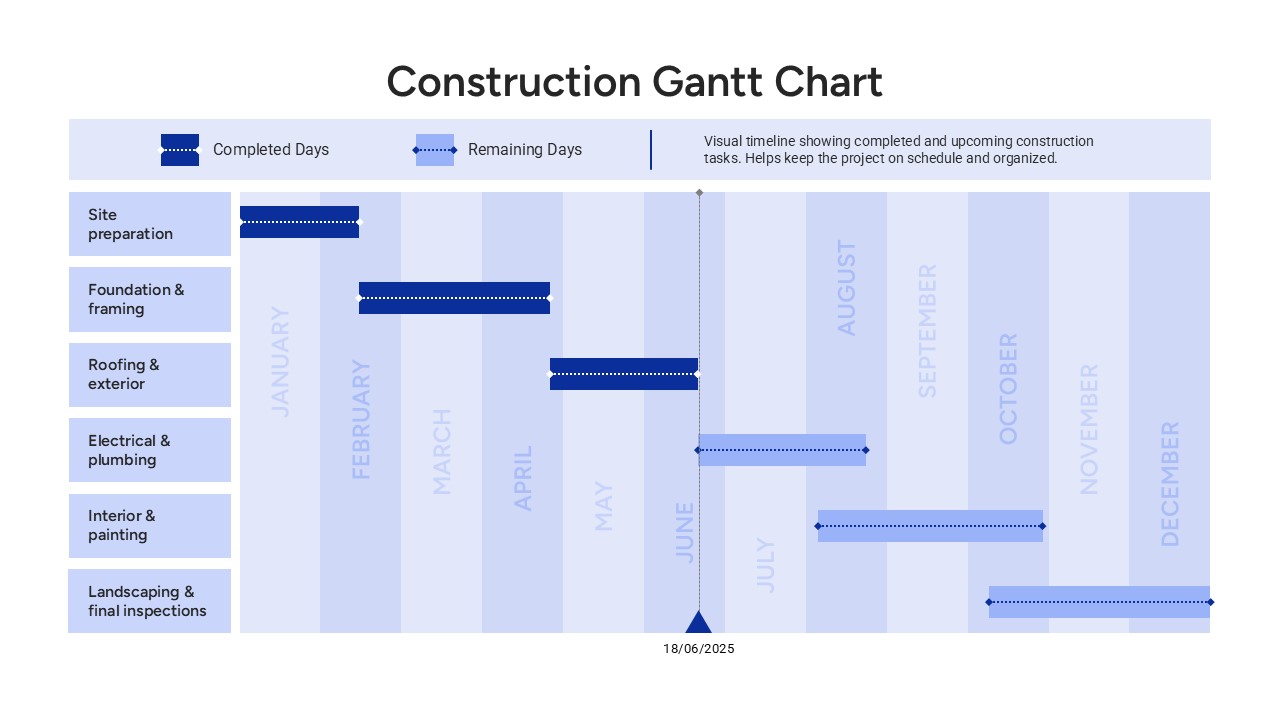
Construction Gantt Chart Template
Gantt Chart
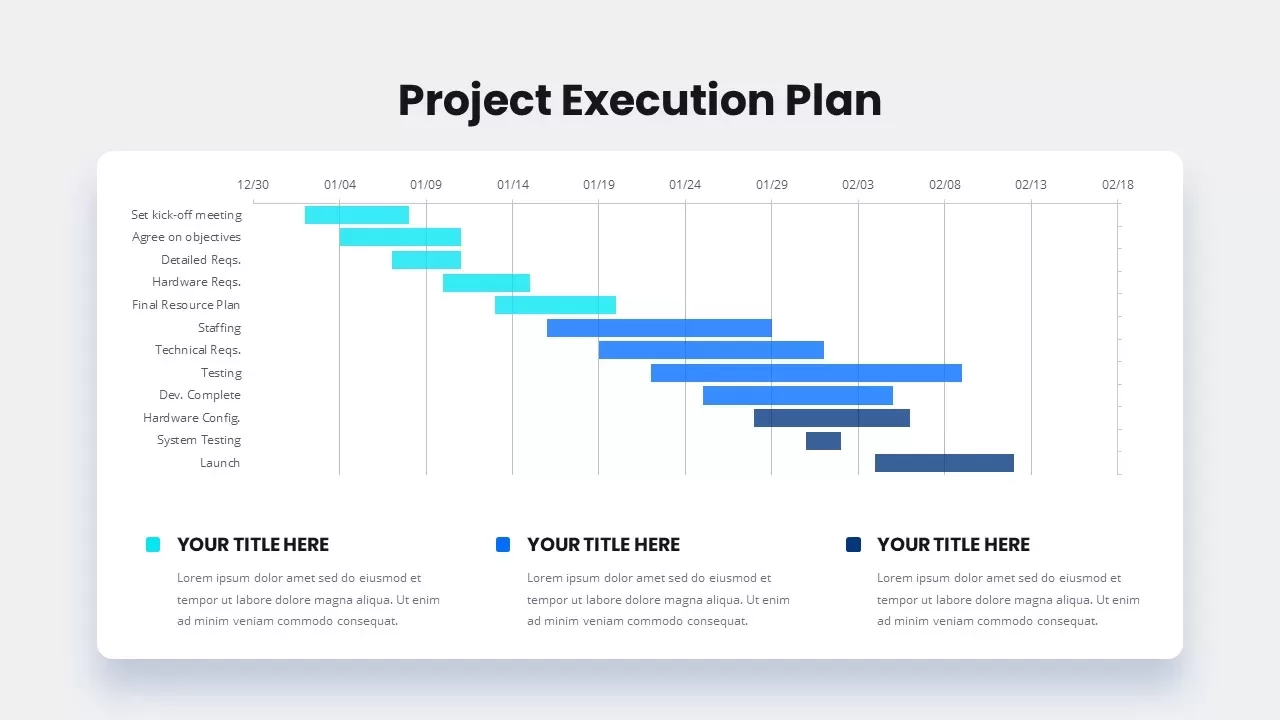
Project Execution Gantt Timeline Template for PowerPoint & Google Slides
Gantt Chart
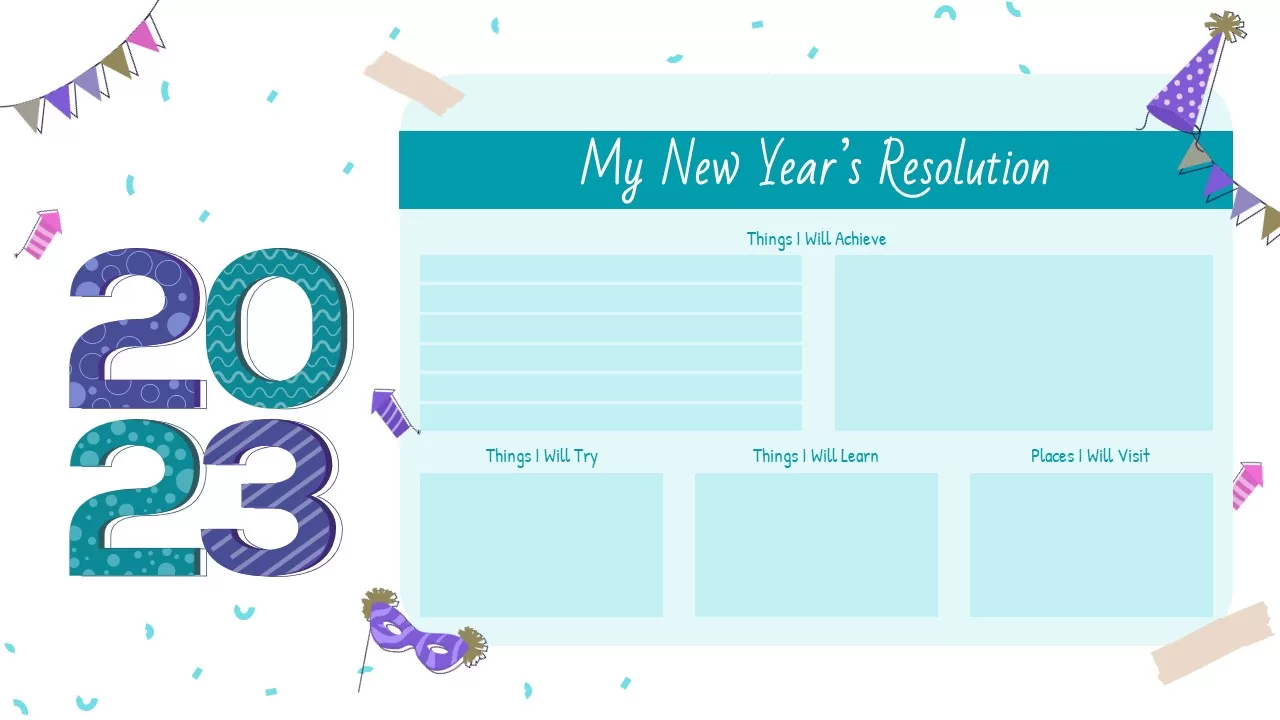
Free New Year’s Resolution Slides Pack for PowerPoint & Google Slides 2023
Graphics
Free
Multi-Year Timeline Infographic Template for PowerPoint & Google Slides
Timeline
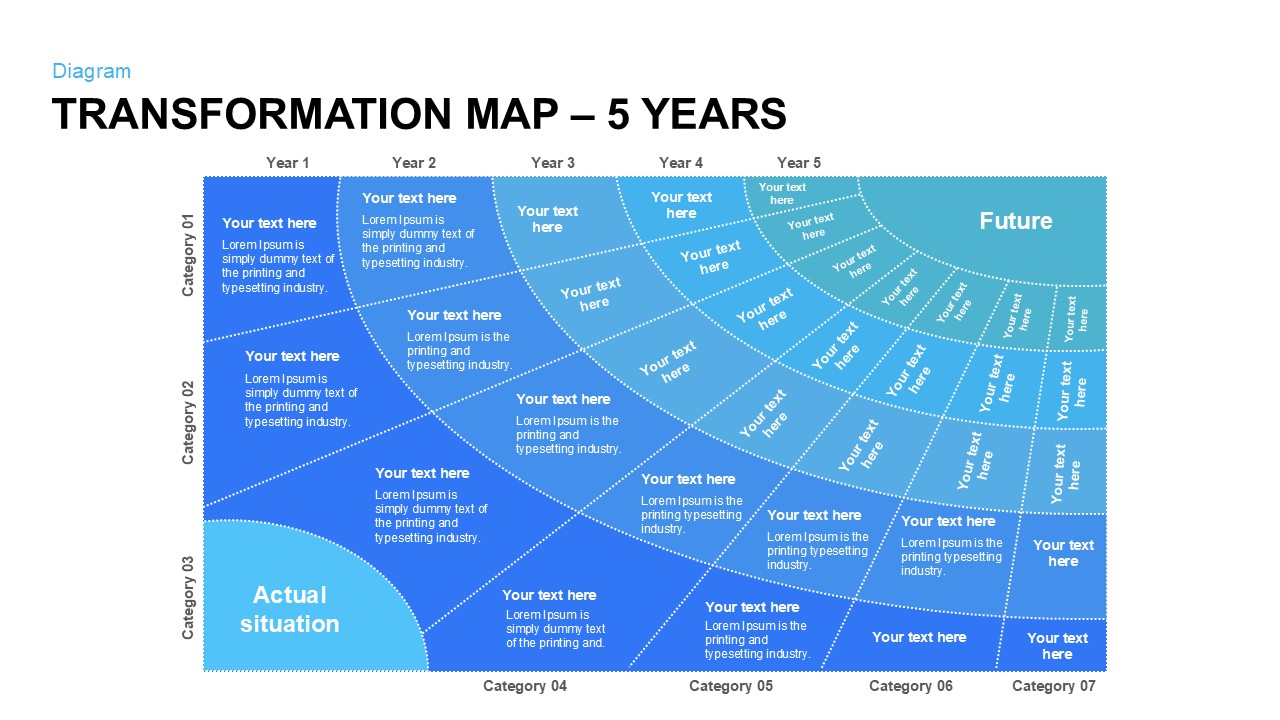
Five-Year Transformation Map Diagram Template for PowerPoint & Google Slides
Process
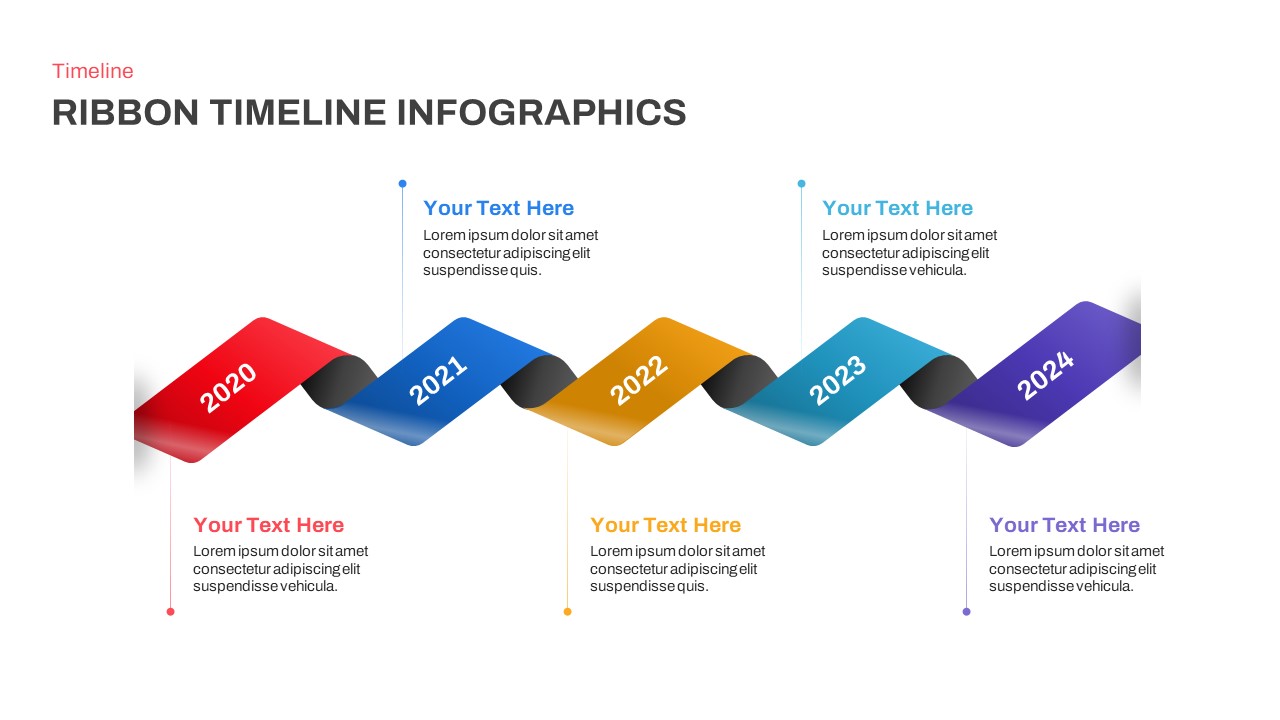
Five-Year Ribbon Timeline Diagram Template for PowerPoint & Google Slides
Timeline
Five-Year Gradient Timeline Infographic Template for PowerPoint & Google Slides
Timeline
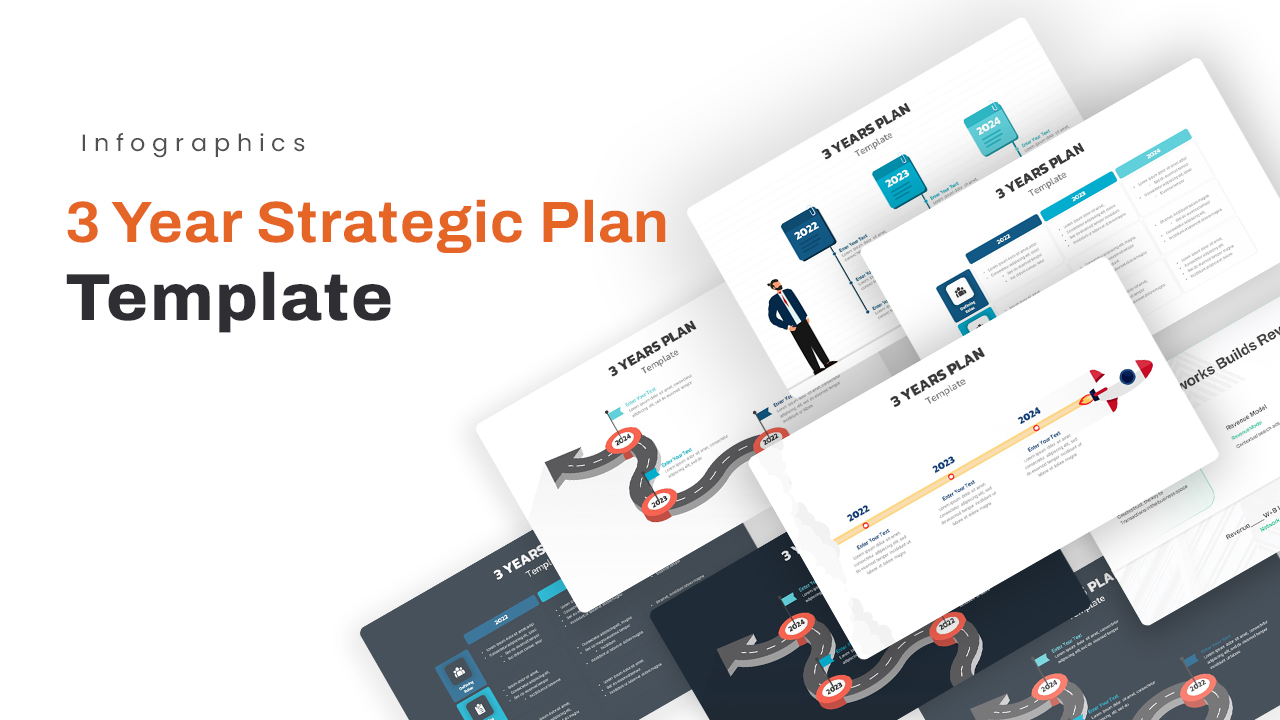
Three-Year Strategic Plan Matrix Template for PowerPoint & Google Slides
Timeline
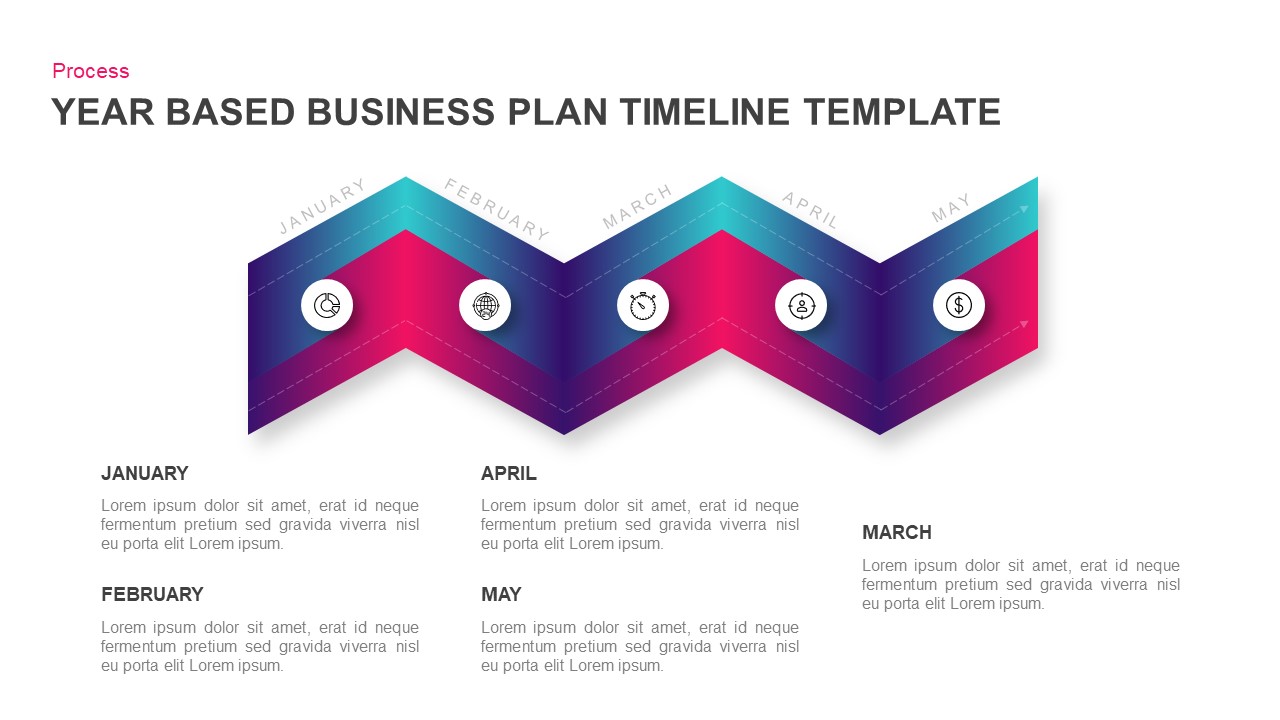
Year-Based Business Plan Zigzag Timeline Template for PowerPoint & Google Slides
Business Plan
Three-Year Plan Infographic Pack Template for PowerPoint & Google Slides
Timeline
Colorful Four-Year Timeline Layout Template for PowerPoint & Google Slides
Timeline
Colorful Five-Year Timeline Layout Template for PowerPoint & Google Slides
Timeline

Free Multi-Year Arrow Timeline Infographic Template for PowerPoint & Google Slides
Timeline
Free
Free Elegant Happy New Year Greeting Slide Template for PowerPoint & Google Slides
Graphics
Free
Milestone Timeline with Year Markers Template for PowerPoint & Google Slides
Timeline
Three-Year Vertical Milestone Timeline Template for PowerPoint & Google Slides
Timeline
Three-Year Project Roadmap Timeline Template for PowerPoint & Google Slides
Timeline
5 Year Timeline Template for PowerPoint & Google Slides
Timeline
Year in Review KPI Highlights Slide for PowerPoint & Google Slides
Business Report
Five-Year Plan Timeline Diagram Template for PowerPoint & Google Slides
Timeline
Multi-Year S-Shaped Roadmap Timeline Template for PowerPoint & Google Slides
Timeline
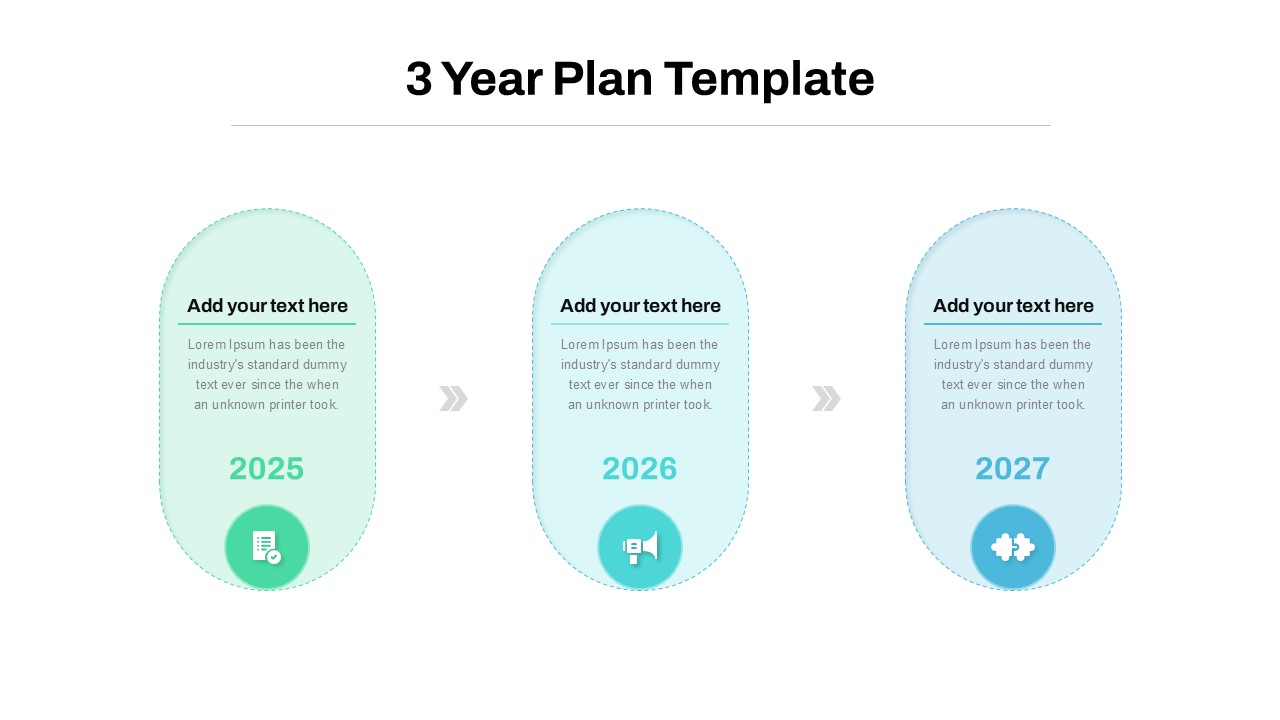
Three-Year Plan Timeline Diagram Template for PowerPoint & Google Slides
Timeline
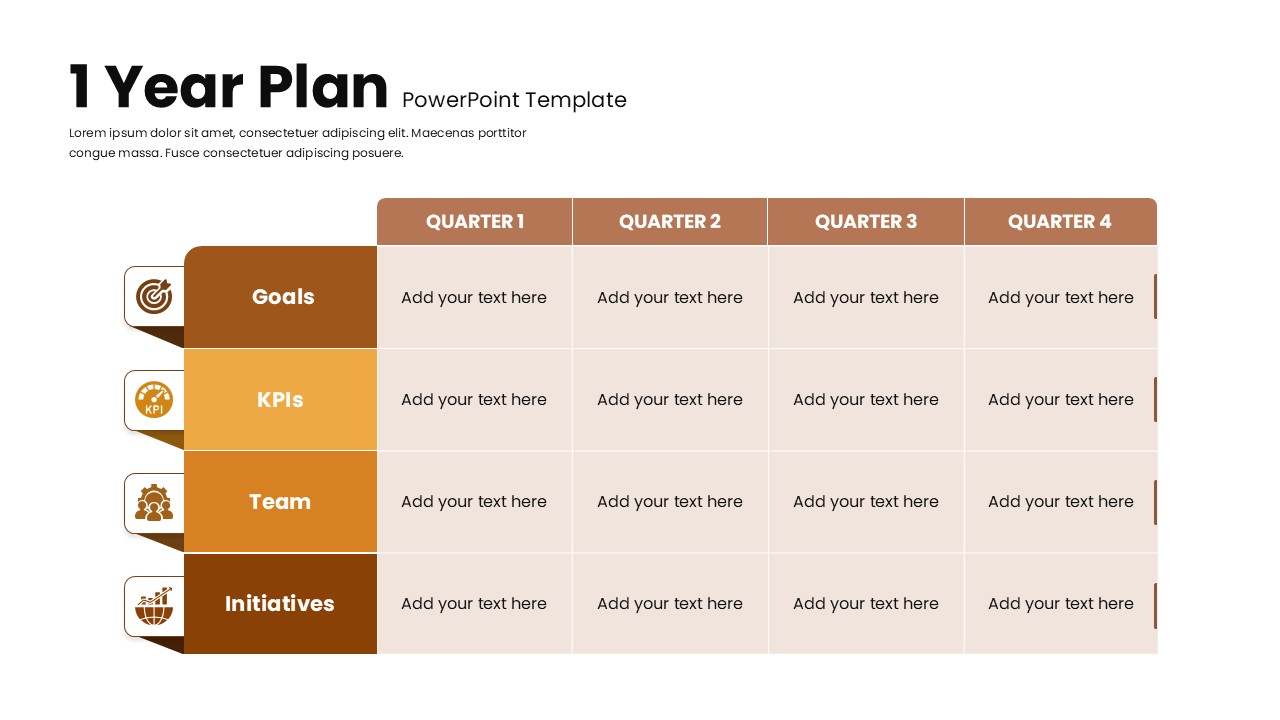
1 Year Plan Overview template for PowerPoint & Google Slides
Business Plan
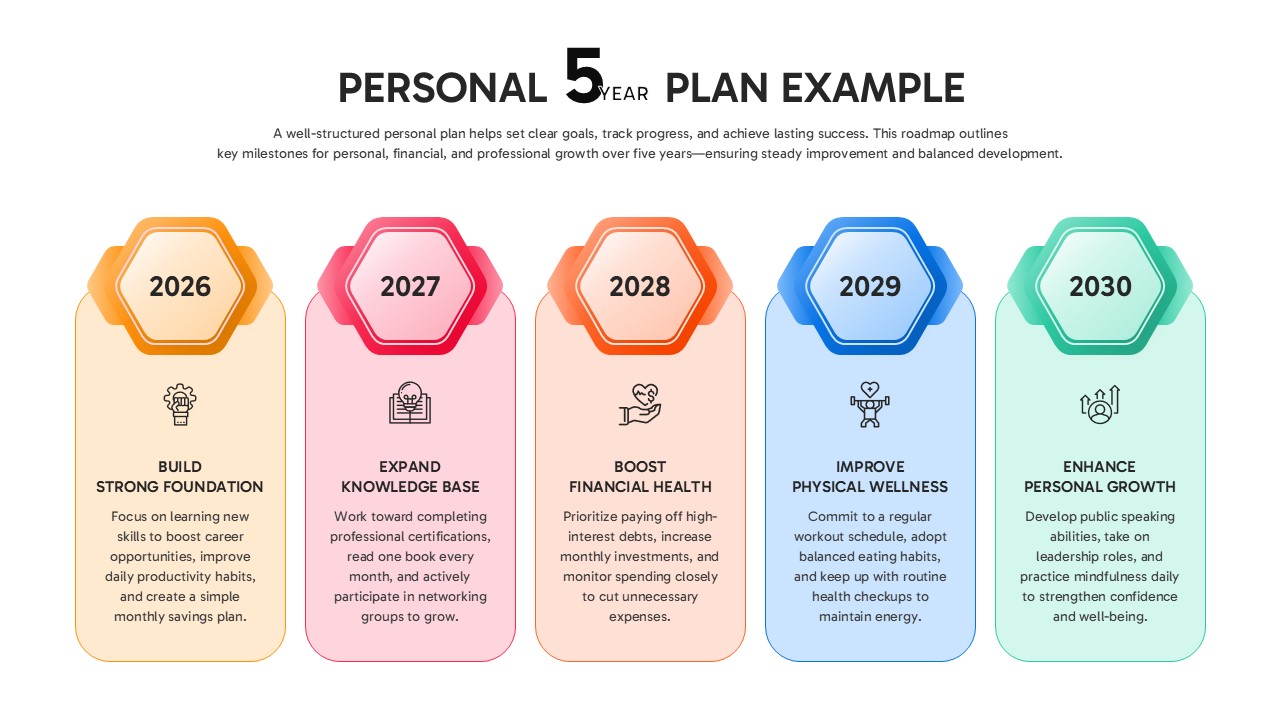
Personal 5-Year Roadmap Plan Example Template for PowerPoint & Google Slides
Timeline
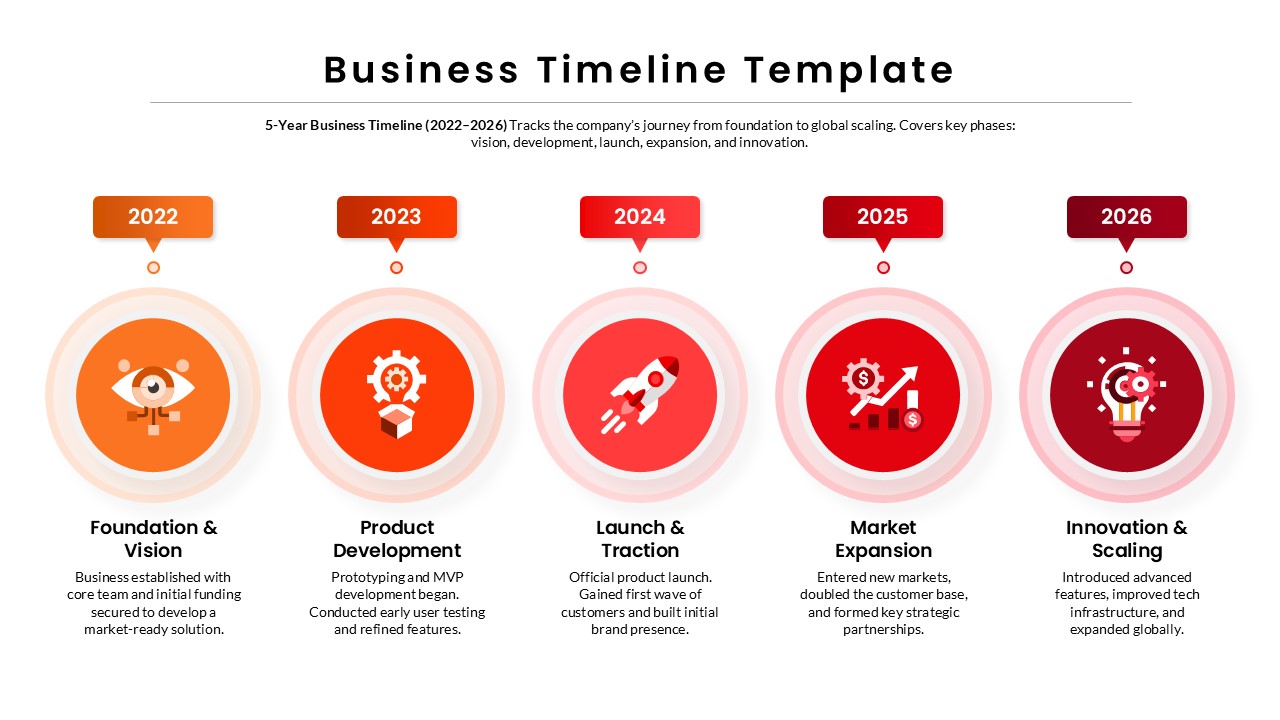
5-Year Business Timeline Template for PowerPoint & Google Slides
Timeline
End of Year Review Dashboard Template for PowerPoint & Google Slides
Business Report
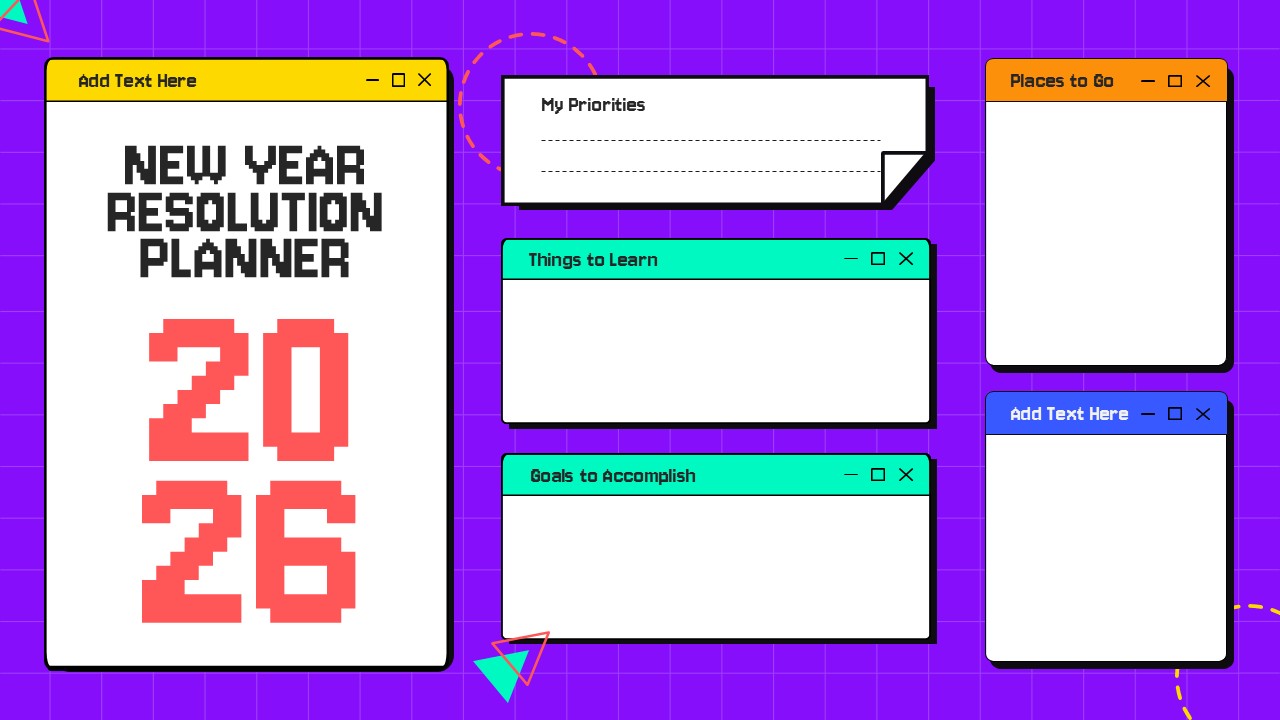
Creative New Year Resolution Planner for PowerPoint & Google Slides
Leadership
Free
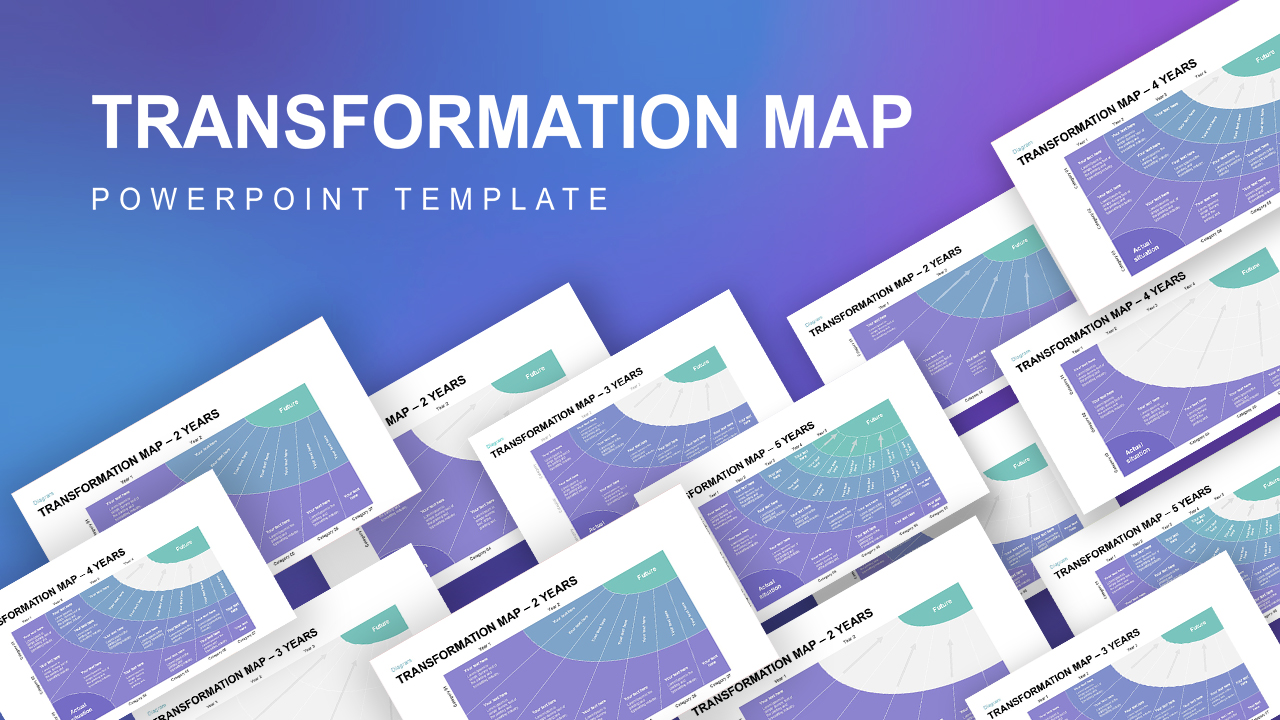
2, 3, 4, 5 Year Transformation Map PowerPoint Template
Happy New Year 2025 PowerPoint Template
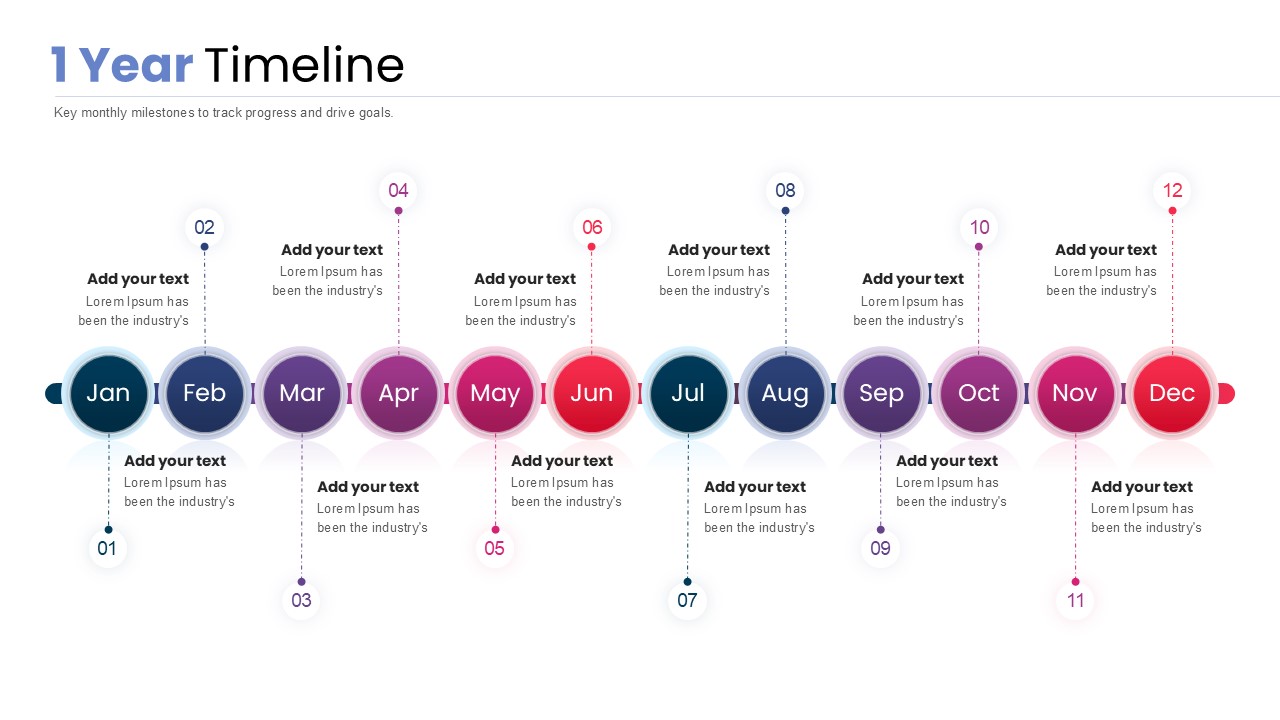
1 Year Timeline PowerPoint Template
Timeline
Quad Chart Infographic Pack of 8 Slides Template for PowerPoint & Google Slides
Comparison Chart
Circle Strategy Creative Chart template for PowerPoint & Google Slides
Business Strategy
Creative SWOT Chart template for PowerPoint & Google Slides
SWOT
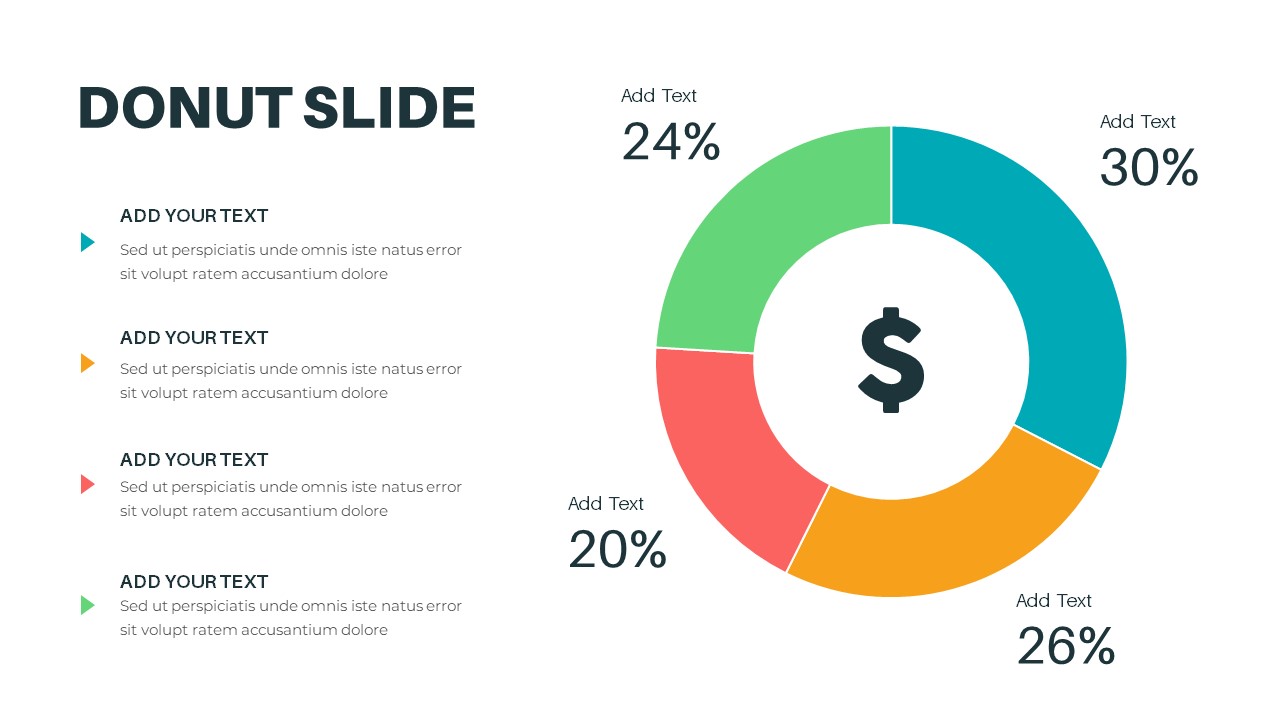
Donut Chart template for PowerPoint & Google Slides
Pie/Donut
Product Usage Analytics Dashboard Chart Template for PowerPoint & Google Slides
Bar/Column
Sales vs Budget Performance Chart Template for PowerPoint & Google Slides
Bar/Column
Interactive Product Comparison Bar Chart Template for PowerPoint & Google Slides
Bar/Column

3D Column Chart with Data Table for PowerPoint & Google Slides
Bar/Column
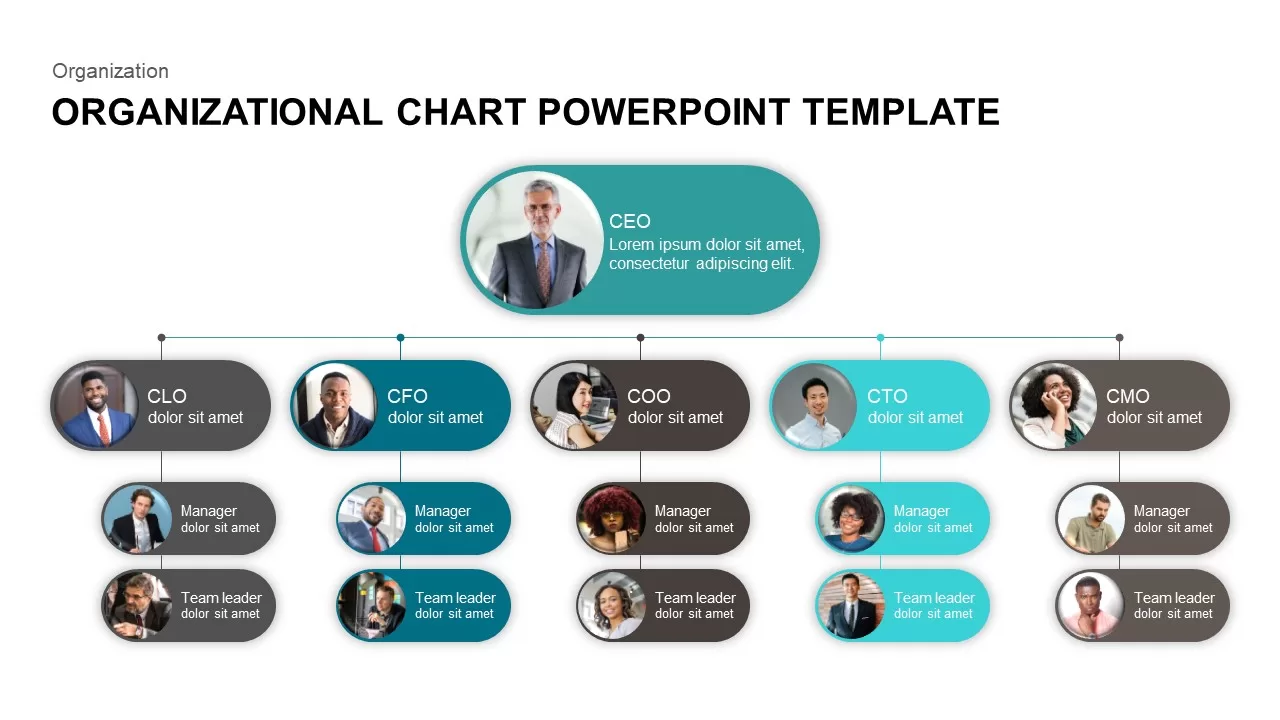
Corporate Organizational Chart Hierarchy Template for PowerPoint & Google Slides
Org Chart
For and Against Vote Count Bar Chart Template for PowerPoint & Google Slides
Bar/Column
Entertainment Industry Revenue Bar Chart Template for PowerPoint & Google Slides
Bar/Column
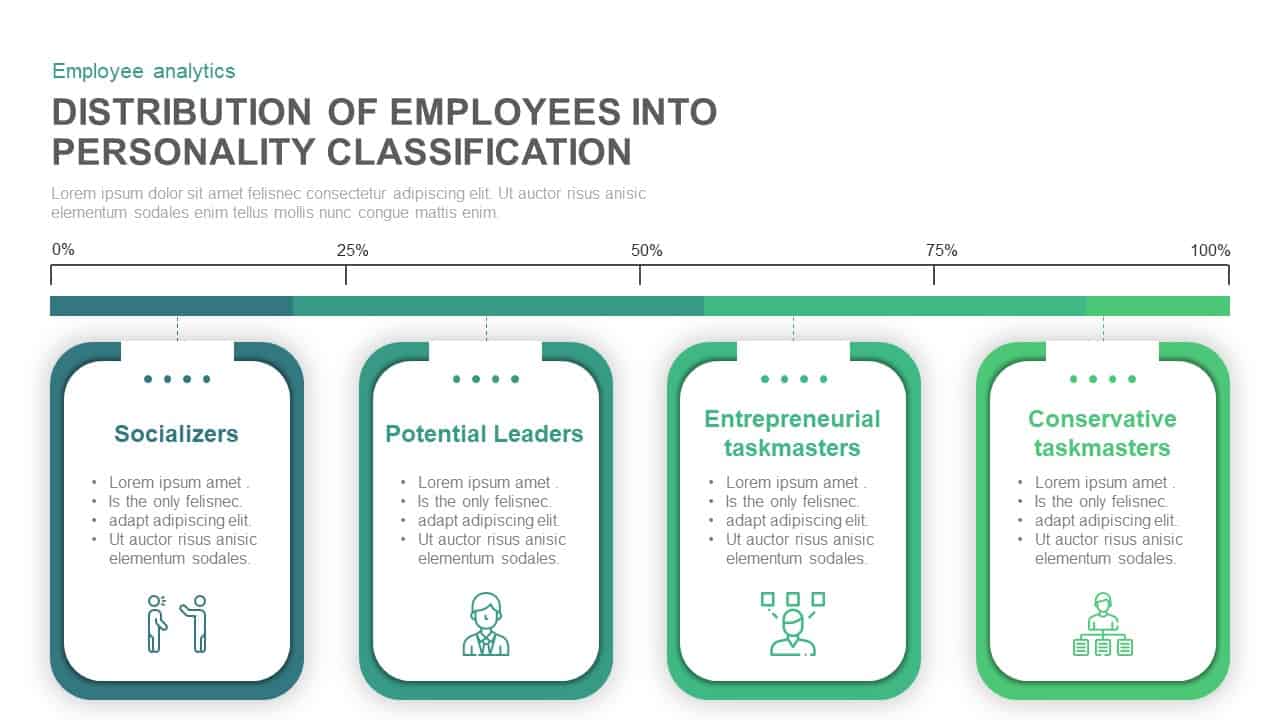
Employee Personality Distribution Chart Template for PowerPoint & Google Slides
Bar/Column
Capital Structure Dynamic Split Chart Template for PowerPoint & Google Slides
Comparison Chart
Business Growth Metaphor Chart Template for PowerPoint & Google Slides
Business
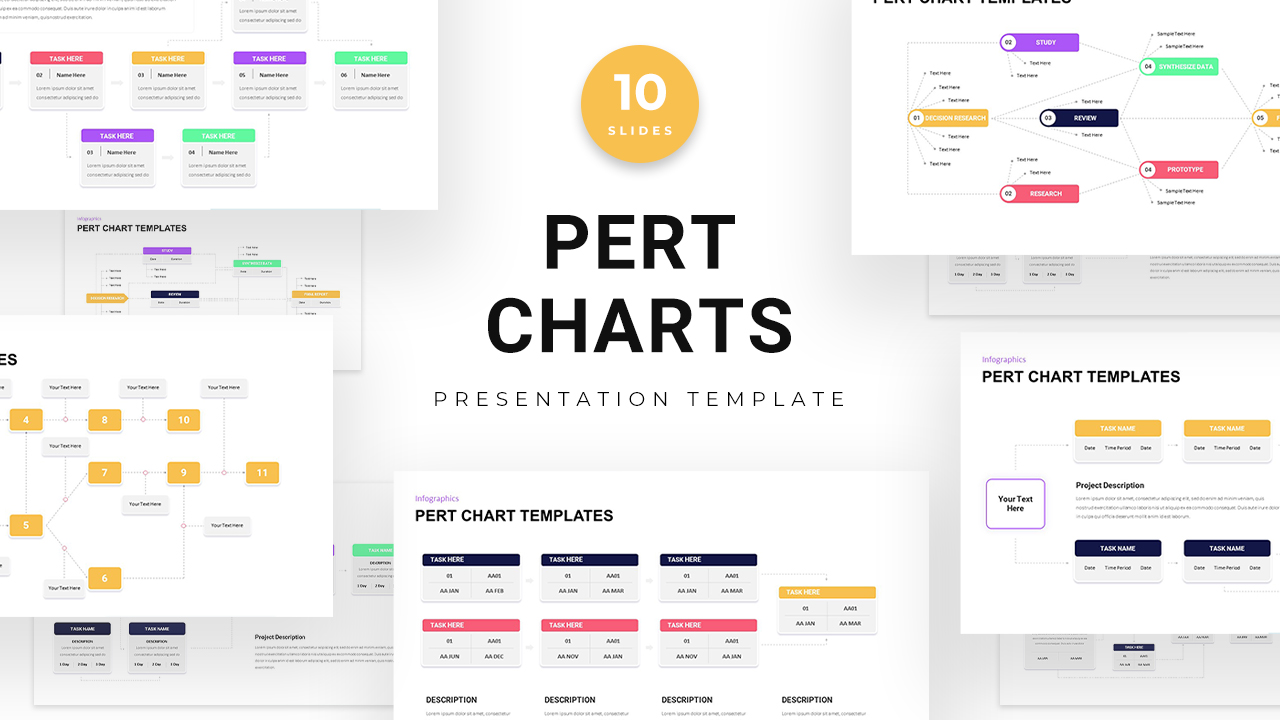
PERT Chart Project Management template for PowerPoint & Google Slides
Project Status
Flow Chart Template for PowerPoint & Google Slides
Flow Charts
Donut Chart for PowerPoint & Google Slides
Pie/Donut
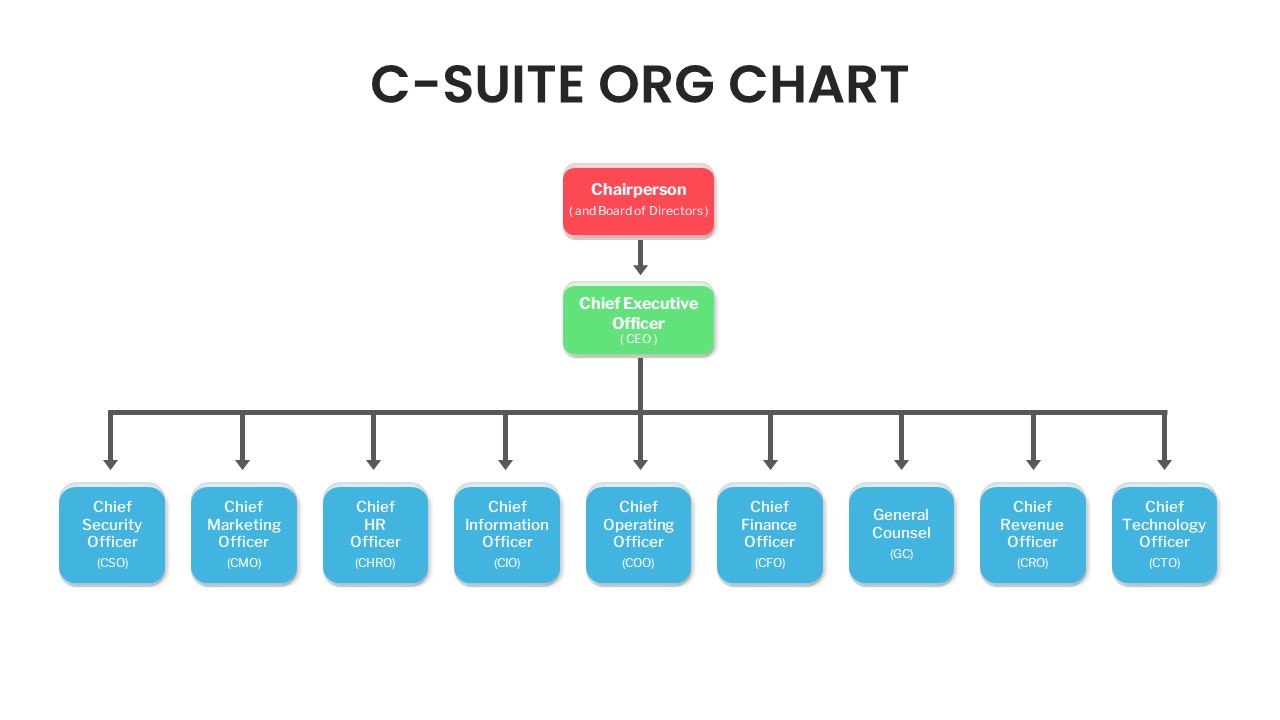
C-Suite Executive Org Chart Diagram Template for PowerPoint & Google Slides
Org Chart
Editable Multi-Series Peak Line Chart Template for PowerPoint & Google Slides
Comparison Chart
Business Timeline Comparison Bar Chart Template for PowerPoint & Google Slides
Comparison Chart
Grouped Column Chart Comparison Template for PowerPoint & Google Slides
Bar/Column
Multiple Line Chart Comparison Template for PowerPoint & Google Slides
Comparison Chart
Five-Phase and Three-Phase Phases Chart Template for PowerPoint & Google Slides
Charts
Excel-Driven Gradient Timeline Chart Template for PowerPoint & Google Slides
Multi-Series Line Chart with Icons Template for PowerPoint & Google Slides
Comparison Chart
Animated Hexagon Org Chart Diagram Template for PowerPoint & Google Slides
Org Chart
Multi-Style Clock Chart Diagram Template for PowerPoint & Google Slides
Circular
Wastewater Treatment Process Flow Chart Template for PowerPoint & Google Slides
Flow Charts
Free Versatile Product Comparison Chart Template for PowerPoint & Google Slides
Charts
Free
Color-Coded Startup Org Chart Slide for PowerPoint & Google Slides
Org Chart
Stacked Area Chart with Financial Highlights for PowerPoint & Google Slides
Finance
Annual Growth Trend Analysis Chart template for PowerPoint & Google Slides
Business Report
Professional Table of Organization Chart Template for PowerPoint & Google Slides
Org Chart
Hierarchical Org Chart Infographic Template for PowerPoint & Google Slides
Org Chart

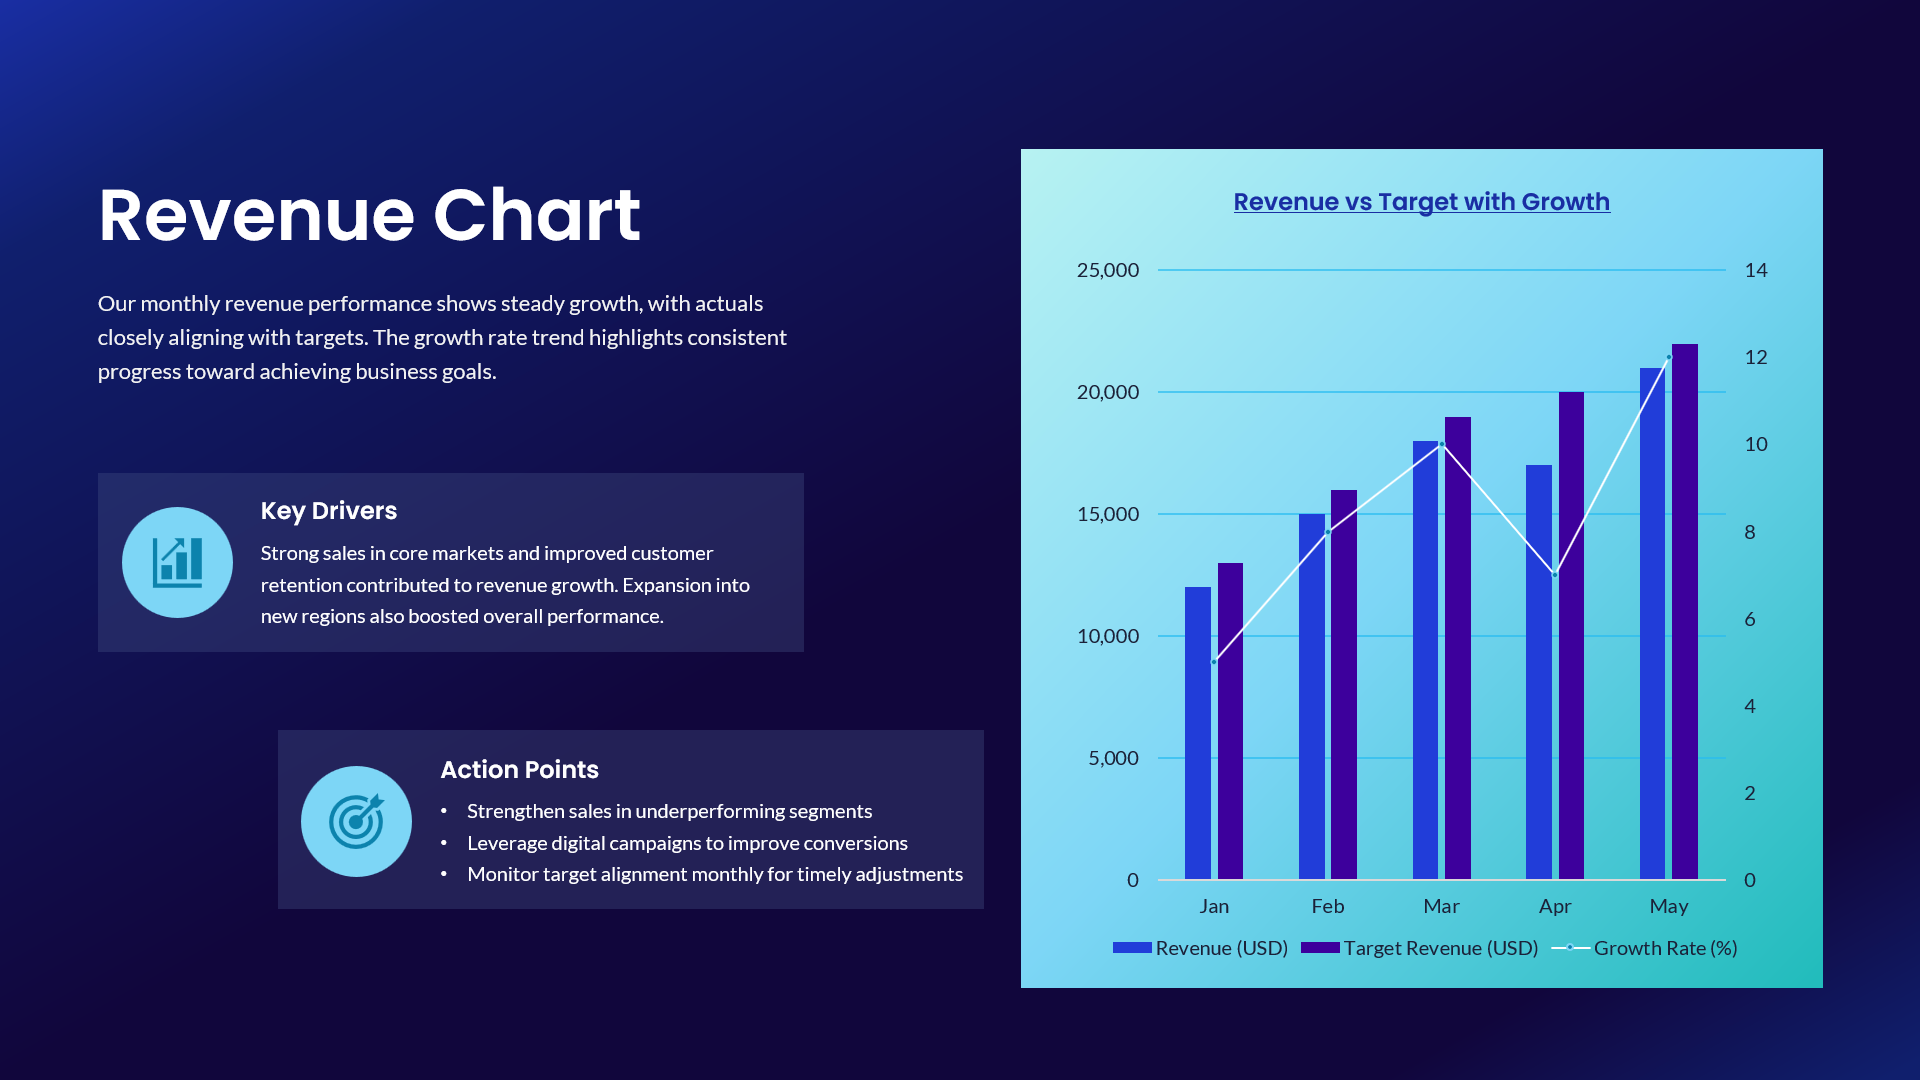
Revenue vs Target Growth Chart Template for PowerPoint & Google Slides
Revenue