Charts Presentation Templates for PowerPoint and Google Slides
![]() Filter
Filter
Filter
-

Statistics Infographic & KPI Bar Chart Template for PowerPoint & Google Slides
Bar/Column
-
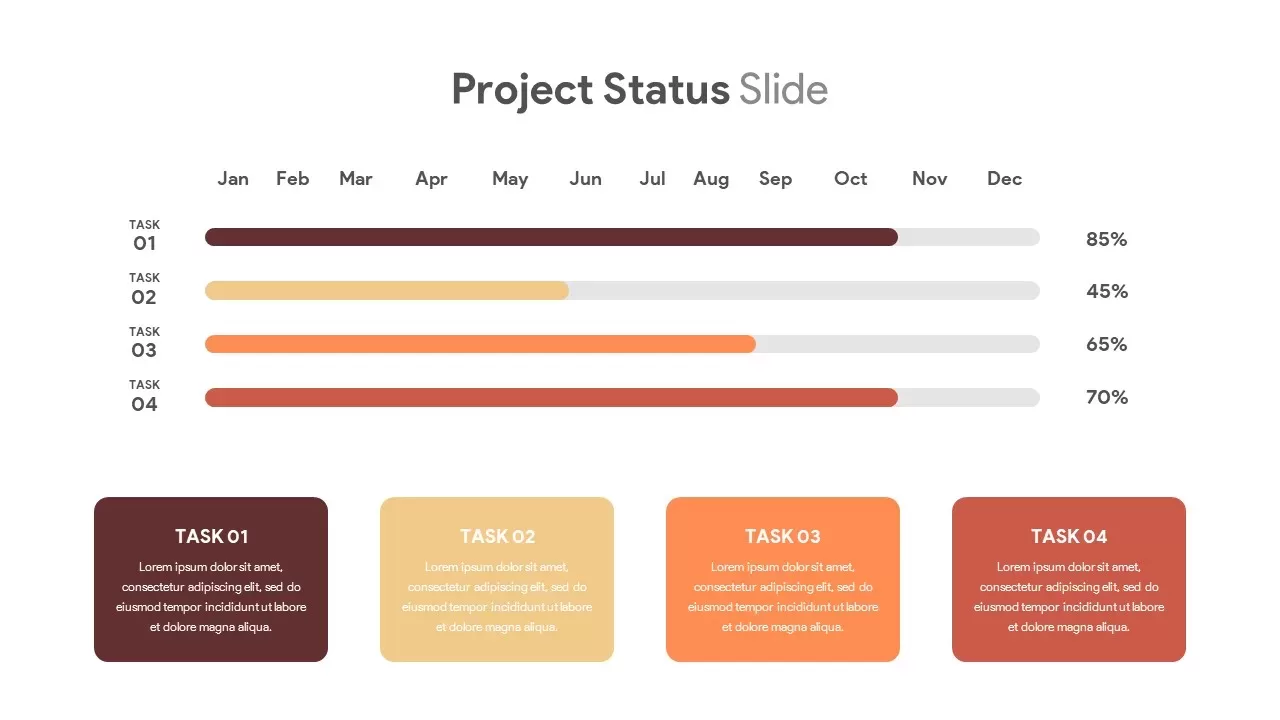
Horizontal Timeline Project Status Template for PowerPoint & Google Slides
Project Status
-

Circular Image Gallery & KPI Metrics Template for PowerPoint & Google Slides
Pie/Donut
-

Cost Reduction Strategy Donut Chart Template for PowerPoint & Google Slides
Pie/Donut
-

Heat Map Risk Matrix Dashboard Template for PowerPoint & Google Slides
Comparison Chart
-
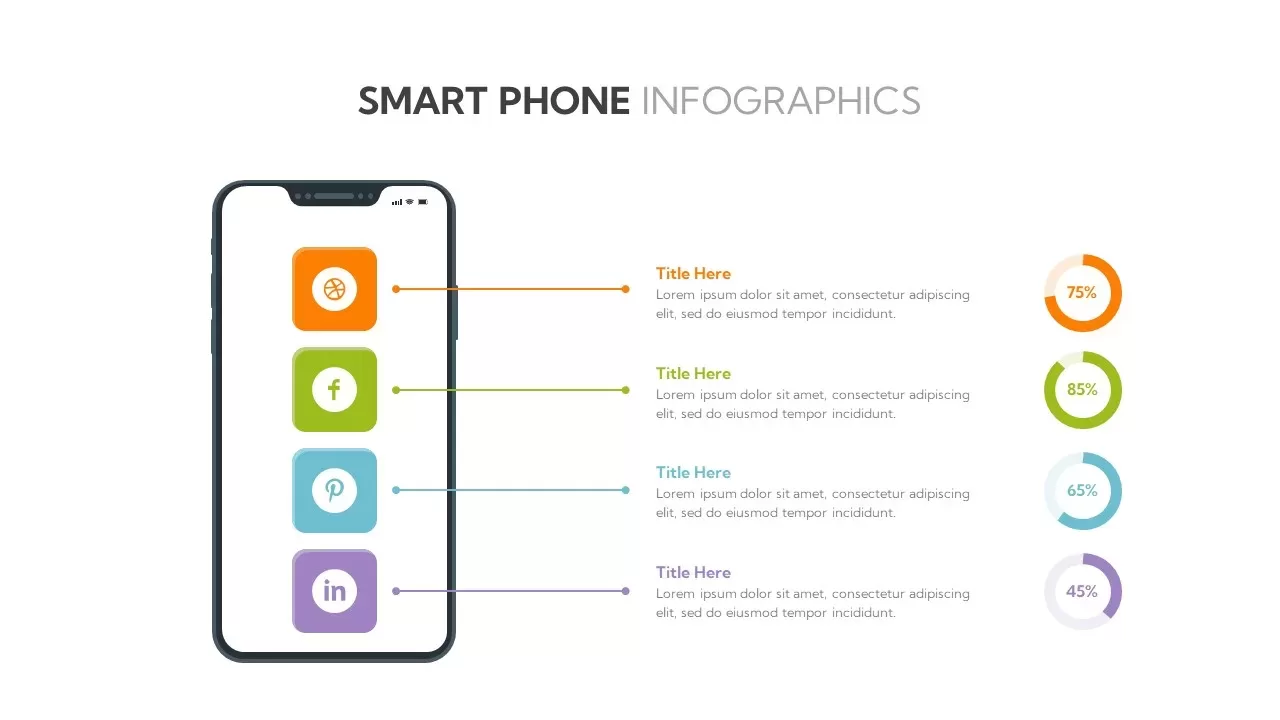
Social Media Smartphone Infographic Template for PowerPoint & Google Slides
Pie/Donut
-
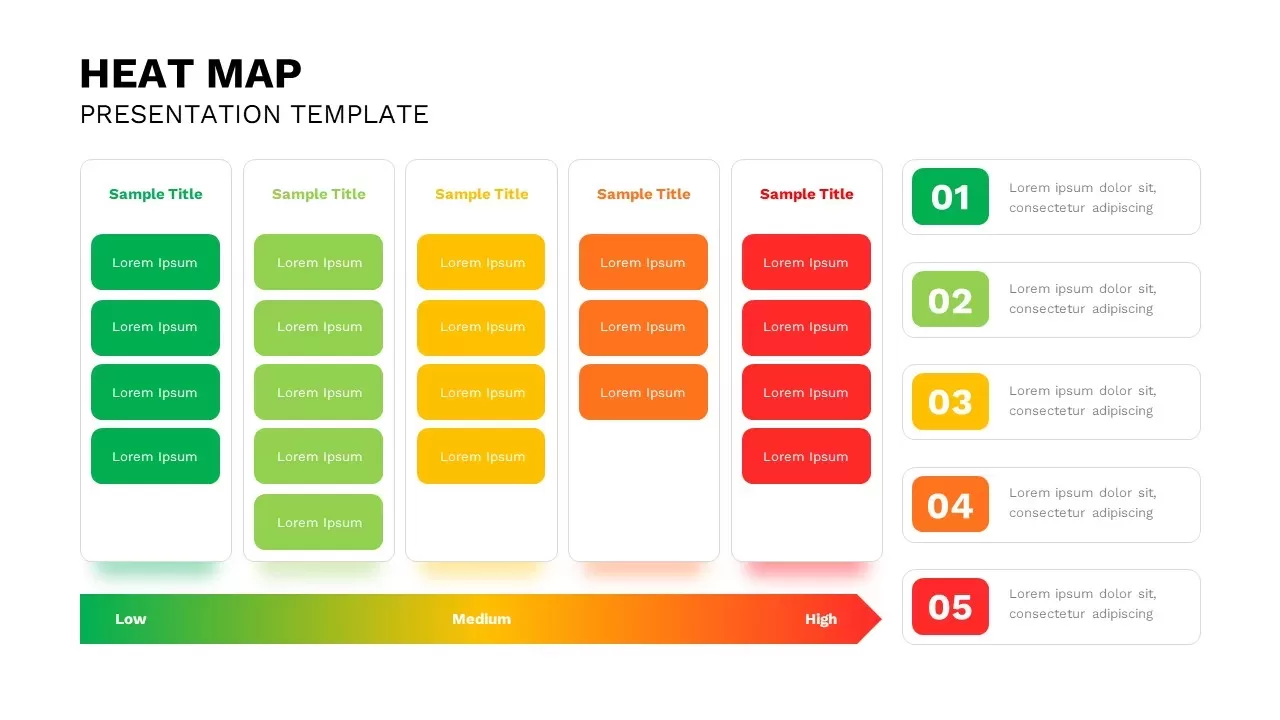
Interactive Heat Map Template for PowerPoint & Google Slides
Bar/Column
-

Professional Interactive Heat Map Matrix Template for PowerPoint & Google Slides
Comparison Chart
-
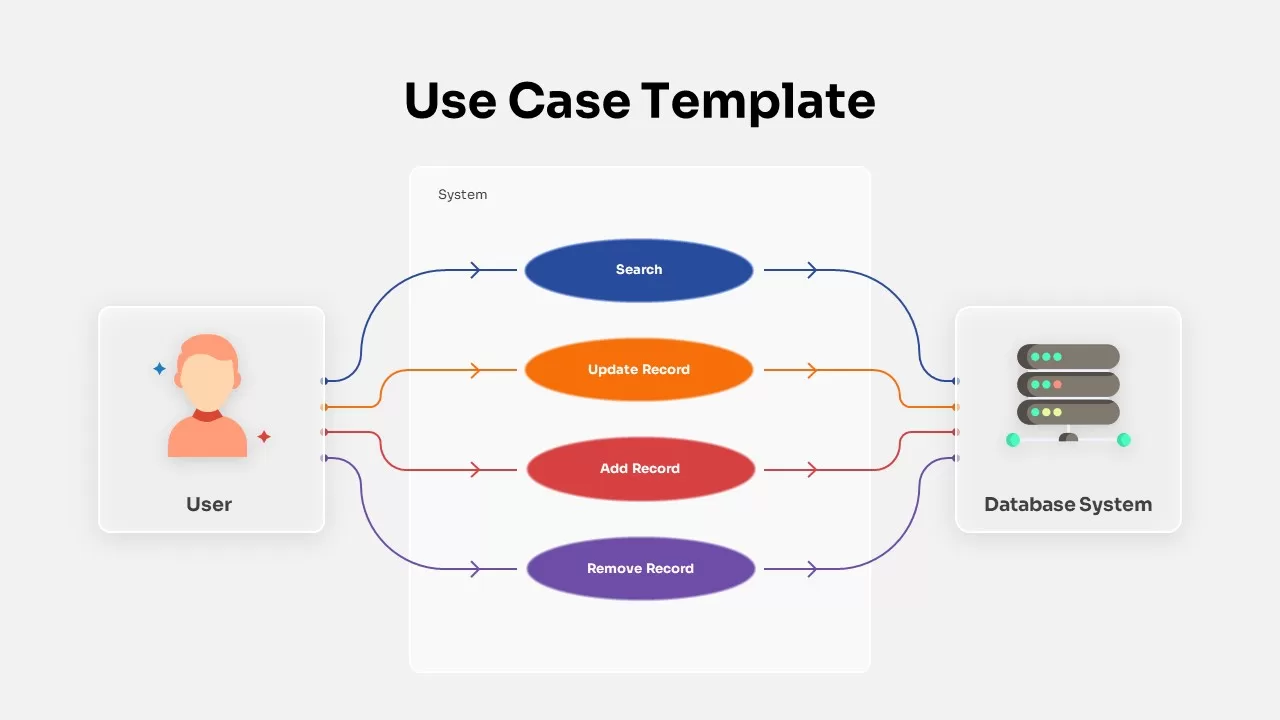
Use Case Diagram Template for PowerPoint & Google Slides
Flow Charts
-
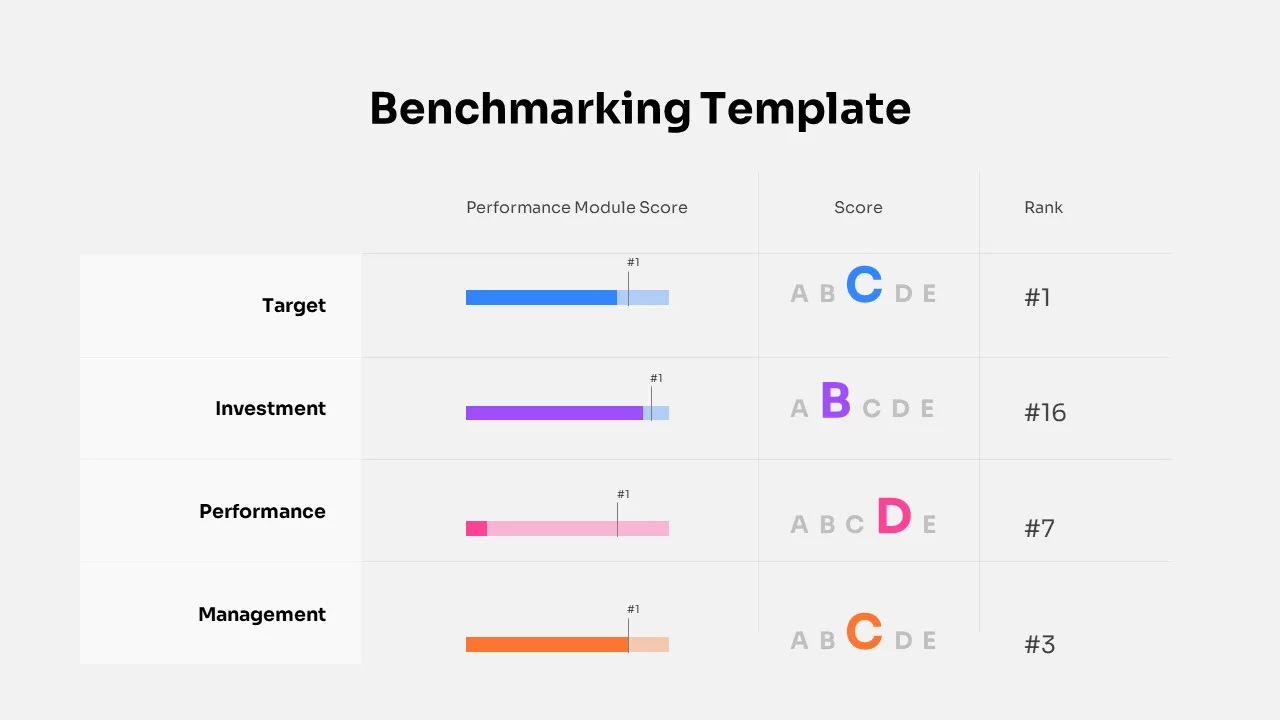
Benchmarking Performance Score Template for PowerPoint & Google Slides
Comparison Chart
-

Interactive Benchmarking Gauge Dashboard Template for PowerPoint & Google Slides
Pie/Donut
-
Benchmarking Metrics Comparison Slide Template for PowerPoint & Google Slides
Pie/Donut
-
Dynamic Benchmarking Comparison Chart Template for PowerPoint & Google Slides
Comparison Chart
-

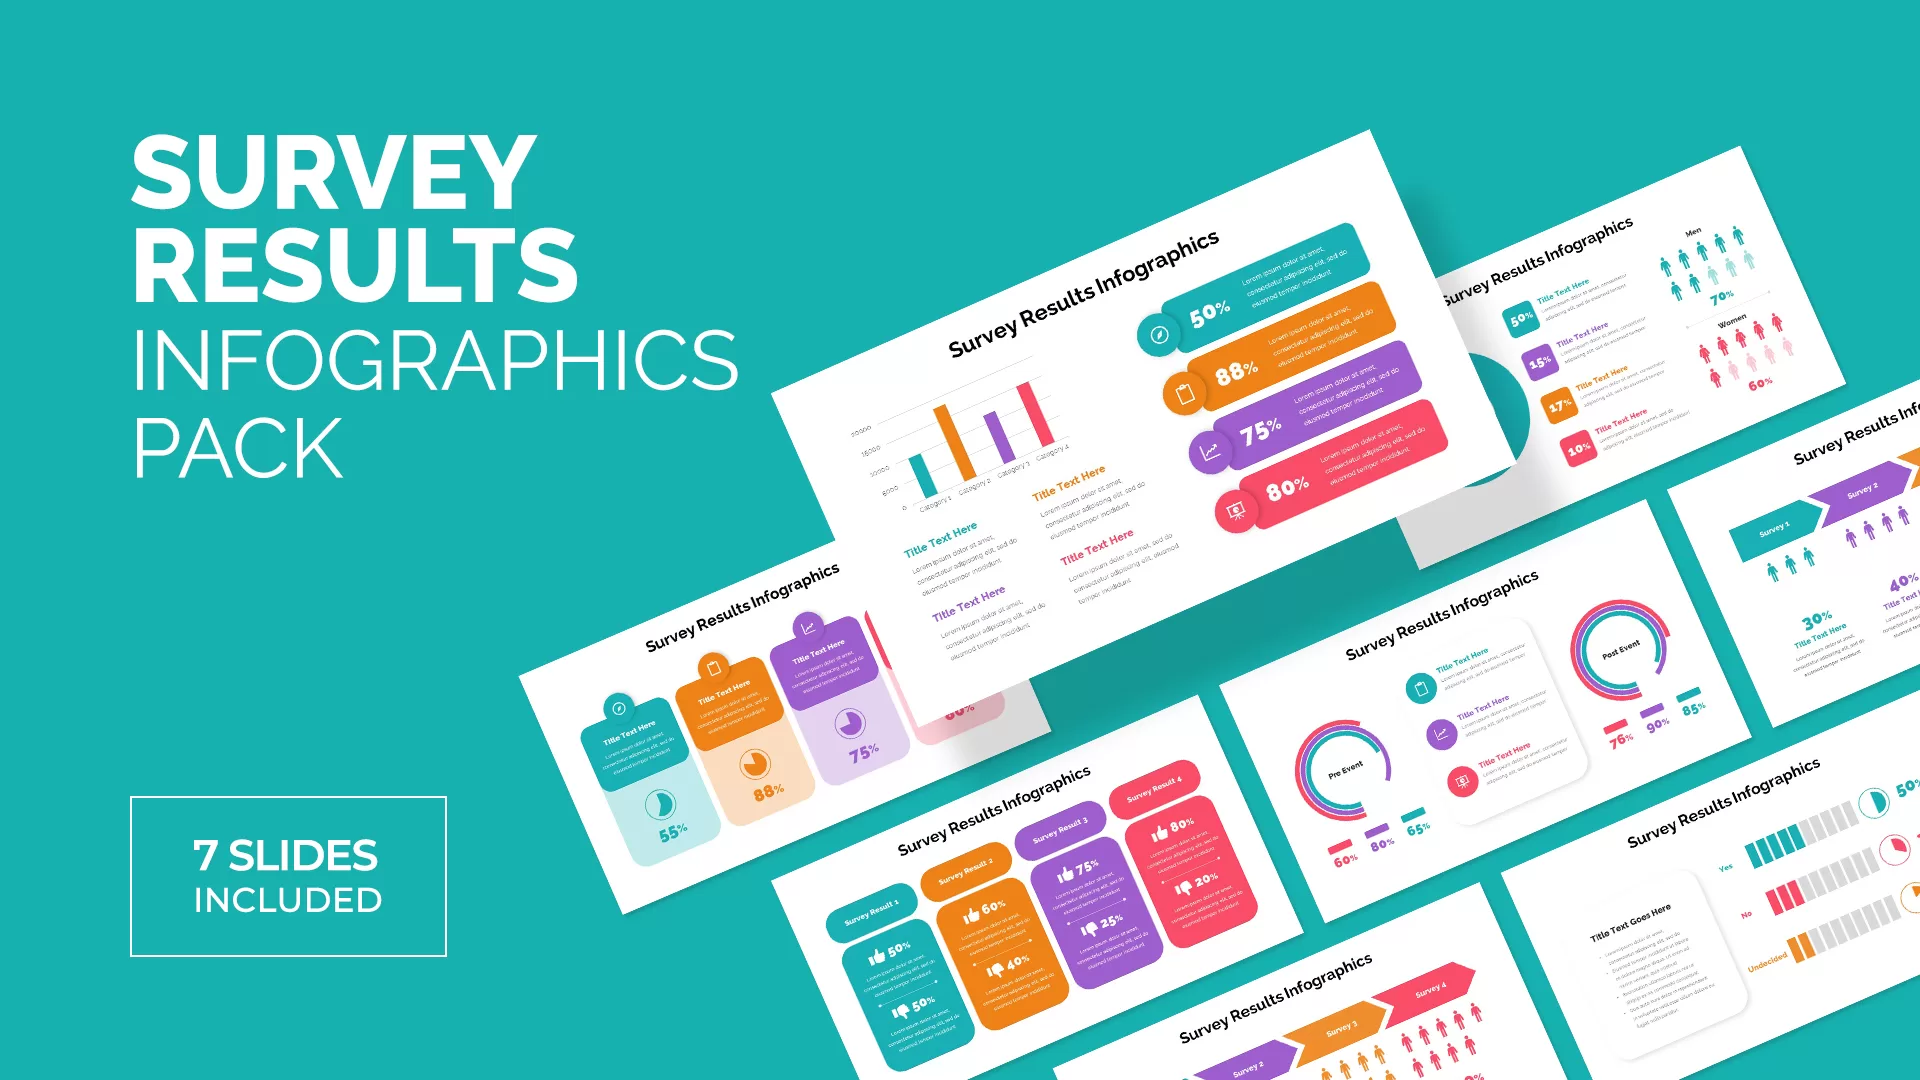
Survey Results Infographics for PowerPoint & Google Slides
Infographics
-
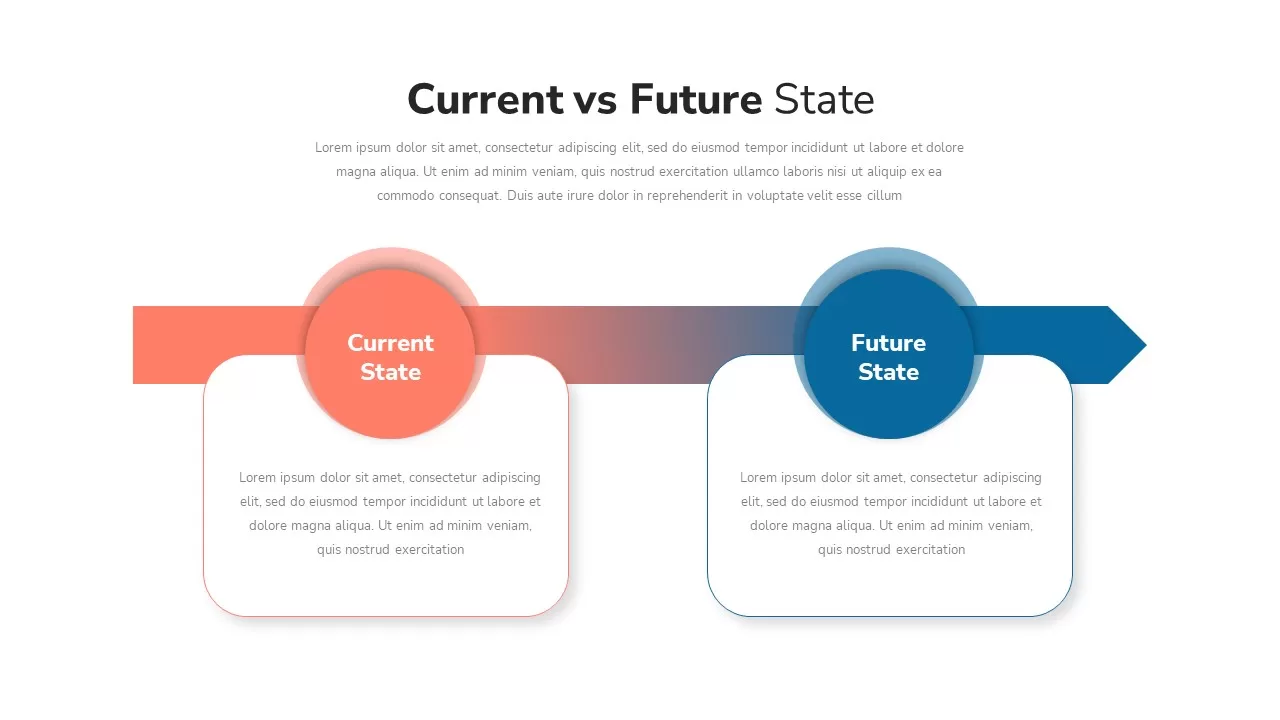
Current VS Future State PowerPoint Presentation Template
Comparison Chart
-
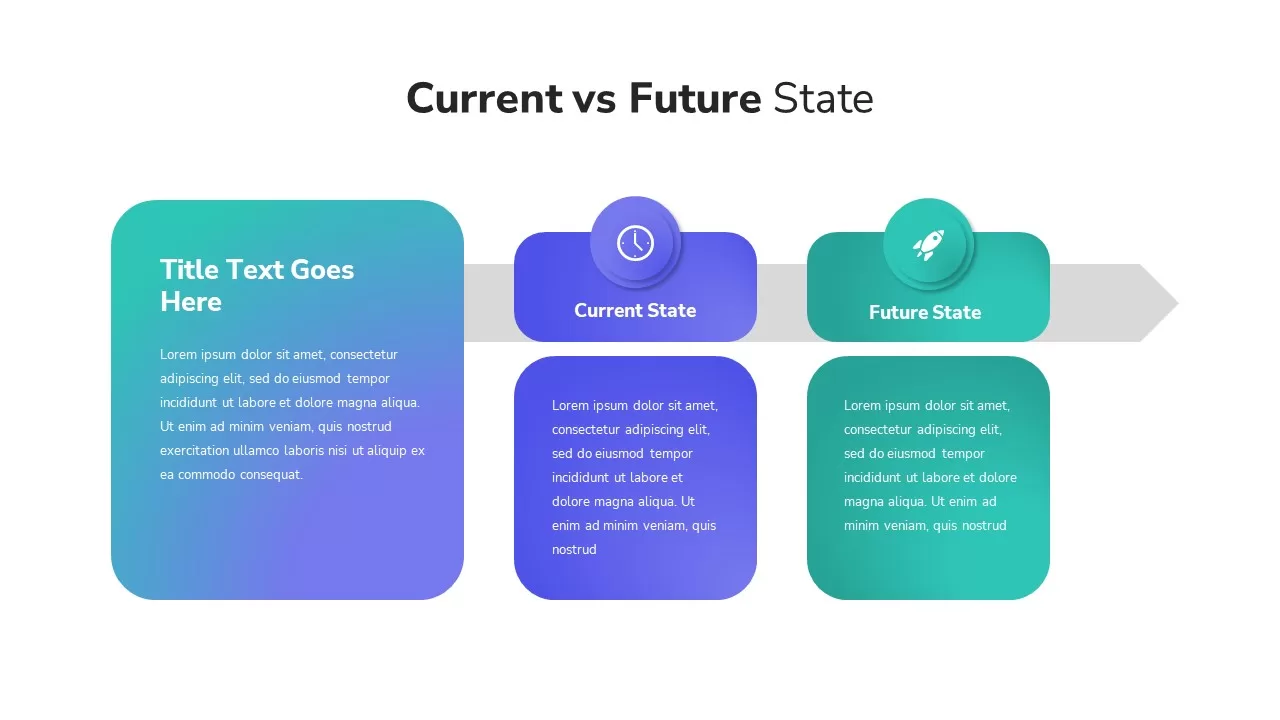
Current vs Future State Comparison Slide Template for PowerPoint & Google Slides
Comparison Chart
-
Current vs Future State Comparison Template for PowerPoint & Google Slides
Comparison Chart
-
KPI Dashboard Data Visualization Template for PowerPoint & Google Slides
Bar/Column
-
KPI Dashboard Data Overview Slide Template for PowerPoint & Google Slides
Bar/Column
-
Current vs Future State Comparison Slide Template for PowerPoint & Google Slides
Comparison Chart
-
KPI Dashboard template for PowerPoint & Google Slides
Business Report
-
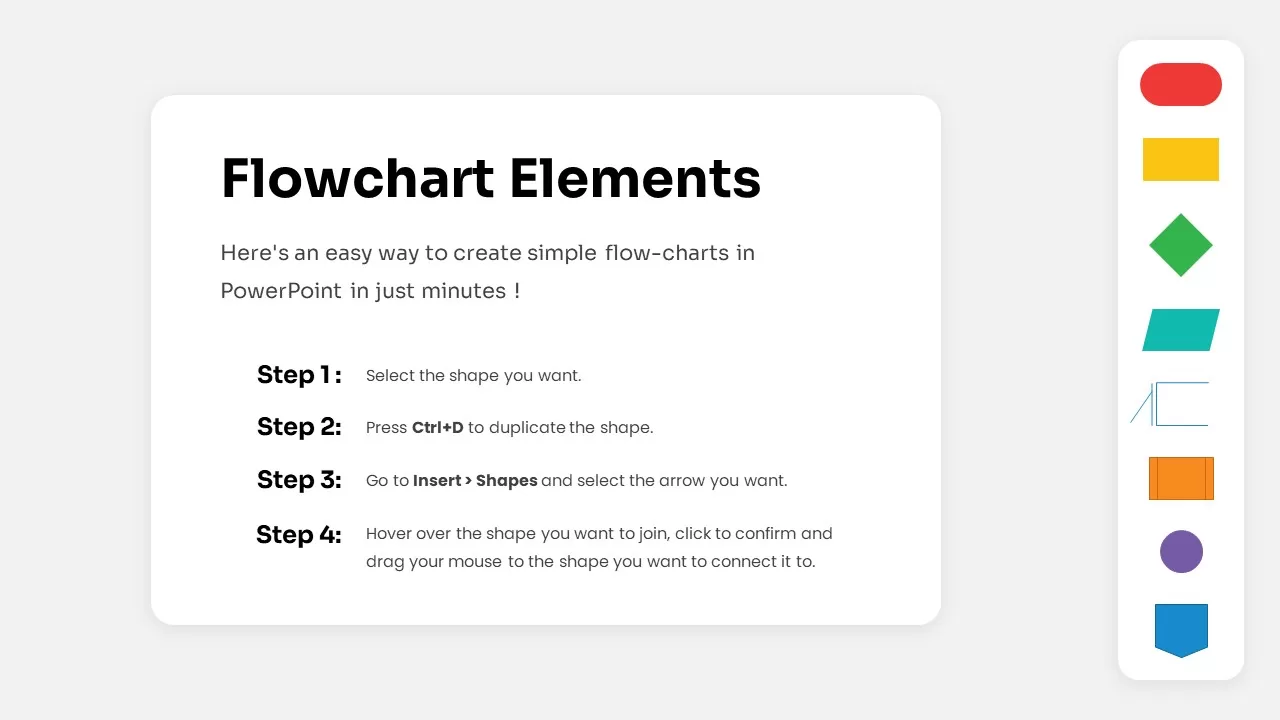
Free Flowchart Elements Tutorial Slide Template for PowerPoint & Google Slides
Flow Charts
Free
-
Bull and Bear Stock Market Dashboard Template for PowerPoint & Google Slides
Infographics
-
Free Circular Multi-Step Flow Chart Diagram Template for PowerPoint & Google Slides
Flow Charts
Free
-
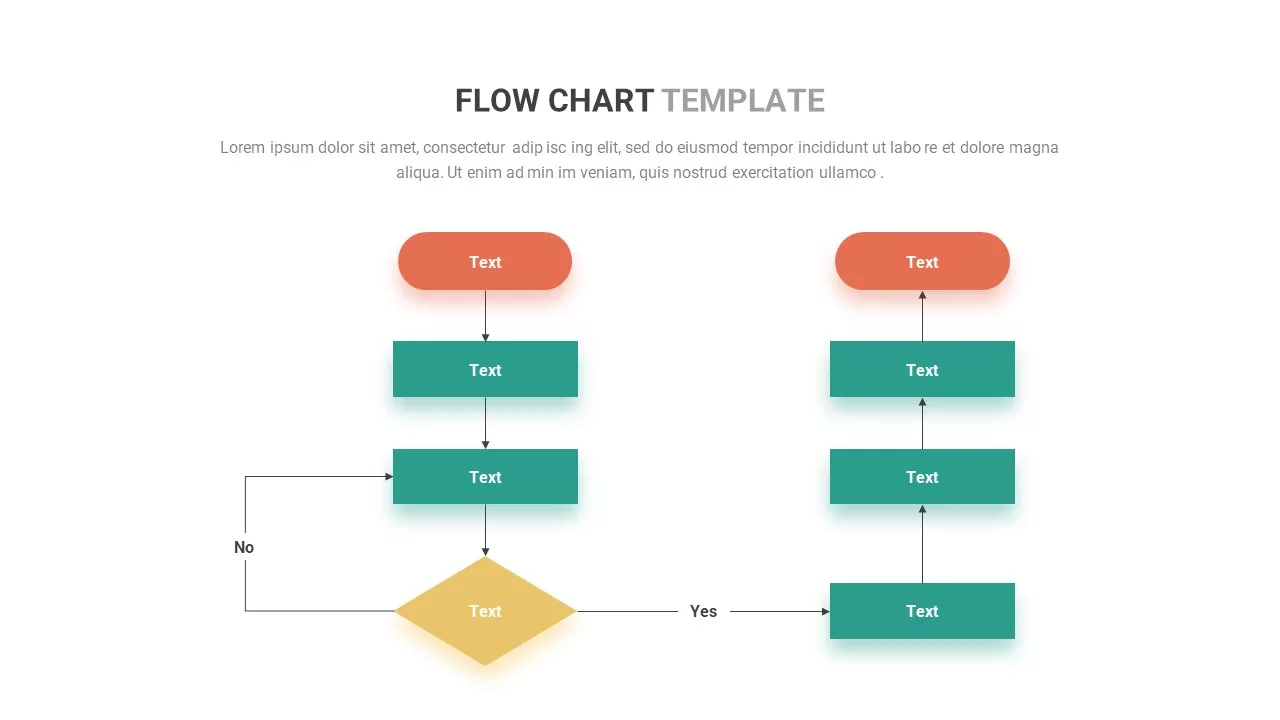
Flow Chart template for PowerPoint & Google Slides
Flow Charts
-
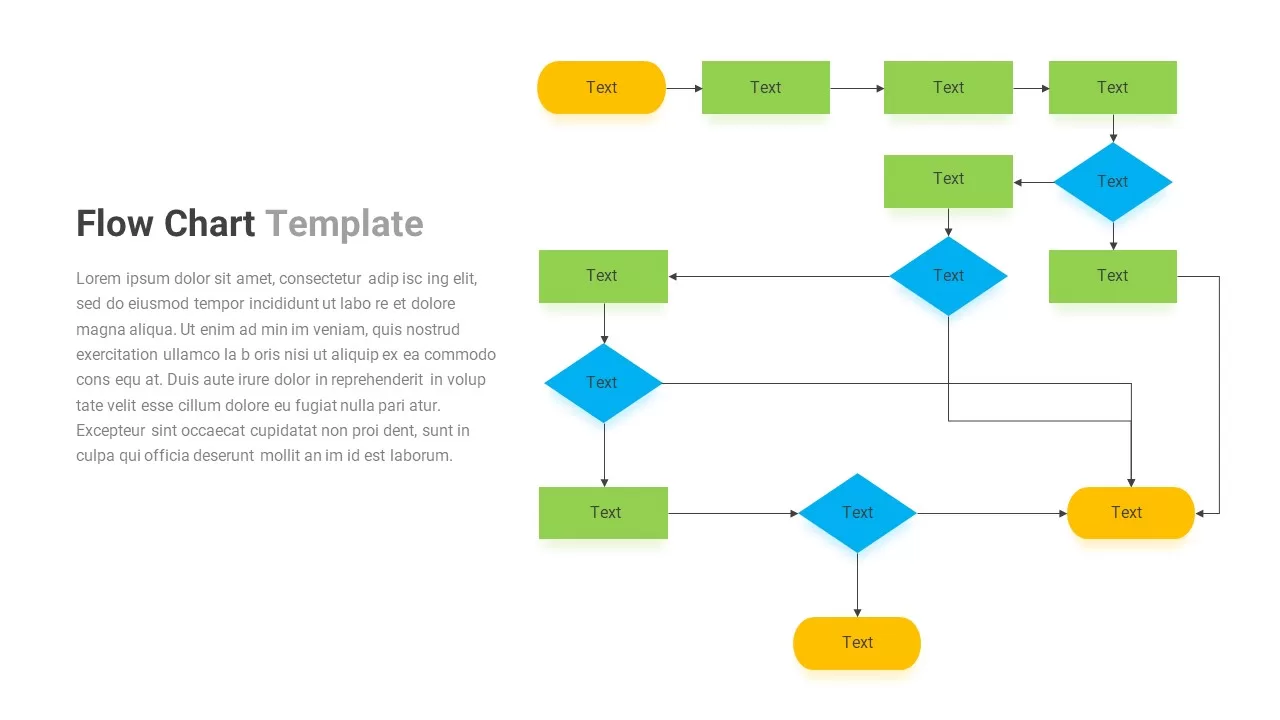
Flow Chart template for PowerPoint & Google Slides
Flow Charts
-

Free Simple Venn Diagram Overview template for PowerPoint & Google Slides
Comparison Chart
Free
-
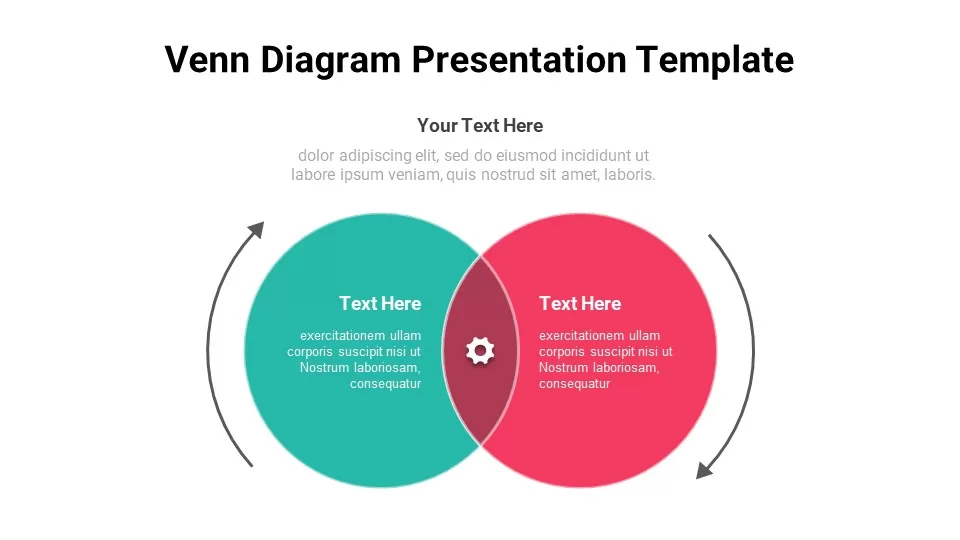
Free Venn Diagram template for PowerPoint & Google Slides
Charts
Free
-
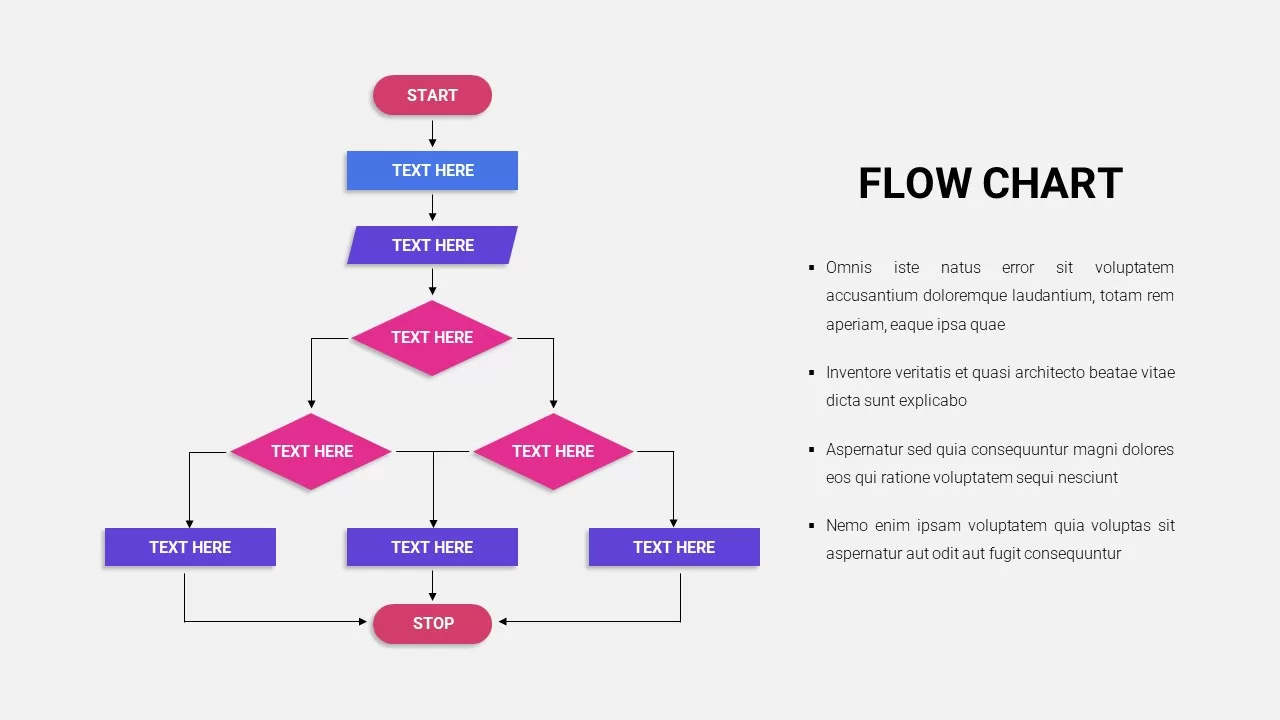
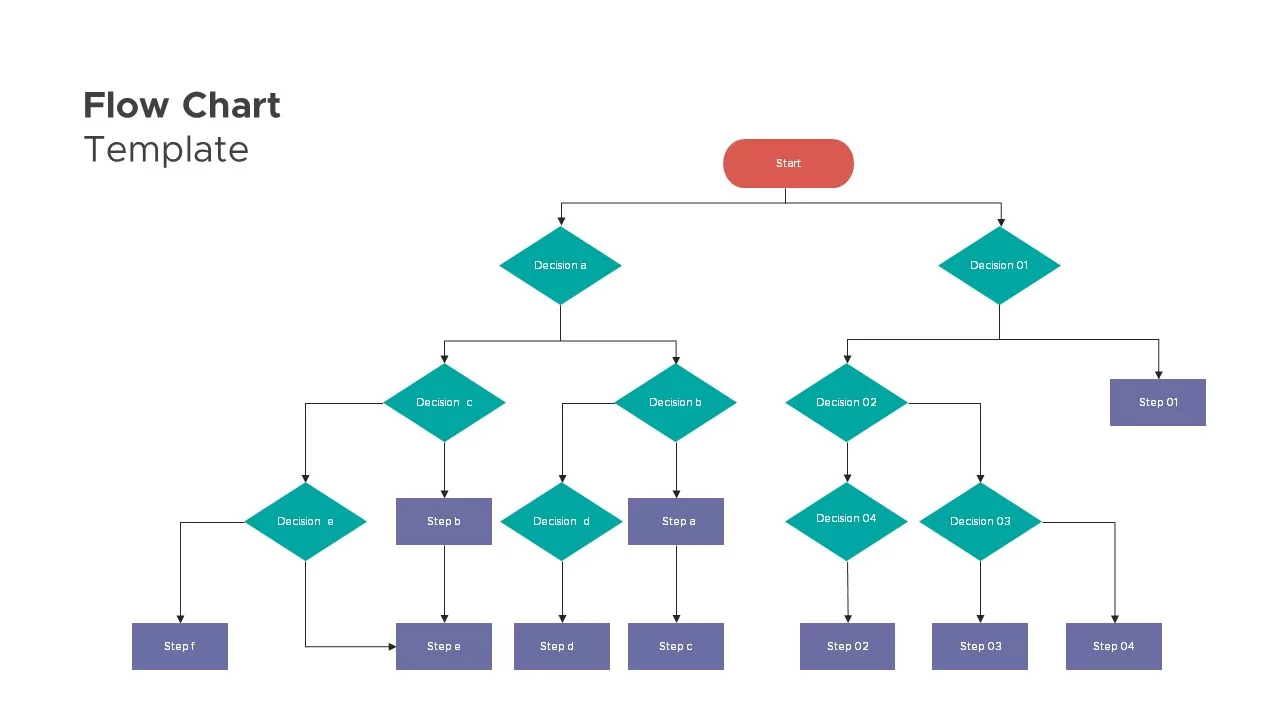
Flow Chart Template for PowerPoint & Google Slides
Flow Charts
-
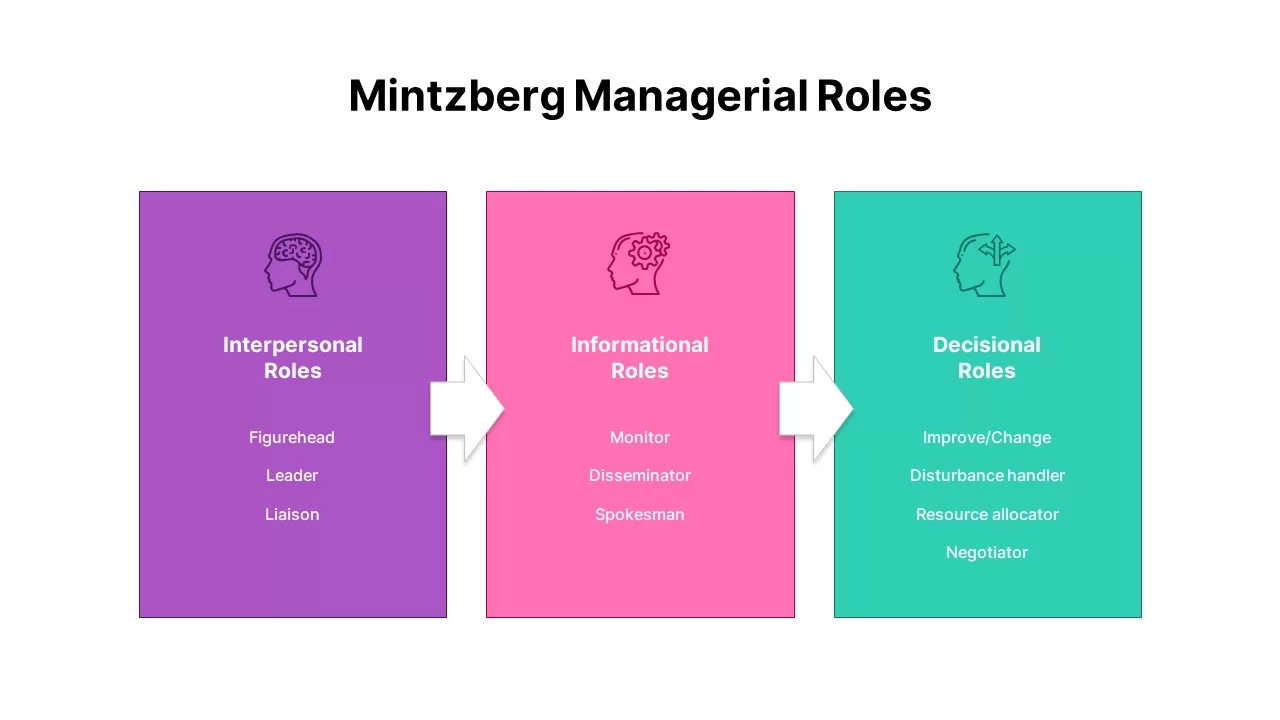
Mintzberg Managerial Roles Infographic Template for PowerPoint & Google Slides
Comparison Chart
-
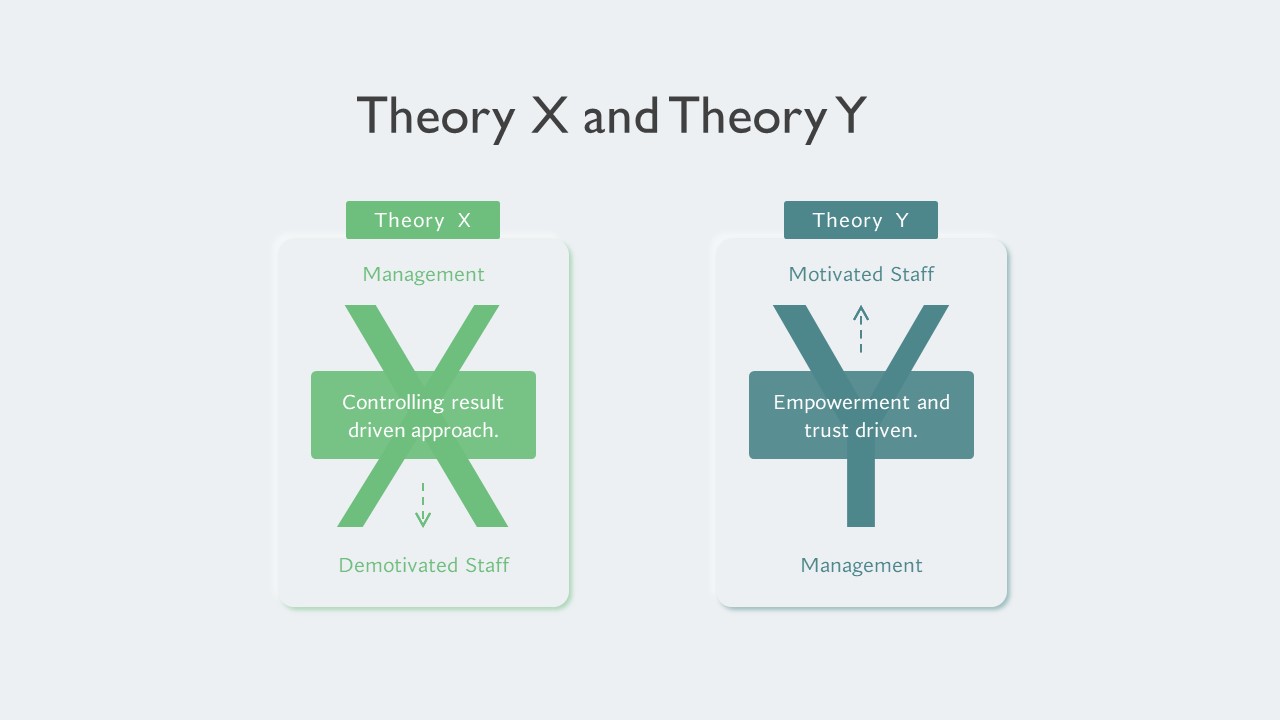
McGregor’s Theory X and Theory Y infographic Template for PowerPoint & Google Slides
Business Strategy
-
Flow Chart Decision Tree Template for PowerPoint & Google Slides
Flow Charts
-
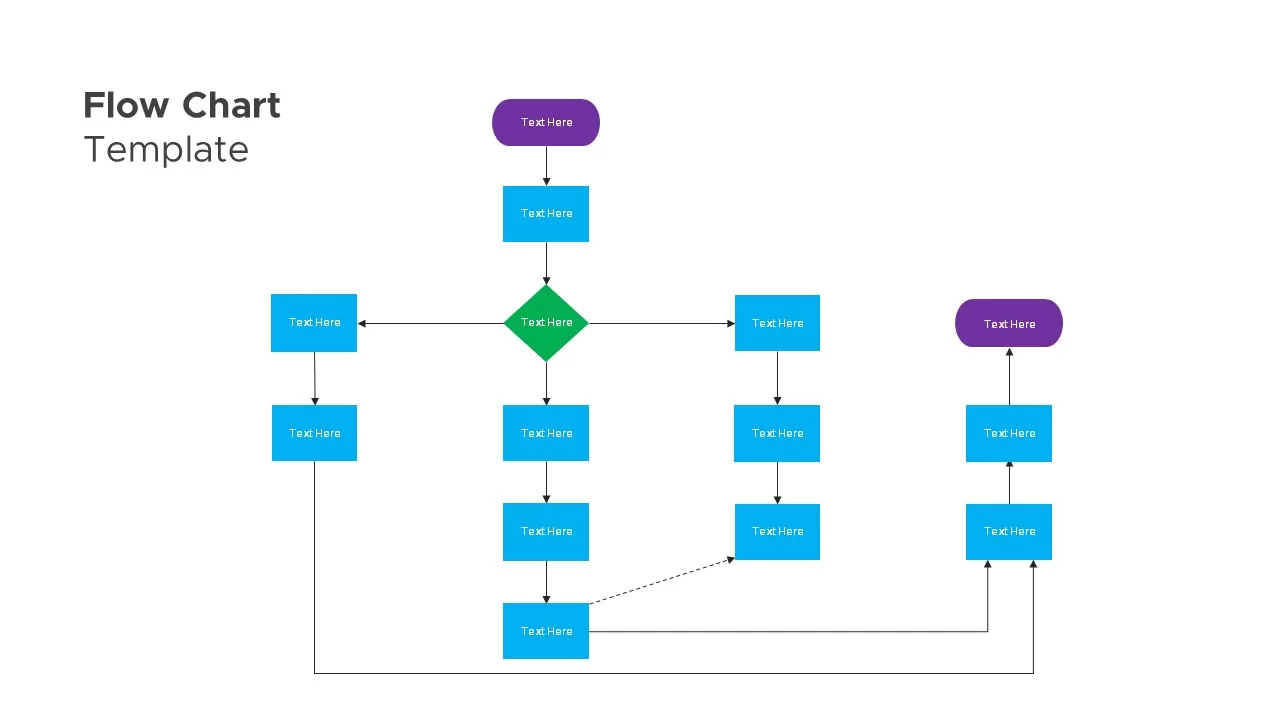
Flow Chart Template for PowerPoint & Google Slides
Flow Charts
-
Flow Chart Template for PowerPoint & Google Slides
Flow Charts
-
Flow Chart Diagram template for PowerPoint & Google Slides
Flow Charts