Charts Presentation Templates for PowerPoint and Google Slides
![]() Filter
Filter
Filter
-

Free Editable Simple Column Chart Slide Template for PowerPoint & Google Slides
Bar/Column
Free
-

Free Stacked Column Chart Data Visualization Template for PowerPoint & Google Slides
Bar/Column
Free
-

Simple Flowchart Process Diagram Template for PowerPoint & Google Slides
Flow Charts
-

Waffle Chart Data Visualization Template for PowerPoint & Google Slides
Comparison Chart
-

Employee Satisfaction Survey Dashboard Template for PowerPoint & Google Slides
Employee Performance
-
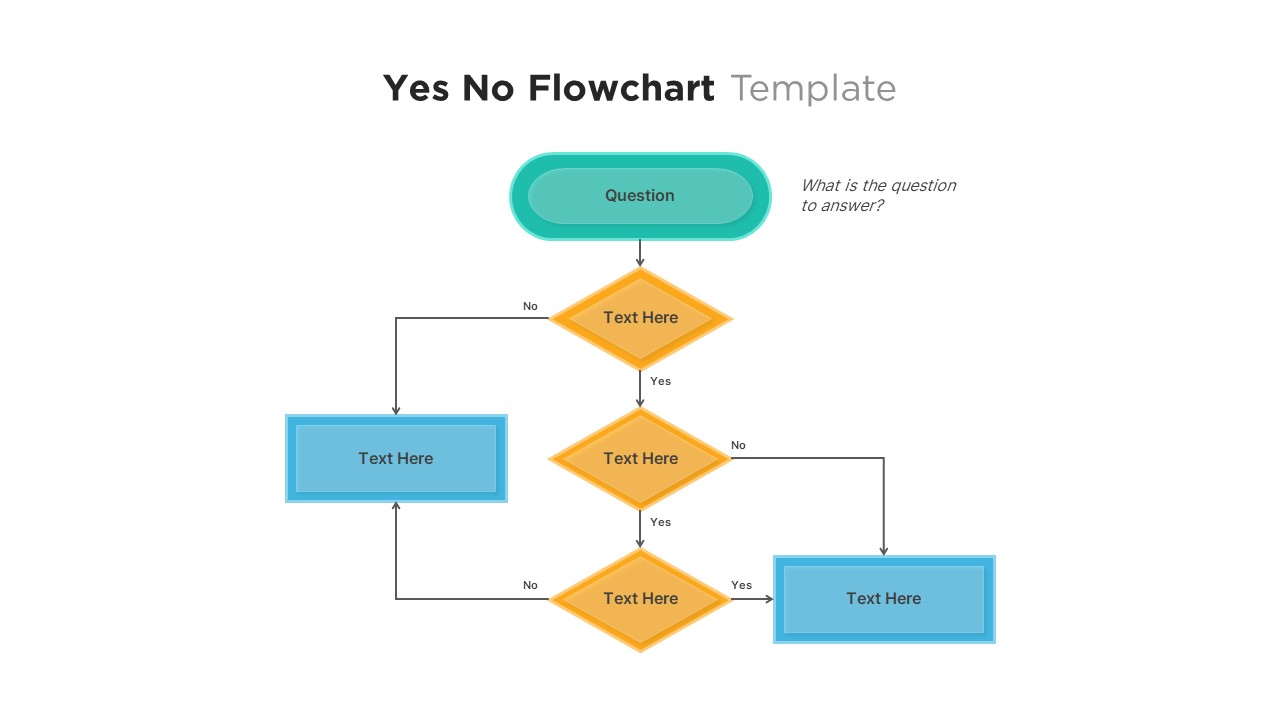
Professional Yes No Decision Flowchart Template for PowerPoint & Google Slides
Flow Charts
-
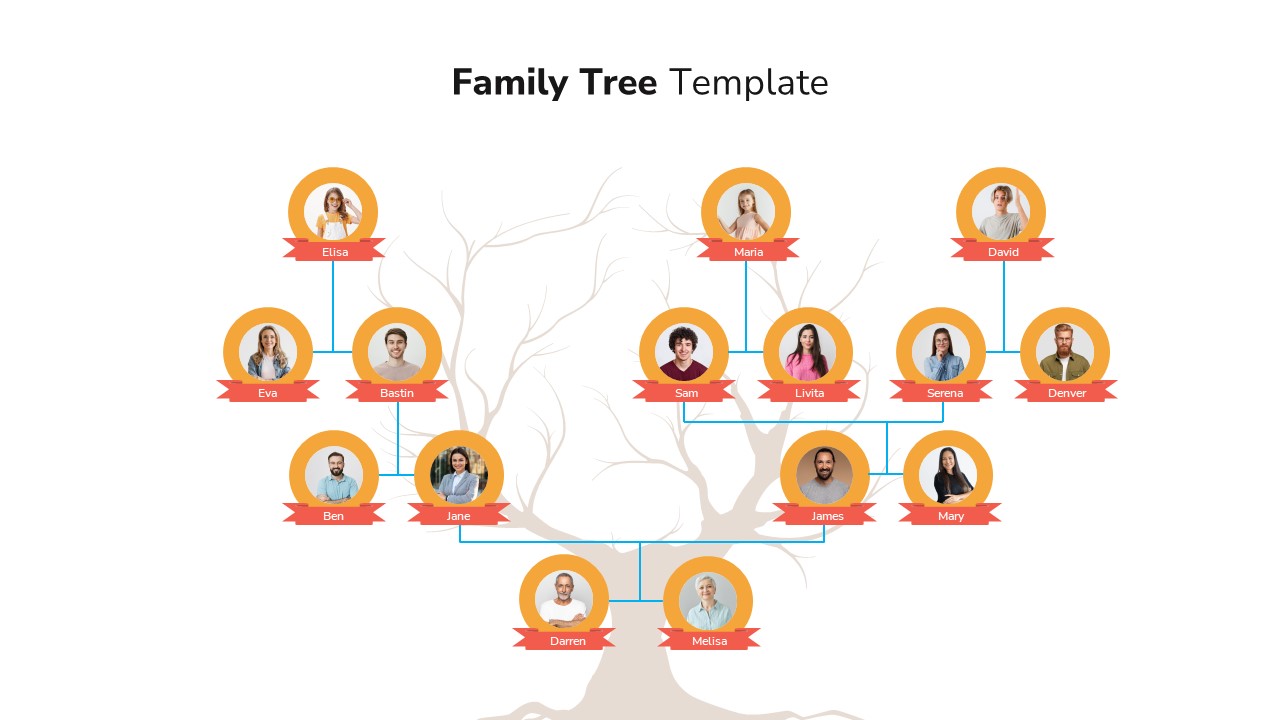
Classic Family Tree Diagram Layout Template for PowerPoint & Google Slides
Infographics
-

Comprehensive Hiring Process Flow Chart Template for PowerPoint & Google Slides
Flow Charts
-
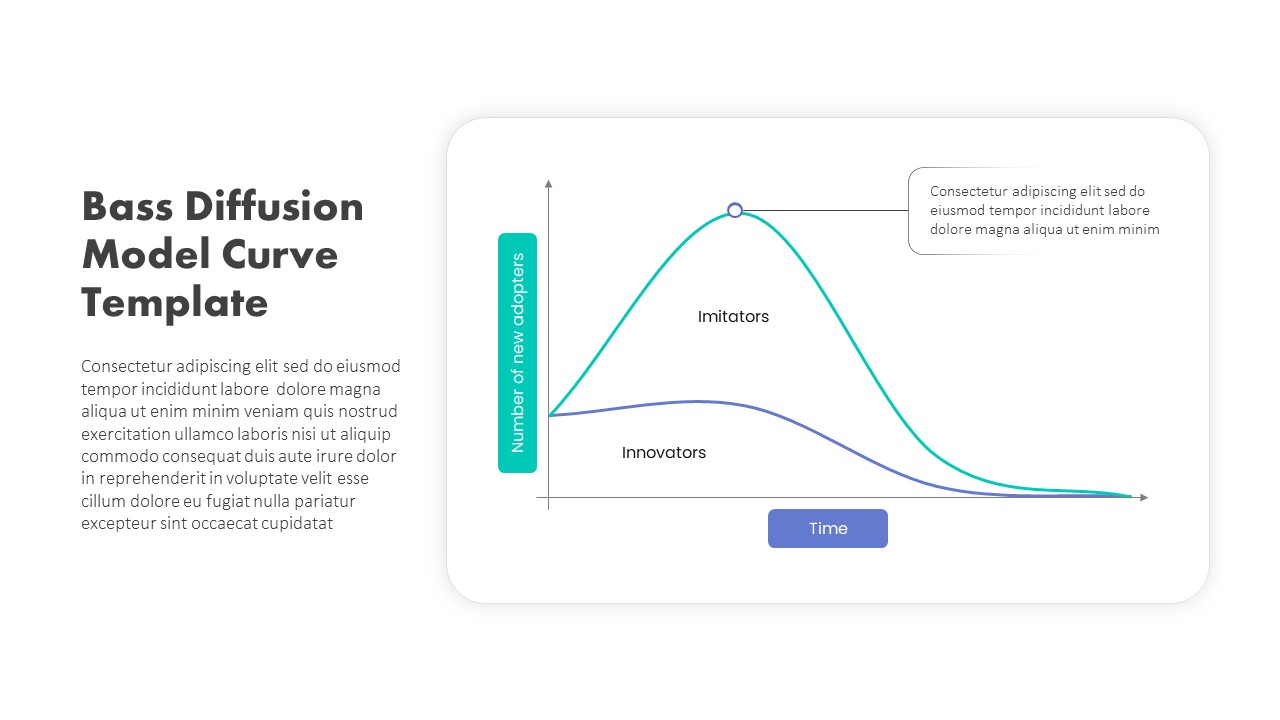
Bass Diffusion Model Curve for Adoption Template for PowerPoint & Google Slides
Comparison Chart
-
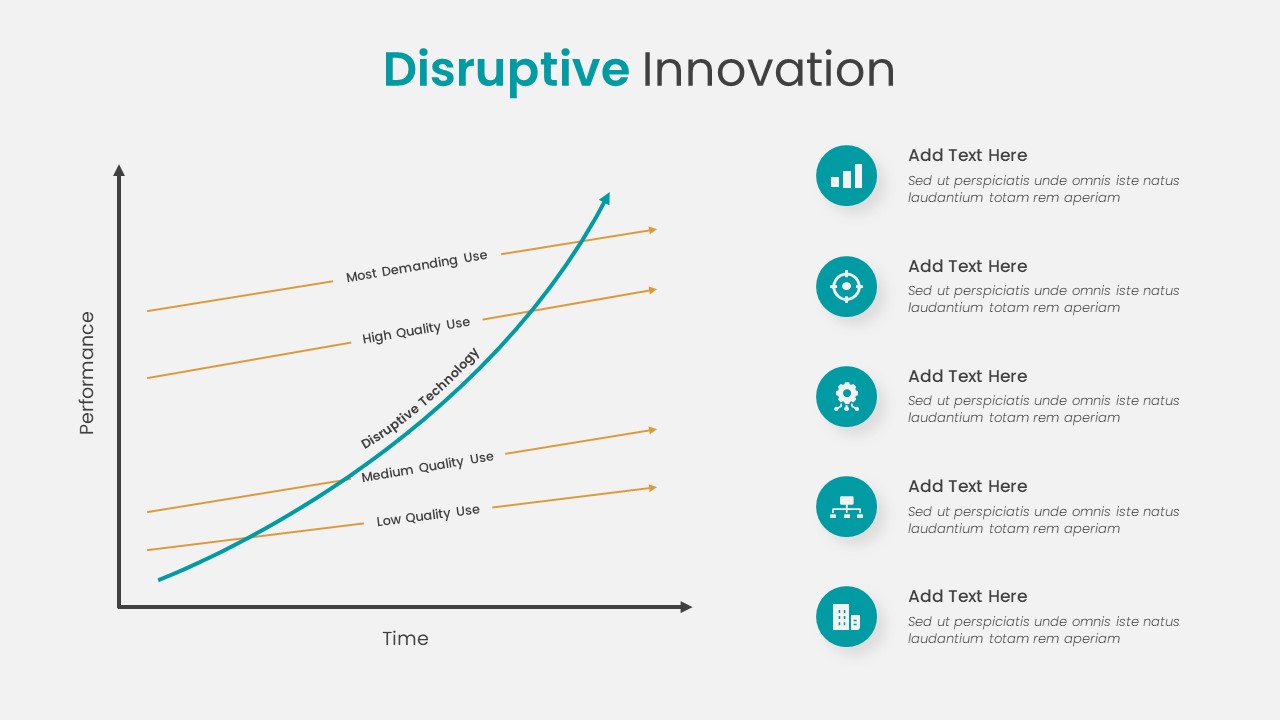
Disruptive Innovation Framework Diagram Template for PowerPoint & Google Slides
Comparison Chart
-

MABA Attractiveness Matrix Chart Template for PowerPoint & Google Slides
Comparison Chart
-
Annual Recurring Revenue Metrics Template for PowerPoint & Google Slides
Bar/Column
-
Monthly Recurring Revenue KPI Bar Chart Template for PowerPoint & Google Slides
Bar/Column
-
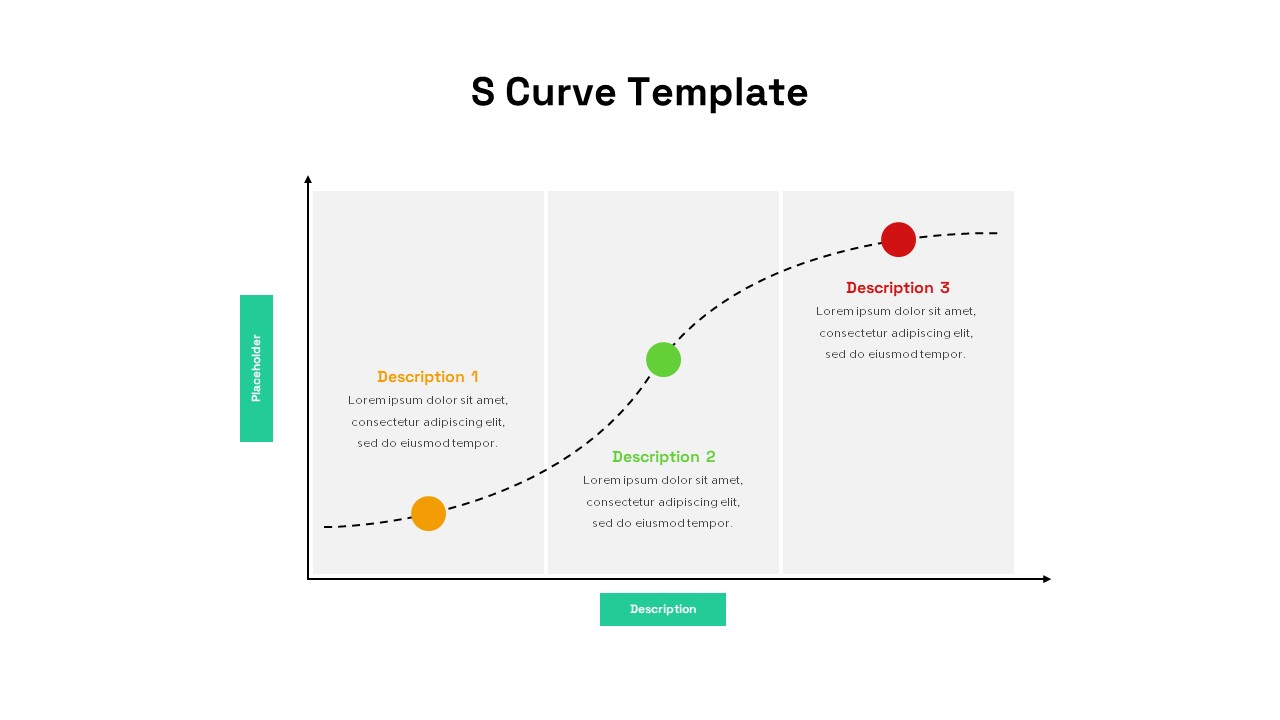
S-Curve Progression Framework Diagram Template for PowerPoint & Google Slides
Charts
-
8-Bell Curve Infographic Slide Template for PowerPoint & Google Slides
Comparison Chart
-
Multi-Series Stacked Bar Chart Template for PowerPoint & Google Slides
Bar/Column
-
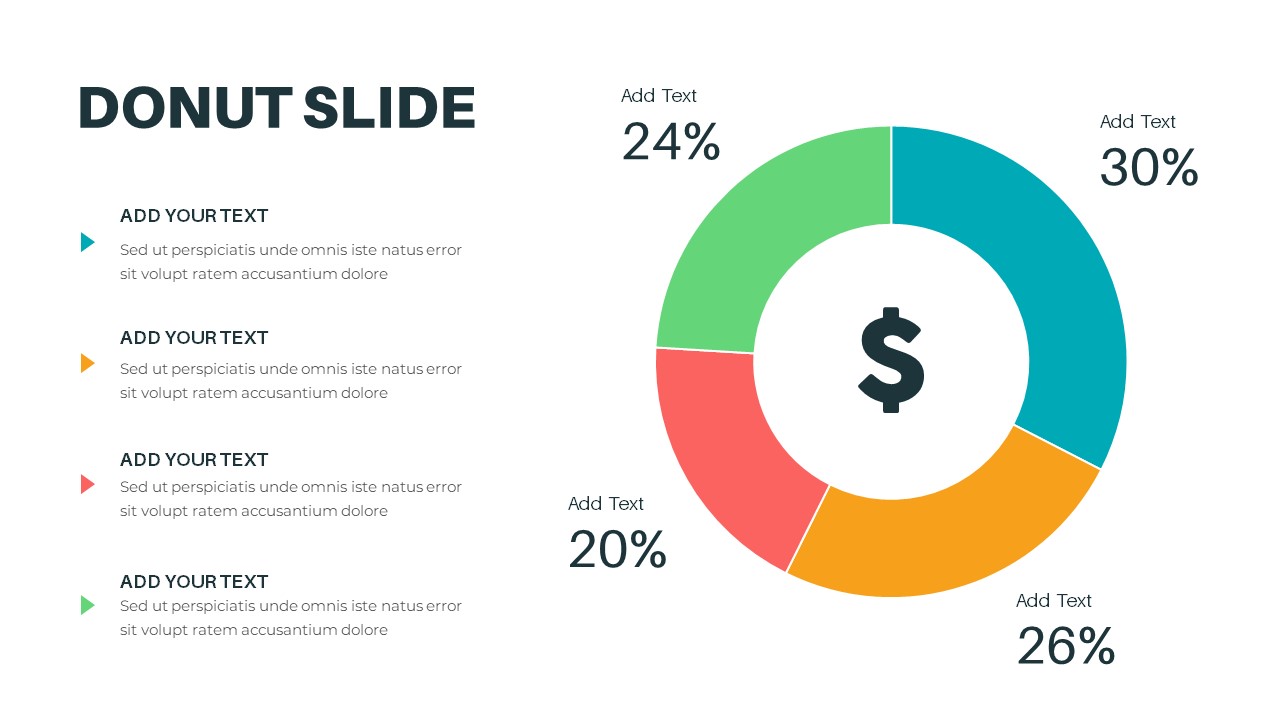
Donut Chart for PowerPoint & Google Slides
Pie/Donut
-
100% Stacked Bar Chart for PowerPoint & Google Slides
Bar/Column
-
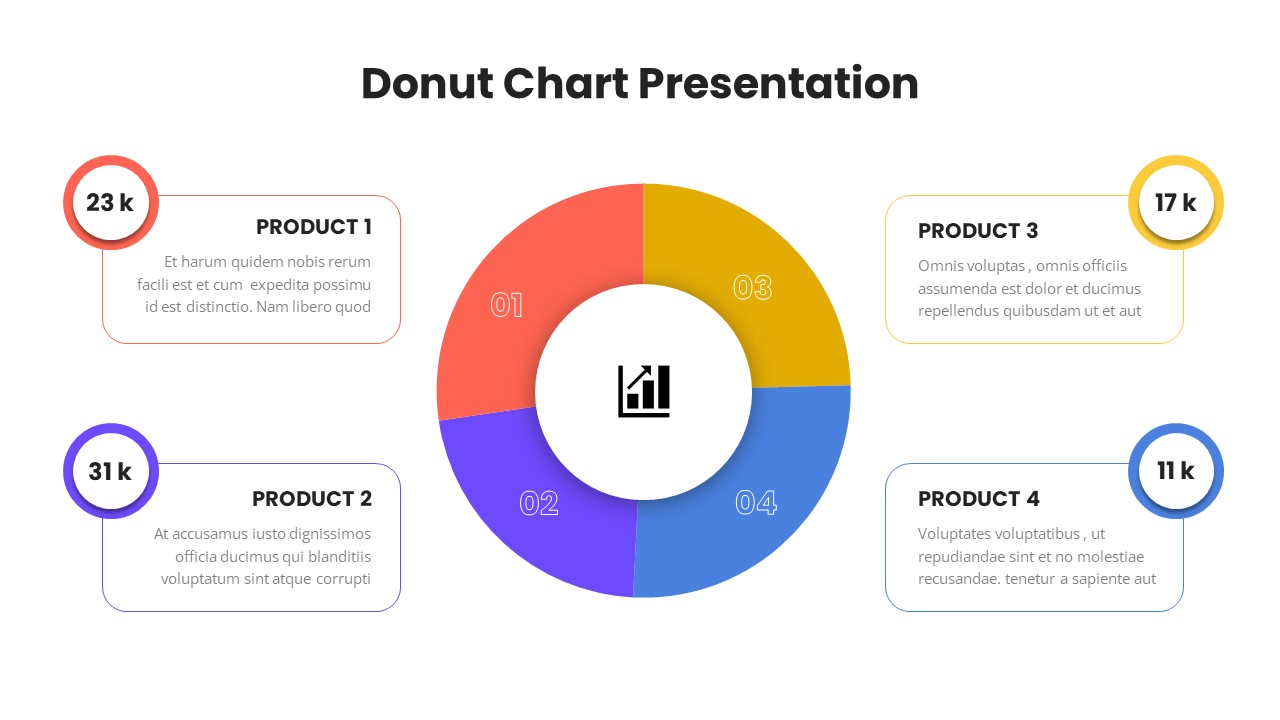
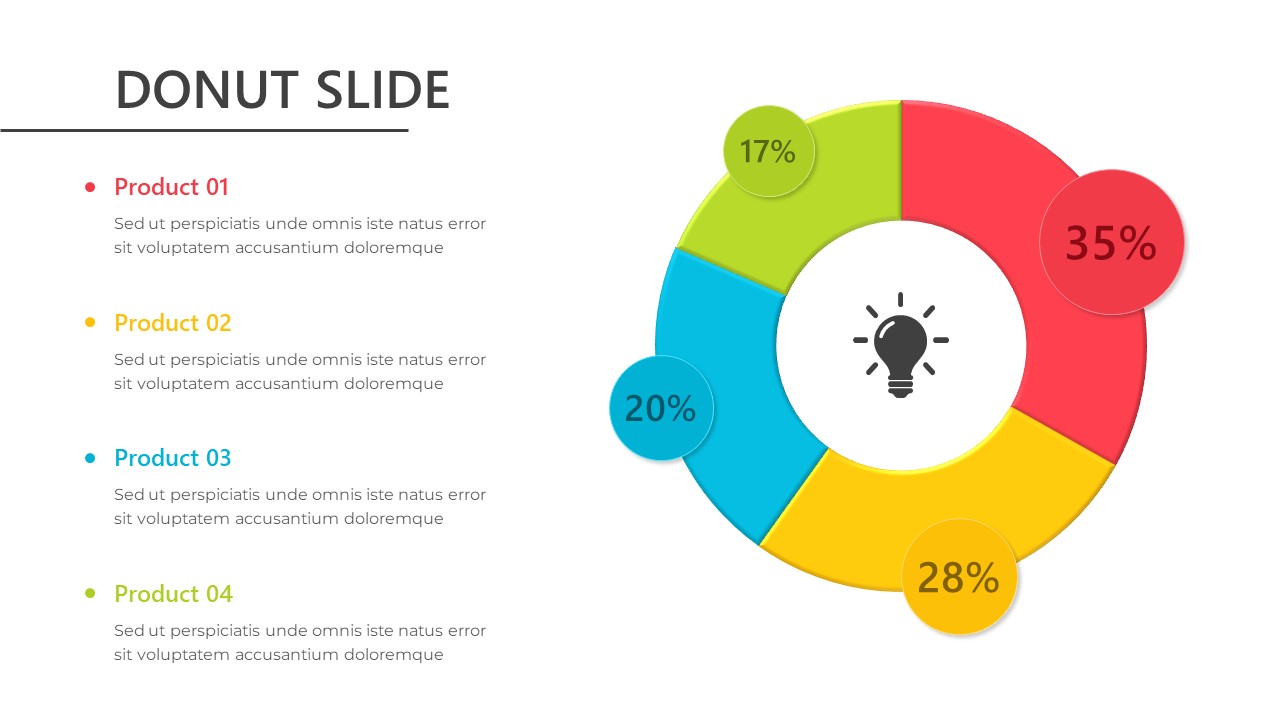
Donut Chart Presentation for PowerPoint & Google Slides
Pie/Donut
-
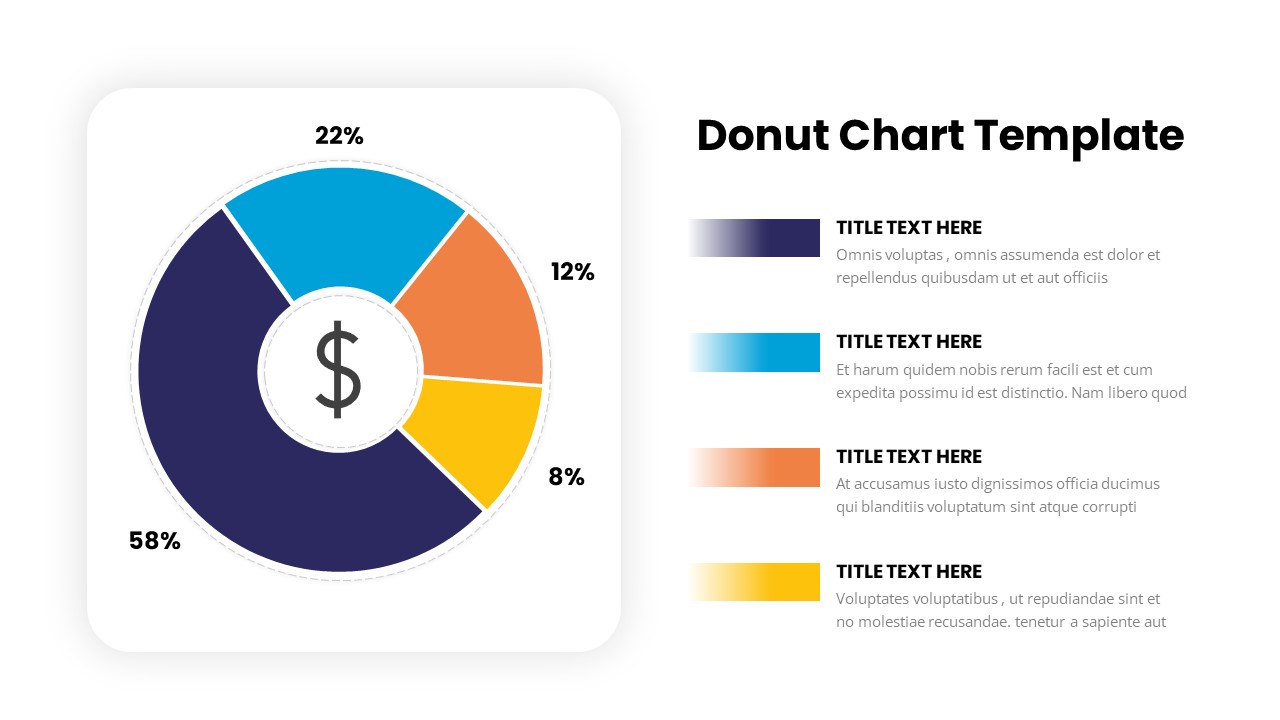
Donut Chart for PowerPoint & Google Slides
Pie/Donut
-
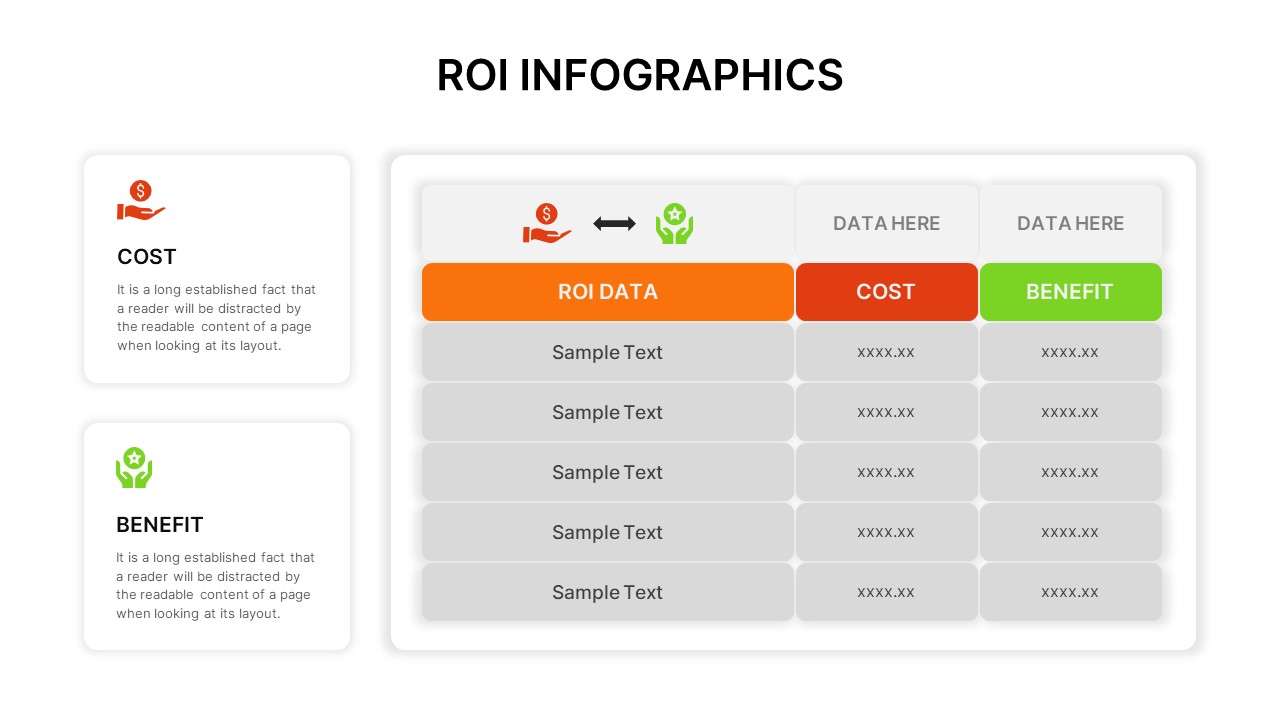
ROI Infographic for PowerPoint & Google Slides
Business Report
-
Donut Chart for PowerPoint & Google Slides
Pie/Donut
-
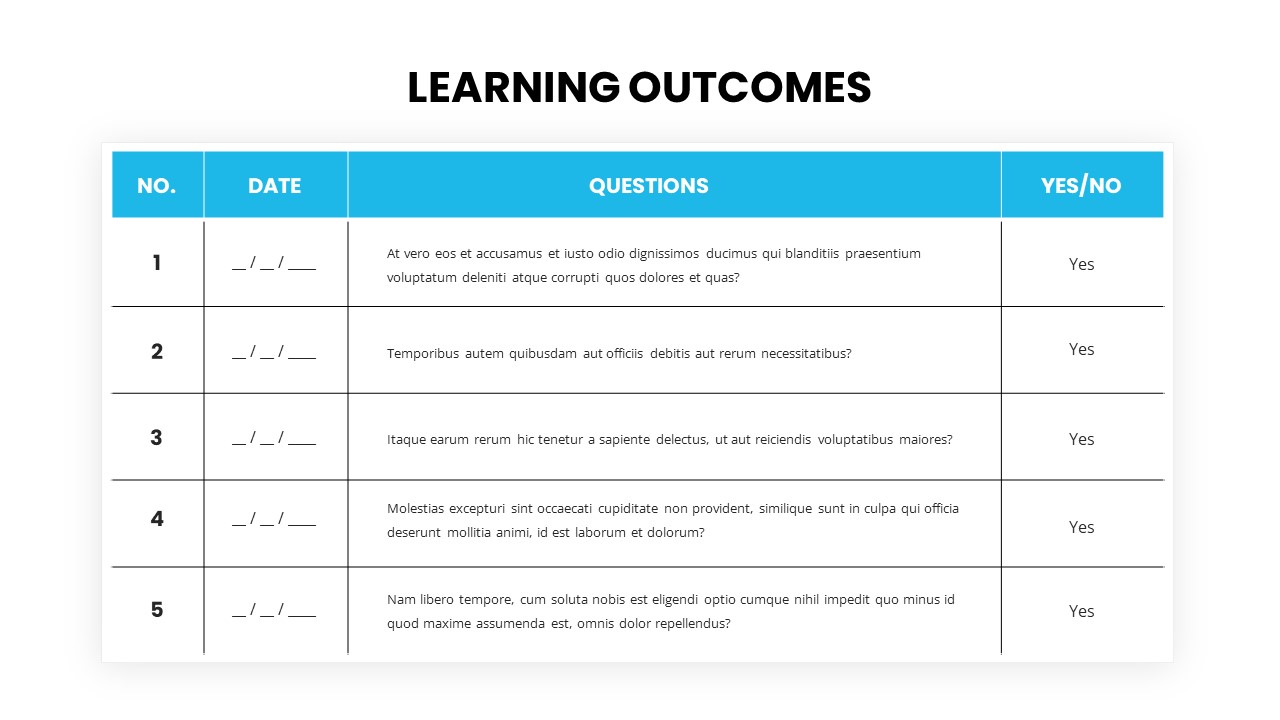
Learning Outcomes table template for PowerPoint & Google Slides
Charts
-
3D pie chart infographic template for PowerPoint & Google Slides
Pie/Donut
-
Stacked Bar Chart for PowerPoint & Google Slides
Bar/Column
-
Donut Chart Data Breakdown template for PowerPoint & Google Slides
Pie/Donut
-
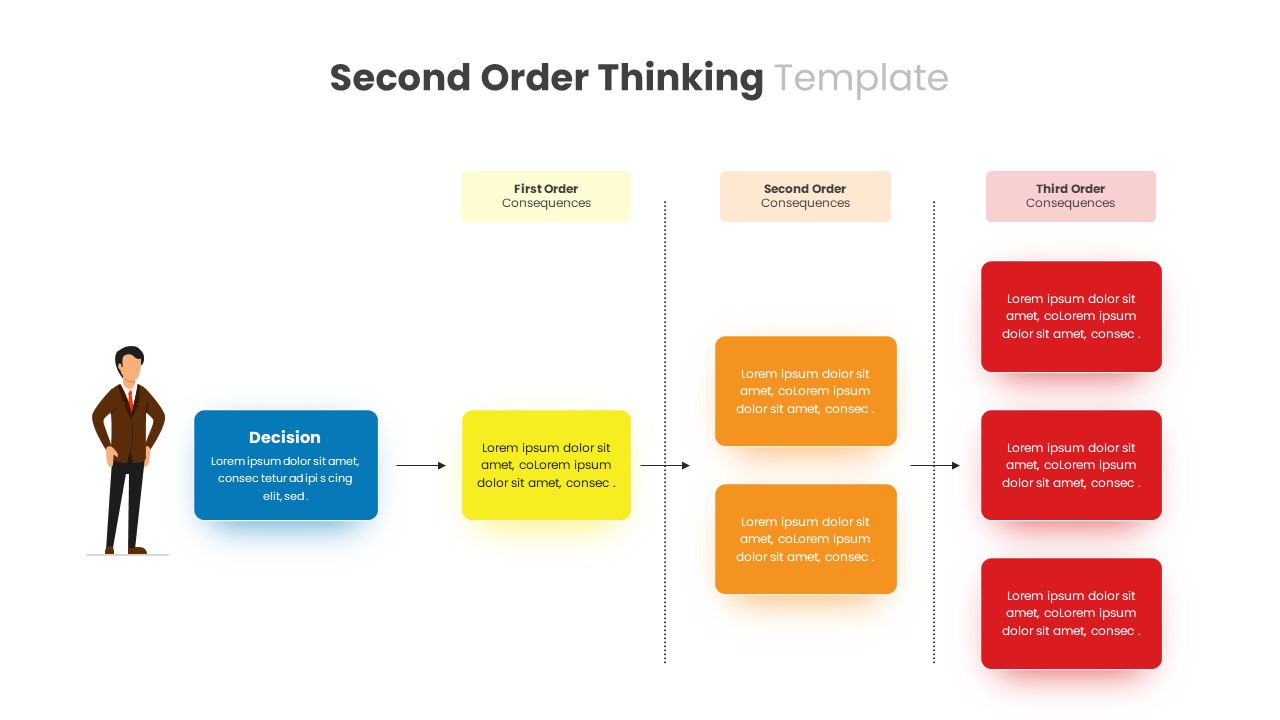
Second Order Thinking Framework template for PowerPoint & Google Slides
Business
-
Vendor Comparison Matrix with High-Level Requirements template for PowerPoint & Google Slides
Comparison Chart
-
Free Metro UI Dashboard Infographic Template for PowerPoint & Google Slides
Business Report
Free
-
Website Performance Monitoring Dashboard Template for PowerPoint & Google Slides
Business Report
-
Risk Assessment Heatmap Matrix Slide Template for PowerPoint & Google Slides
Comparison Chart
-
Dynamic Statistics & Progress Charts Template for PowerPoint & Google Slides
Pie/Donut
-
Agriculture Infographics Slide with Progress Rings & Metrics Template for PowerPoint & Google Slides
Pie/Donut
-
Statistics & Global Metrics Infographic Template for PowerPoint & Google Slides
Bar/Column
-
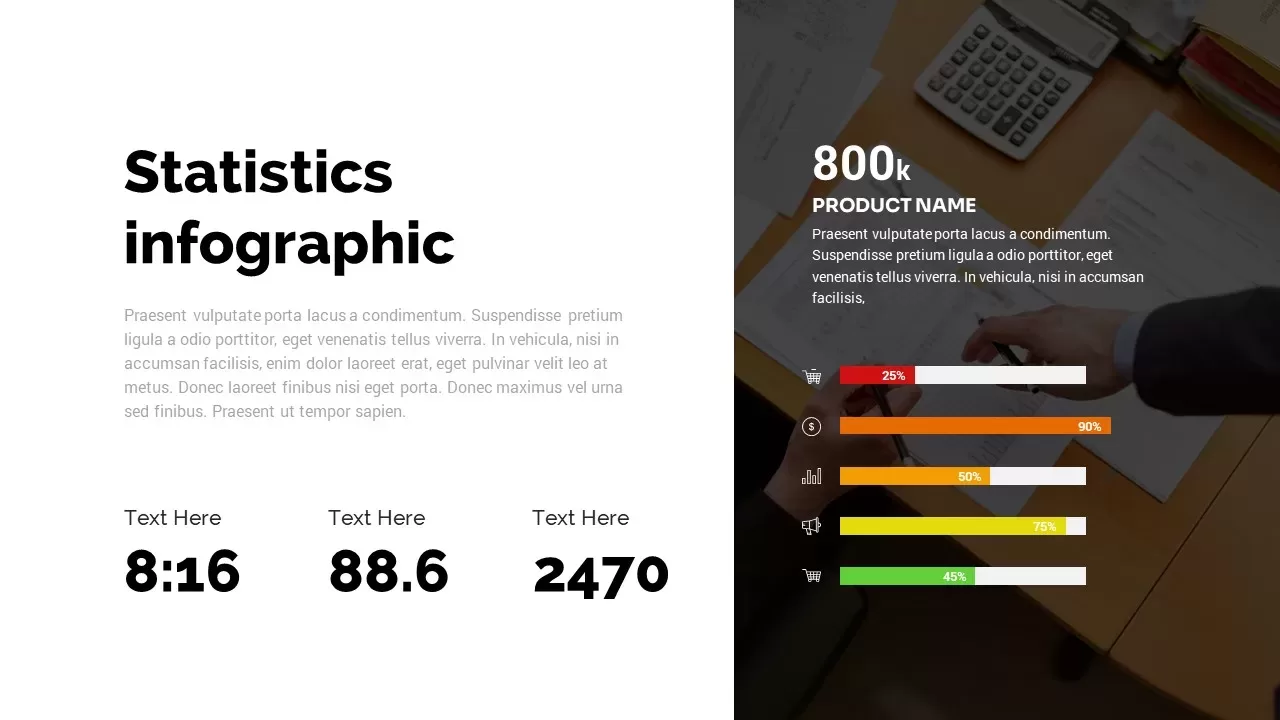
Statistics Infographic Template for PowerPoint & Google Slides
Bar/Column