Body Mass Index Health Infographic Template for PowerPoint & Google Slides


Description
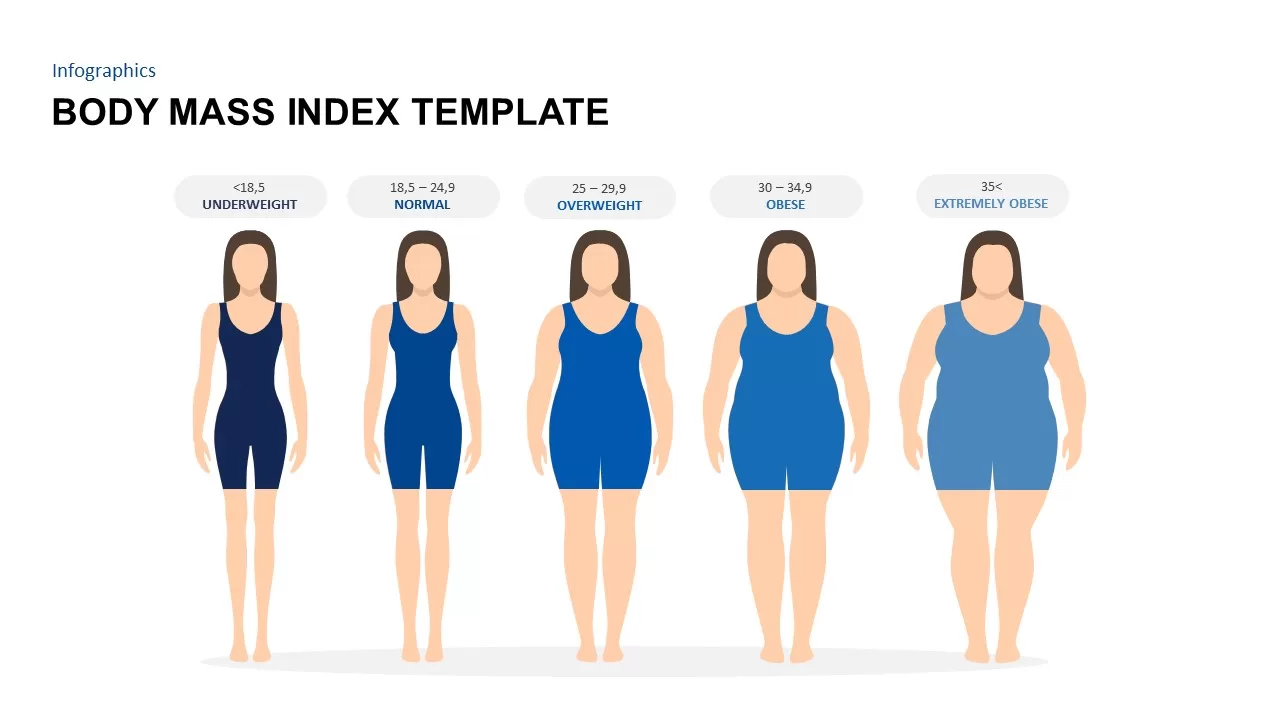
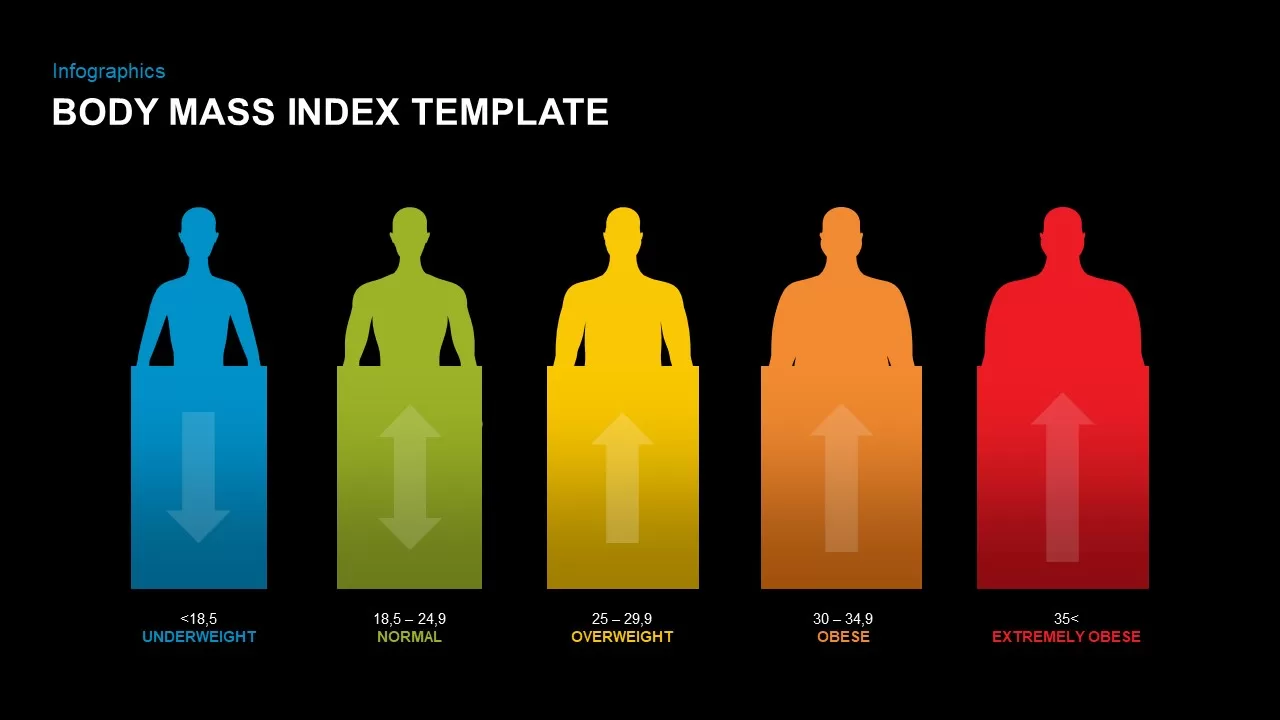
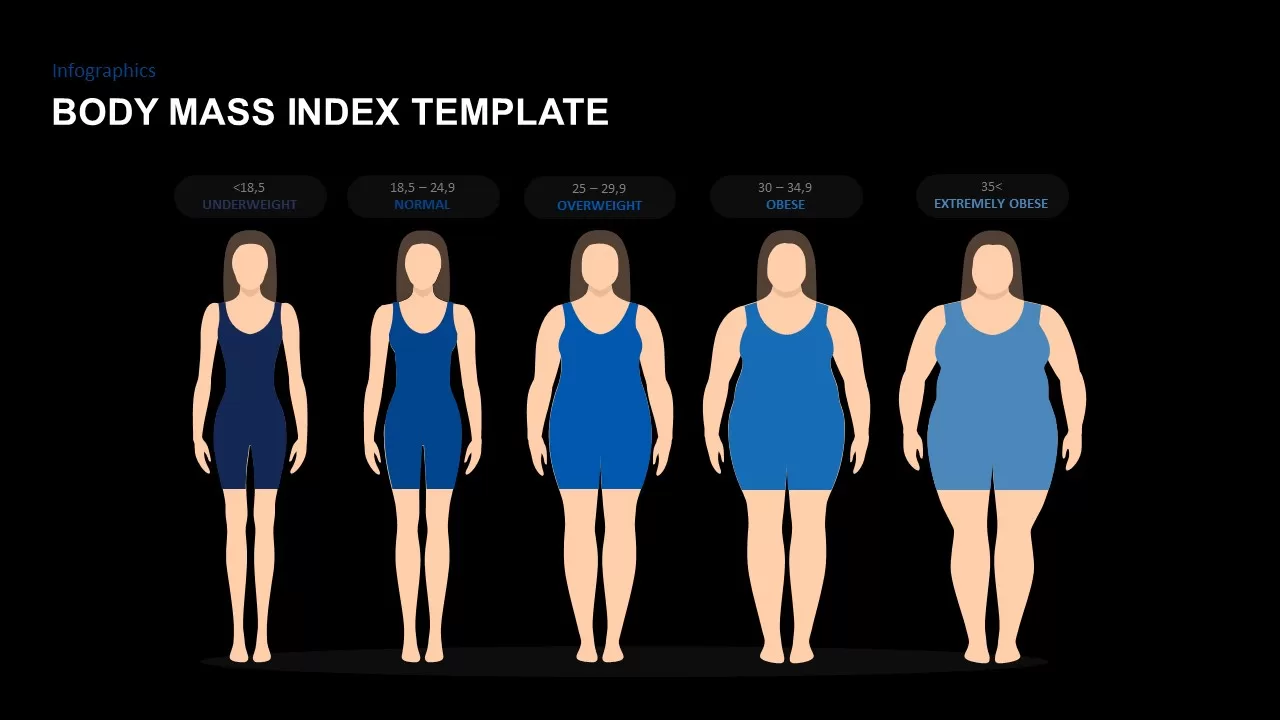
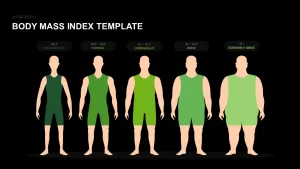
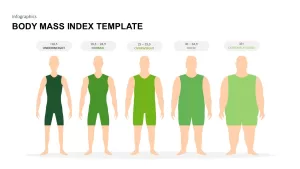
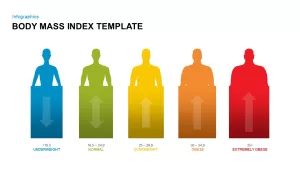
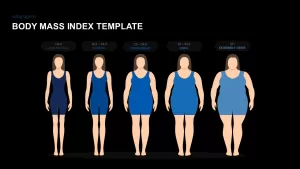
Present a suite of five customizable infographic slides illustrating the Body Mass Index scale across five key categories: Underweight (<18.5), Normal (18.5–24.9), Overweight (25–29.9), Obese (30–34.9), and Extremely Obese (35+). Each slide features a flat-design human silhouette or shape-based graphic, color-coded to represent the BMI range and accompanied by clear range labels above each figure. Editable master slides support both light and dark backgrounds, with alternating palette options—blue gradients for healthy ranges, warm hues for higher-risk groups, and bold red for extreme obesity—ensuring visual clarity across presentation themes. Easily swap silhouettes for male or female avatars, adjust color schemes, and customize caption text with intuitive placeholders, enabling swift adaptation for diverse audiences. Perfectly optimized for PowerPoint and Google Slides, the template maintains full resolution, leverages vector shapes for seamless scaling, and integrates with standard slide layouts for consistency. Whether delivering academic lectures, patient education sessions, or corporate wellness workshops, these infographics simplify complex health metrics into accessible visual insights, driving audience engagement and reinforcing critical messaging.
Who is it for
Healthcare professionals, dietitians, nutritionists, medical students, fitness trainers, and wellness coordinators can leverage this BMI template to educate patients on healthy weight thresholds, support weight management programs, and illustrate risk stratification. Researchers and public health officials will also appreciate the data-driven design for seminars and community outreach.
Other Uses
Repurpose the silhouette progression to showcase patient weight-tracking milestones, corporate wellness challenge results, fitness assessment dashboards, pediatric growth chart comparisons, or research data trends. Adapt color schemes to match organizational branding or thematic requirements, creating versatile health and wellness presentations that resonate across clinical, academic, and corporate environments.
Login to download this file

Item ID
SB02112
Related Templates

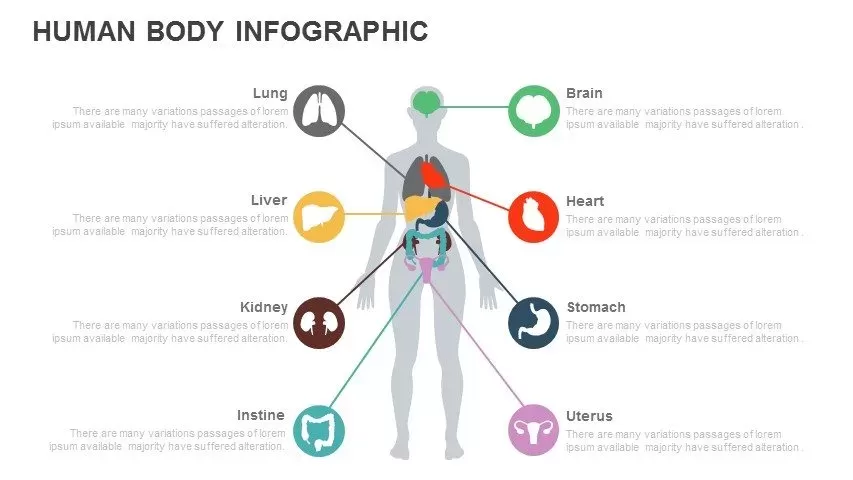
Multi-Organ Human Body Infographic Template for PowerPoint & Google Slides
Comparison

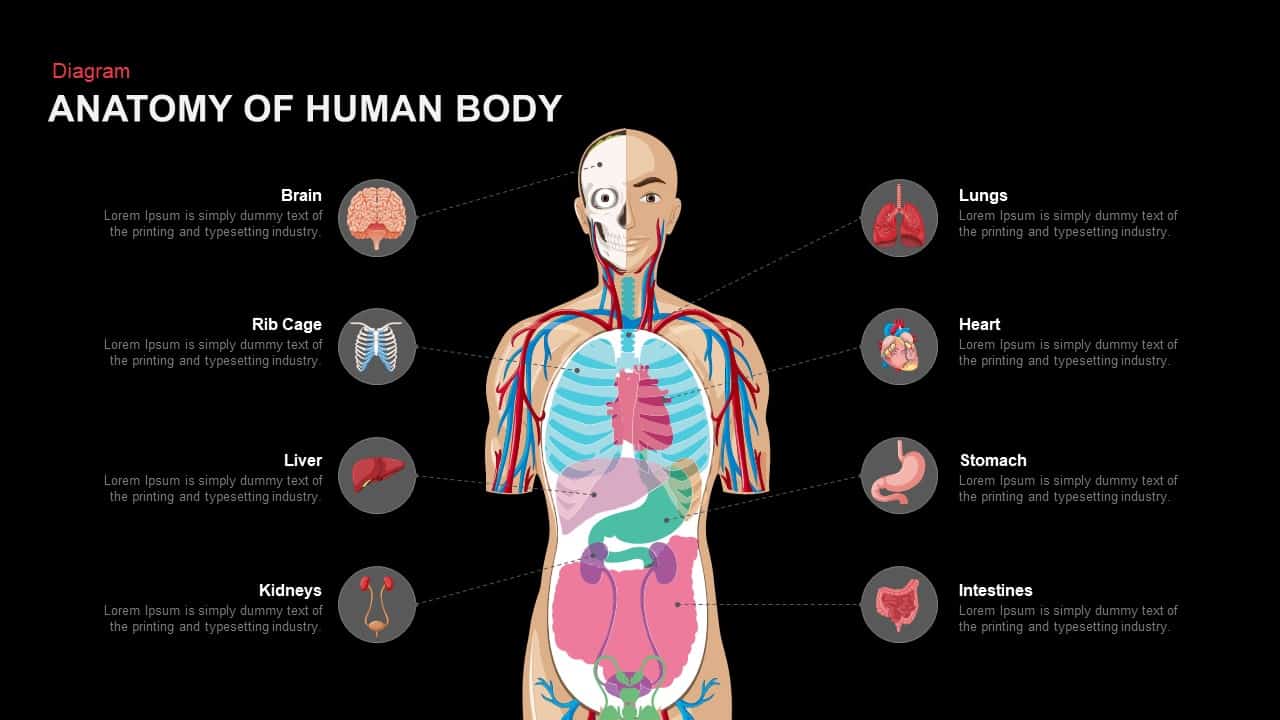
Anatomy of the Human Body Diagram Template for PowerPoint & Google Slides
Health
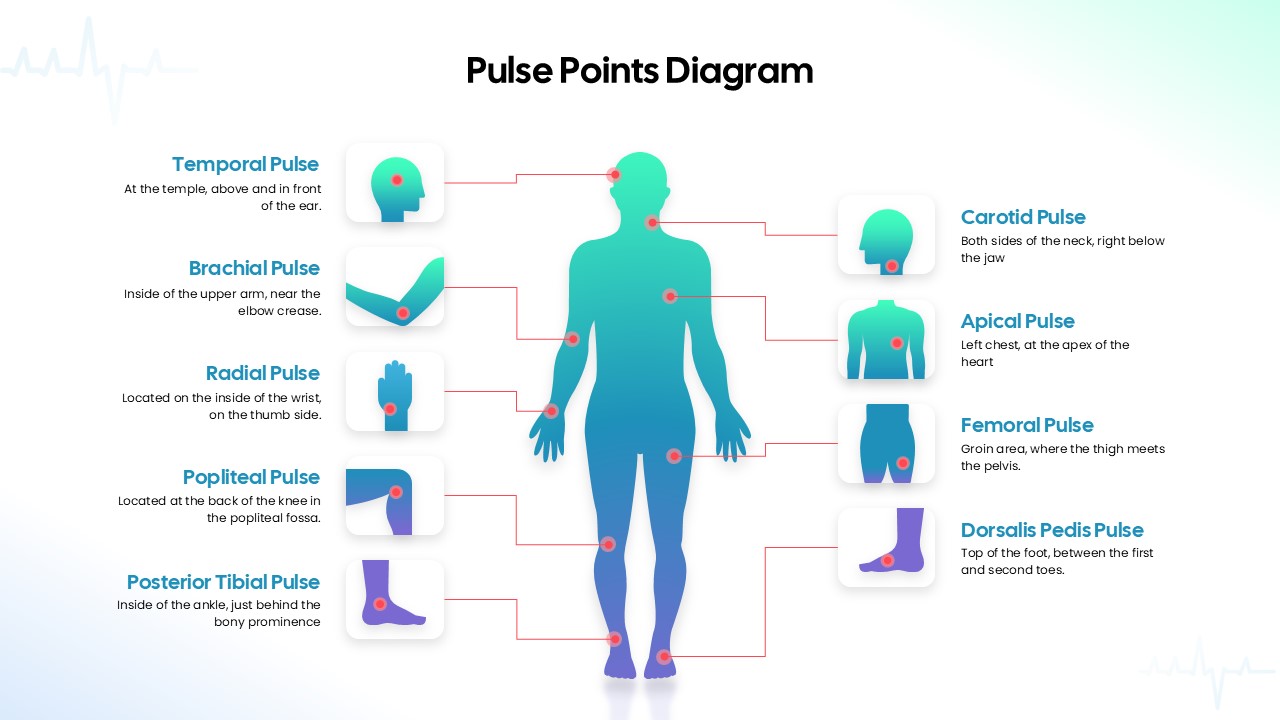
Human Body Pulse Points Diagram Template for PowerPoint & Google Slides
Medical
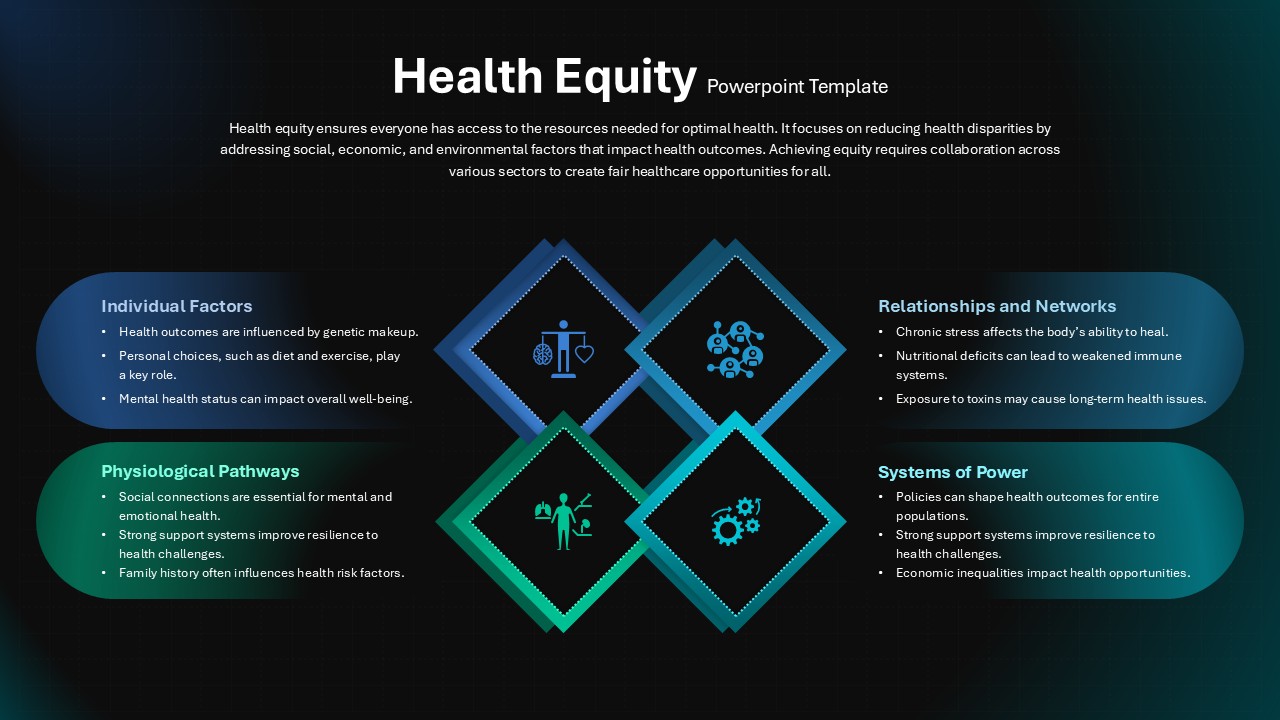
Health Equity Pillars Infographic Template for PowerPoint & Google Slides
Comparison
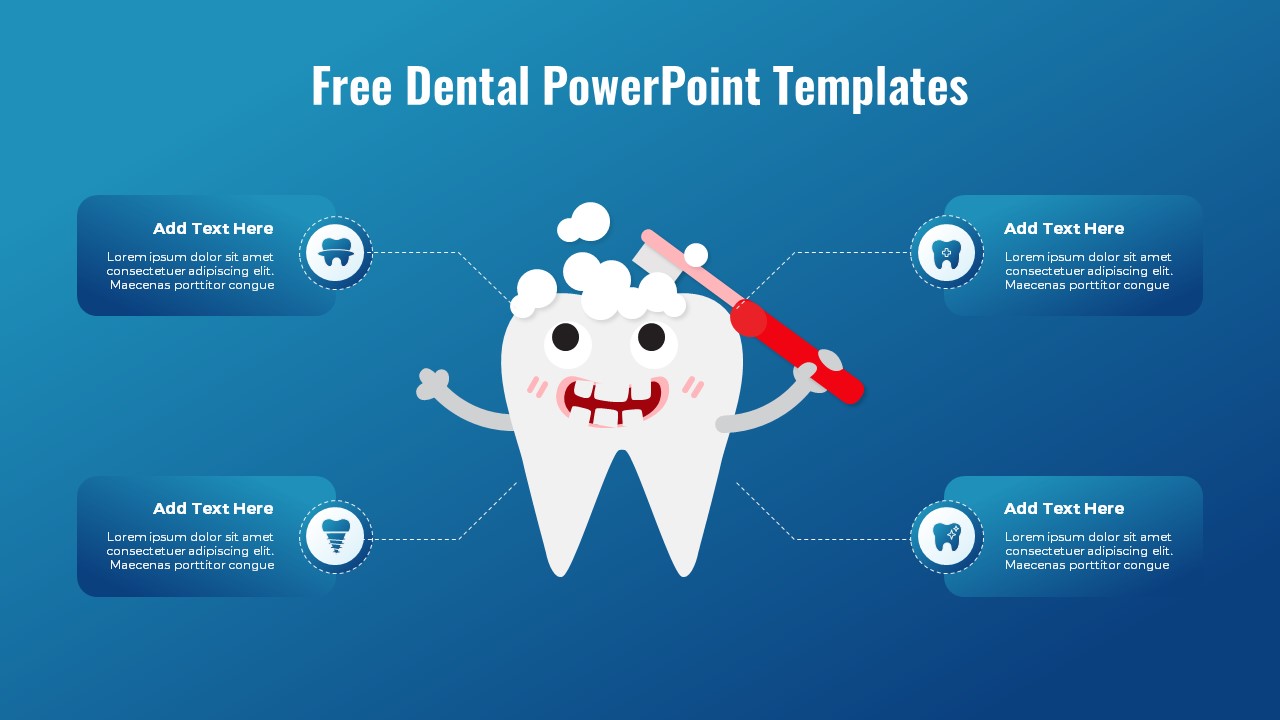
Free Cute Dental Health Infographic Layout for PowerPoint & Google Slides
Health
Free
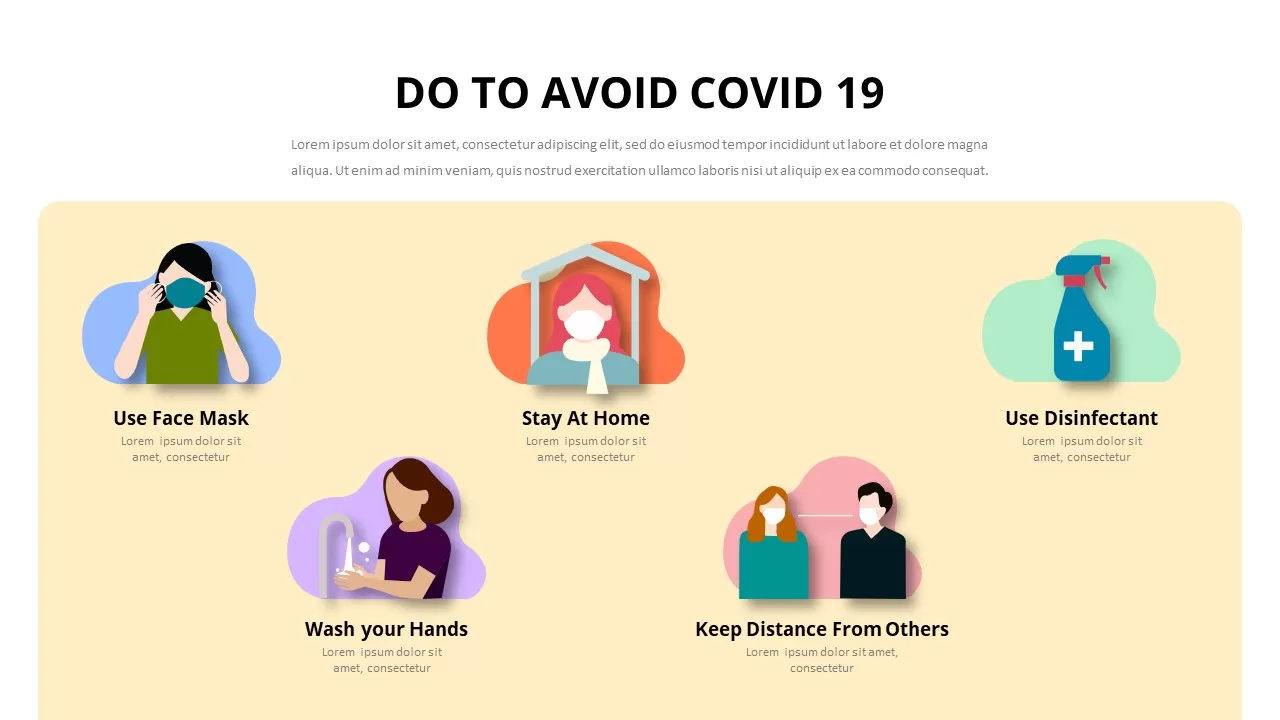
Covid-19 Do’s and Don’ts Health Awareness Template for PowerPoint & Google Slides
Health
Health Insurance Presentation Deck Template for PowerPoint & Google Slides
Health
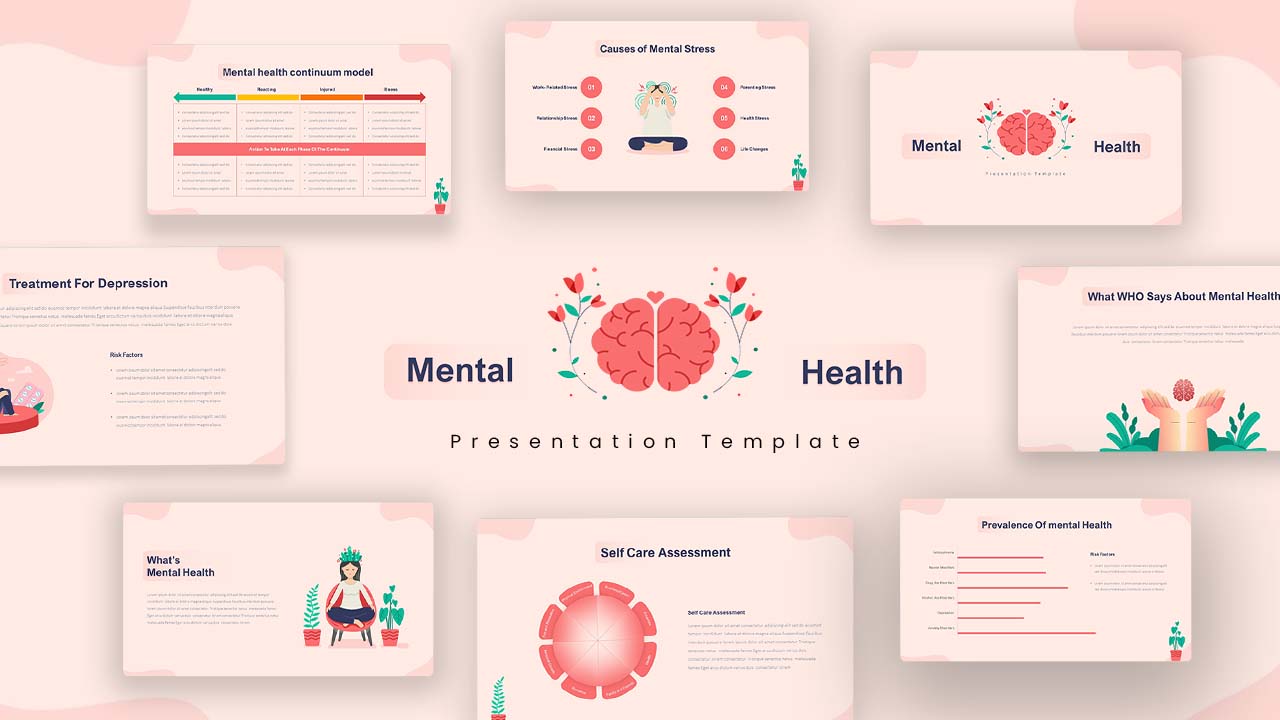
Free Mental Health Awareness & Infographics Presentation Template for PowerPoint & Google Slides
Health
Free

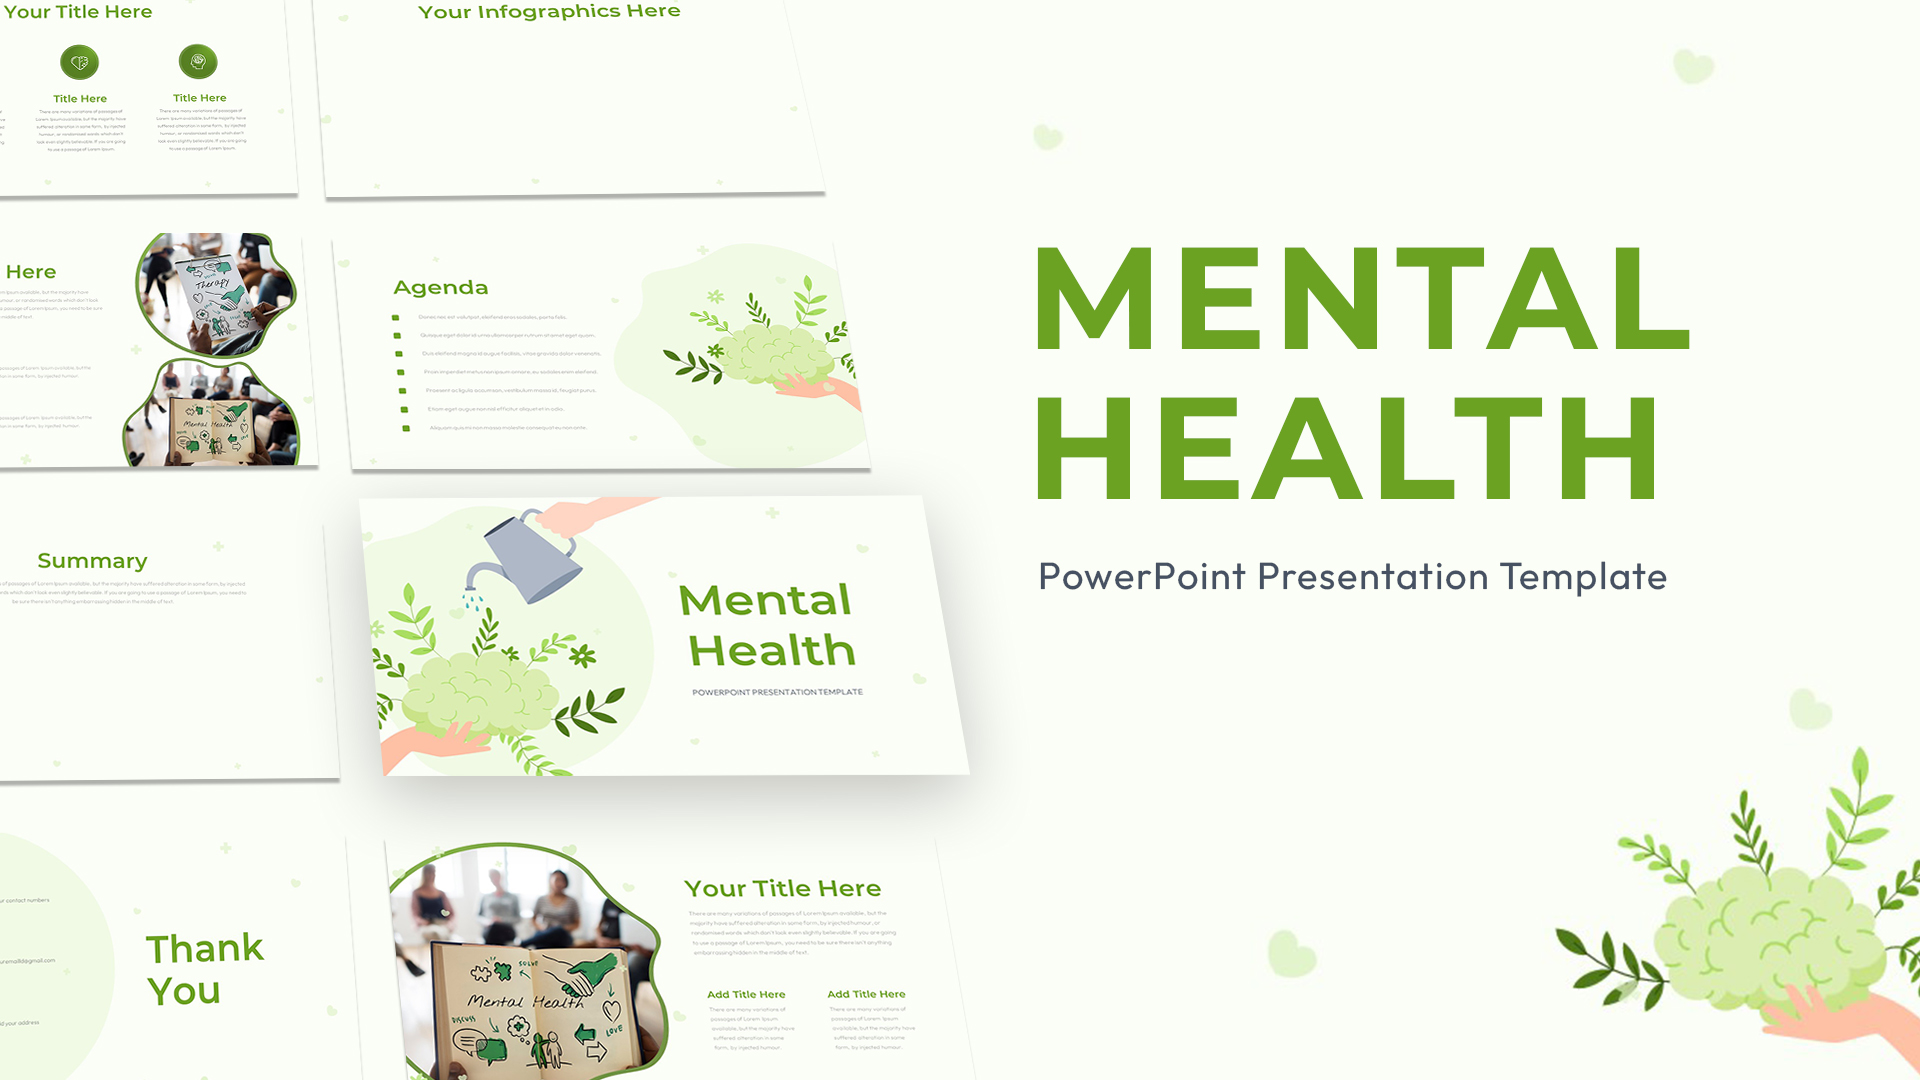
Mental Health Presentation Theme Template for PowerPoint & Google Slides
Health
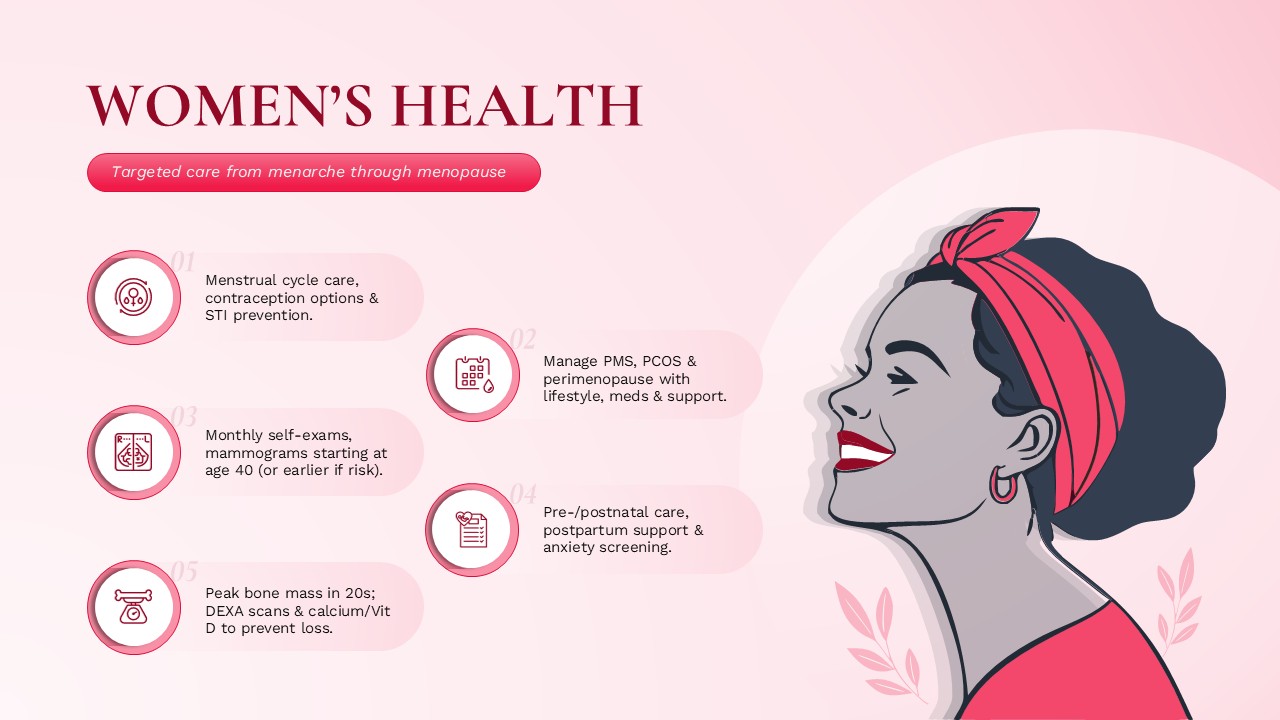
Women’s Health Care Overview template for PowerPoint & Google Slides
Medical
Global Health Initiatives Presentation Template for PowerPoint & Google Slides
Health
Electronic Health Records Dashboard template for PowerPoint & Google Slides
Health
Pediatric Health Services Overview Template for PowerPoint & Google Slides
Health
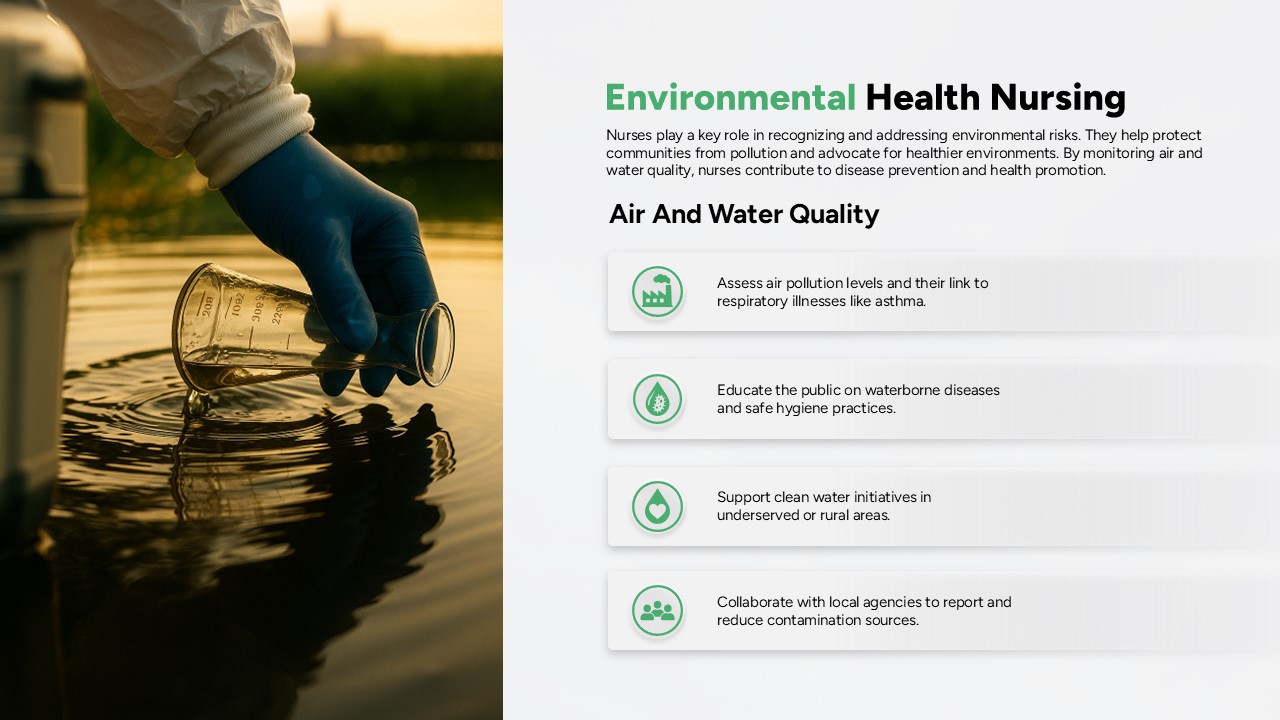
Environmental Nursing Health: Air & Water Template for PowerPoint & Google Slides
Nursing
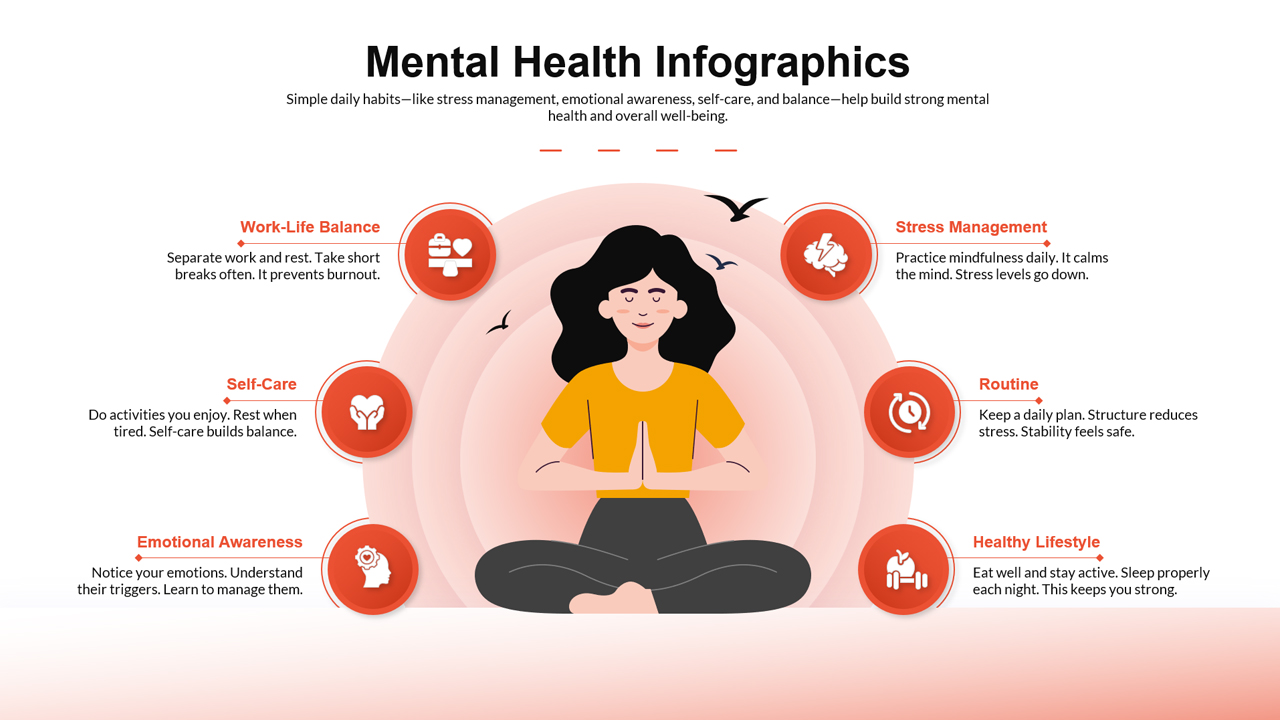
Mental Health Infographics Template for PowerPoint & Google Slides
Health
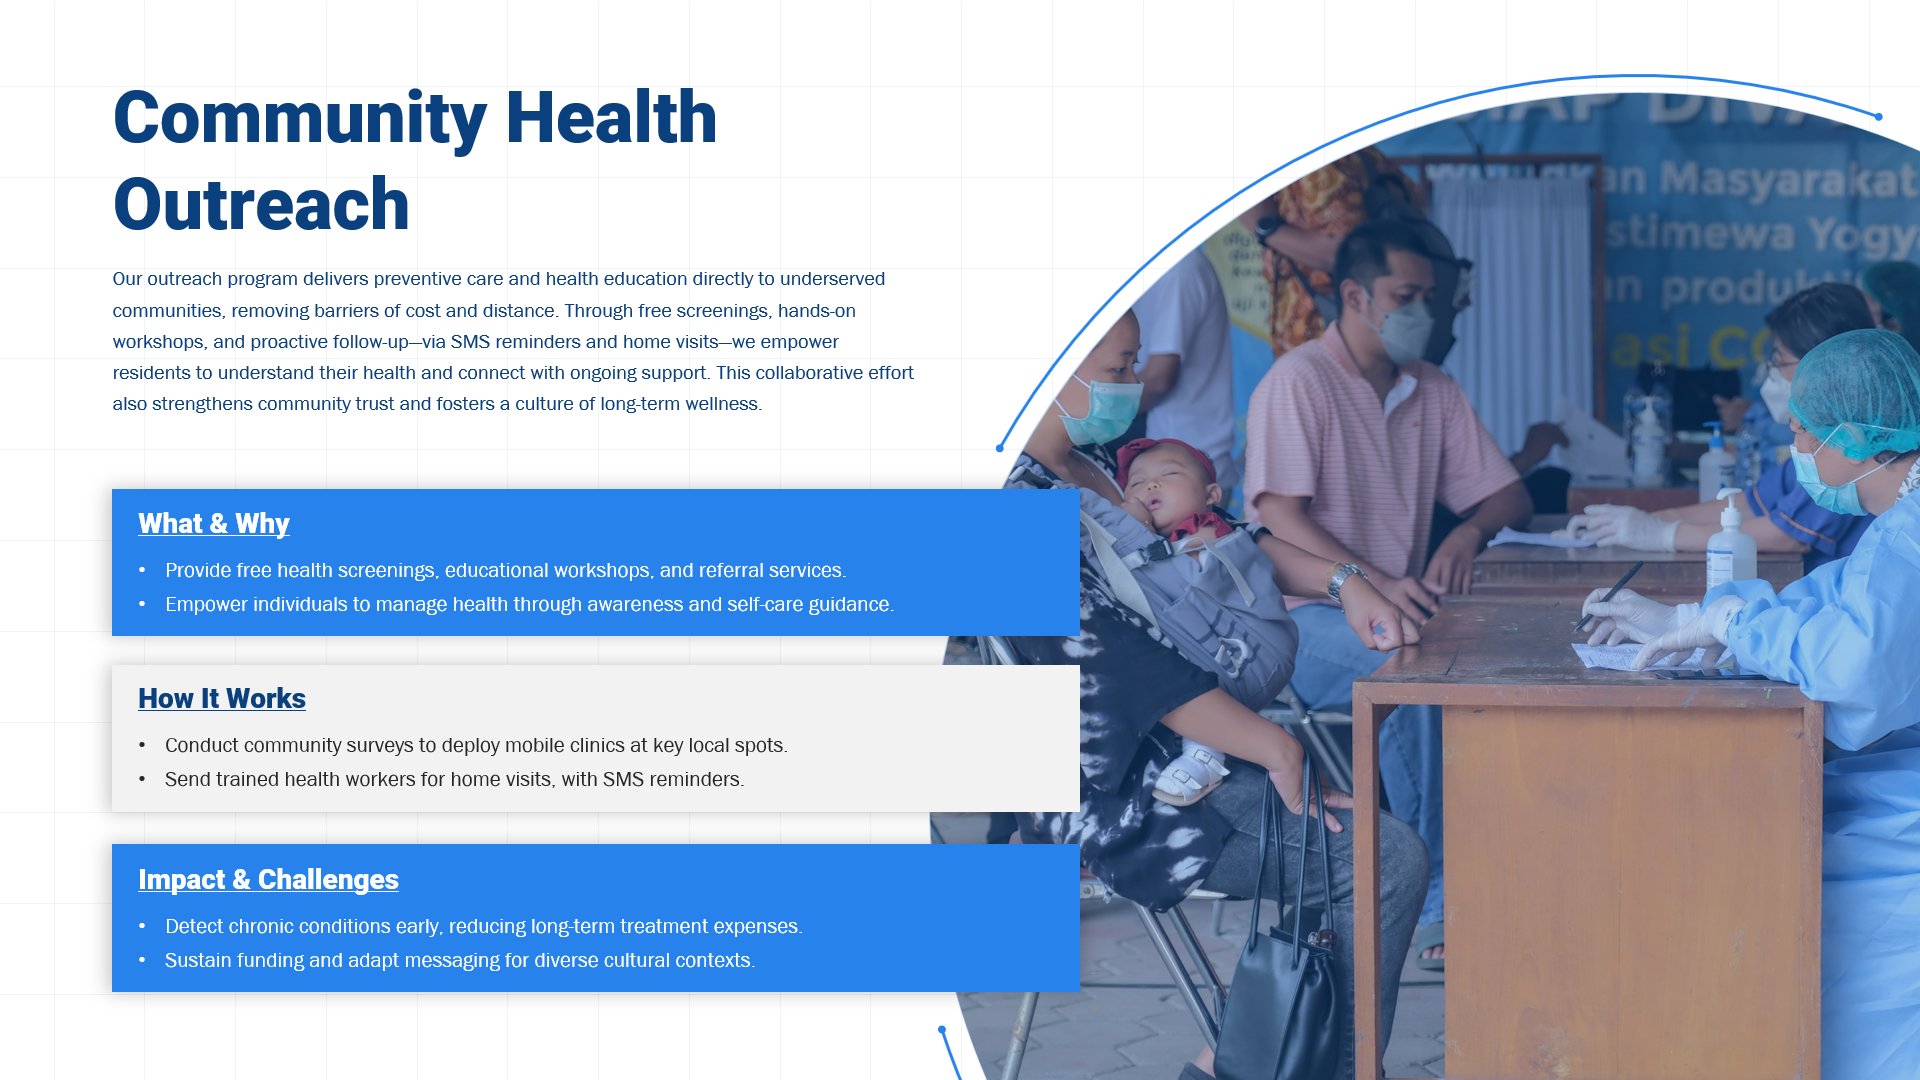
Community Health Outreach Template for PowerPoint & Google Slides
Health
Free World Health Organization Presentation Deck for PowerPoint & Google Slides
Decks
Free
Google Ads Optimization & Performance Infographic Template for PowerPoint & Google Slides
Digital Marketing
SQ3R Study Strategy Infographic Slides Template for PowerPoint & Google Slides
Business Strategy
Six Double Diamond Infographic Slides Template for PowerPoint & Google Slides
Process
Sales Process Infographic Slides Pack Template for PowerPoint & Google Slides
Process
Casino/Poker Chips Infographic Slides template for PowerPoint & Google Slides
Business Strategy
Agenda Infographic Pack of 2 Slides Template for PowerPoint & Google Slides
Agenda
Quad Chart Infographic Pack of 8 Slides Template for PowerPoint & Google Slides
Comparison Chart
Four Options Infographic Slides Template for PowerPoint & Google Slides
Comparison
Game Plan Infographic Slides Pack Template for PowerPoint & Google Slides
Infographics
Teamwork PowerPoint Infographic Template for PowerPoint & Google Slides
Leadership
Kite Infographic PowerPoint Template for PowerPoint & Google Slides
Process
Cladogram Infographic Di Template for PowerPoint & Google Slides Template
Decision Tree
Workflow PowerPoint Process infographic for PowerPoint & Google Slides
Process
Free Infographic Deck PowerPoint Pack for PowerPoint & Google Slides
Infographics
Free
Combination of Success Infographic template for PowerPoint & Google Slides
Business Strategy
Pyramid infographic template for PowerPoint & Google Slides
Pyramid
Connected Bubble Network Infographic Template for PowerPoint & Google Slides
Circular
Layered Bulb Infographic Four Segments Template for PowerPoint & Google Slides
Funnel
Simple Organizational Chart Infographic Template for PowerPoint & Google Slides
Org Chart
Market Hierarchy Structure Infographic template for PowerPoint & Google Slides
Org Chart
Six Directional Arrows Infographic Template for PowerPoint & Google Slides
Arrow
Section Diagram Elements Infographic Template for PowerPoint & Google Slides
Process

Eight Segment Star Diagram Infographic Template for PowerPoint & Google Slides
Process
Support Services Gear Infographic Template for PowerPoint & Google Slides
Business
Key Metaphor Infographic Slide Template for PowerPoint & Google Slides
Process
Umbrella and Rain Infographic Metrics Template for PowerPoint & Google Slides
Comparison
Segmented Pyramid Diagram Infographic Template for PowerPoint & Google Slides
Pyramid
3D Bar Graph Infographic Template for PowerPoint & Google Slides
Bar/Column
Infographic South Korea Map Template for PowerPoint & Google Slides
Maps

Three-Circle Process Infographic Template for PowerPoint & Google Slides
Circular
Arrow Timeline Infographic Slide Template for PowerPoint & Google Slides
Timeline
Crossword Puzzle Infographic Template for PowerPoint & Google Slides
Advertising
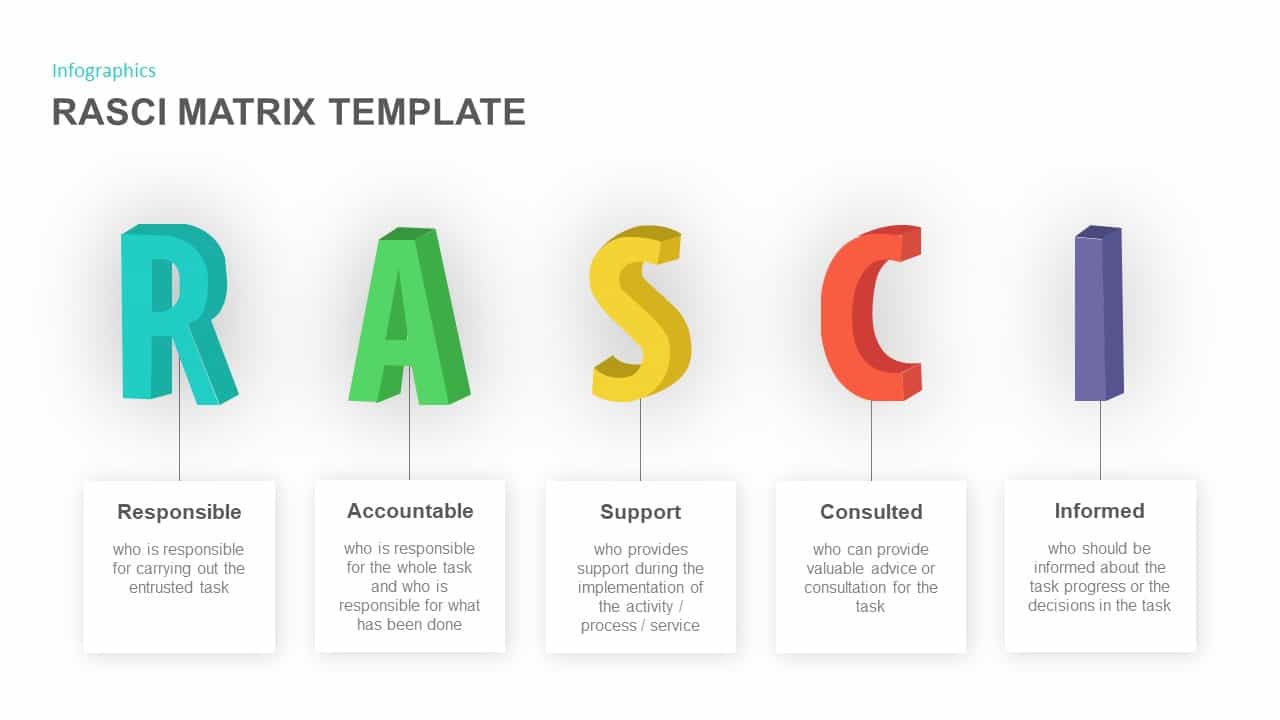
RASCI Assignment Matrix Infographic Template for PowerPoint & Google Slides
Infographics
Business Services Call Center Infographic Template for PowerPoint & Google Slides
Business Models
Time Management Clock Infographic Template for PowerPoint & Google Slides
Circular
Nine-Point Agenda Infographic Slide Template for PowerPoint & Google Slides
Agenda
Six-Stage Timeline Infographic Template for PowerPoint & Google Slides
Timeline
Target Marketing Infographic Slide Pack Template for PowerPoint & Google Slides
Infographics
Time Management Stopwatch Infographic Template for PowerPoint & Google Slides
Process
4 Factors Circular Diagram Infographic Template for PowerPoint & Google Slides
Circular
Delivery Logistics Infographic Visual Template for PowerPoint & Google Slides
Process
Seller Portals Comparison Infographic Template for PowerPoint & Google Slides
Process
Four-Stage Agenda Infographic Slide Template for PowerPoint & Google Slides
Agenda
Seven-Stage Hexagon Timeline Infographic Template for PowerPoint & Google Slides
Timeline
Roadmap with Achievements Infographic Template for PowerPoint & Google Slides
Roadmap
Four-Step Puzzle Diagram Infographic Template for PowerPoint & Google Slides
Process
Modern Gear Venn Diagram Infographic Template for PowerPoint & Google Slides
Comparison
Five-Step Infographic Process and Agenda Template for PowerPoint & Google Slides
Process

Hot Air Balloon Engaging Infographic Template for PowerPoint & Google Slides
Infographics
Business Strategy Infographic Template for PowerPoint & Google Slides
Business Strategy
Three-Phase Planning Gear Infographic Template for PowerPoint & Google Slides
Process
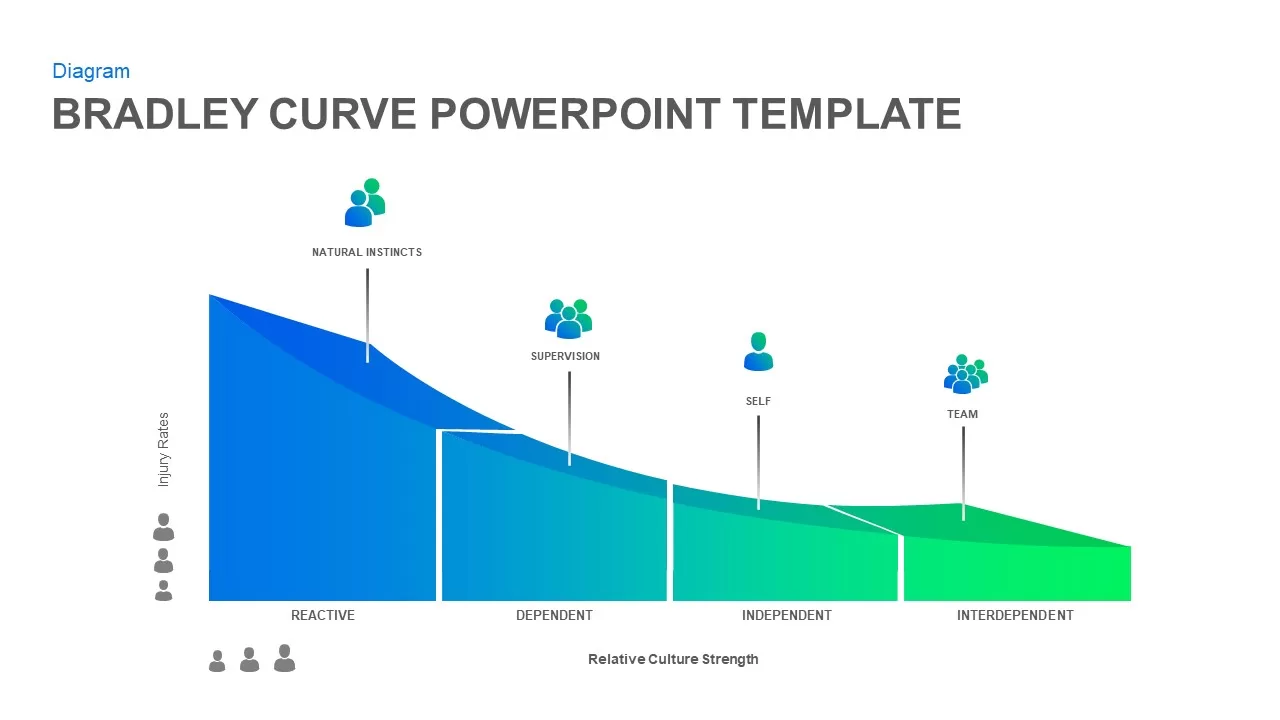
Bradley Curve Infographic Template for PowerPoint & Google Slides
Infographics
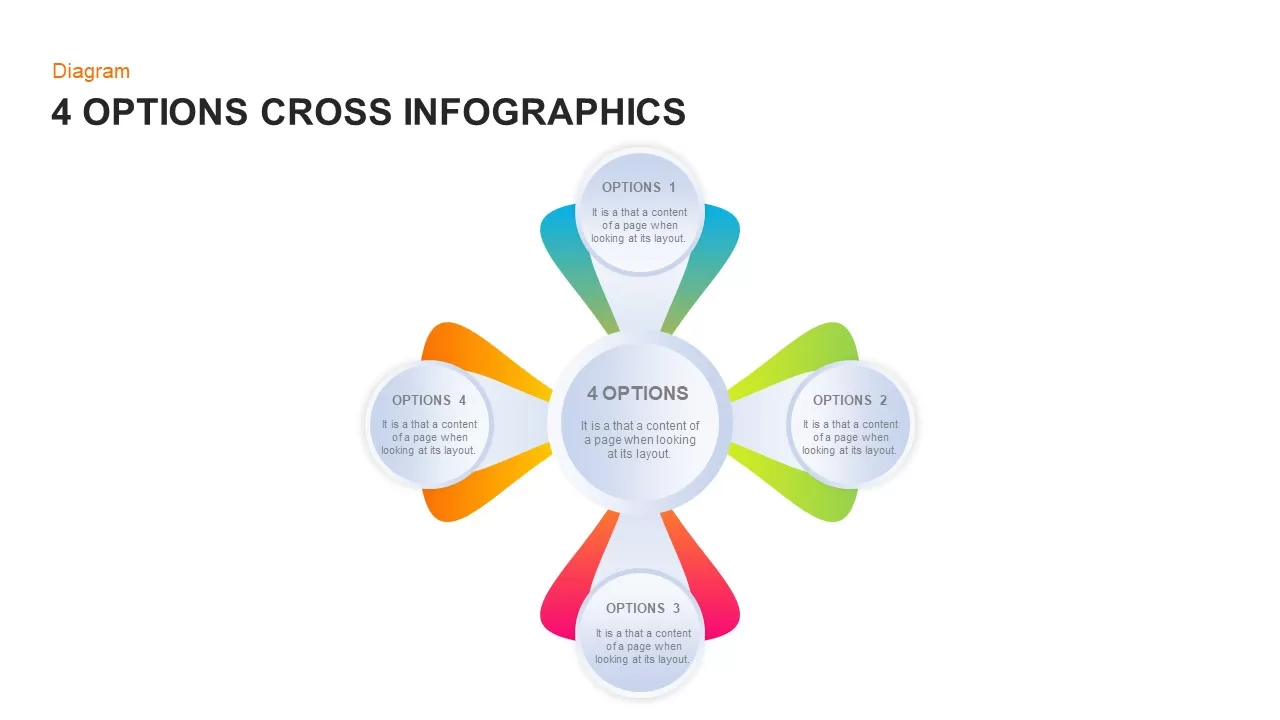
Four-Option Cross Infographic Diagram Template for PowerPoint & Google Slides
Comparison
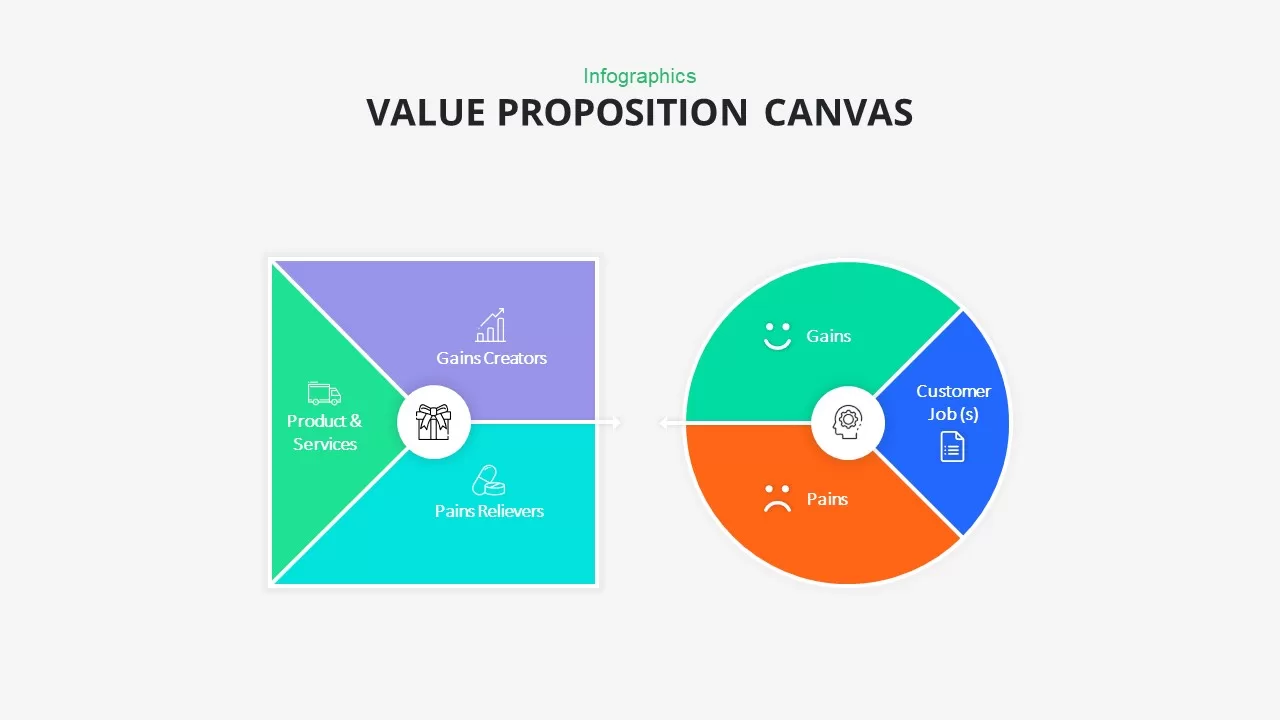
Value Proposition Canvas Infographic Template for PowerPoint & Google Slides
Business Report
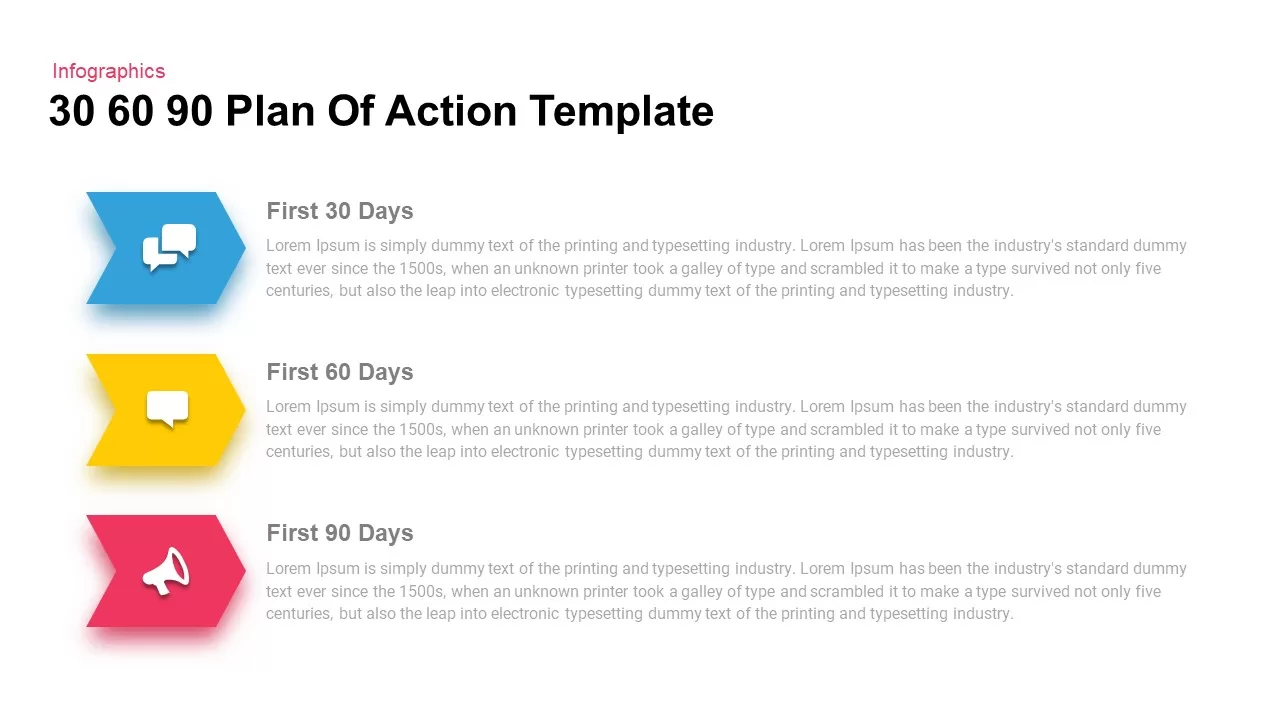
30 60 90 Day Action Plan Infographic Template for PowerPoint & Google Slides
Timeline
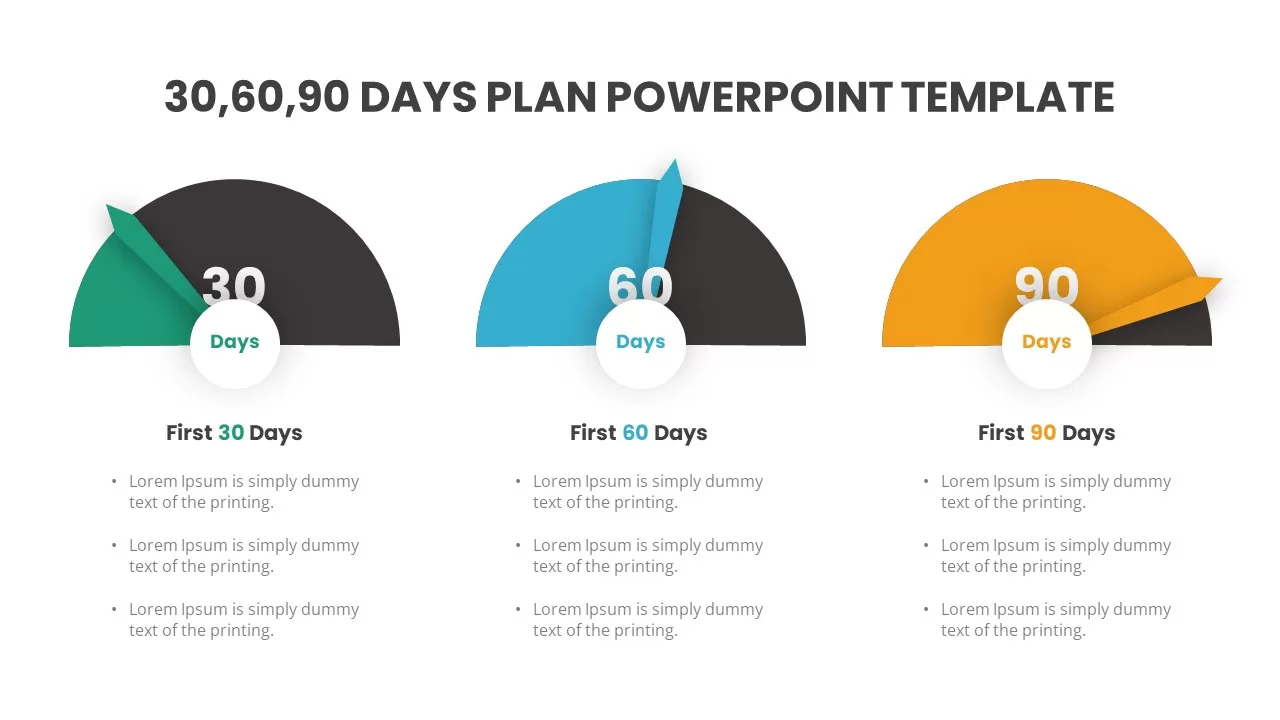
Gauge-Style 30-60-90 Day Plan Infographic Template for PowerPoint & Google Slides
Timeline
Fully Editable World Map Infographic Template for PowerPoint & Google Slides
World Maps
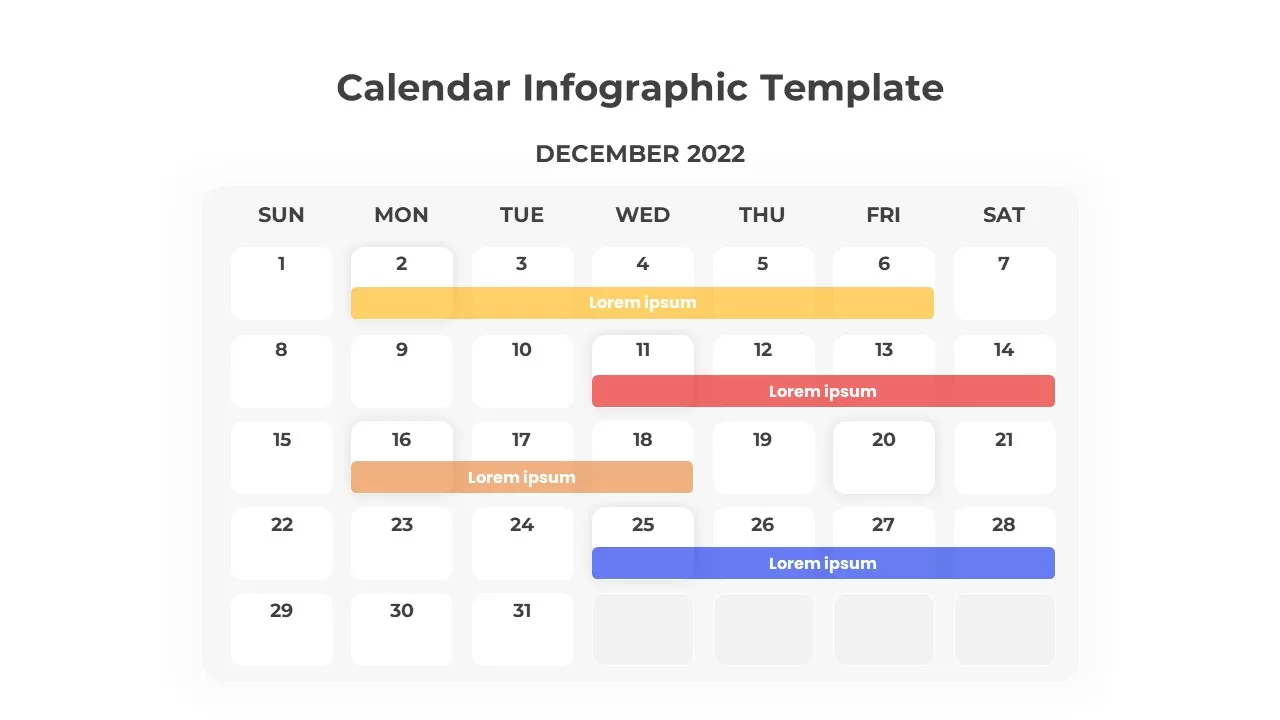
Color-Coded Calendar Infographic Template for PowerPoint & Google Slides
Infographics
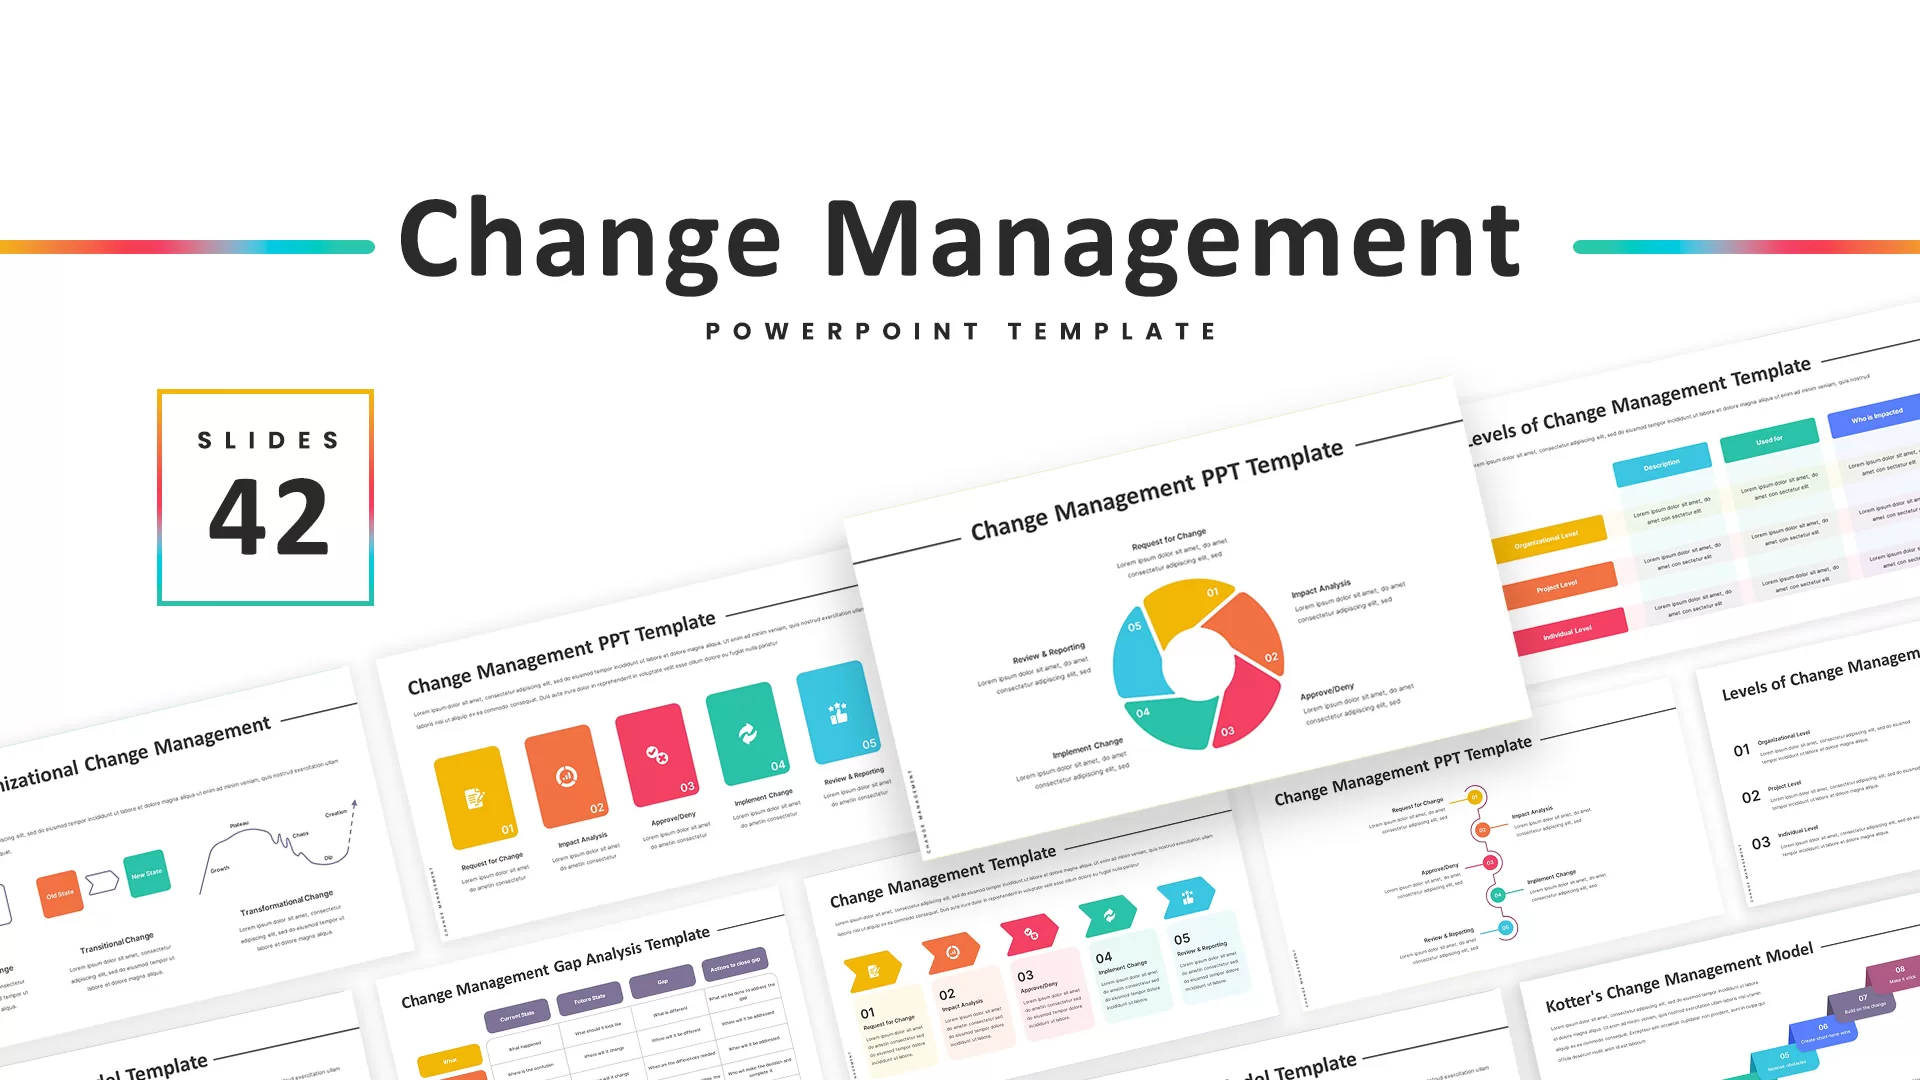
Change Management Infographic Deck Template for PowerPoint & Google Slides
Business Strategy
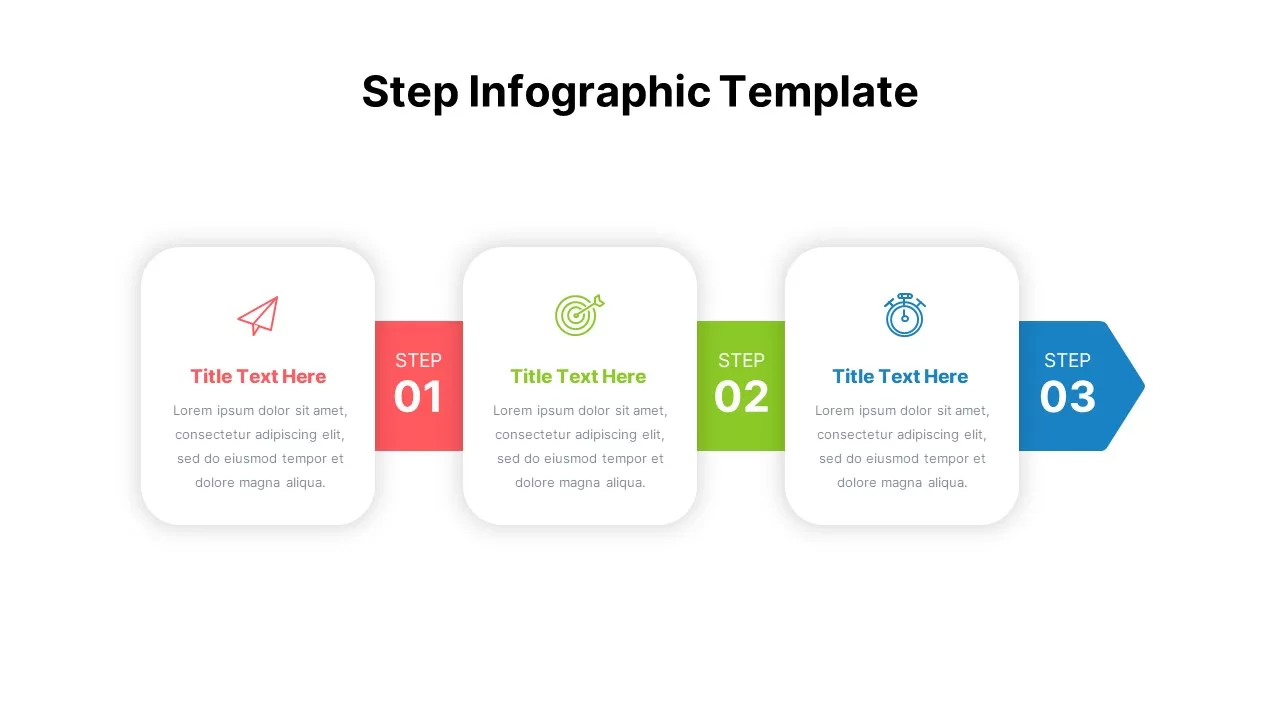
Multi-Step Infographic Process Layout Template for PowerPoint & Google Slides
Process
Free Curved Arrow Infographic Diagram Template for PowerPoint & Google Slides
Arrow
Free
Three-Path Curved Arrow Infographic Template for PowerPoint & Google Slides
Arrow
Nurse Checklist Infographic Sticky Notes Template for PowerPoint & Google Slides
Nursing
Chain Link Process Infographic Diagram Template for PowerPoint & Google Slides
Process
Ten-Step Circular Process Infographic Template for PowerPoint & Google Slides
Circular
Automotive Infographic Multi-Layout Template for PowerPoint & Google Slides
Comparison
Blockchain Infographic Template for PowerPoint & Google Slides
Org Chart
Statistics Infographic & KPI Bar Chart Template for PowerPoint & Google Slides
Bar/Column
Dynamic Hub-and-Spoke Infographic Diagram Template for PowerPoint & Google Slides
Circular
Animated 3D Dice Infographic Slide Template for PowerPoint & Google Slides
Process
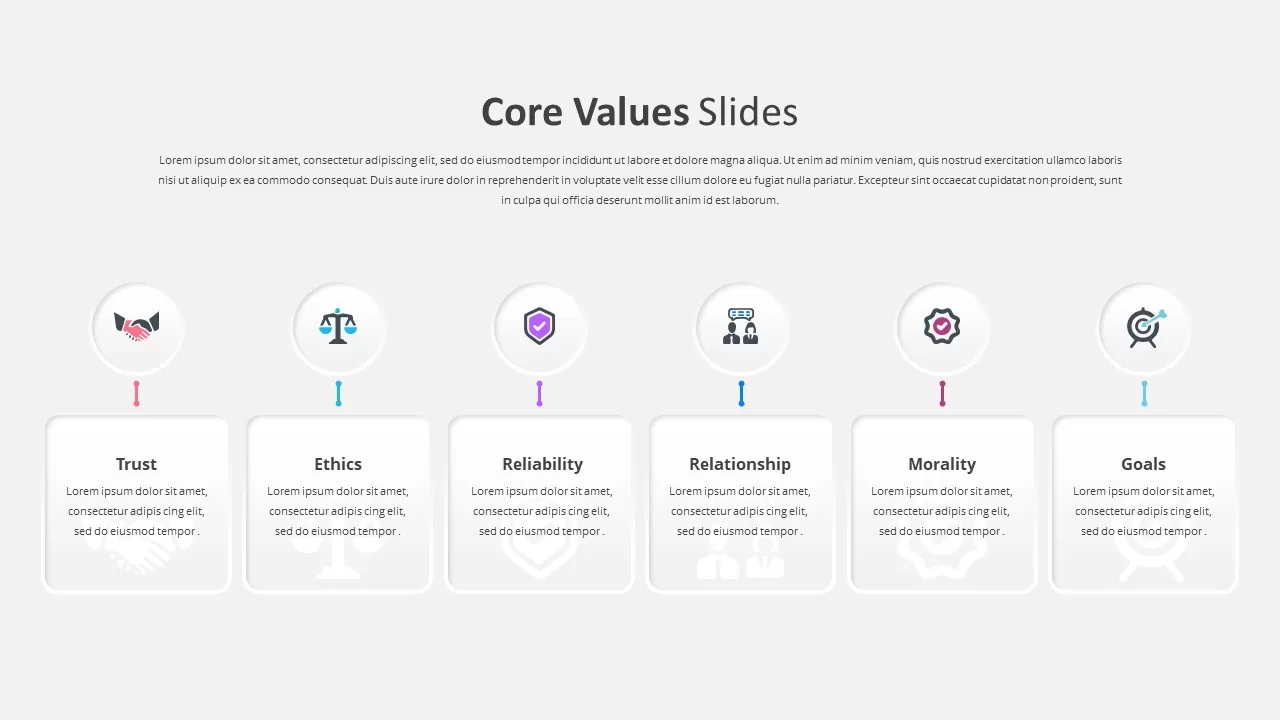
Six Core Values Infographic Timeline Template for PowerPoint & Google Slides
Comparison
3D pie chart infographic template for PowerPoint & Google Slides
Pie/Donut
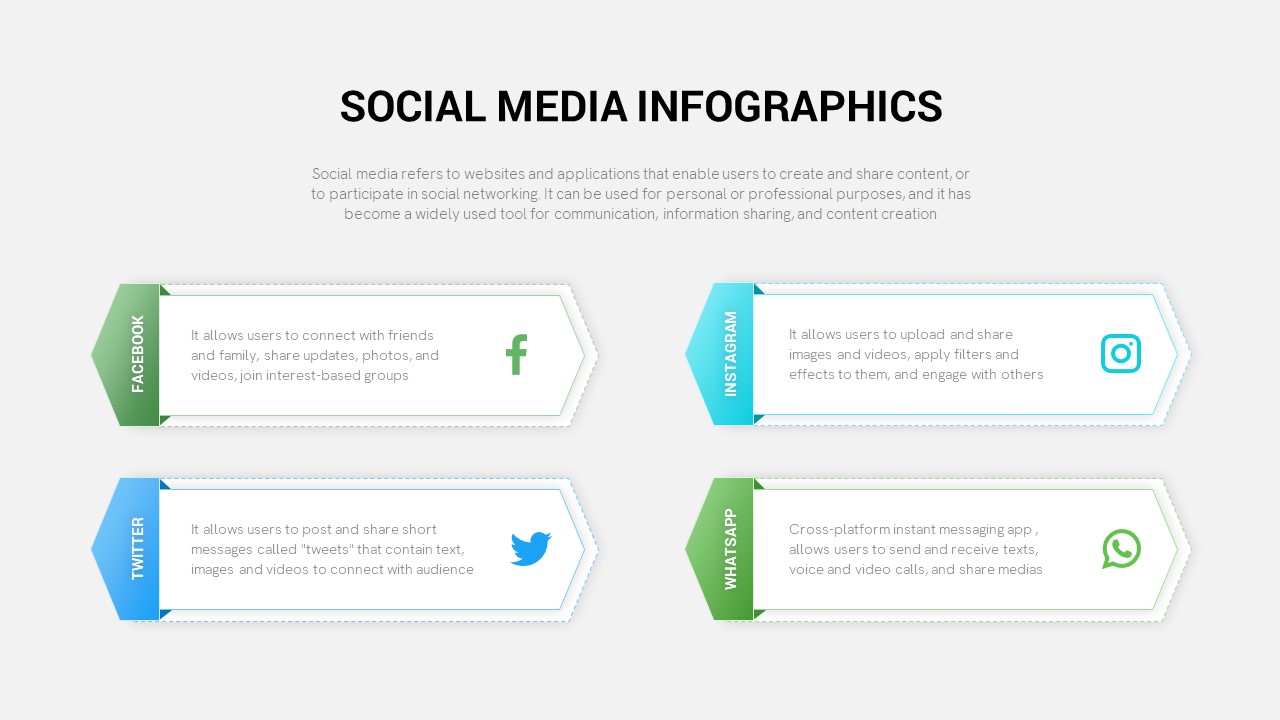
Social Media Infographic Arrow Layout Template for PowerPoint & Google Slides
Arrow
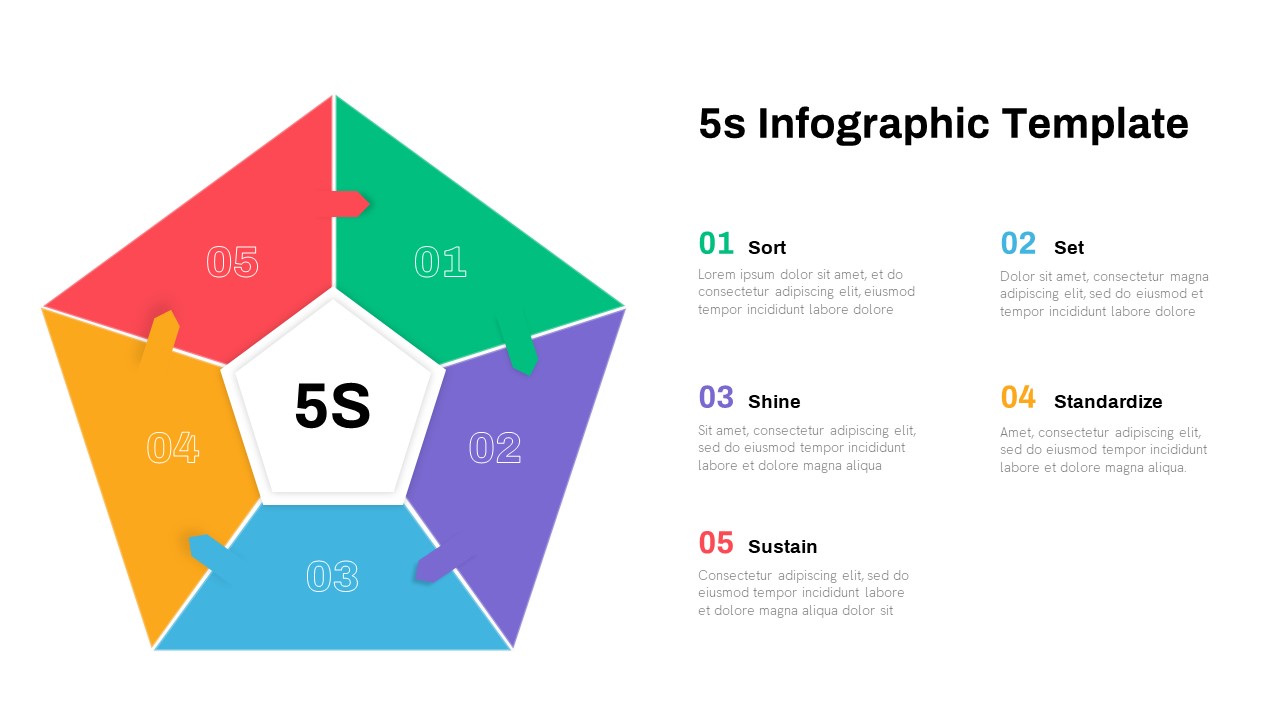
5S Lean Process Improvement Infographic Template for PowerPoint & Google Slides
Business Strategy
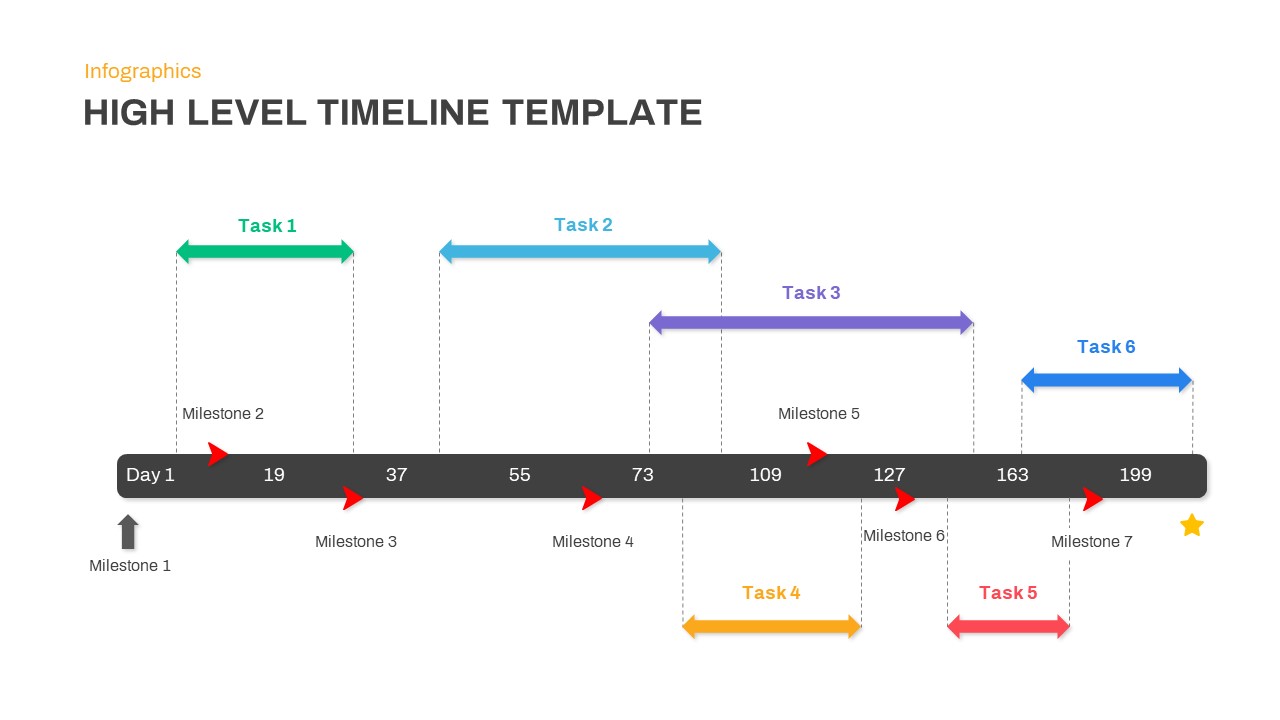
High-Level Timeline Infographic Template for PowerPoint & Google Slides
Timeline
Four-Level Food Pyramid Infographic Template for PowerPoint & Google Slides
Pyramid
Awards and Accolades Infographic Cards Template for PowerPoint & Google Slides
Accomplishment
Macro Economic Indicators Infographic Template for PowerPoint & Google Slides
Comparison
Comprehensive Value Stream Infographic Template for PowerPoint & Google Slides
Process
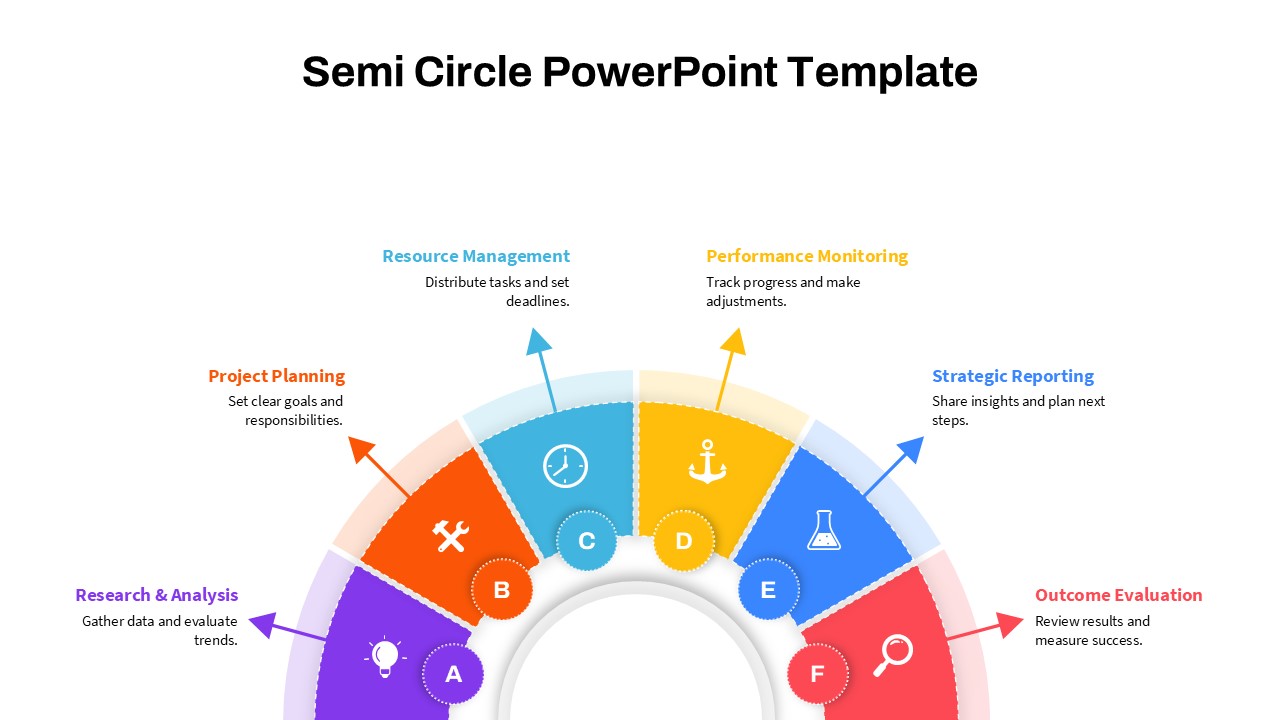
Modern Semi Circle Infographic Template for PowerPoint & Google Slides
Circular
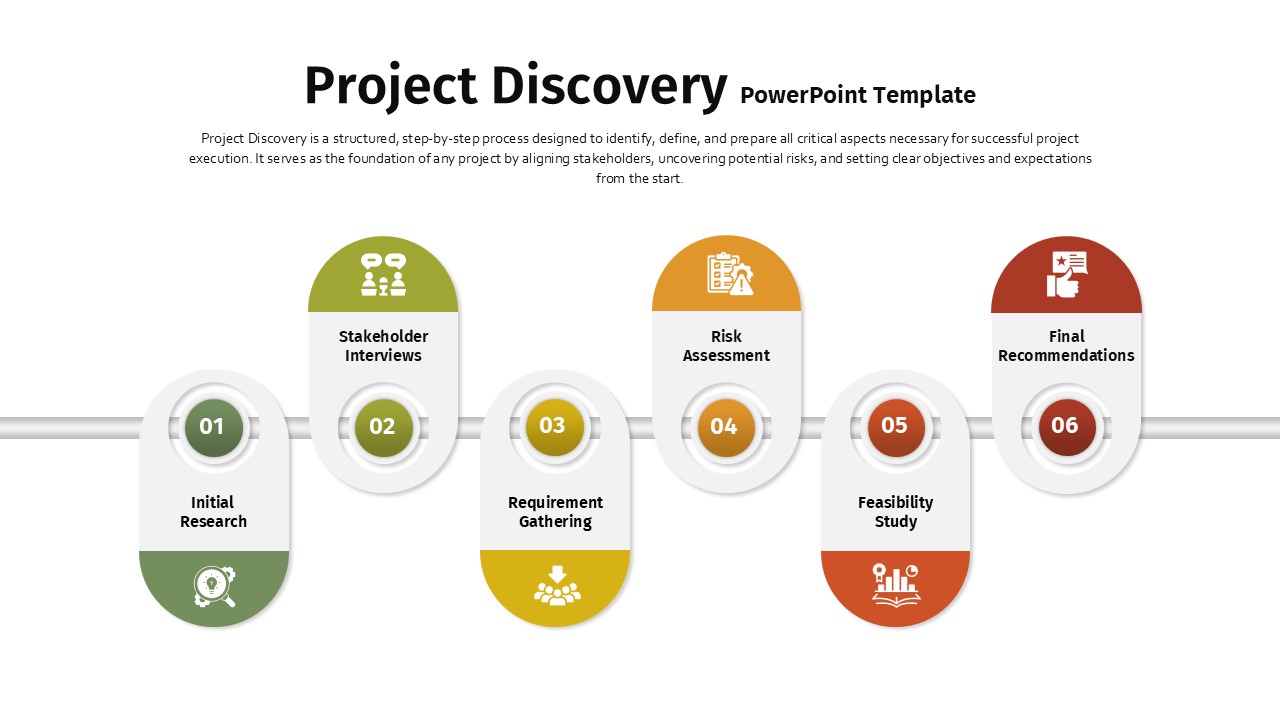
Project Discovery Infographic Pack Template for PowerPoint & Google Slides
Timeline
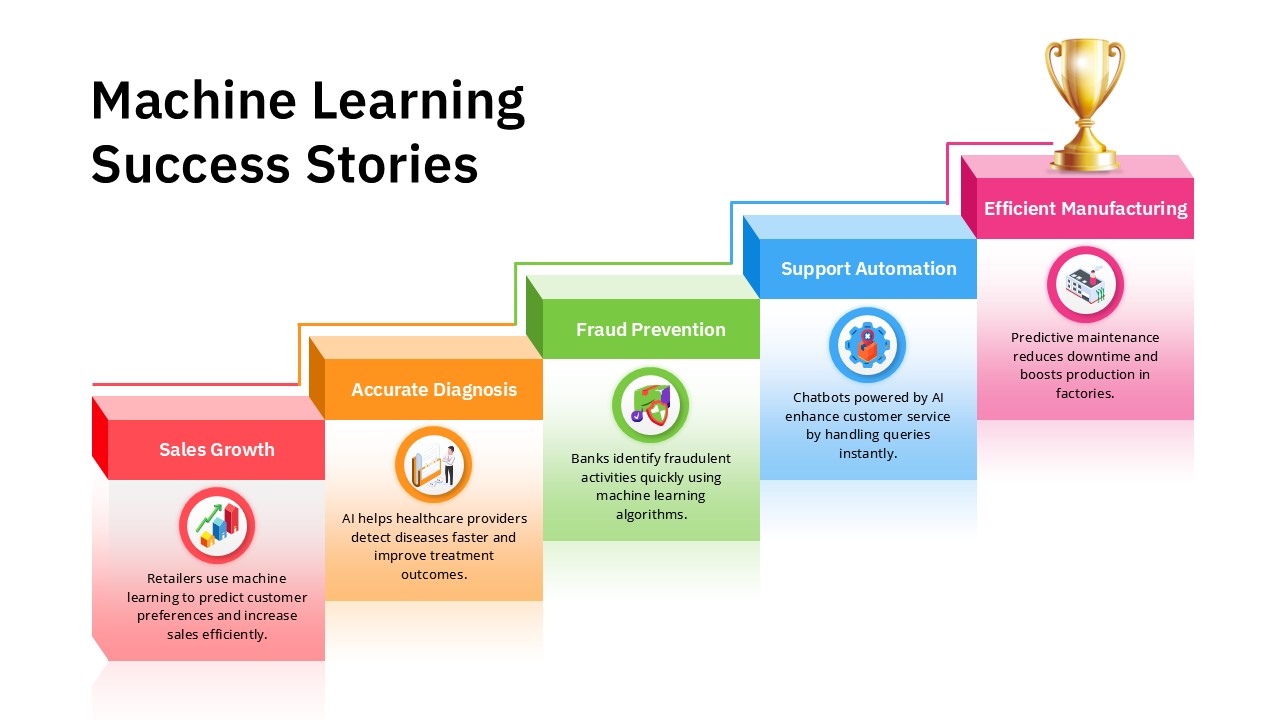
Machine Learning Success Stories Infographic Template for PowerPoint & Google Slides
Process
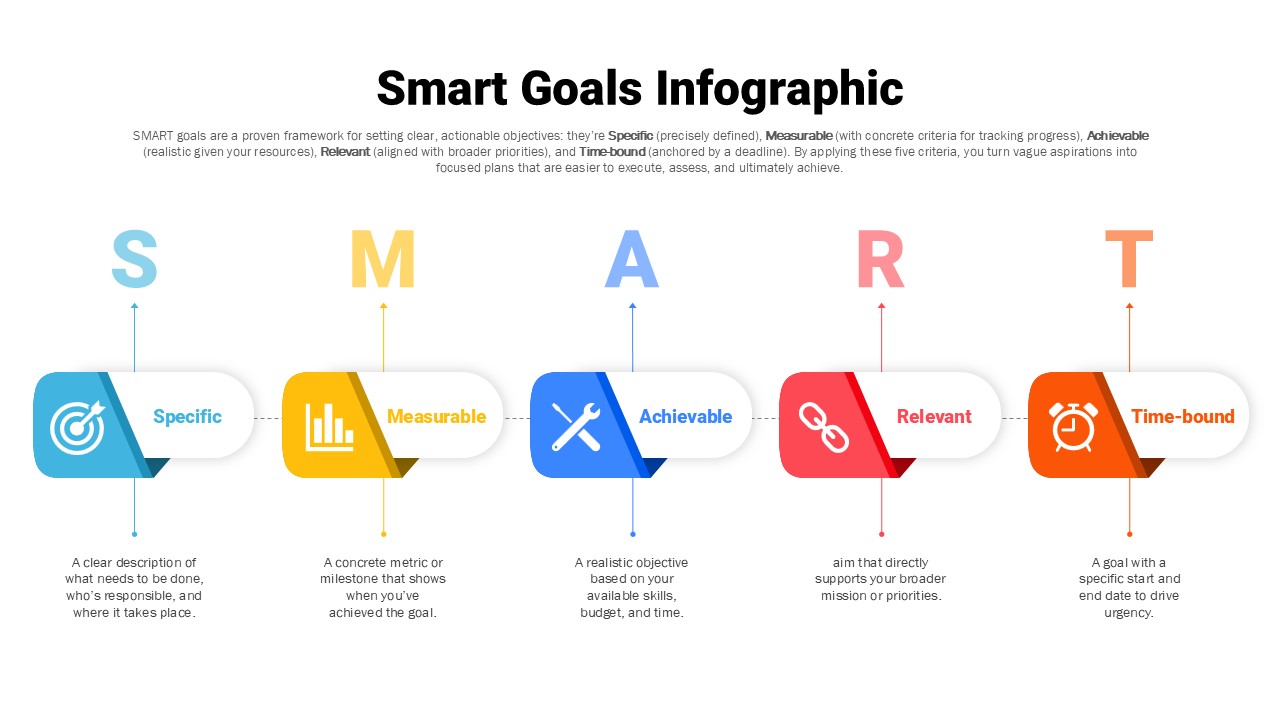
SMART Goals Infographic Template for PowerPoint & Google Slides
Goals