Bradley Curve Infographic Template for PowerPoint & Google Slides


Track Organizational Safety Culture with a Bradley Curve Template for PowerPoint
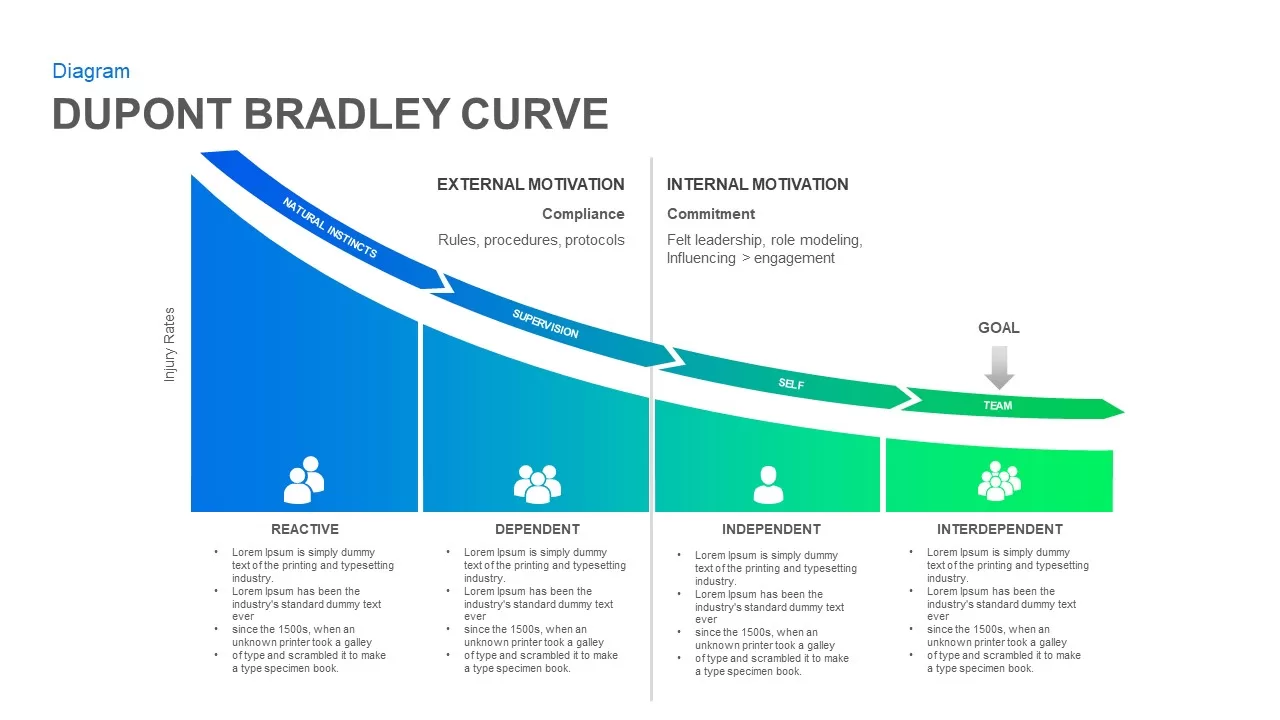
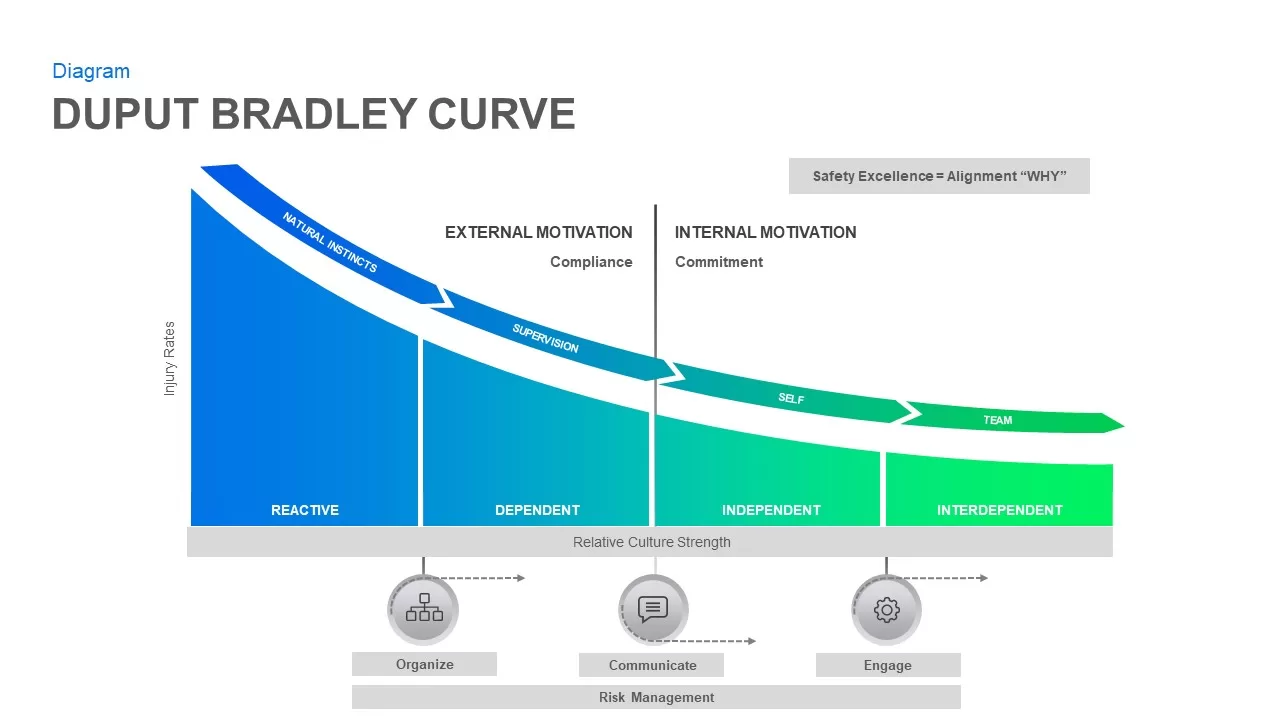
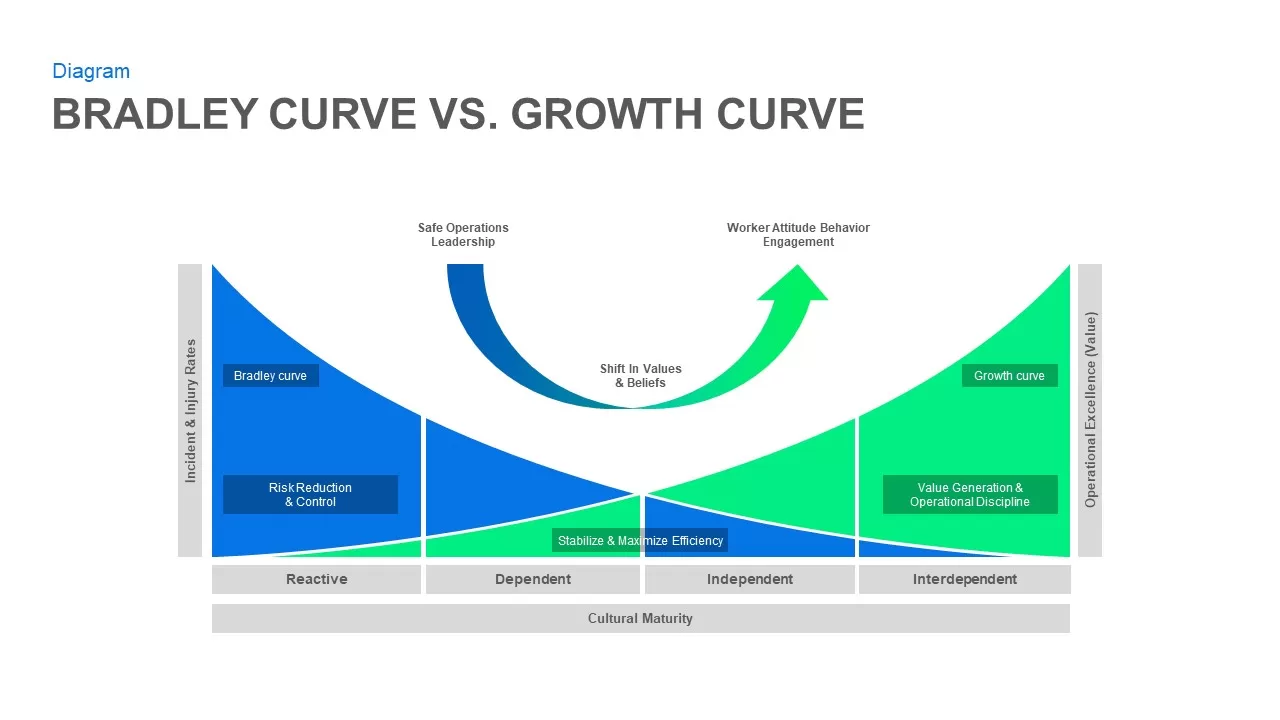
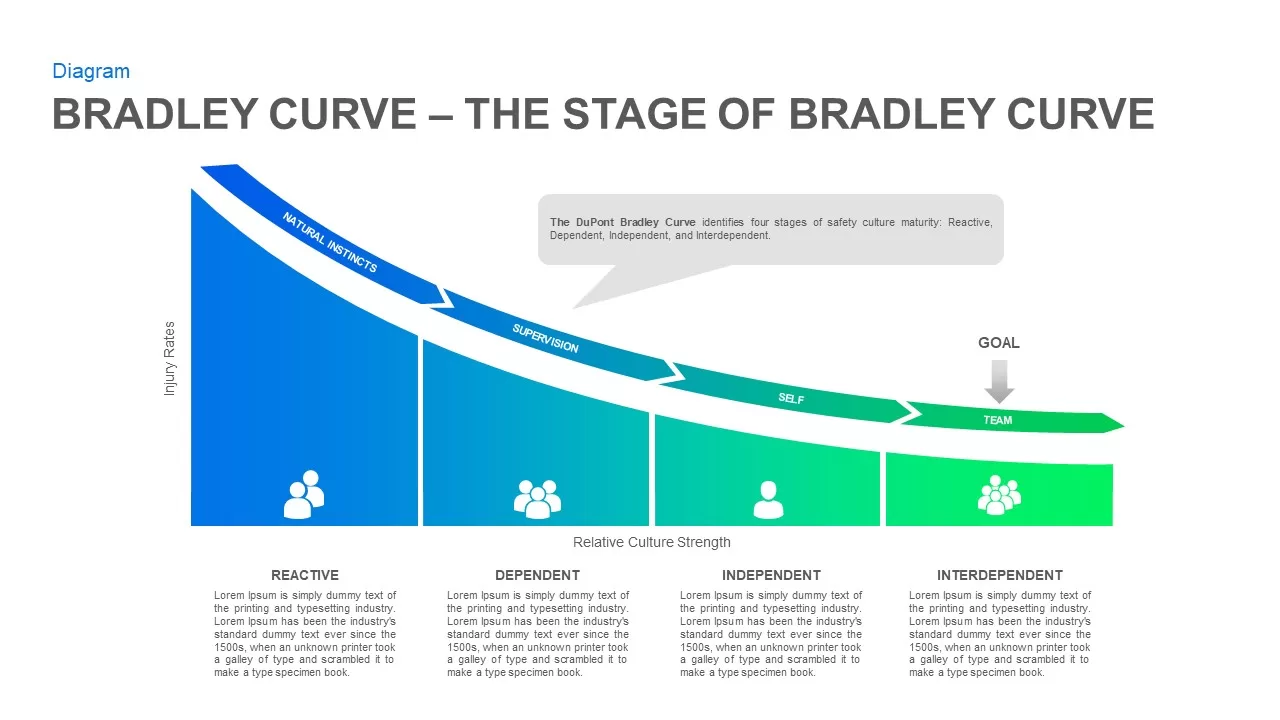
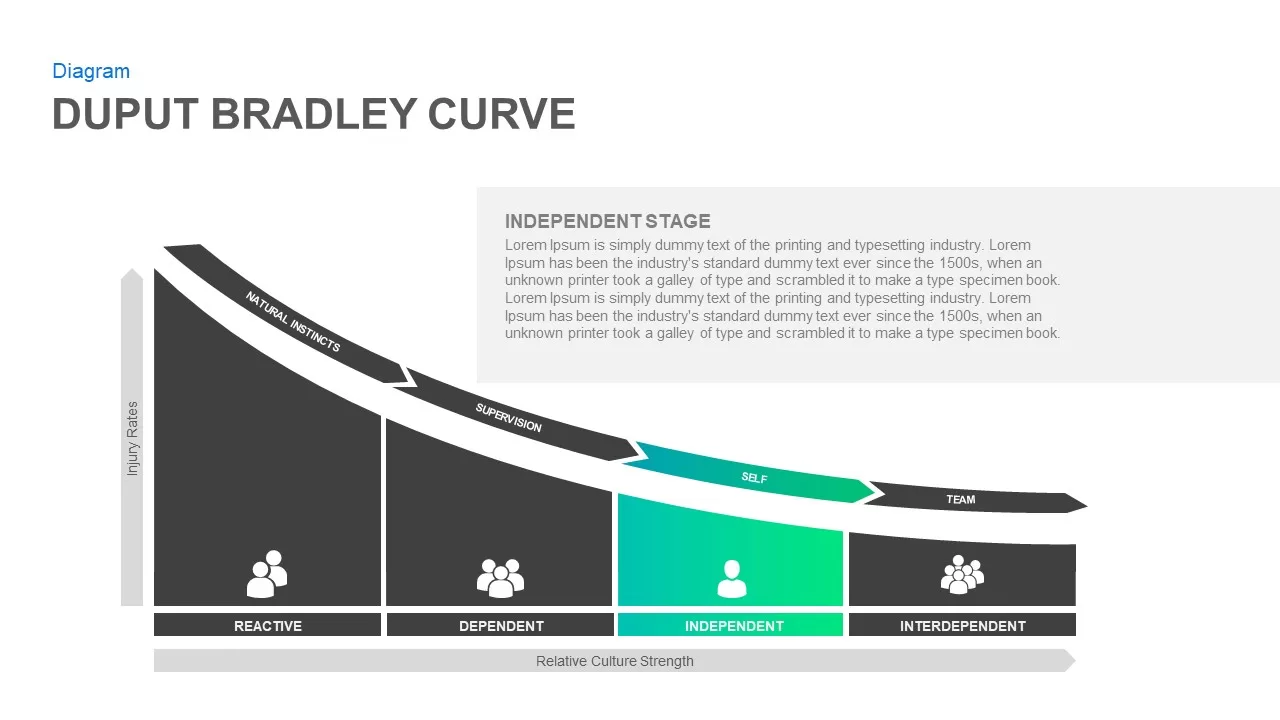
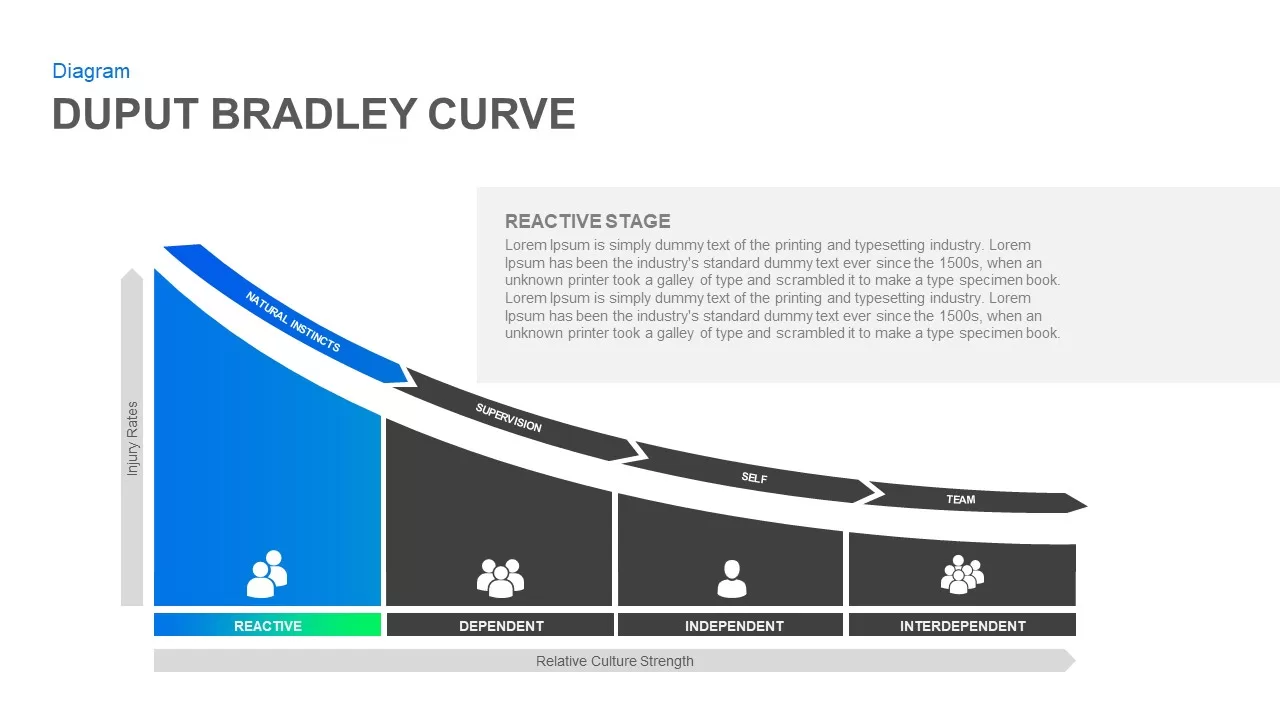
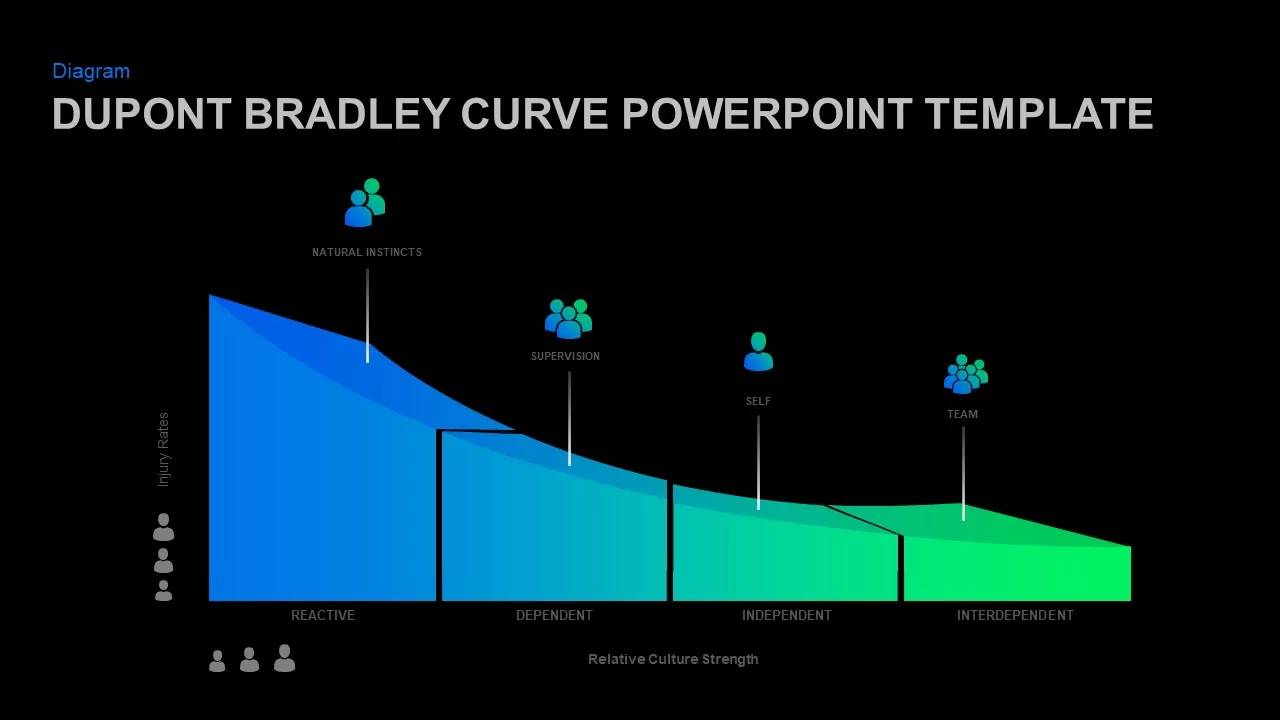
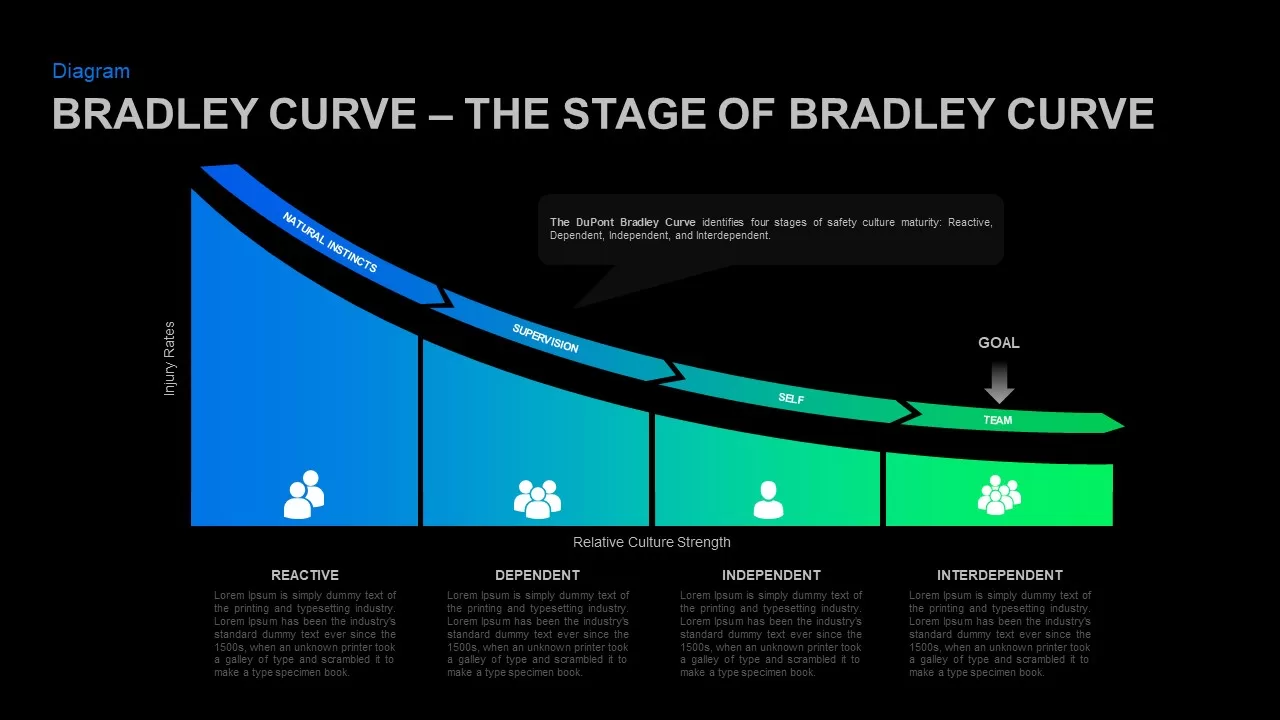
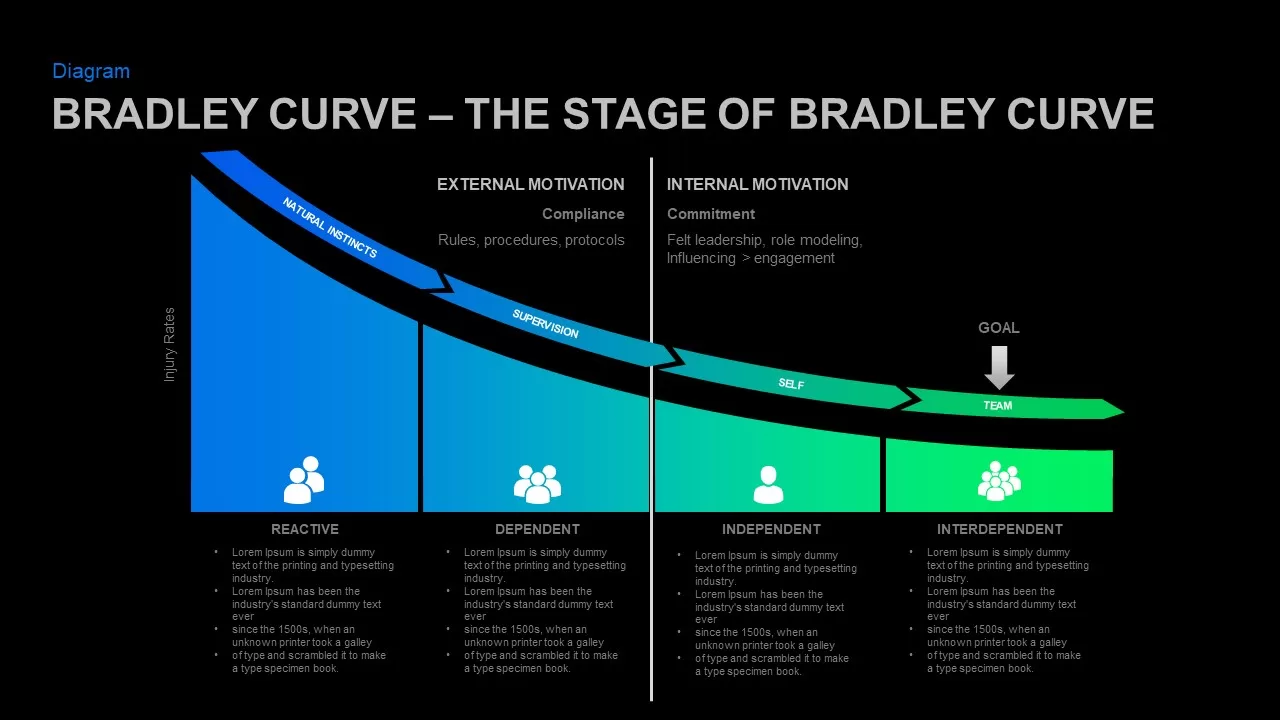
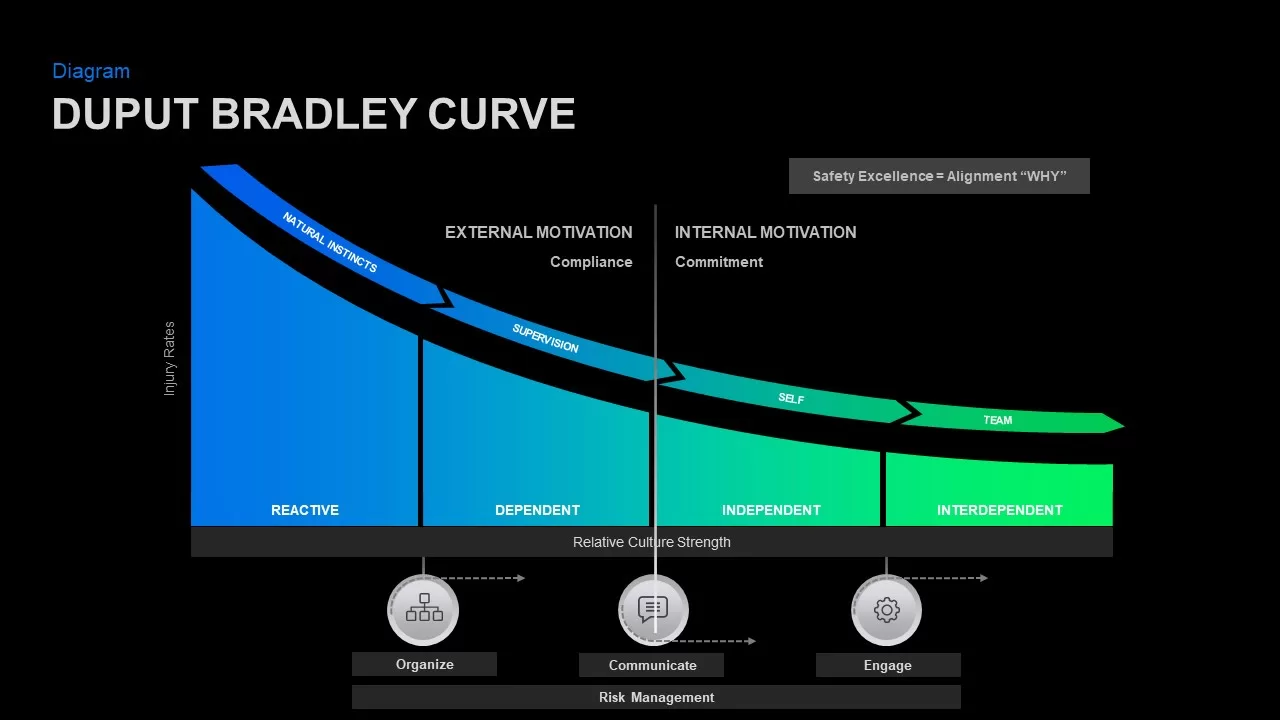
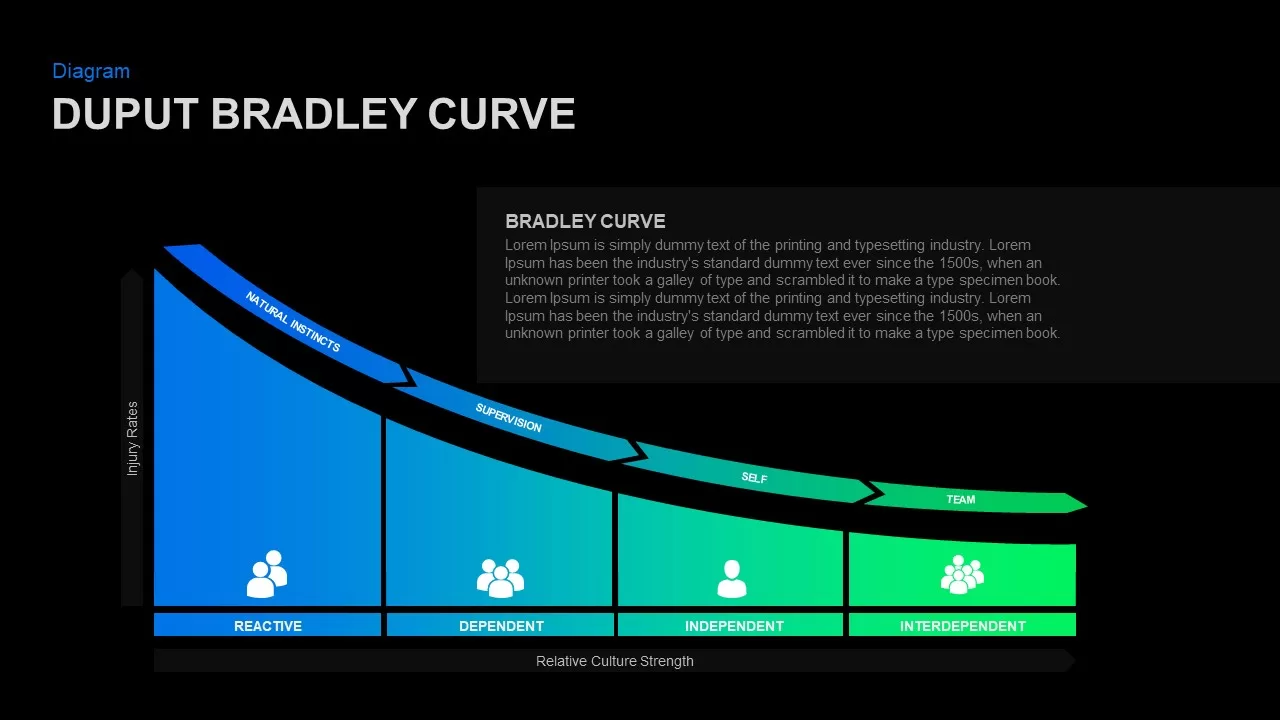
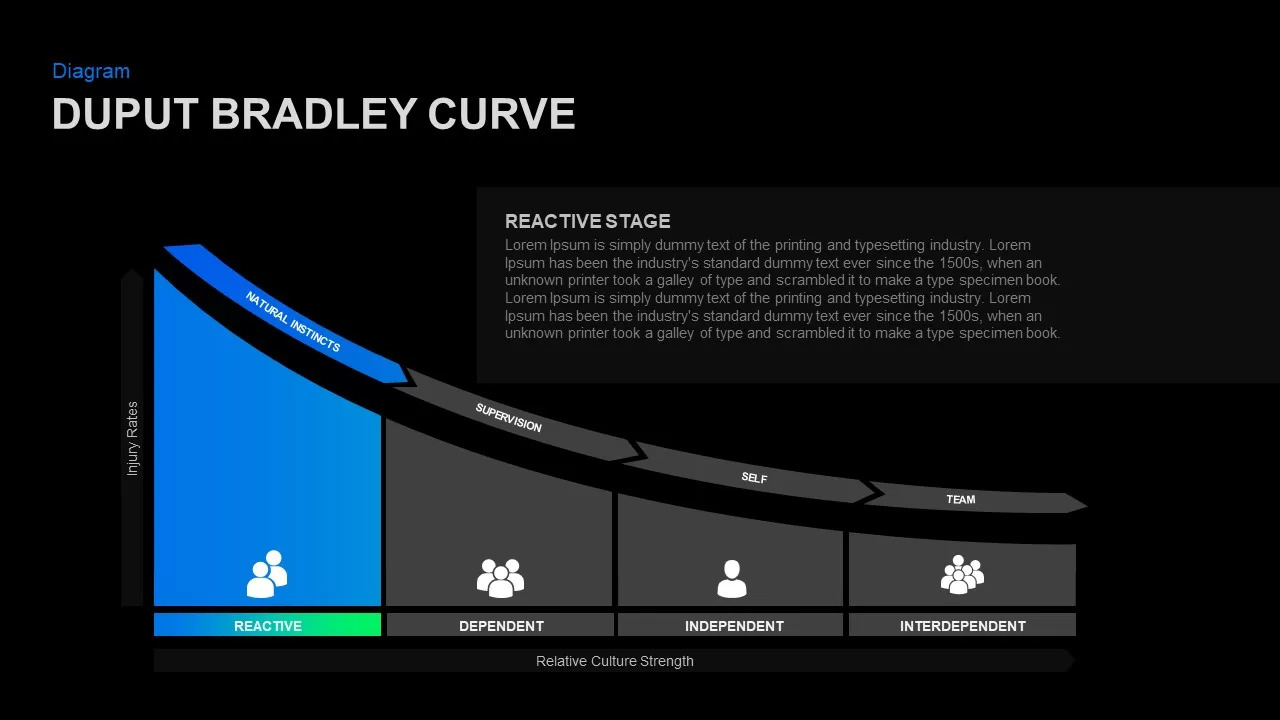
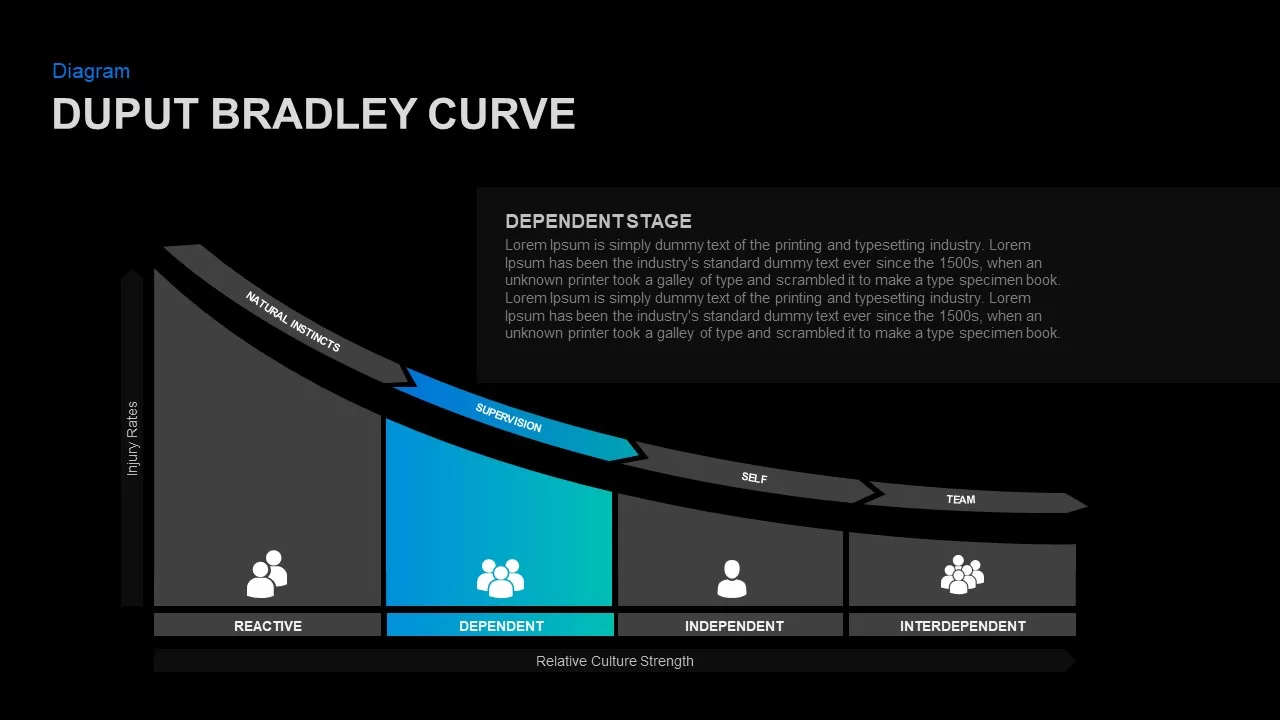
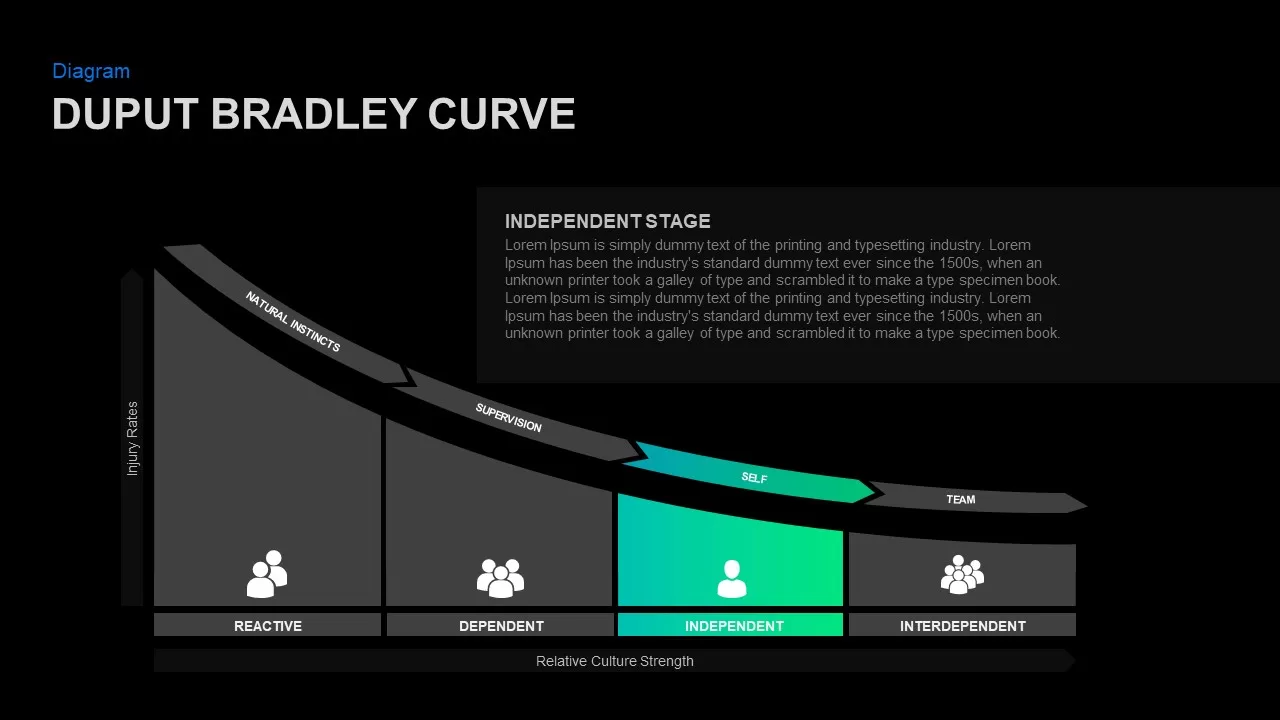
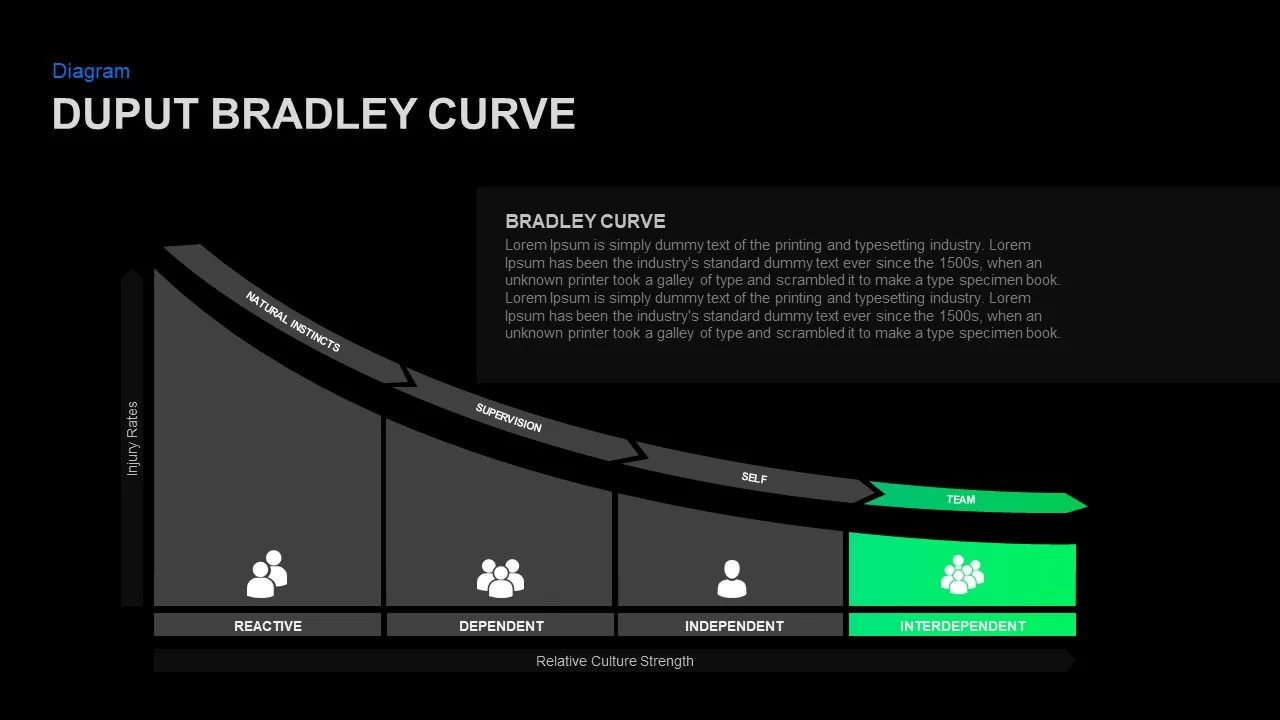
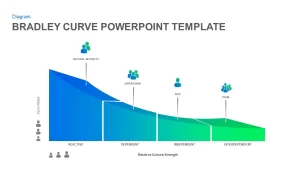
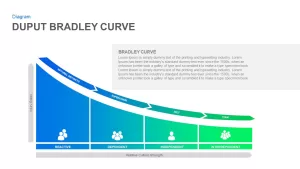
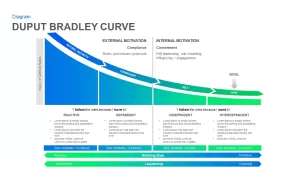
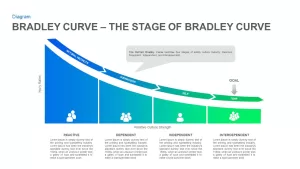
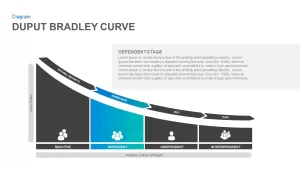
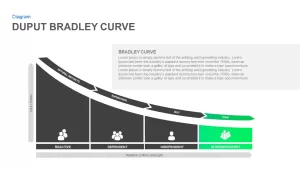
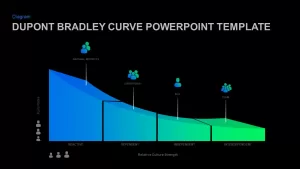
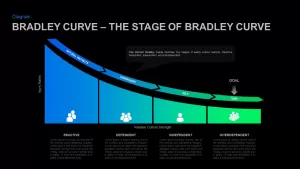
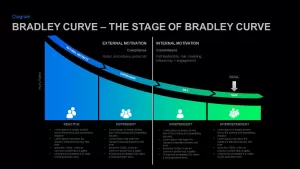
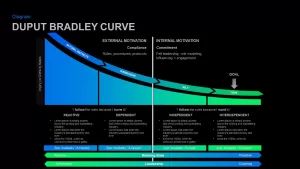
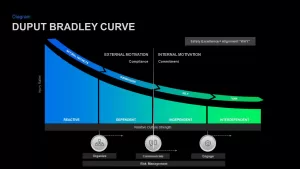
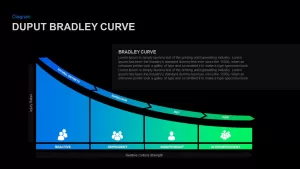
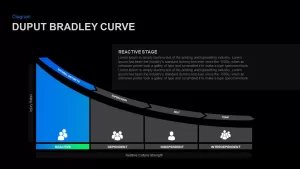
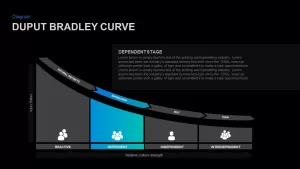
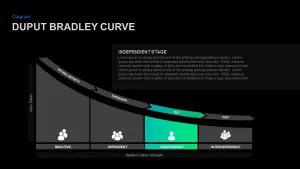
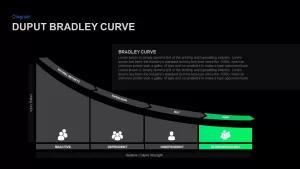
This dynamic set of 22 infographic slides presents the Bradley Curve, a proven model used to track and improve safety culture in organizations. Each slide is meticulously designed to visually convey the various stages of safety maturity, from Reactive and Dependent to Independent and Interdependent. Featuring clear and concise labels, intuitive iconography, and fluid gradient color schemes, this collection supports effective communication of culture evolution within teams.
Fully Customizable and Adaptable Layouts
The slides offer versatile layouts, ranging from diagrams and flowcharts to detailed analysis slides, making the collection ideal for internal safety programs, leadership presentations, and corporate training. These templates help communicate safety behaviors, leadership roles, and organizational transitions while maintaining a professional and polished look.
The highly adaptable structure allows users to modify text, icons, and colors for specific branding needs. Because every graphic element is fully editable, you can effortlessly tailor the visuals to match your company design guidelines.
Highly Versatile for PowerPoint and Google Slides
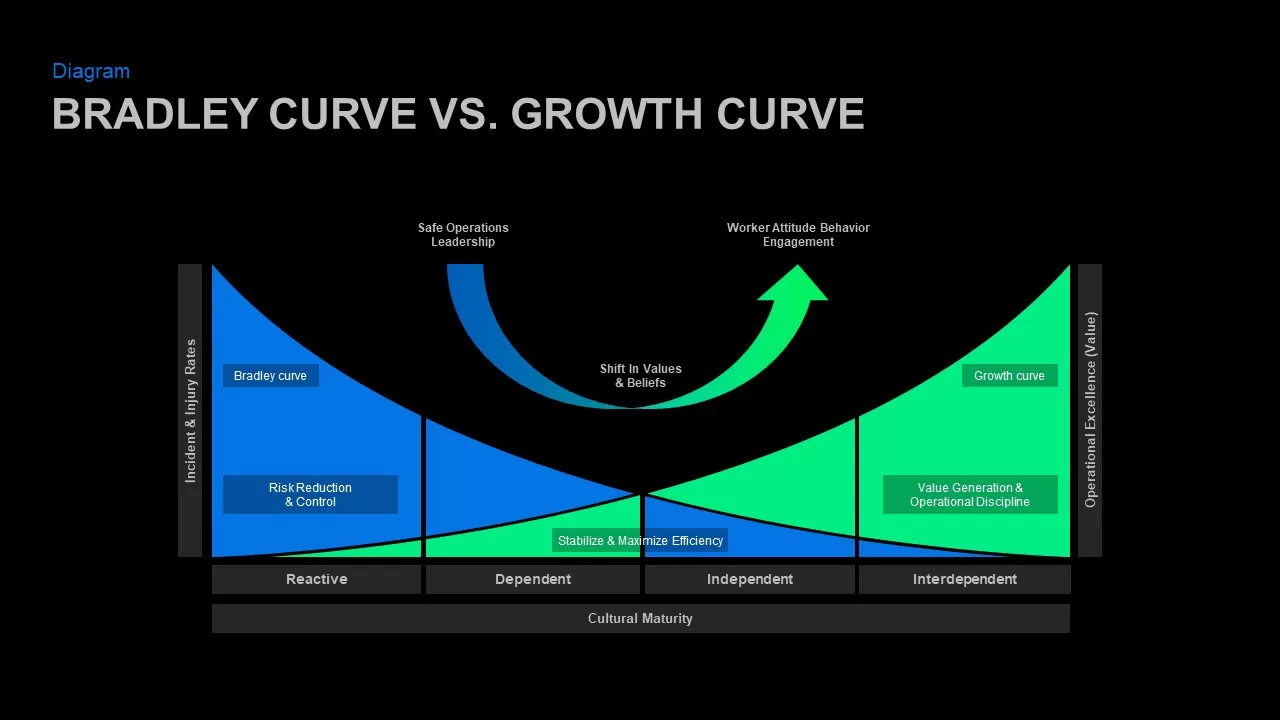
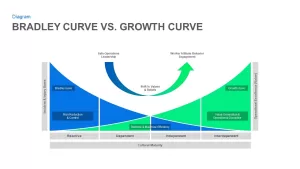
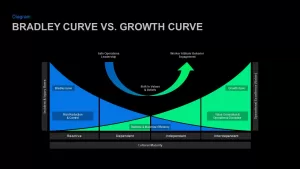
Whether you are presenting safety milestones, tracking team growth, or strategizing cultural transformation, this set makes it easier to depict how each stage influences organizational performance and results. This collection is engineered to be highly flexible and is optimized for flawless performance in both PowerPoint and Google Slides. You can work directly within your preferred platform without worrying about formatting errors or font misalignments.
By utilizing these customizable layouts, you can effectively demonstrate how a proactive approach leads to fewer incidents and a more engaged workforce.
Who is it for
This infographic template is perfect for safety managers, HR professionals, leadership trainers, and organizational development consultants. It is also ideal for corporate trainers and safety committee leaders who need to demonstrate the progression of a company safety culture, shifting teams from basic compliance to proactive engagement.
Other Uses
Beyond safety culture assessments, you can easily repurpose this deck for organizational behavior studies, leadership development training, employee engagement surveys, or to analyze organizational transformation in various sectors. It also works well for illustrating the progression of any team dynamic or maturity model, helping to map change management processes across different industries.
Login to download this file

Item ID
SB01784
Related Templates

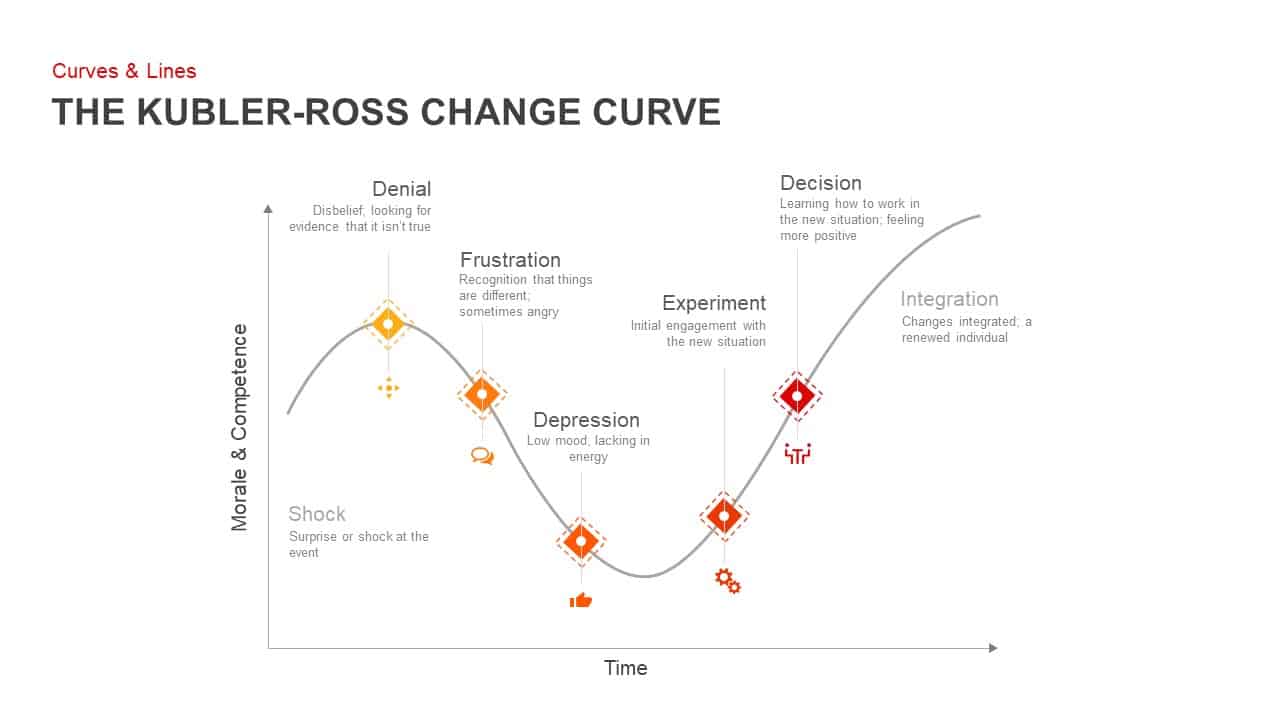
Kubler-Ross Change Curve Diagram Template for PowerPoint & Google Slides
Timeline
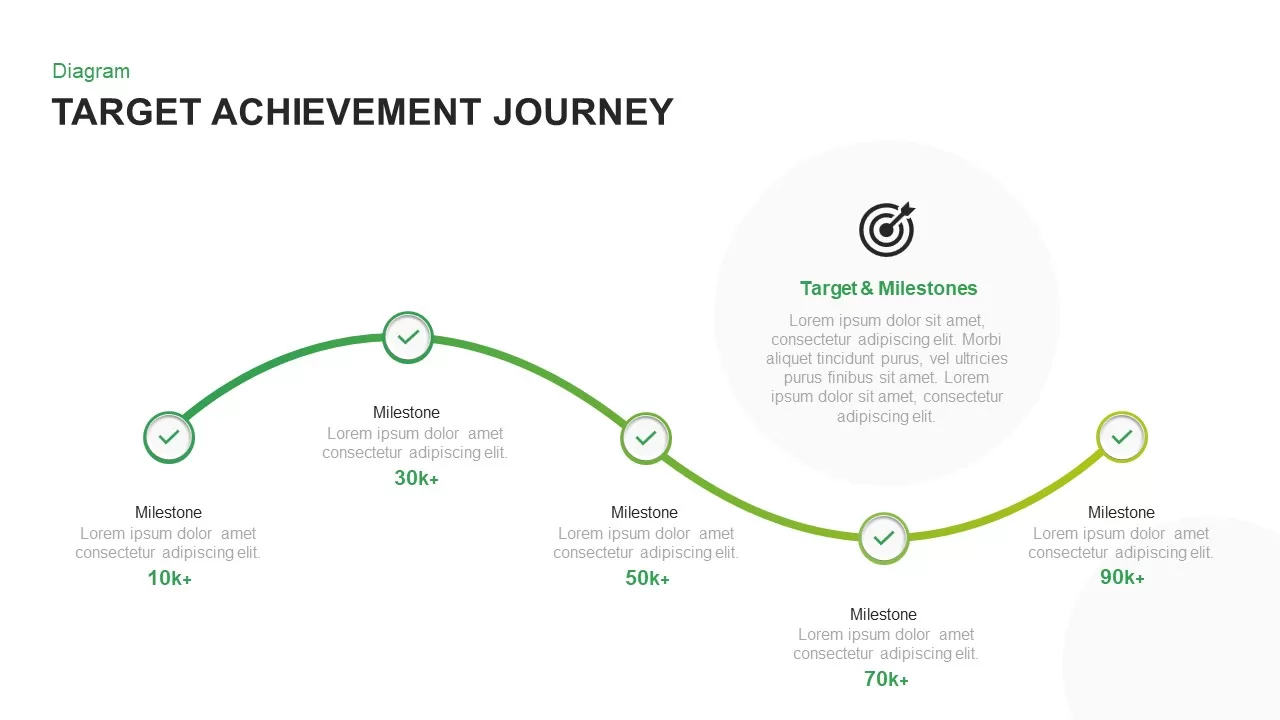
Target Achievement Milestone Curve Template for PowerPoint & Google Slides
Roadmap

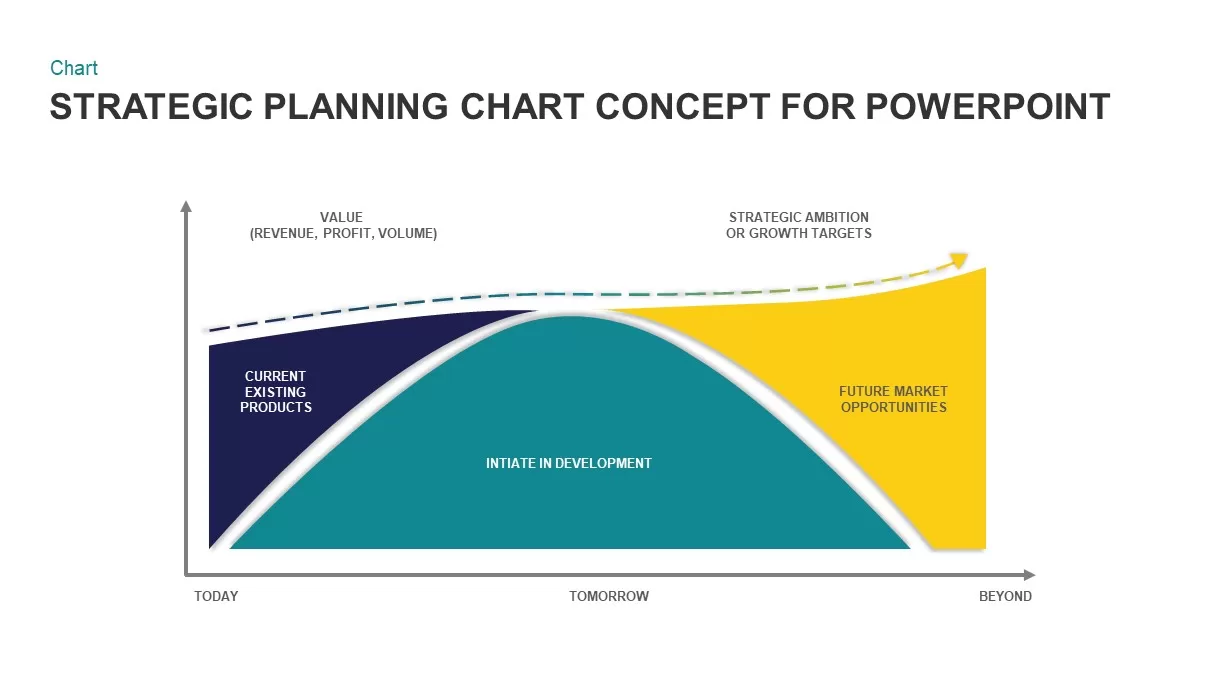
Strategic Planning Curve Diagram Template for PowerPoint & Google Slides
Charts
Greiner’s Growth Model Curve template for PowerPoint & Google Slides
Infographics
Snake Shaped Curve Diagram template for PowerPoint & Google Slides
Business
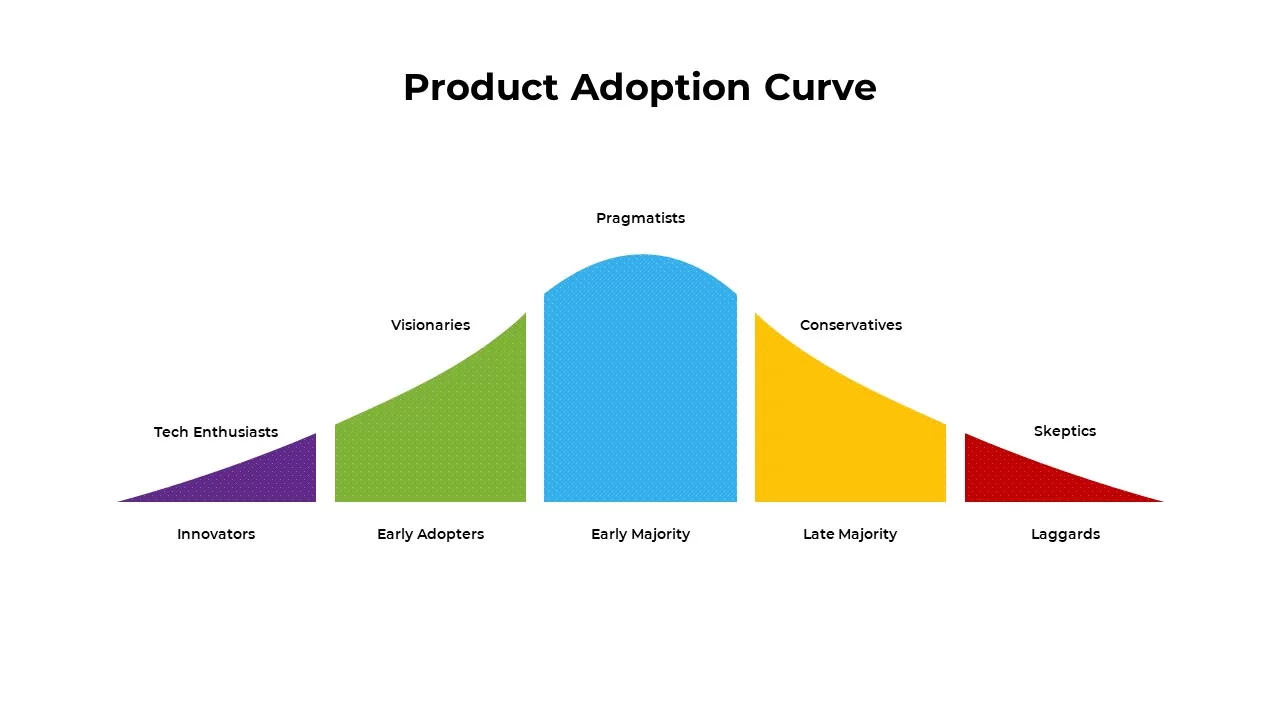
Product Adoption Curve Template for PowerPoint & Google Slides
Process
S-Curve Progression Framework Diagram Template for PowerPoint & Google Slides
Charts
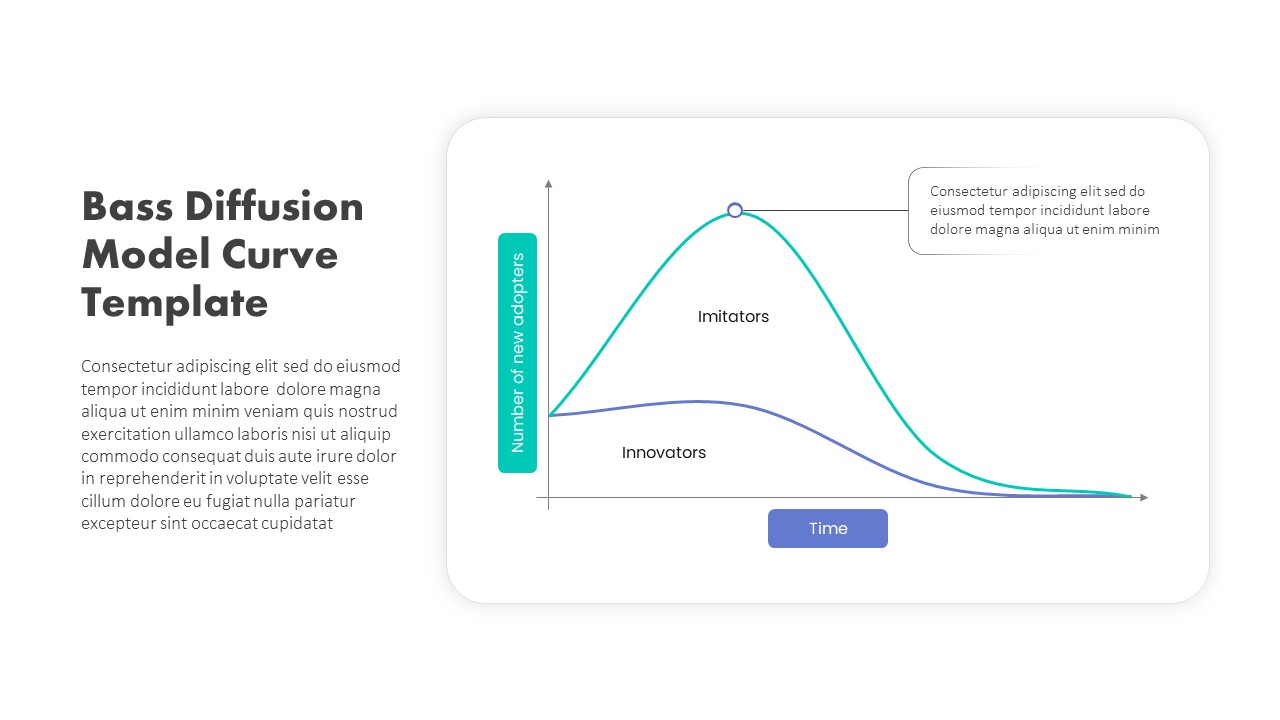
Bass Diffusion Model Curve for Adoption Template for PowerPoint & Google Slides
Comparison Chart
Growth Curve Line Chart Visualization Template for PowerPoint & Google Slides
Charts
Experience Curve Analysis Diagram Template for PowerPoint & Google Slides
Business Strategy
Economies of Scale PowerPoint Template
Comparison Chart
Gartner Hype Cycle Adoption Curve Diagram Template for PowerPoint & Google Slides
Infographics
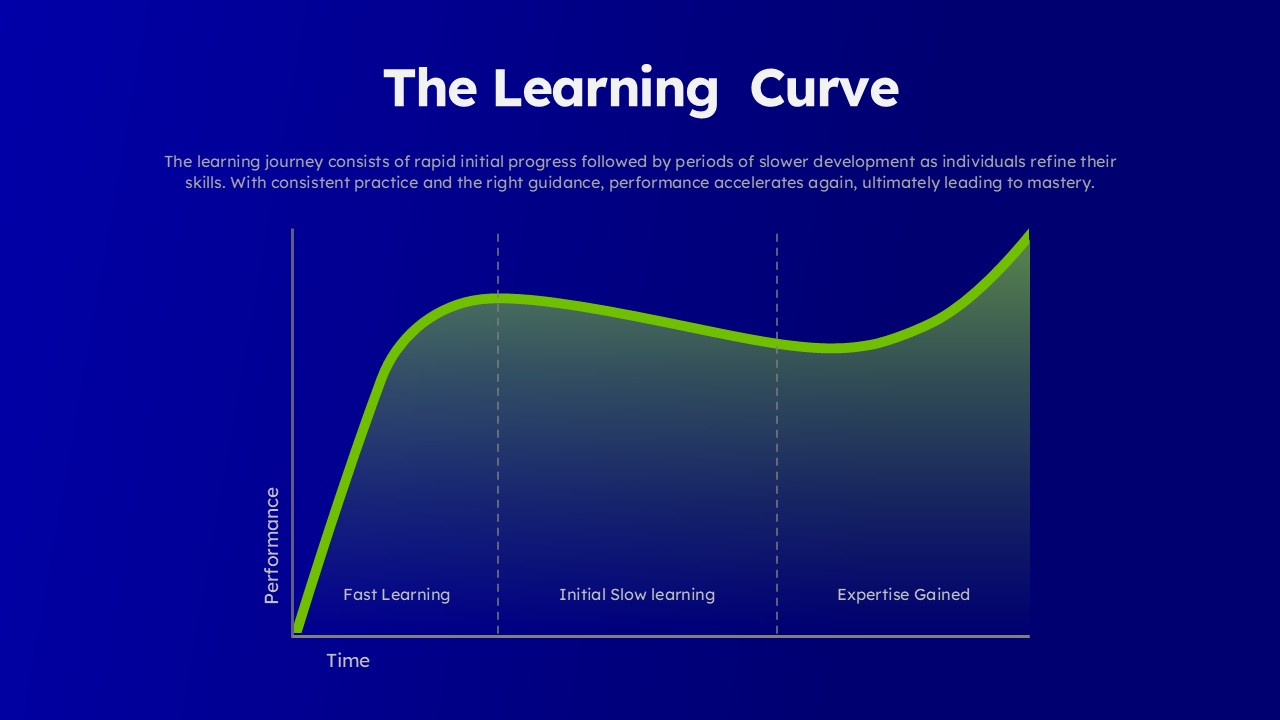
Learning Curve Performance Growth Chart Template for PowerPoint & Google Slides
Employee Performance
Bell Curve PowerPoint Template
Comparison Chart
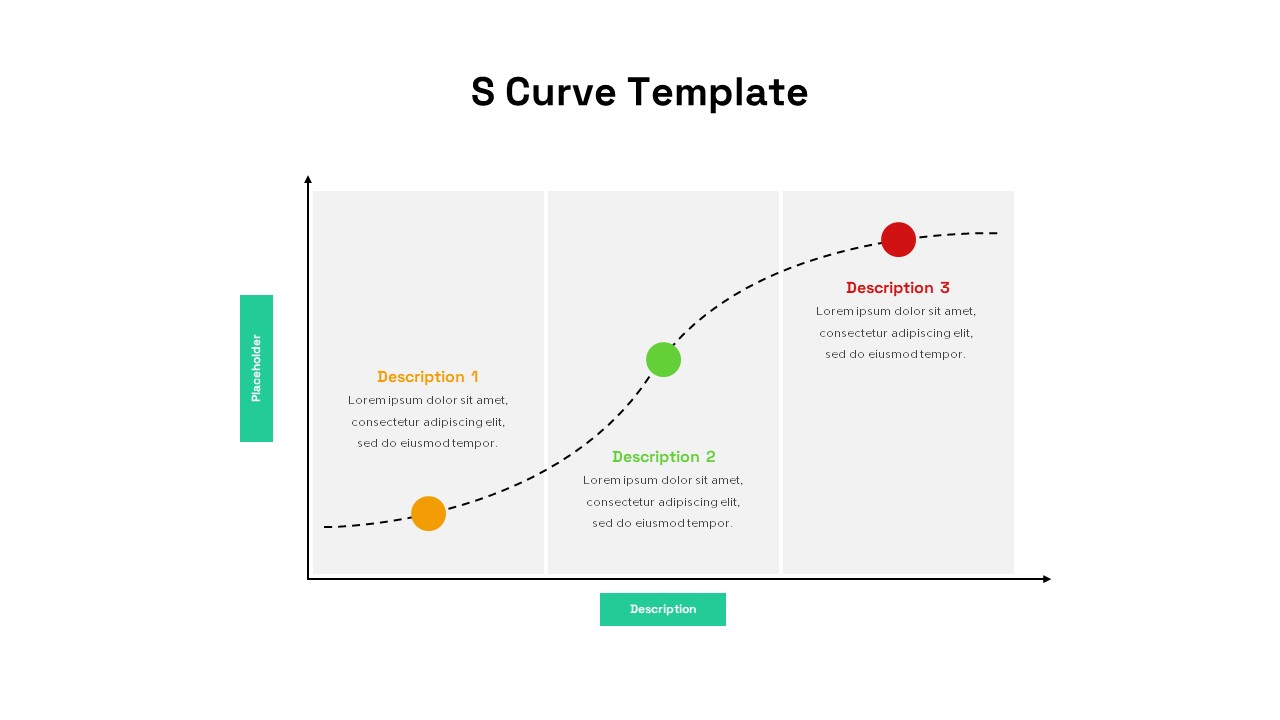
S Curve Template For PowerPoint
Process
Google Ads Optimization & Performance Infographic Template for PowerPoint & Google Slides
Digital Marketing
Casino/Poker Chips Infographic Slides template for PowerPoint & Google Slides
Business Strategy
Quad Chart Infographic Pack of 8 Slides Template for PowerPoint & Google Slides
Comparison Chart
Four Options Infographic Slides Template for PowerPoint & Google Slides
Comparison
Game Plan Infographic Slides Pack Template for PowerPoint & Google Slides
Infographics