



















































Cladogram Infographic Template
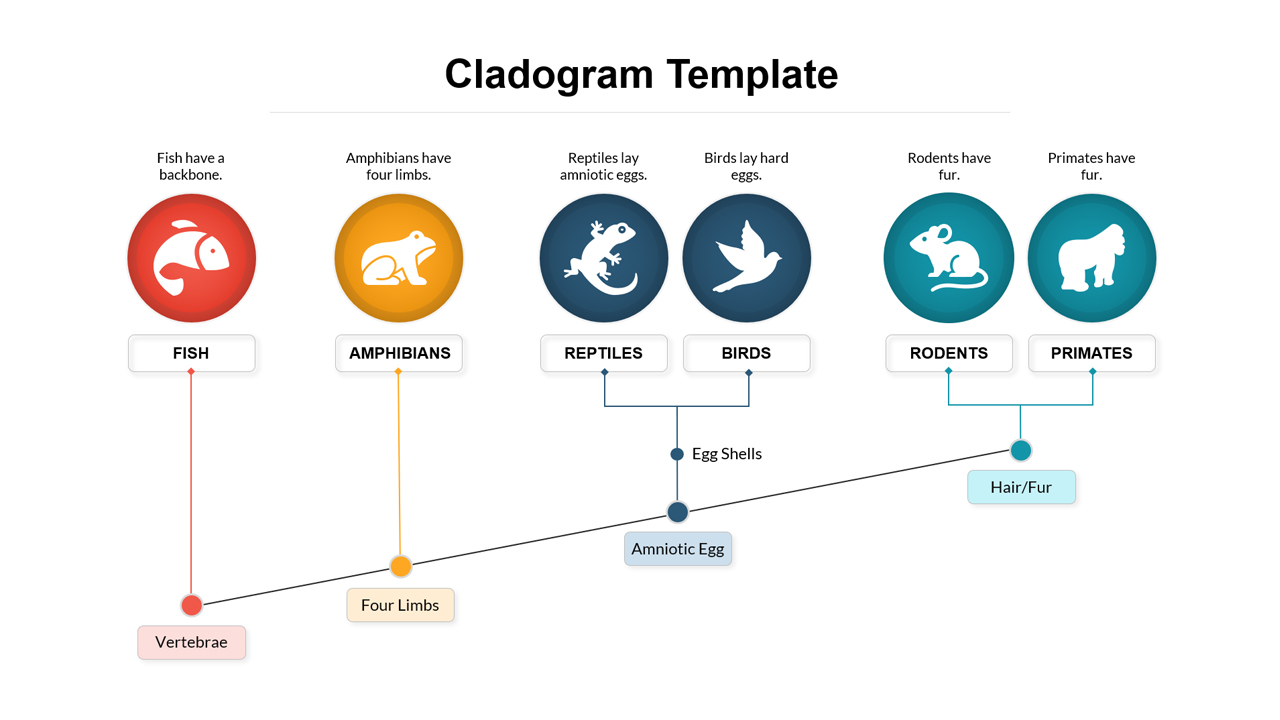
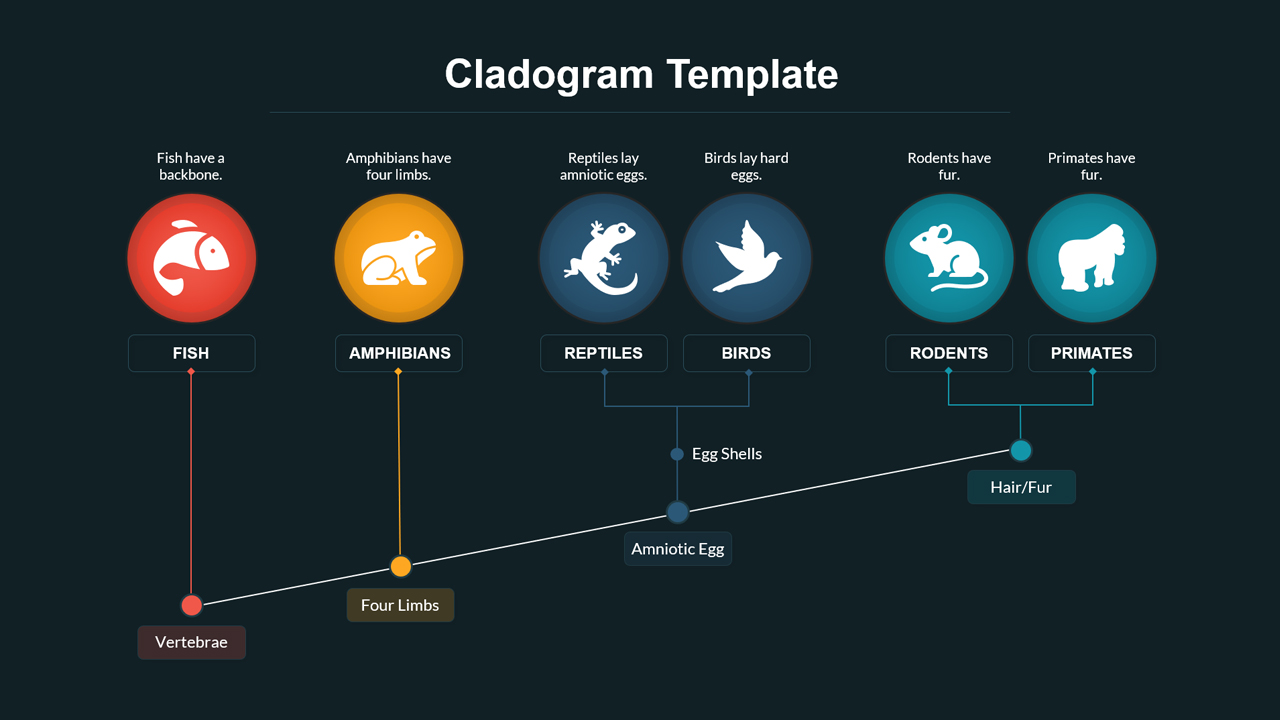
Explain evolutionary relationships and biological classification with this clean and structured cladogram diagram infographic slide. The layout presents a horizontal evolutionary timeline with branching paths that clearly illustrate shared characteristics and divergence among species groups. Each organism category such as fish, amphibians, reptiles, birds, rodents, and primates is represented by a bold circular icon and label, making the diagram intuitive and visually engaging. Key evolutionary traits, including vertebrae, four limbs, amniotic eggs, eggshells, and hair or fur, are highlighted along the baseline with connector nodes that show exactly where each characteristic emerges. The balanced use of icons, lines, and callout labels ensures complex scientific relationships are easy to follow at a glance.
Designed for clarity and adaptability, this cladogram slide is fully editable in PowerPoint and Google Slides. Users can modify text, swap icons, adjust colors, or extend branches to represent different species sets or learning objectives. The minimalist white background combined with vibrant accent colors keeps attention focused on the data, making it suitable for both classroom instruction and professional presentations. This visual framework helps transform abstract evolutionary concepts into a logical, step-by-step story. This slide is ideal for biology teachers, students, academic researchers, and educational presenters explaining evolution, taxonomy, or comparative anatomy. It is also useful for curriculum designers, e-learning developers, and science communicators who need clear visual aids.
Login to download this file

Item ID
SB05632Designed By
Gopika


