BMI Category Comparison Chart Template for PowerPoint & Google Slides

Description
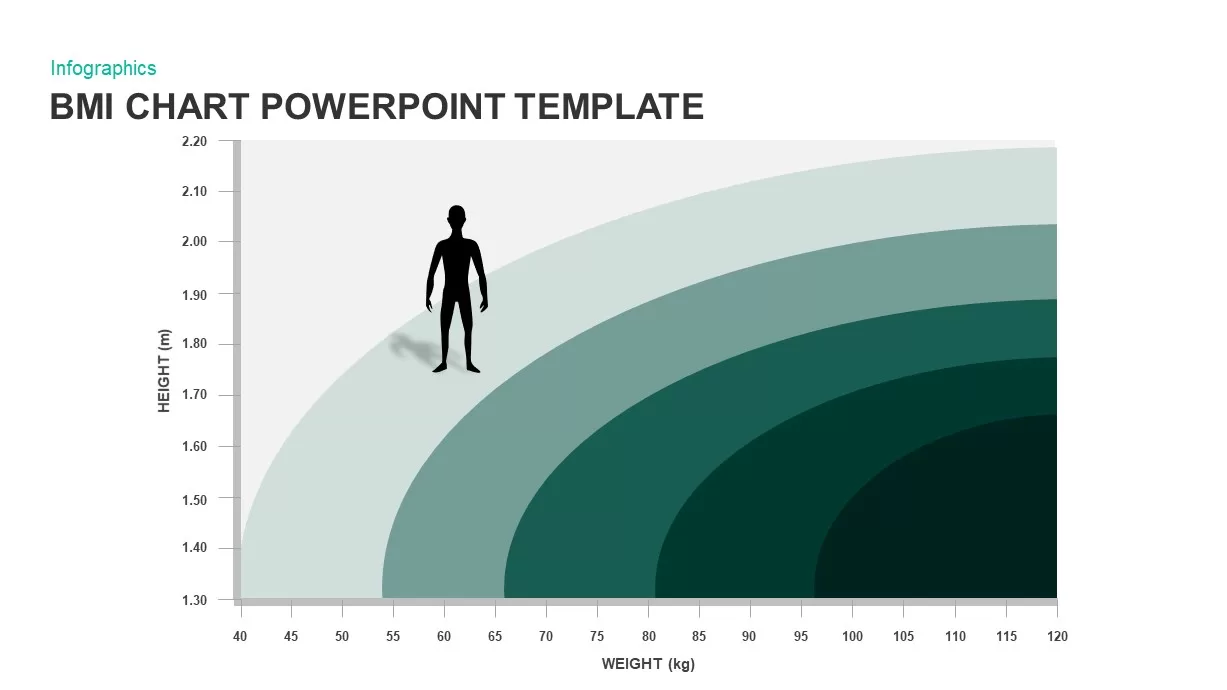
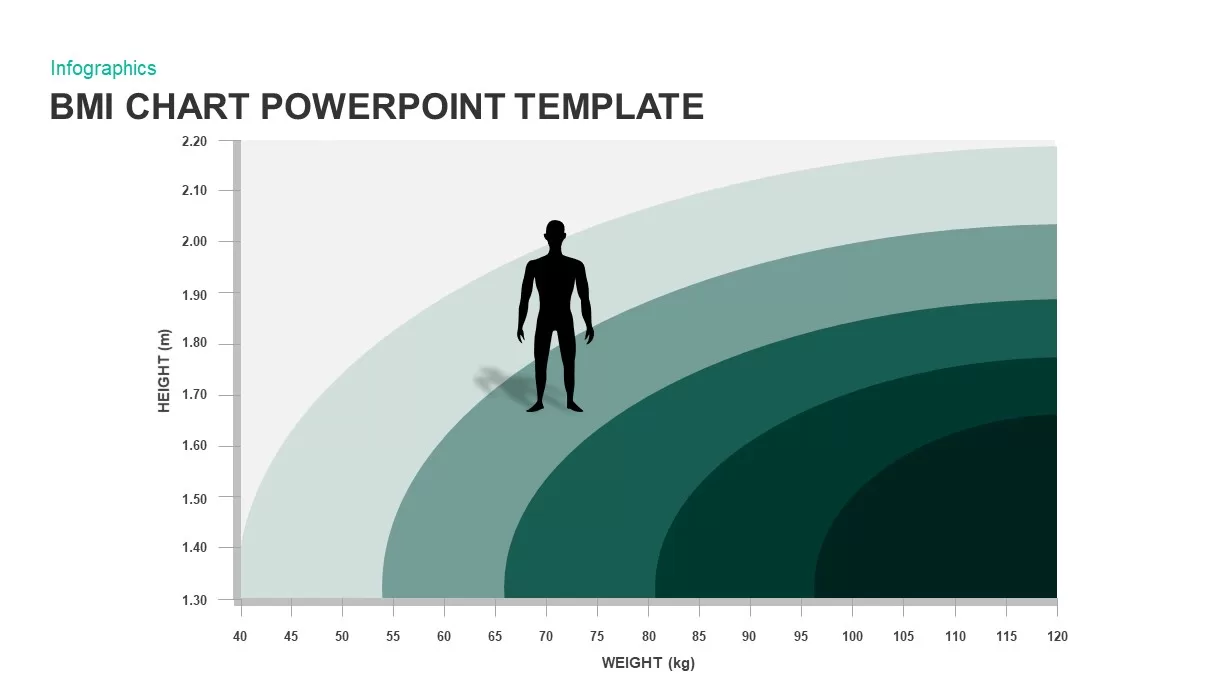
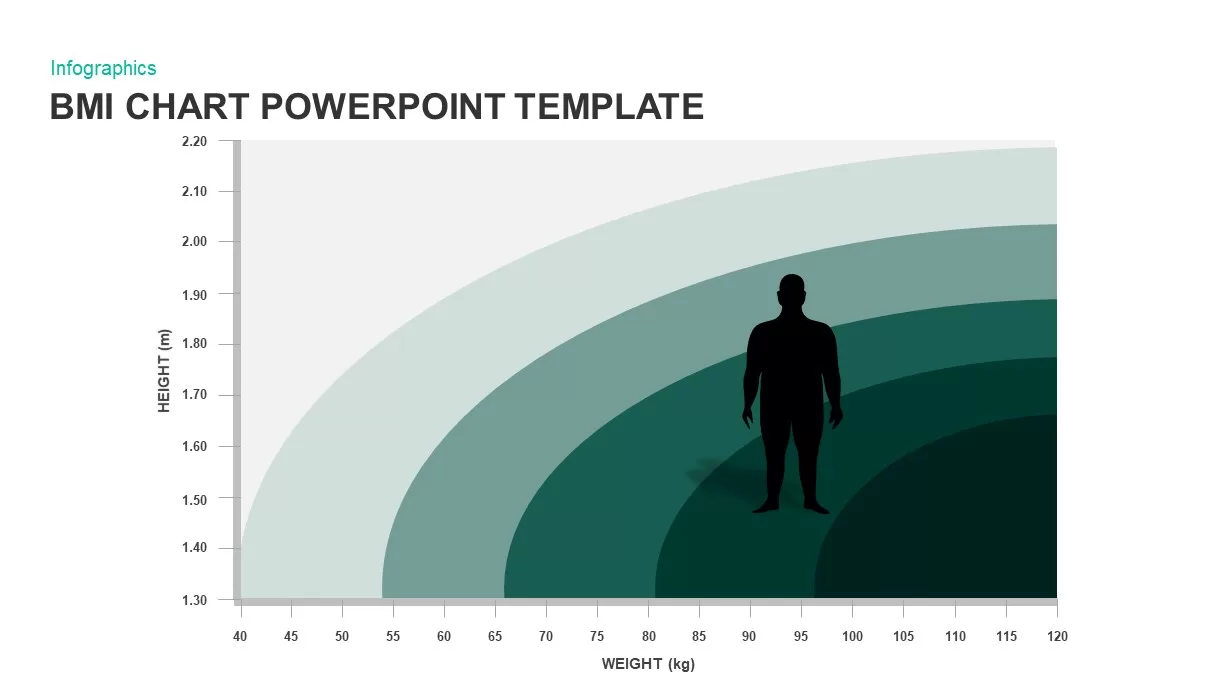
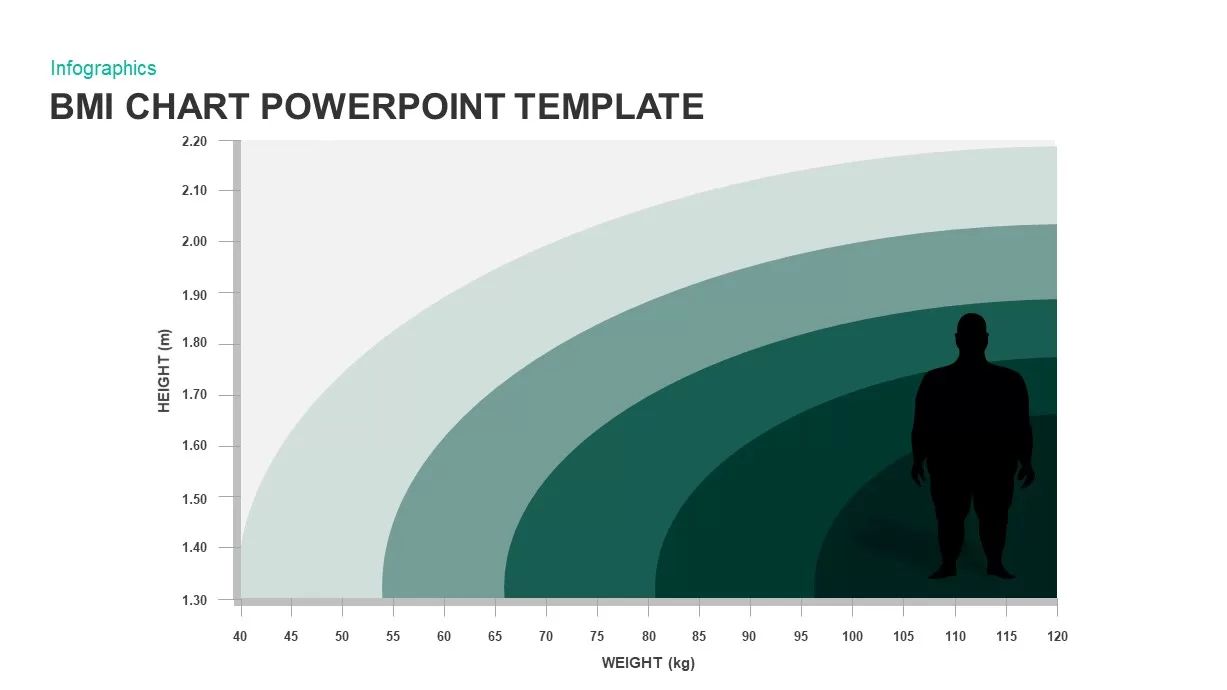
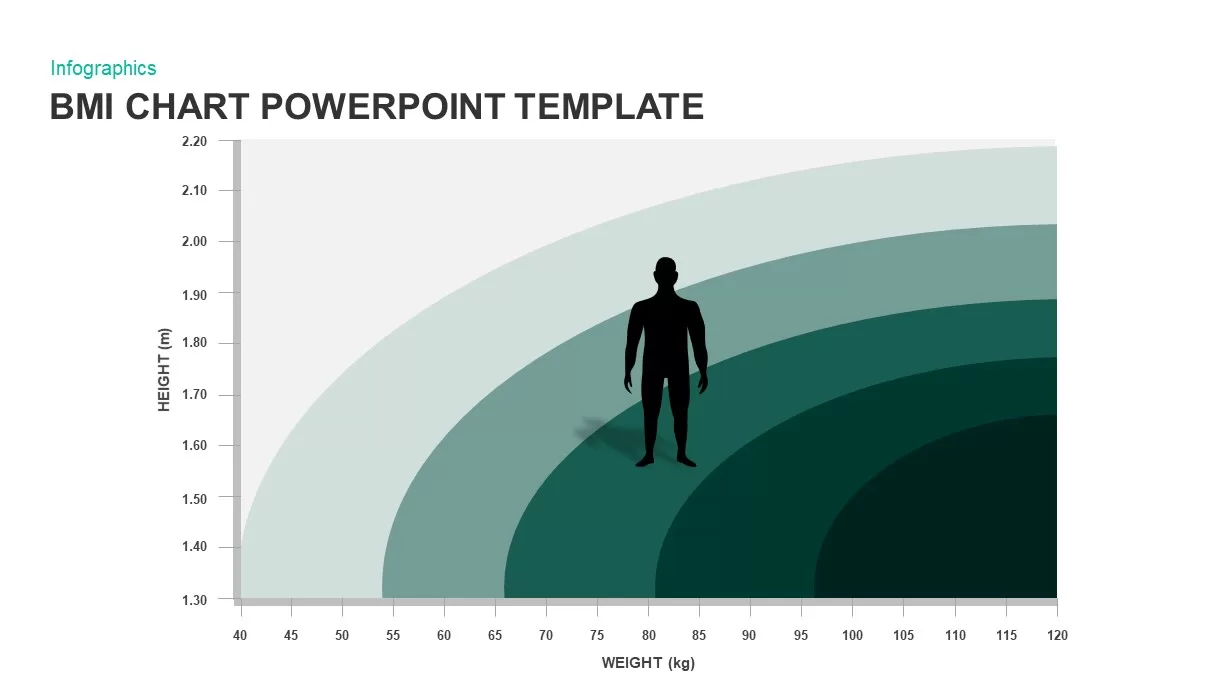
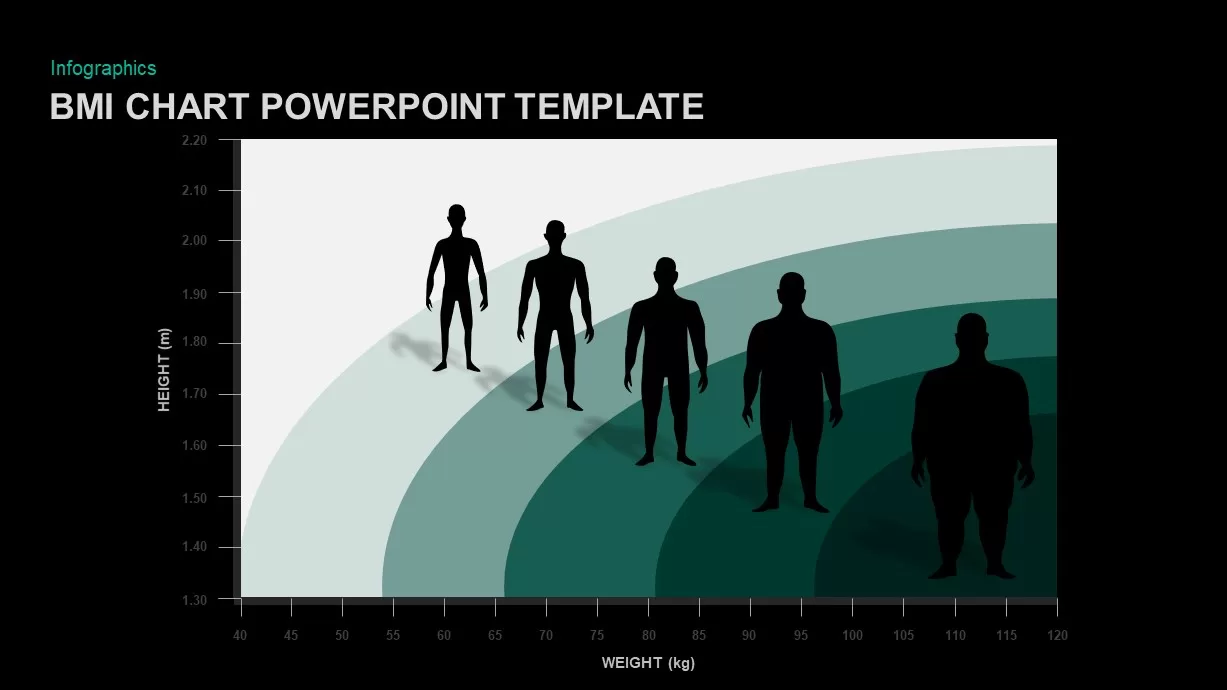
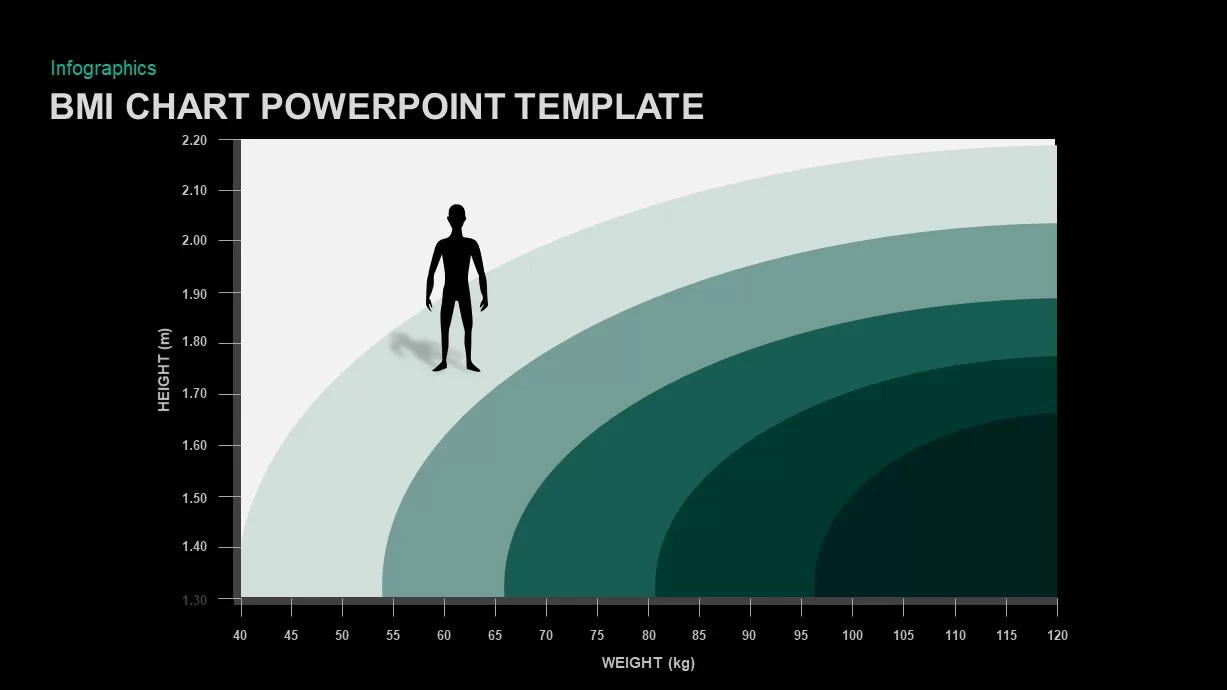
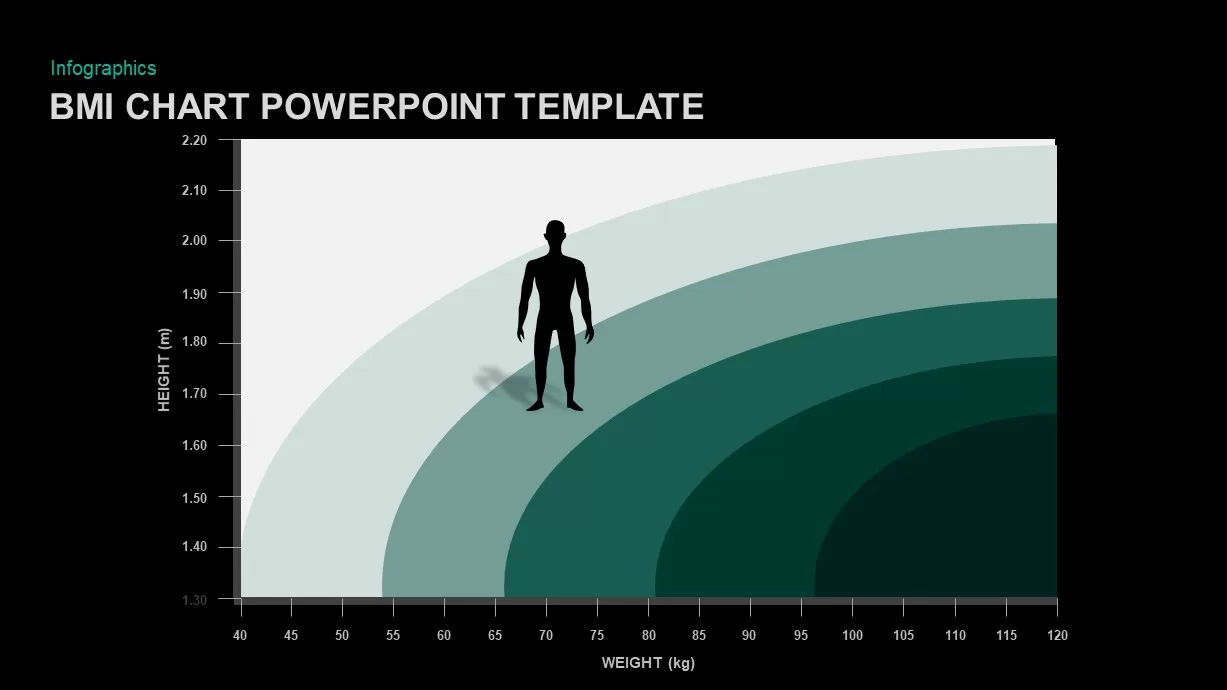
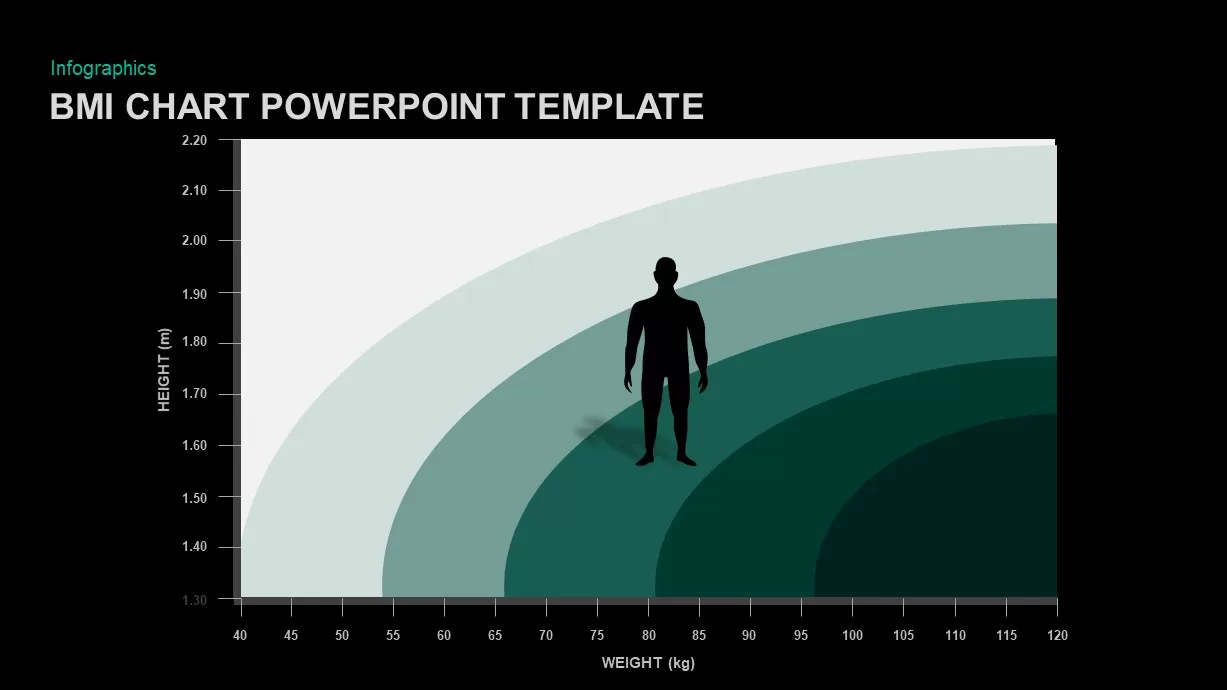
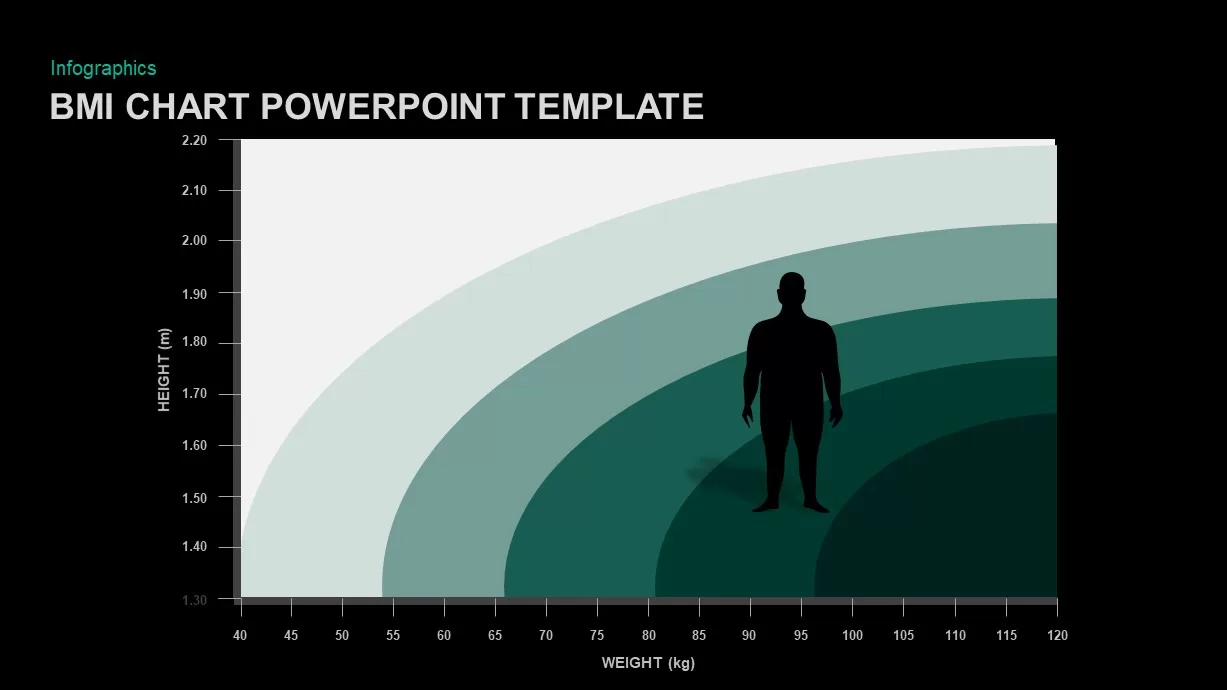
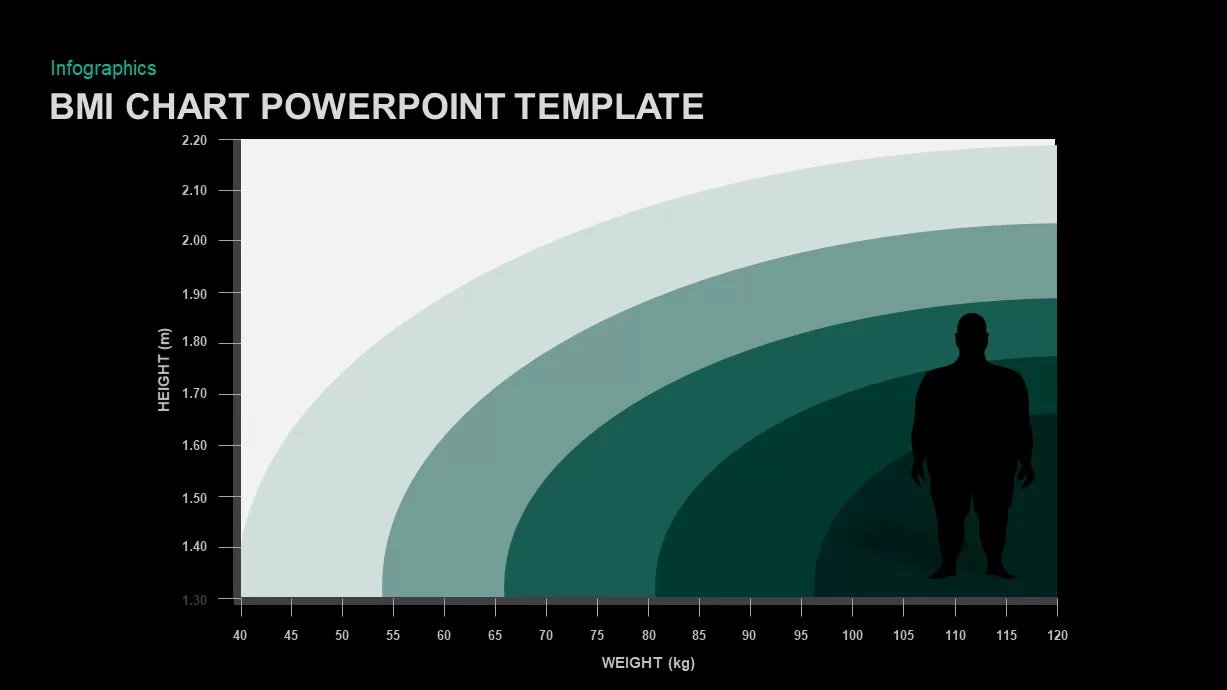
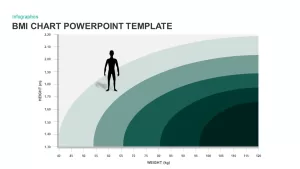
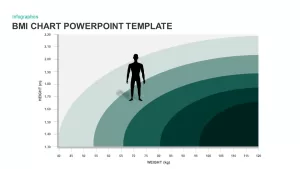
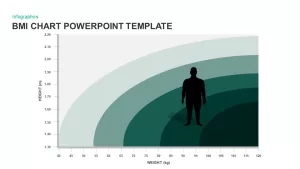
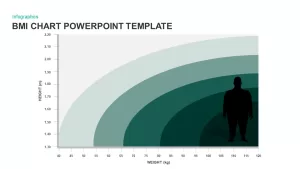
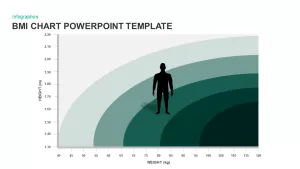
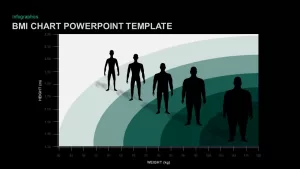
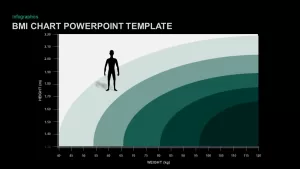
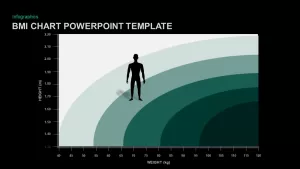
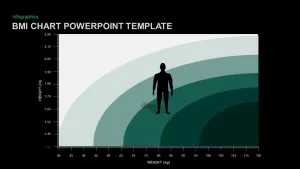
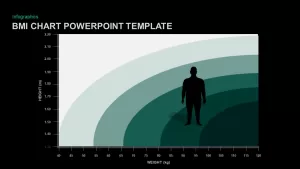
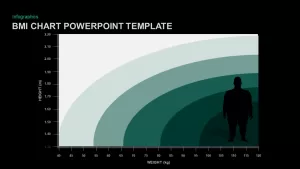
The BMI Chart Infographic Pack provides eight fully editable slides designed to convey body mass index categories through a combination of chart overlays and silhouette graphics. The main arc chart maps weight (kg) on the horizontal axis and height (m) on the vertical axis, and overlays five translucent green bands representing BMI ranges: Underweight (<18.5), Normal (18.5–24.9), Overweight (25–29.9), Obese (30–34.9), and Extremely Obese (>35). Each range features a life-size silhouette whose scale and opacity reflect the transition between categories. This visual metaphor helps audiences instantly grasp the relationship between height, weight, and BMI classification.
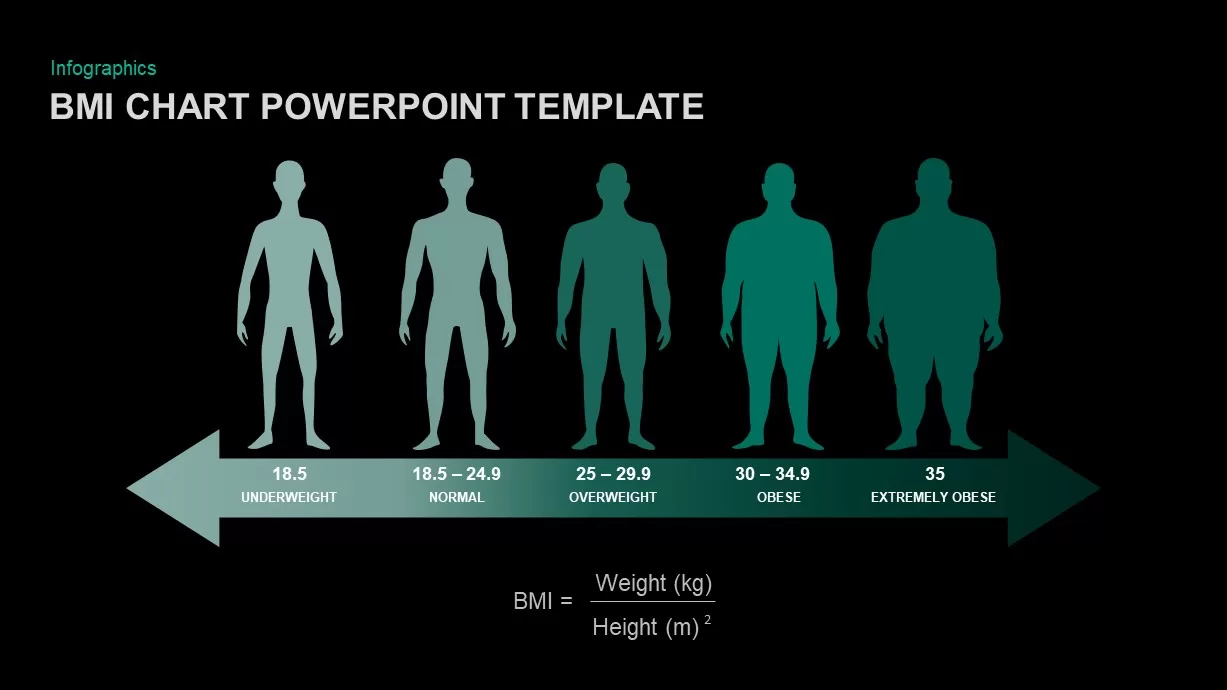
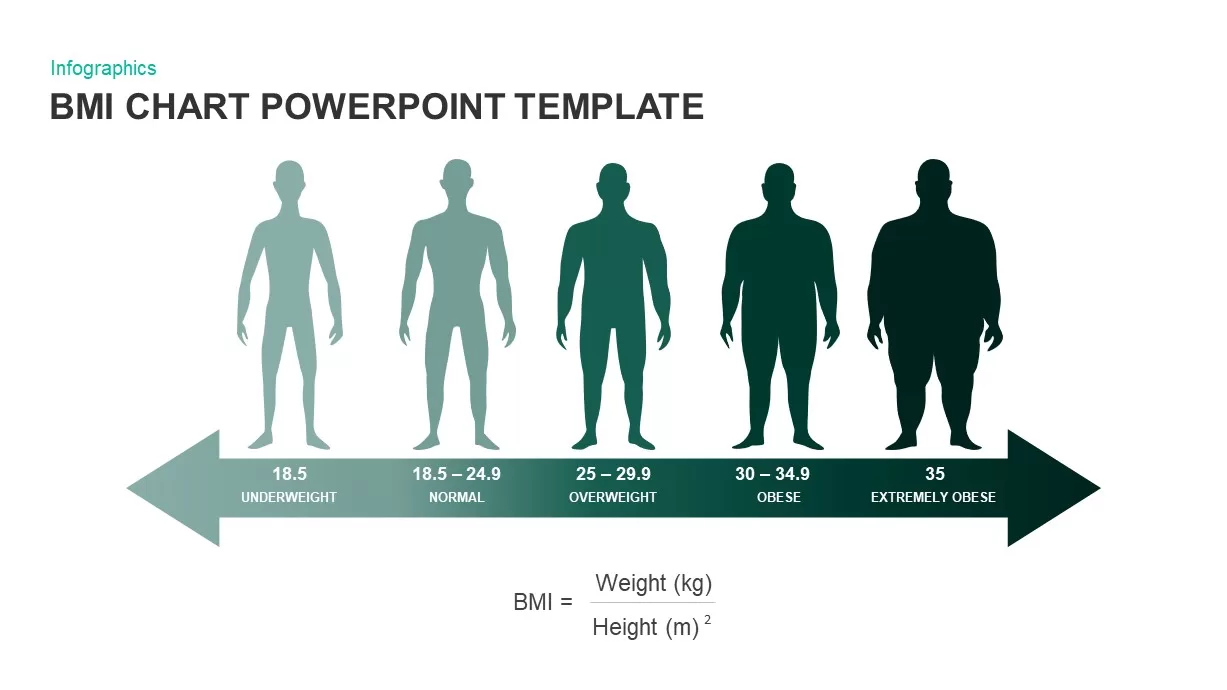
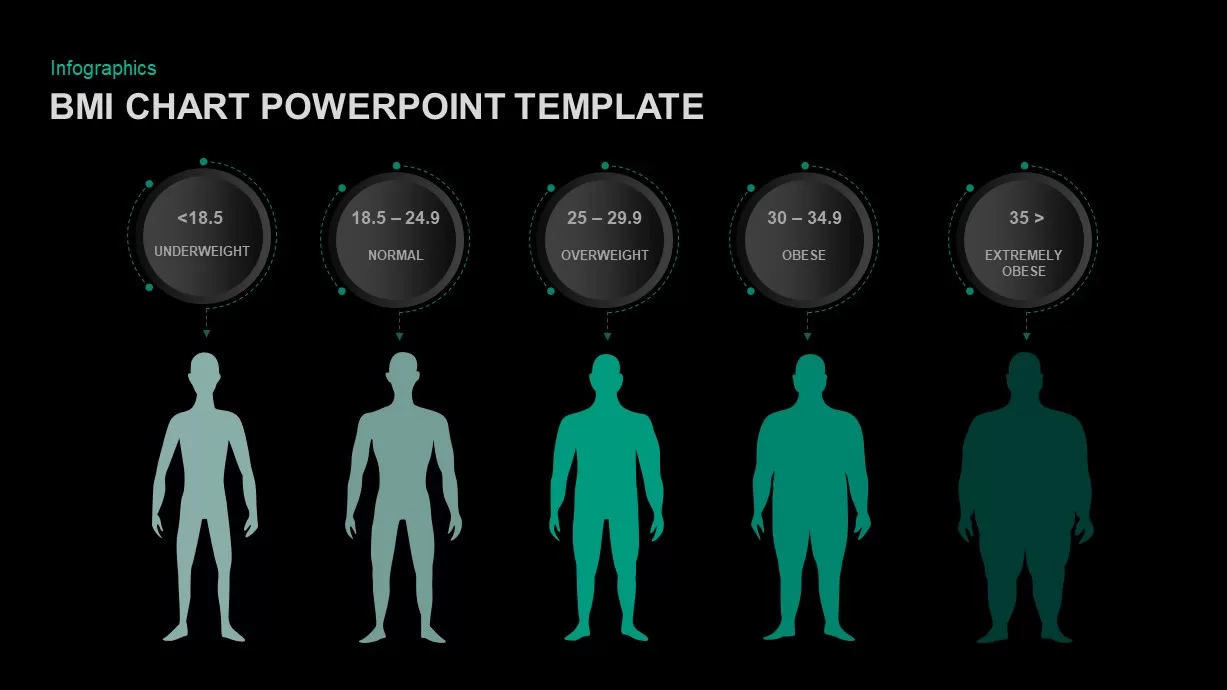
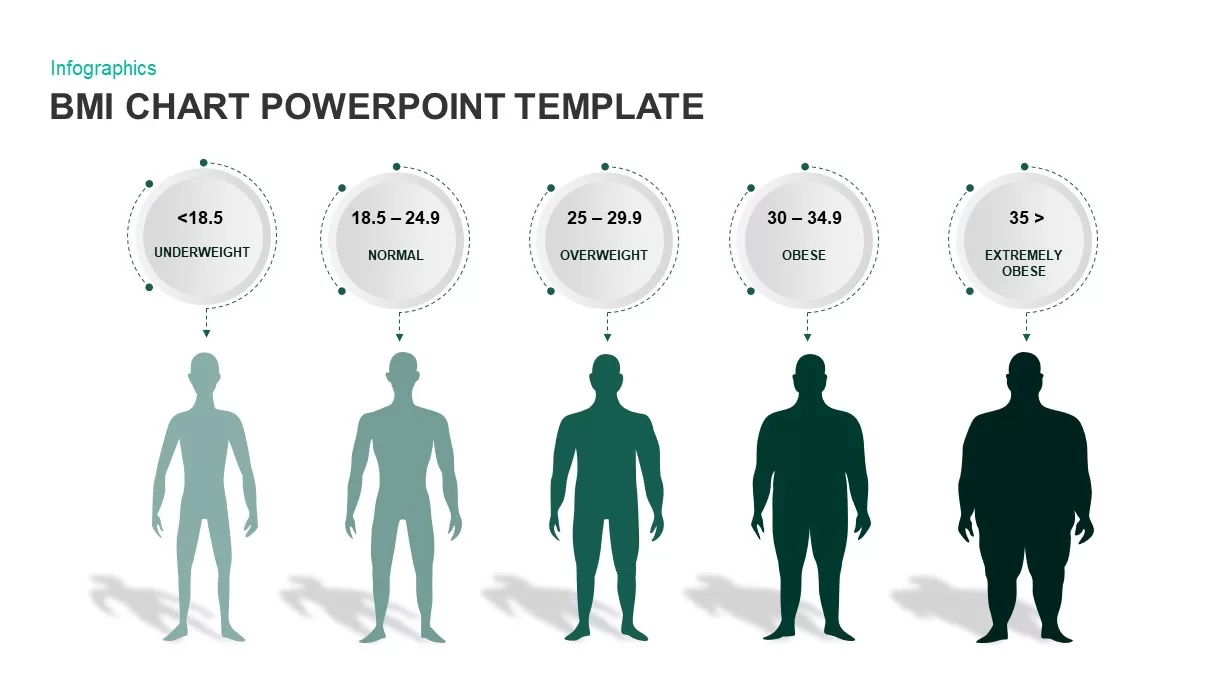
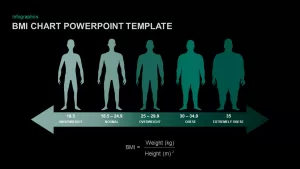
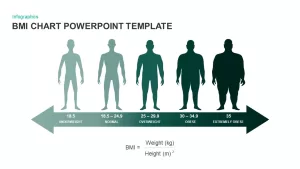
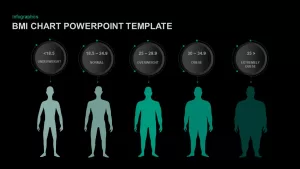
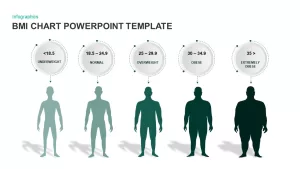
An alternate slide presents the same content as a horizontal arrow infographic, where each segment is color-graded in green tones and paired with a silhouette and label, enabling straightforward comparison across five BMI categories. Additional slides isolate each silhouette with call-out style circular labels and dashed connectors, perfect for detailed category definitions or health risk discussions.
All elements are built on vector shapes and master slides in PowerPoint and Google Slides, ensuring seamless customization of colors, text, icons, and chart axes. Switch out silhouettes, adjust height and weight scales, or replace green gradients with brand-specific palettes in seconds. Axis labels, legends, and data placeholders can be toggled on or off, while simple entrance animations guide viewers through step-by-step explanations.
Ideal for medical professionals, nutritionists, fitness coaches, and health educators, this template pack streamlines the creation of engaging presentations on BMI assessments, wellness programs, and epidemiological studies. With its clean layout, consistent typography, and intuitive visuals, you can maintain clarity and impact across workshops, patient consultations, and academic lectures.
Who is it for
Healthcare practitioners, dietitians, fitness trainers, and public health researchers will benefit from these infographic slides when explaining BMI categories, analyzing patient data, or presenting population health trends.
Other Uses
Beyond BMI assessments, repurpose these graphics for body composition studies, fitness progress reports, nutritional workshops, or educational materials on healthy weight management.
Login to download this file

Item ID
SB01689
Related Templates

Three-Category Comparison Template for PowerPoint & Google Slides
Comparison
Category Analysis Comparison Infographic Template for PowerPoint & Google Slides
Comparison
Six-Category Waste Management Overview Template for PowerPoint & Google Slides
Comparison
Category Creation Triangle Diagram Template for PowerPoint & Google Slides
Business Strategy
Comparison Bar Chart template for PowerPoint & Google Slides
Comparison Chart
Four Section Comparison Chart Diagram Template for PowerPoint & Google Slides
Infographics
Interactive Product Comparison Bar Chart Template for PowerPoint & Google Slides
Bar/Column
Comparison Chart Overview template for PowerPoint & Google Slides
Comparison Chart
Tornado Chart Data Comparison Slide Template for PowerPoint & Google Slides
Bar/Column
Radar Chart Product Comparison Template for PowerPoint & Google Slides
Comparison Chart

Circular Product Comparison Chart Template for PowerPoint & Google Slides
Comparison Chart
Pugh Matrix Decision Comparison Chart Template for PowerPoint & Google Slides
Comparison Chart
Dynamic Benchmarking Comparison Chart Template for PowerPoint & Google Slides
Comparison Chart
People Demographic Comparison Chart Template for PowerPoint & Google Slides
Comparison
Clustered Bar Chart Comparison Template for PowerPoint & Google Slides
Bar/Column
Business Timeline Comparison Bar Chart Template for PowerPoint & Google Slides
Comparison Chart
Grouped Column Chart Comparison Template for PowerPoint & Google Slides
Bar/Column
Multiple Line Chart Comparison Template for PowerPoint & Google Slides
Comparison Chart
Mirror Bar Chart Comparison Template for PowerPoint & Google Slides
Bar/Column
Free Versatile Product Comparison Chart Template for PowerPoint & Google Slides
Charts
Free
Dynamic Bar-of-Pie Chart Comparison Template for PowerPoint & Google Slides
Pie/Donut
ESG Initiatives Comparison Chart Template for PowerPoint & Google Slides
Business
Quarterly Revenue Comparison Bar Chart Template for PowerPoint & Google Slides
Bar/Column
Competitor Comparison Chart Design Template for PowerPoint & Google Slides
Comparison
Two-Option Bar Chart Comparison Table Template for PowerPoint & Google Slides
Comparison
Profile Comparison Chart template for PowerPoint & Google Slides
Comparison Chart
Sales Growth Comparison Chart & Table Template for PowerPoint & Google Slides
Bar/Column
Skills Gap Analysis Comparison Chart Template for PowerPoint & Google Slides
Gap
Feasibility Matrix Comparison Chart Template for PowerPoint & Google Slides
Comparison Chart
Quarterly Comparison Pie Chart Template for PowerPoint & Google Slides
Pie/Donut
Process Comparison Chart for PowerPoint & Google Slides
Infographics

Comparison Donut Chart PowerPoint Template and Keynote
Pie/Donut
Service Zoom Feature Slides Comparison template for PowerPoint & Google Slides
Process
Simple Comparison Table Template for PowerPoint & Google Slides
Comparison
Gold Scales Balance Comparison Template for PowerPoint & Google Slides
Comparison
Four-Tier Pricing Comparison Table Template for PowerPoint & Google Slides
Comparison
3-Column Comparison template for PowerPoint & Google Slides
Comparison
A/B Testing Comparison Infographic template for PowerPoint & Google Slides
Comparison
Four-Plan Pricing Table Comparison Template for PowerPoint & Google Slides
Comparison
Gender Comparison People Infographic Template for PowerPoint & Google Slides
Comparison

Comparison Pricing Table Infographic Template for PowerPoint & Google Slides
Comparison Chart
Interactive Pricing Plan Comparison Template for PowerPoint & Google Slides
Comparison
Six-Metric Green Product Comparison Template for PowerPoint & Google Slides
Comparison
Challenges vs Solutions Comparison Template for PowerPoint & Google Slides
Comparison
Two-Column Comparison Infographic Slide Template for PowerPoint & Google Slides
Comparison
Fact and Figures Comparison Slide Template for PowerPoint & Google Slides
Business Report
Isometric 3D Block Comparison Diagram Template for PowerPoint & Google Slides
Comparison
Generations Comparison Infographic Template for PowerPoint & Google Slides
Timeline
Internal vs External Factors Comparison Template for PowerPoint & Google Slides
Comparison
Theory X and Theory Y Comparison Template for PowerPoint & Google Slides
Comparison
Competitive Landscape Comparison Template Pack for PowerPoint & Google Slides
Comparison
Before and After Comparison Infographics Template for PowerPoint & Google Slides
Comparison
Current vs Future State Comparison Slide Template for PowerPoint & Google Slides
Comparison Chart
Before and After Comparison Infographic Template for PowerPoint & Google Slides
Comparison
Free
Challenges and Solutions Comparison Template for PowerPoint & Google Slides
Opportunities Challenges
Challenges & Solutions Comparison Template for PowerPoint & Google Slides
Opportunities Challenges
Cost Benefit Analysis Comparison Template for PowerPoint & Google Slides
Comparison
Adam’s Equity Theory Scale Comparison Template for PowerPoint & Google Slides
Comparison
Risk Heatmap Comparison Template for PowerPoint & Google Slides
Maps
Heatmap Comparison Template for PowerPoint & Google Slides
Maps
Vendor Comparison Analysis template for PowerPoint & Google Slides
Comparison Chart
Vendor Comparison Matrix with High-Level Requirements template for PowerPoint & Google Slides
Comparison Chart
Modern Tradeoffs Comparison Slide Template for PowerPoint & Google Slides
Comparison
Popular Social Media Comparison Grid Template for PowerPoint & Google Slides
Digital Marketing
Hits and Misses Performance Comparison Template for PowerPoint & Google Slides
Comparison
Conflict Infographics Comparison Template for PowerPoint & Google Slides
Infographics
Interactive Multi-Use Cost Comparison Template for PowerPoint & Google Slides
Comparison
Free Pros and Cons Comparison Template for PowerPoint & Google Slides
Comparison
Free
Free Global Warming Infographic Comparison Template for PowerPoint & Google Slides
Comparison Chart
Free
Types of AI Comparison Infographic Template for PowerPoint & Google Slides
AI
AI vs. Human Intelligence Comparison Template for PowerPoint & Google Slides
Comparison
Regional Revenue Comparison Overview Template for PowerPoint & Google Slides
Comparison
Pricing Model Types Comparison Infographic Template for PowerPoint & Google Slides
Pitch Deck
Project Comparison Timeline Roadmap Template for PowerPoint & Google Slides
Comparison
Good vs Bad Comparison with Scale Template for PowerPoint & Google Slides
Comparison
Entry and Exit Barriers Comparison Template for PowerPoint & Google Slides
Comparison
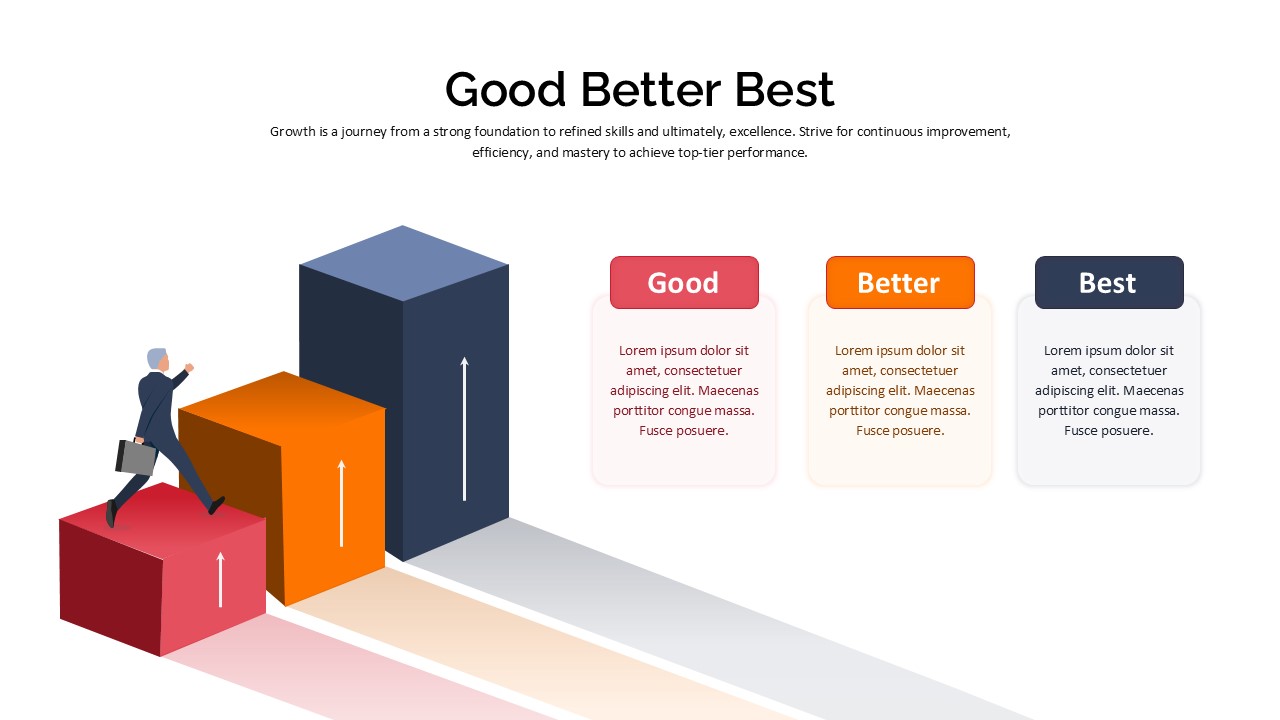
Good Better Best Comparison template for PowerPoint & Google Slides
Comparison
Integrative Thinking Comparison Diagram Template for PowerPoint & Google Slides
Comparison
Product Feature Comparison Table Template for PowerPoint & Google Slides
Comparison Chart
Market Share Comparison Diagram Template for PowerPoint & Google Slides
Comparison Chart
Competitor Profile Matrix Comparison Template for PowerPoint & Google Slides
Comparison Chart
Two-Sided Coin Comparison Diagram Template for PowerPoint & Google Slides
Comparison
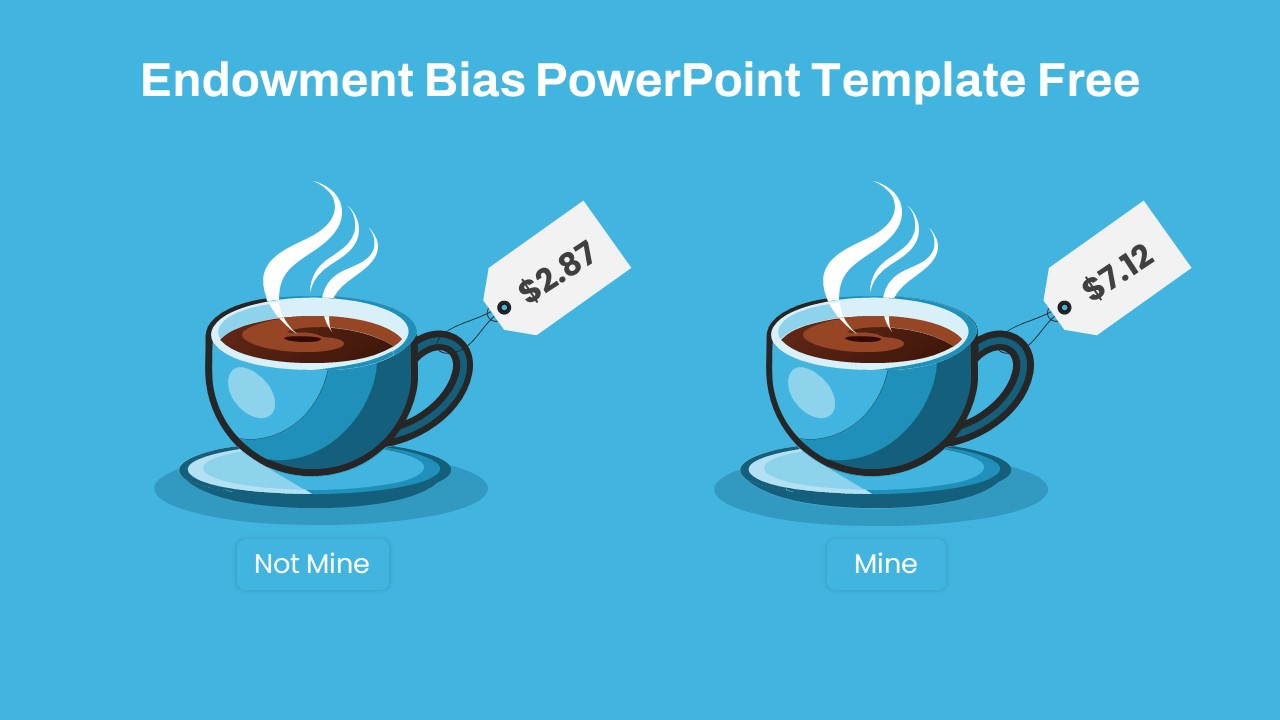
Endowment Bias Coffee Price Comparison Template for PowerPoint & Google Slides
Comparison
Free
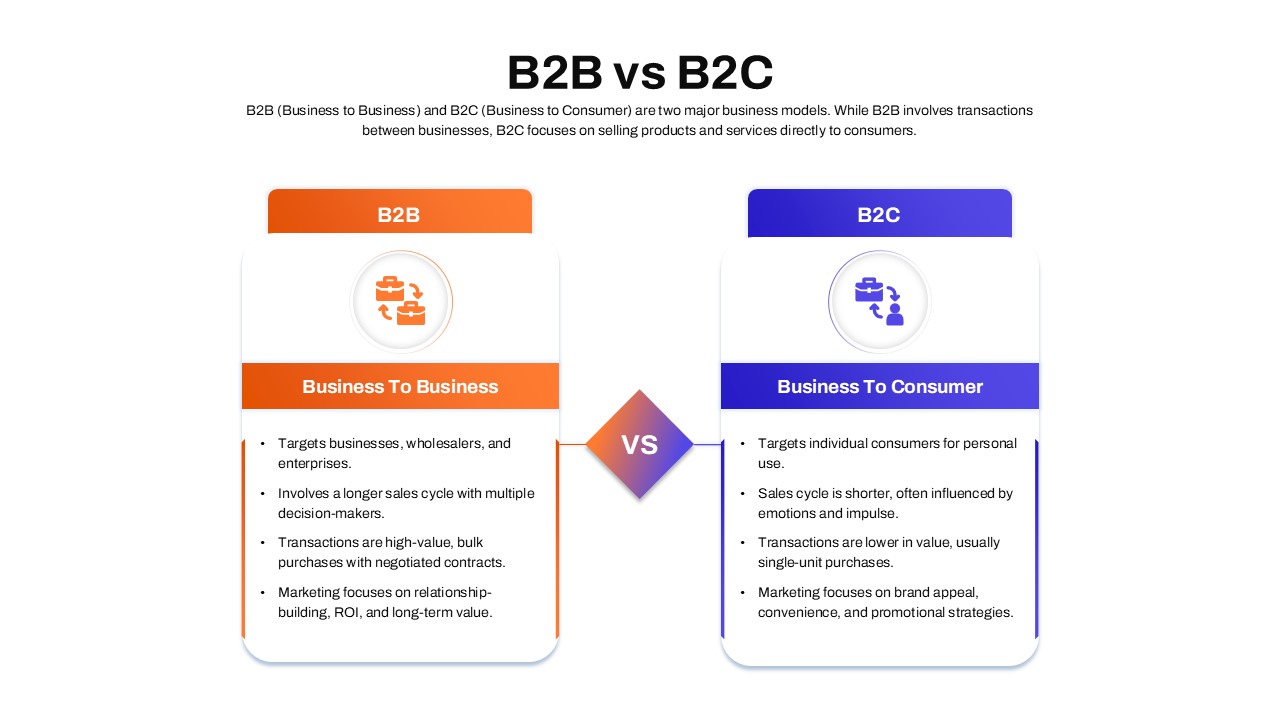
B2B vs B2C Comparison template for PowerPoint & Google Slides
Business Models
VUCA vs BANI Comparison Infographic Template for PowerPoint & Google Slides
Comparison
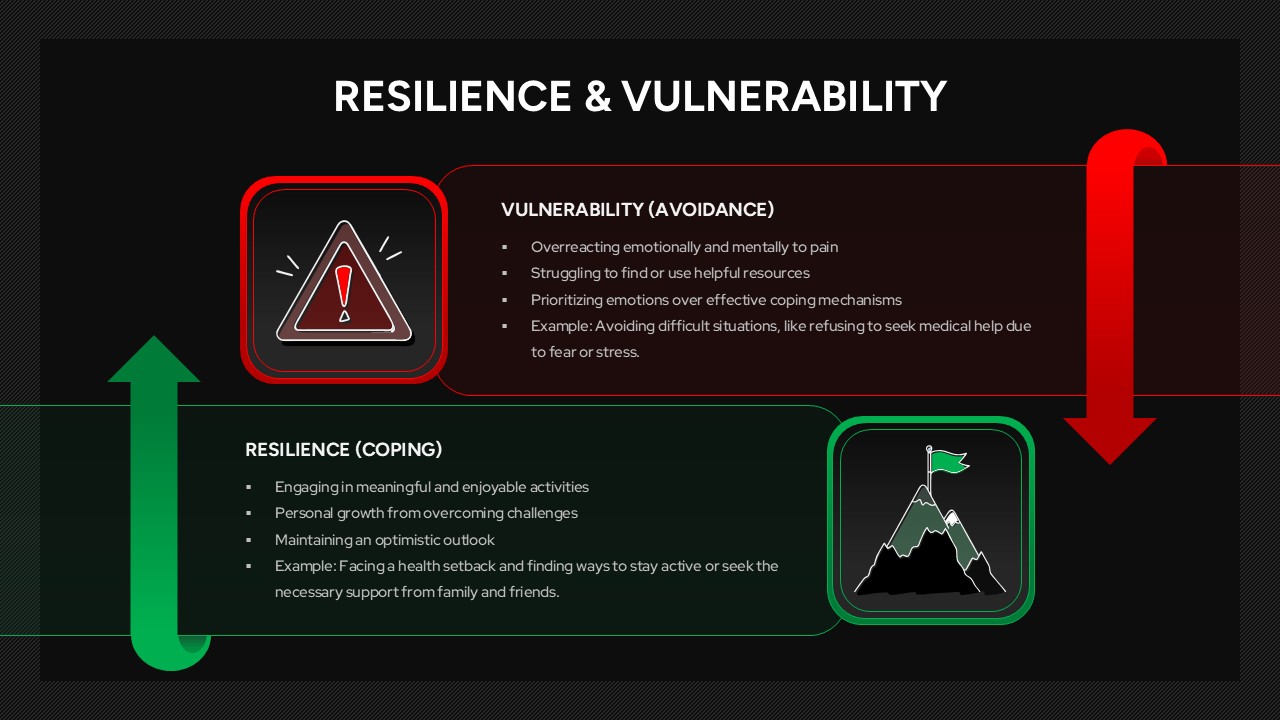
Resilience & Vulnerability Comparison Template for PowerPoint & Google Slides
Comparison
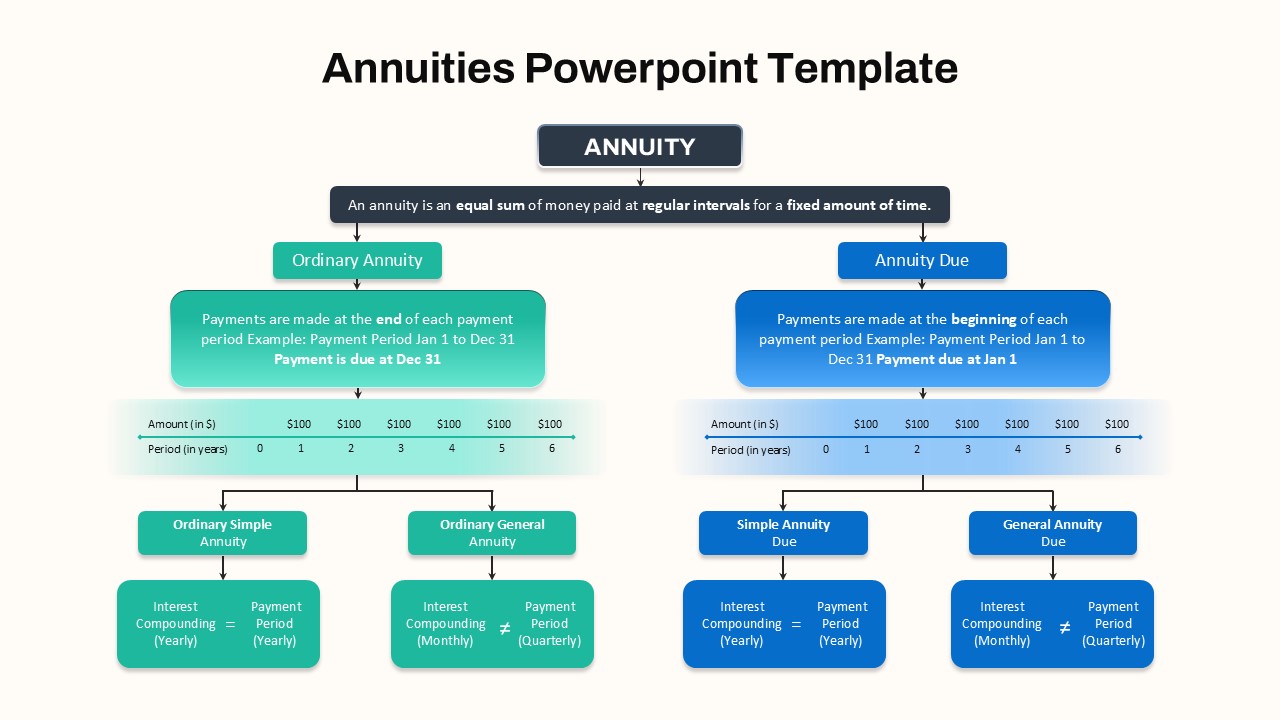
Hierarchical Annuity Comparison Flowchart Template for PowerPoint & Google Slides
Business Report
Attribution Models Comparison Diagram Template for PowerPoint & Google Slides
Comparison
Funnel and Flywheel Thinking Comparison template for PowerPoint & Google Slides
Infographics
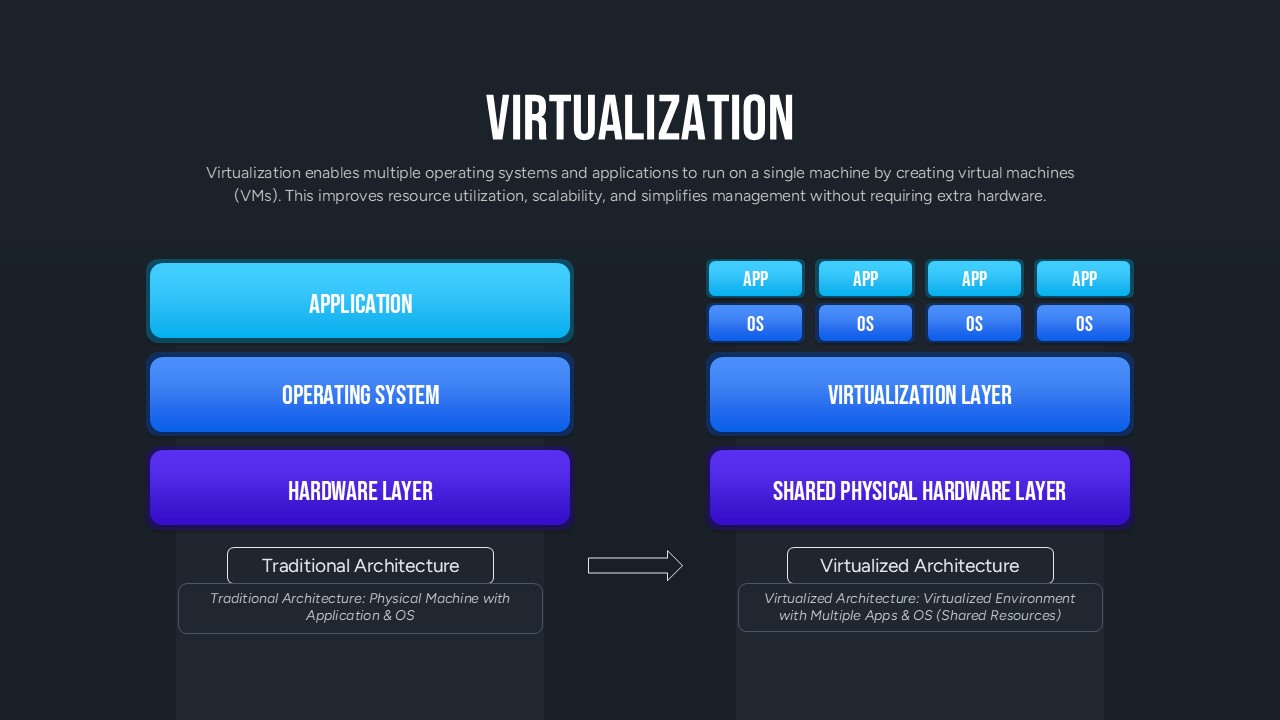
Virtualization Architecture Comparison Template for PowerPoint & Google Slides
Comparison Chart
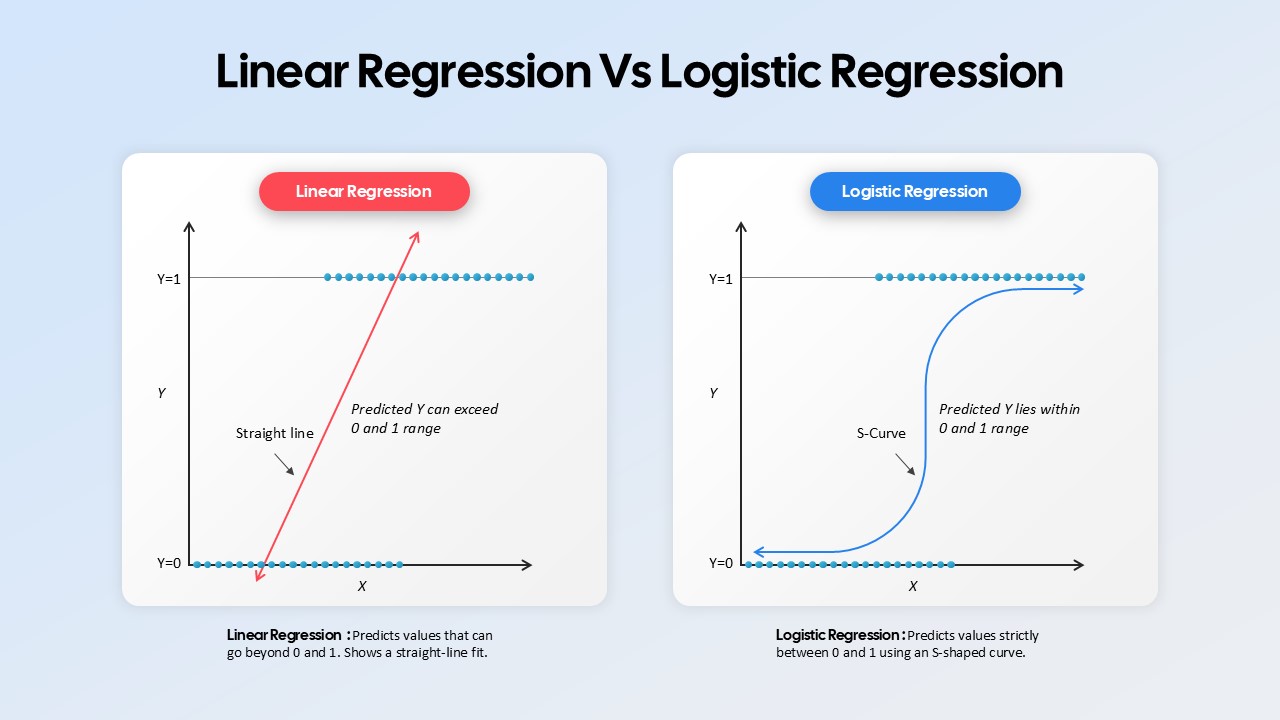
Linear Regression vs Logistic Regression Comparison template for PowerPoint & Google Slides
Comparison
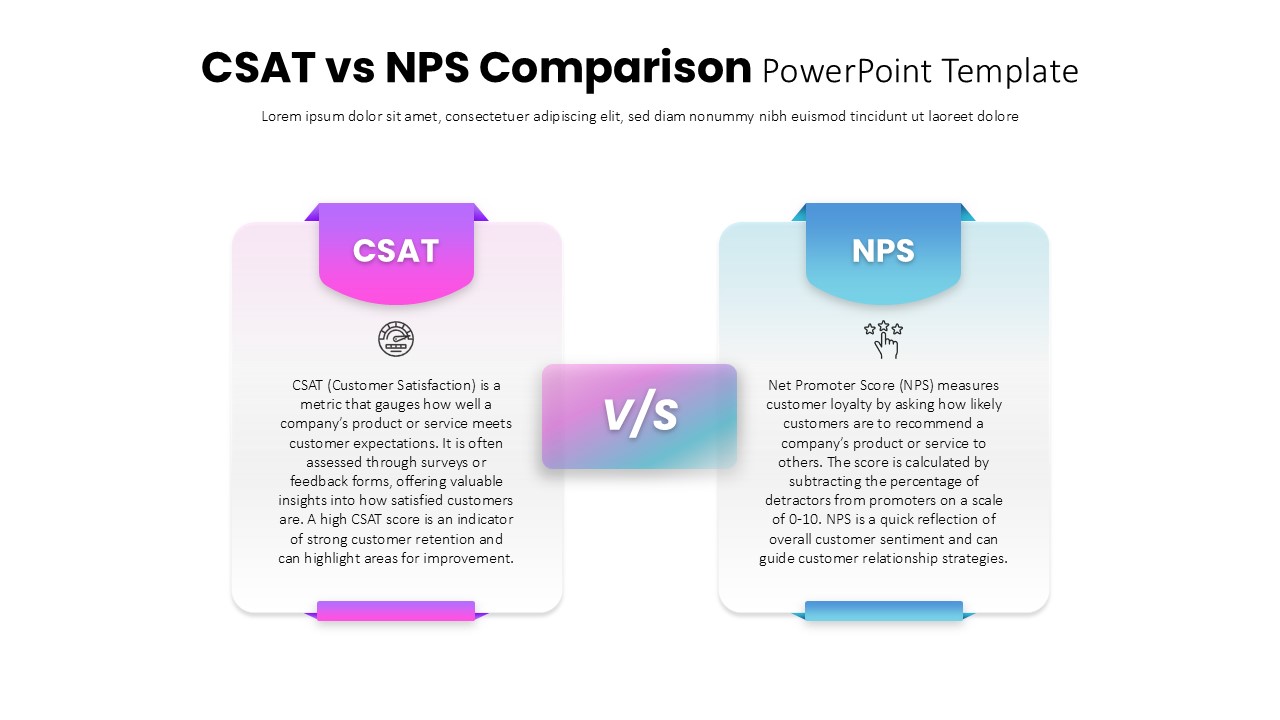
CSAT vs NPS Comparison template for PowerPoint & Google Slides
Business Strategy
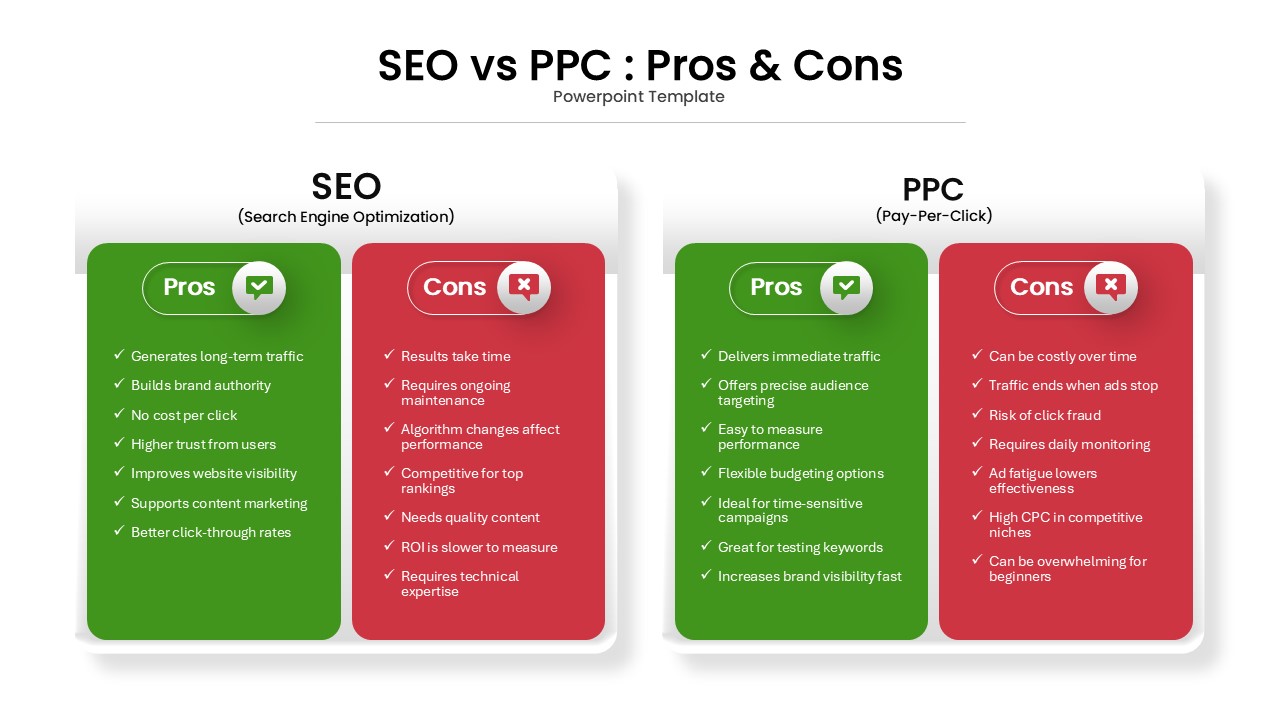
SEO vs PPC: Pros & Cons Comparison Template for PowerPoint & Google Slides
Comparison
Risk vs Reward Comparison Template for PowerPoint & Google Slides
Opportunities Challenges
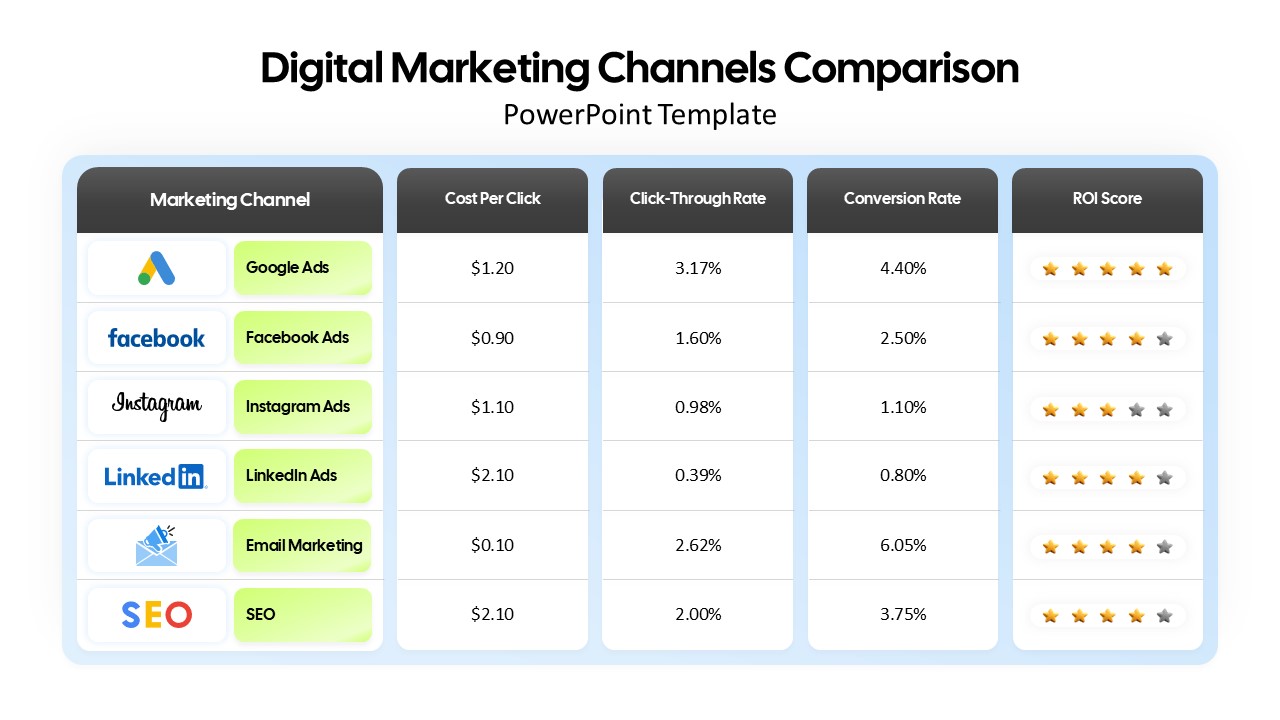
Digital Marketing Channels Comparison template for PowerPoint & Google Slides
Business
Colorful Business Data Comparison Table Template for PowerPoint & Google Slides
Table
Pros and Cons Comparison Table Template for PowerPoint & Google Slides
Comparison Chart
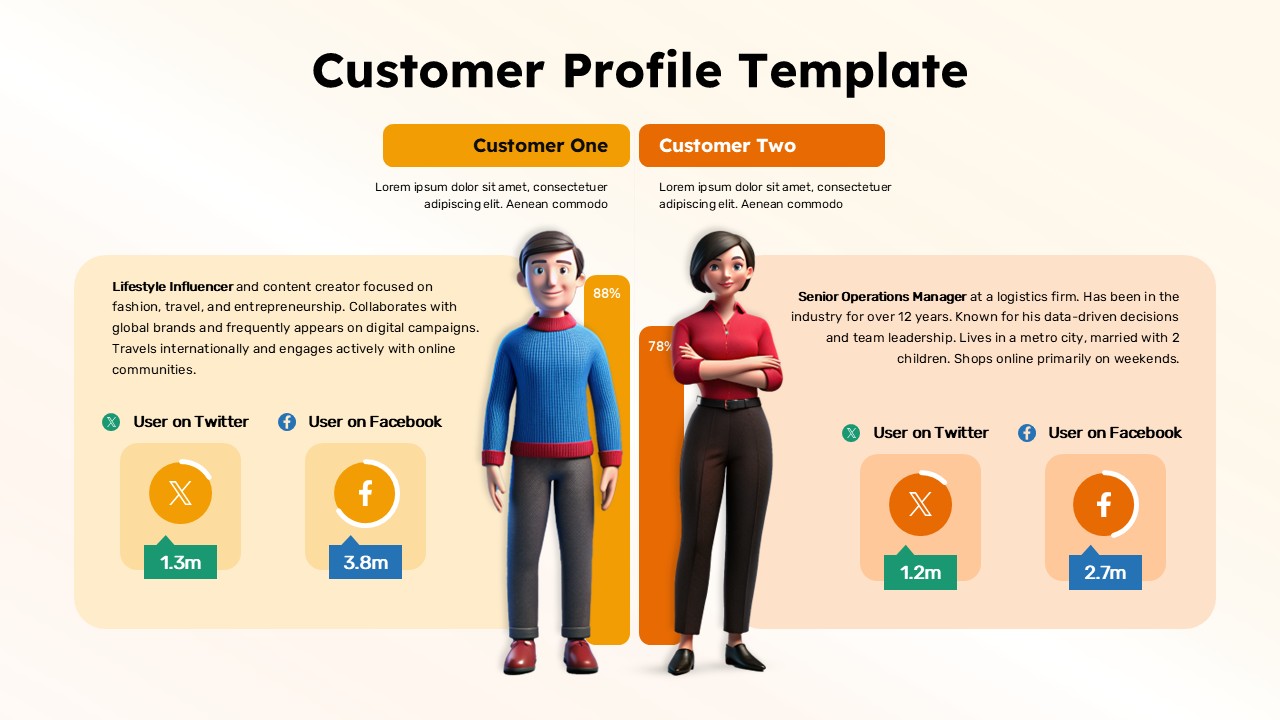
Customer Persona Comparison Profile Template for PowerPoint & Google Slides
Business
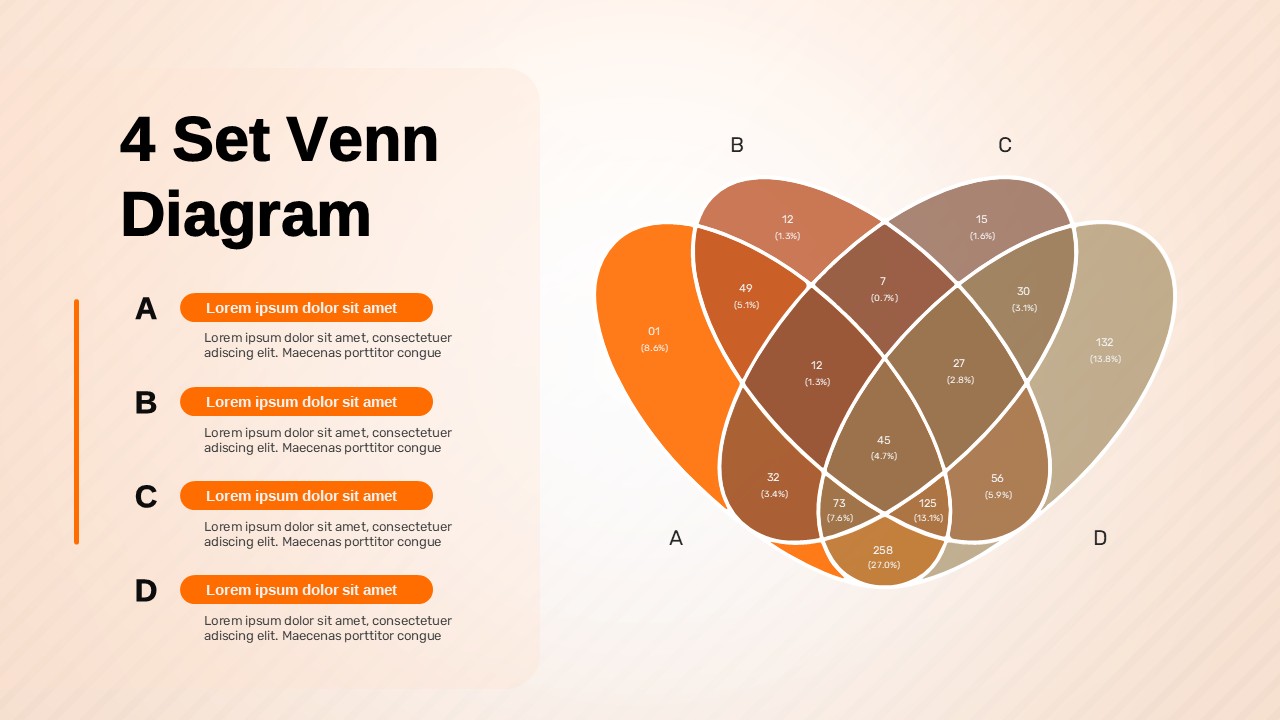
4 Set Venn Diagram Comparison Template for PowerPoint & Google Slides
Comparison
Year-over-Year Performance Comparison Template for PowerPoint & Google Slides
Comparison Chart