Bar Chart Sample template for PowerPoint & Google Slides


Description
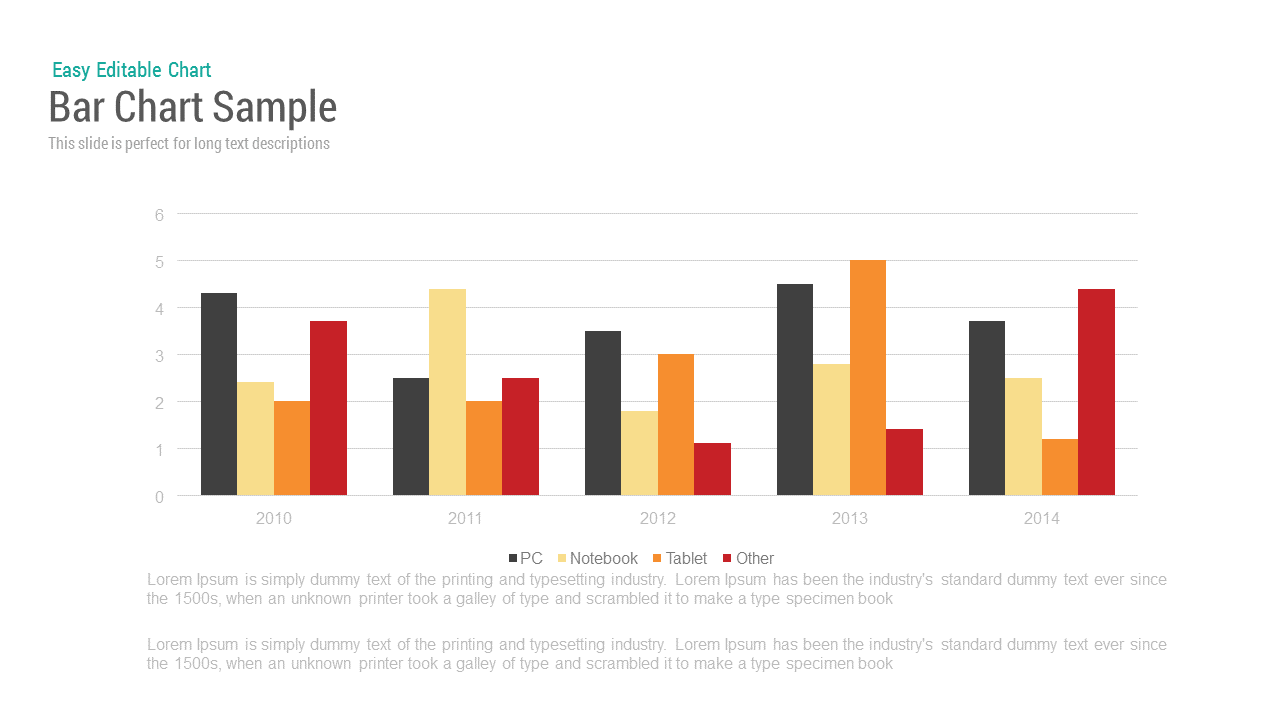
This editable Bar Chart Sample slide is designed to present data in a visually clear and engaging format, featuring a bar chart with four different categories: PC, Notebook, Tablet, and Other. The bars are color-coded in gray, yellow, red, and black, making it easy to differentiate between the categories. The chart spans from 2010 to 2014, showing the trend over the years for each category, allowing for straightforward comparison of data.
This slide is perfect for presenting sales data, market trends, or performance metrics. It can easily be customized to showcase any data set, from technology usage trends to financial performance. The clean design and dark background ensure that the data stands out, while the vibrant colors help highlight key insights.
Ideal for business presentations, project updates, and performance reviews, this bar chart offers a quick, visually appealing way to present data over time. With its editable nature, you can update the data, colors, and text as needed, ensuring that it aligns with your specific presentation needs.
Who is it for
This slide is ideal for business analysts, marketers, and project managers who need to present quantitative data in an easily digestible format. It is also suitable for financial analysts and sales teams who need to compare and contrast various metrics over time.
Other Uses
In addition to presenting market data or sales performance, this slide can be used for comparing product usage, tracking project progress, or visualizing customer feedback. It’s versatile enough to be adapted for various industries, from tech to education and beyond.
Login to download this file

Item ID
SB00002
Related Templates

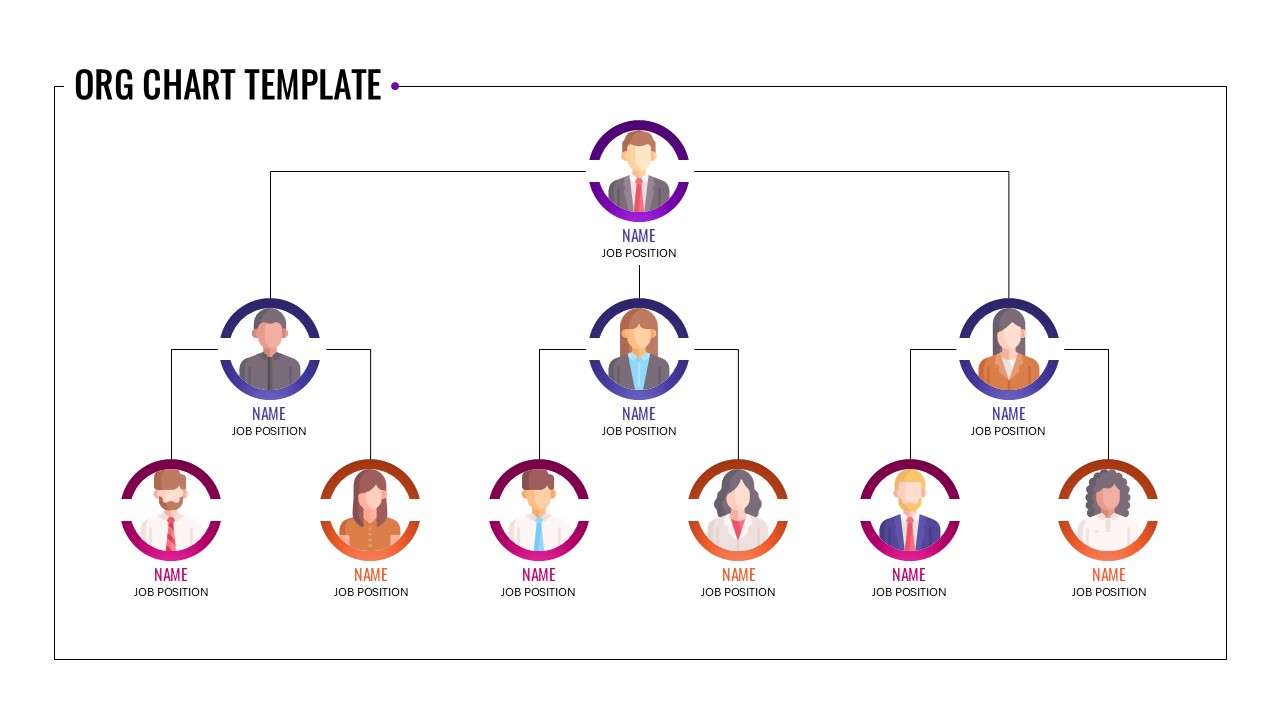
Circular Sample Org Chart Template for PowerPoint & Google Slides
Org Chart
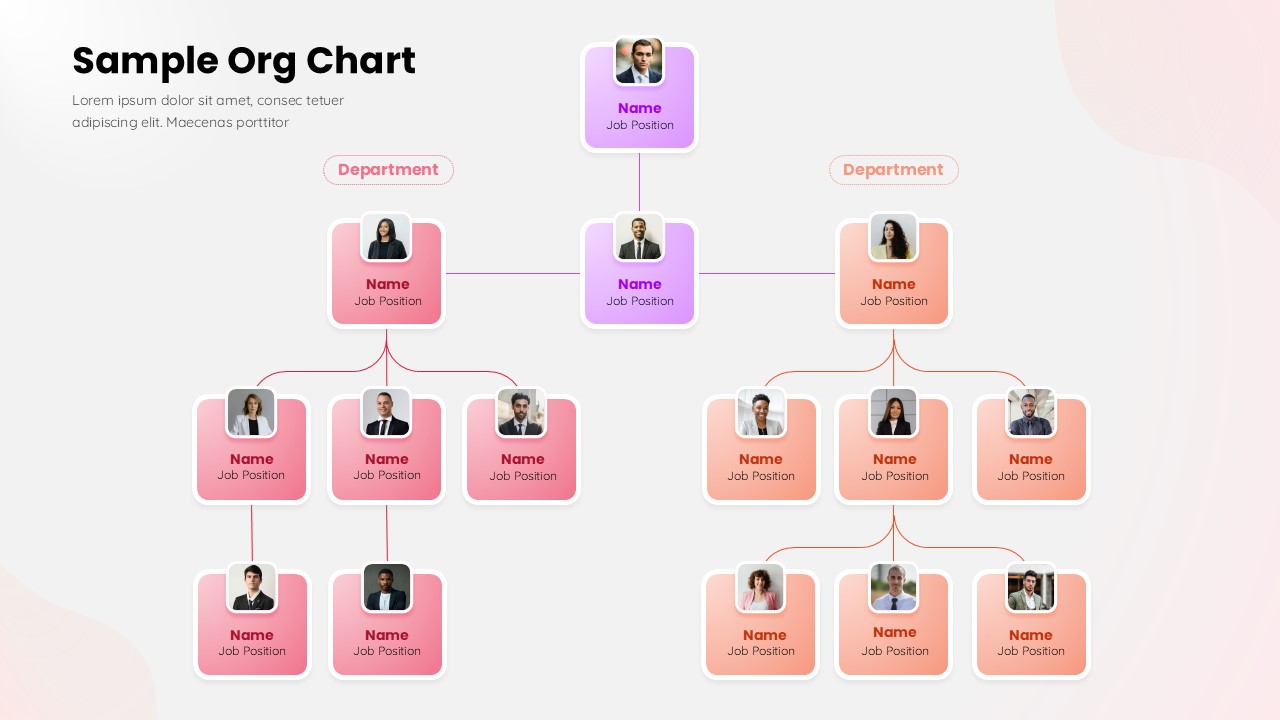
Sample Org Chart Template for PowerPoint & Google Slides
Org Chart
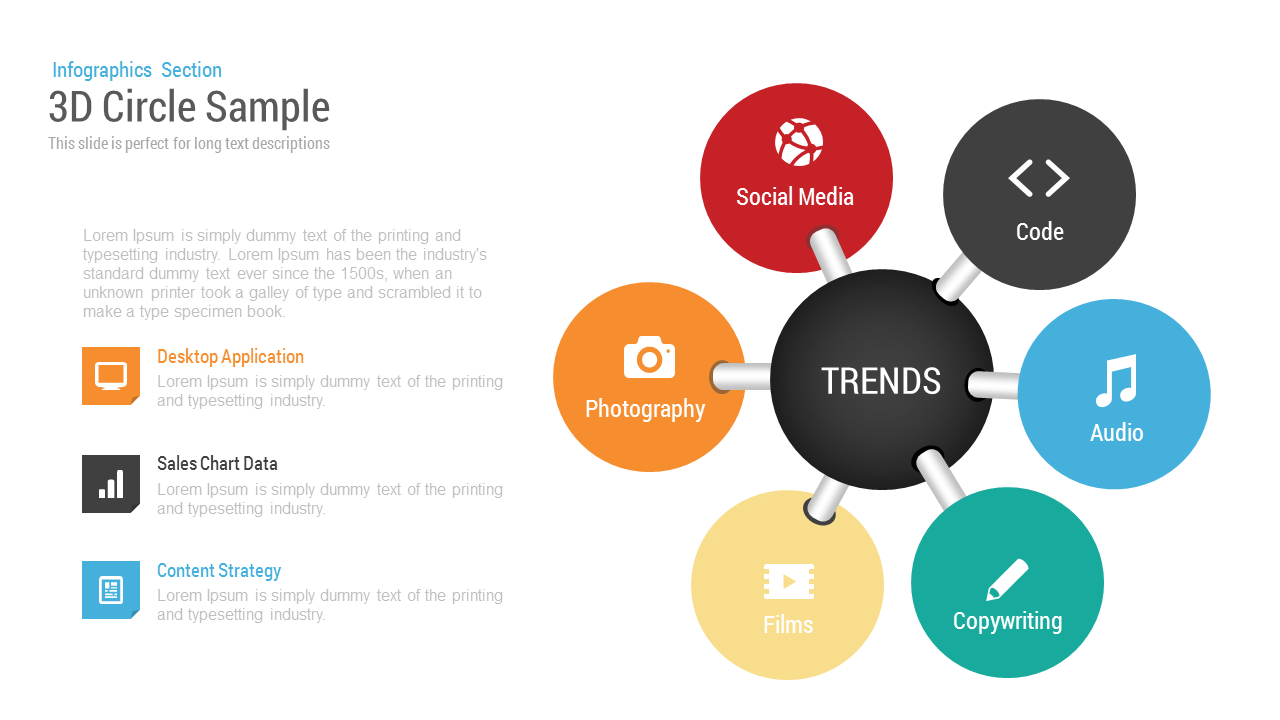
3D Circle Sample template for PowerPoint & Google Slides
Circular
Creative Data Analysis Bar Chart template for PowerPoint & Google Slides
Bar/Column
3D Bar Chart Data Infographics Template for PowerPoint & Google Slides
Bar/Column
Creative Bar Chart template for PowerPoint & Google Slides
Charts
Comparison Bar Chart template for PowerPoint & Google Slides
Comparison Chart
Three-Year Bar Chart template for PowerPoint & Google Slides
Charts
3D Cylinder Bar Chart Template for PowerPoint & Google Slides
Bar/Column
Pencil Bar Chart Data Analysis Template for PowerPoint & Google Slides
Bar/Column

Monthly Reports Bar Chart template for PowerPoint & Google Slides
Bar/Column

Colorful Radial Bar Chart Template for PowerPoint & Google Slides
Bar/Column
Interactive Product Comparison Bar Chart Template for PowerPoint & Google Slides
Bar/Column
For and Against Vote Count Bar Chart Template for PowerPoint & Google Slides
Bar/Column
Entertainment Industry Revenue Bar Chart Template for PowerPoint & Google Slides
Bar/Column
Distracting Factors at Work Bar Chart Template for PowerPoint & Google Slides
Bar/Column
Statistics Infographic & KPI Bar Chart Template for PowerPoint & Google Slides
Bar/Column
Multi-Series Stacked Bar Chart Template for PowerPoint & Google Slides
Bar/Column
Monthly Recurring Revenue KPI Bar Chart Template for PowerPoint & Google Slides
Bar/Column
Combination Bar and Line Chart Template for PowerPoint & Google Slides
Bar/Column
Animated Clustered Bar Chart Template for PowerPoint & Google Slides
Bar/Column
Animated Stacked Bar Chart Template for PowerPoint & Google Slides
Bar/Column
Simple Bar Chart Data Visualization Template for PowerPoint & Google Slides
Bar/Column
Clustered Bar Chart Comparison Template for PowerPoint & Google Slides
Bar/Column
Waterfall Bar Chart Analysis Template for PowerPoint & Google Slides
Bar/Column
Business Timeline Comparison Bar Chart Template for PowerPoint & Google Slides
Comparison Chart
Year-over-Year Stacked Gender Bar Chart Template for PowerPoint & Google Slides
Bar/Column
Mirror Bar Chart Comparison Template for PowerPoint & Google Slides
Bar/Column
Dynamic Bar-of-Pie Chart Comparison Template for PowerPoint & Google Slides
Pie/Donut
Expanding Margins Analysis Bar Chart Template for PowerPoint & Google Slides
Charts
Quarterly Revenue Comparison Bar Chart Template for PowerPoint & Google Slides
Bar/Column
Quarterly Sales Review Bar Chart Template for PowerPoint & Google Slides
Bar/Column
Data Analysis Bar Chart with Insights Template for PowerPoint & Google Slides
Bar/Column
Free
Horizontal Bar Chart Slide with Icons Template for PowerPoint & Google Slides
Bar/Column
Two-Option Bar Chart Comparison Table Template for PowerPoint & Google Slides
Comparison
Bar Gantt Chart Template for PowerPoint & Google Slides
Gantt Chart
USA Map with Bar Chart Template for PowerPoint & Google Slides
World Maps
Sales Bar Chart for PowerPoint & Google Slides
Bar/Column
Bar Data Chart Slide for PowerPoint & Google Slides
Bar/Column

Radial Bar Chart Diagram for PowerPoint & Google Slides
Bar/Column
Stacked Bar Chart for PowerPoint & Google Slides
Bar/Column
100% Stacked Bar Chart for PowerPoint & Google Slides
Bar/Column
3D Cylinder Bar Chart Visualization Template for PowerPoint
Bar/Column
3D Bar Graph Infographic Template for PowerPoint & Google Slides
Bar/Column
Five-Stage Vertical Bar Process Template for PowerPoint & Google Slides
Process
Timeline Roadmap with Progress Bar Template for PowerPoint & Google Slides
Timeline
Progress Bar and Milestone Visualization Template for PowerPoint & Google Slides
Timeline

Blank Bar Graph Template for PowerPoint & Google Slides
Bar/Column
Progress Bar Graph Layout Design for PowerPoint & Google Slides
Charts
Progress Bar Infographic for PowerPoint & Google Slides
Business
Progress Bar infographic pack for PowerPoint & Google Slides
Business
Five Options Business Bar Graph for PowerPoint & Google Slides
Business Report
Quad Chart Infographic Pack of 8 Slides Template for PowerPoint & Google Slides
Comparison Chart
Free Professional Gantt Chart Pack – 4 Slides Template for PowerPoint & Google Slides
Gantt Chart
Free
Circle Strategy Creative Chart template for PowerPoint & Google Slides
Business Strategy
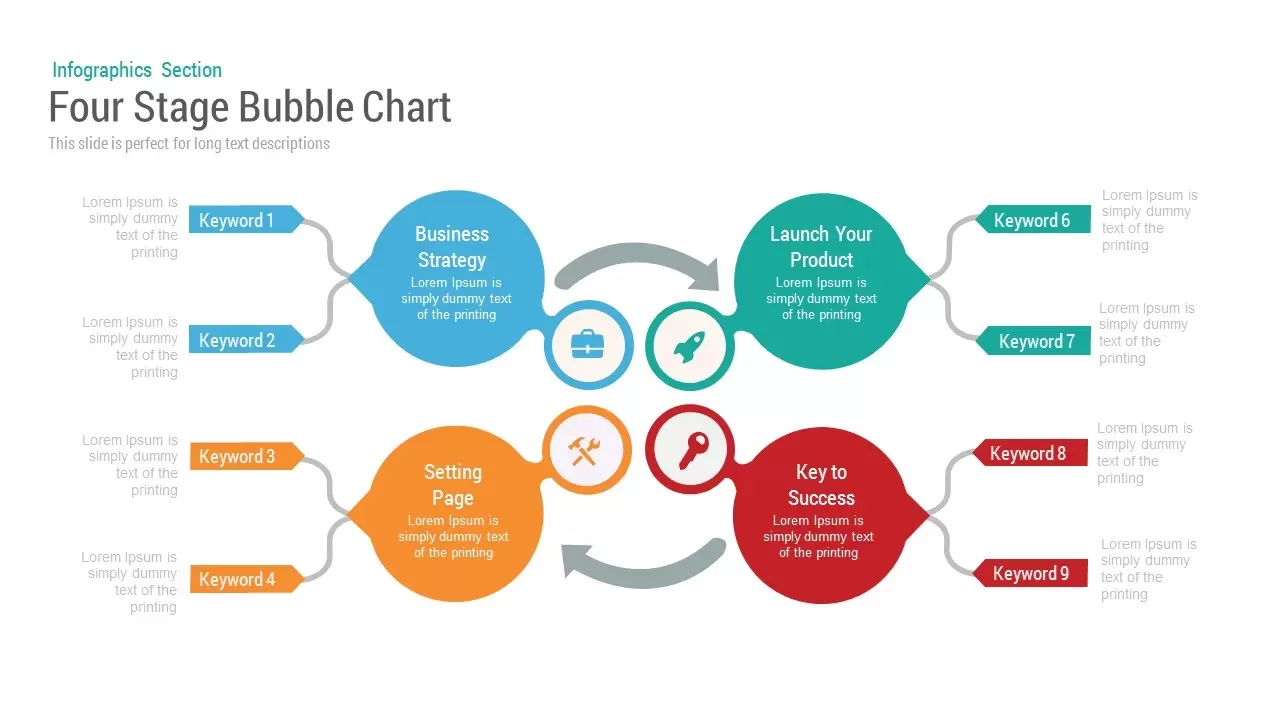
Bubble Chart template for PowerPoint & Google Slides
Charts
Circle Chart Data template for PowerPoint & Google Slides
Pie/Donut
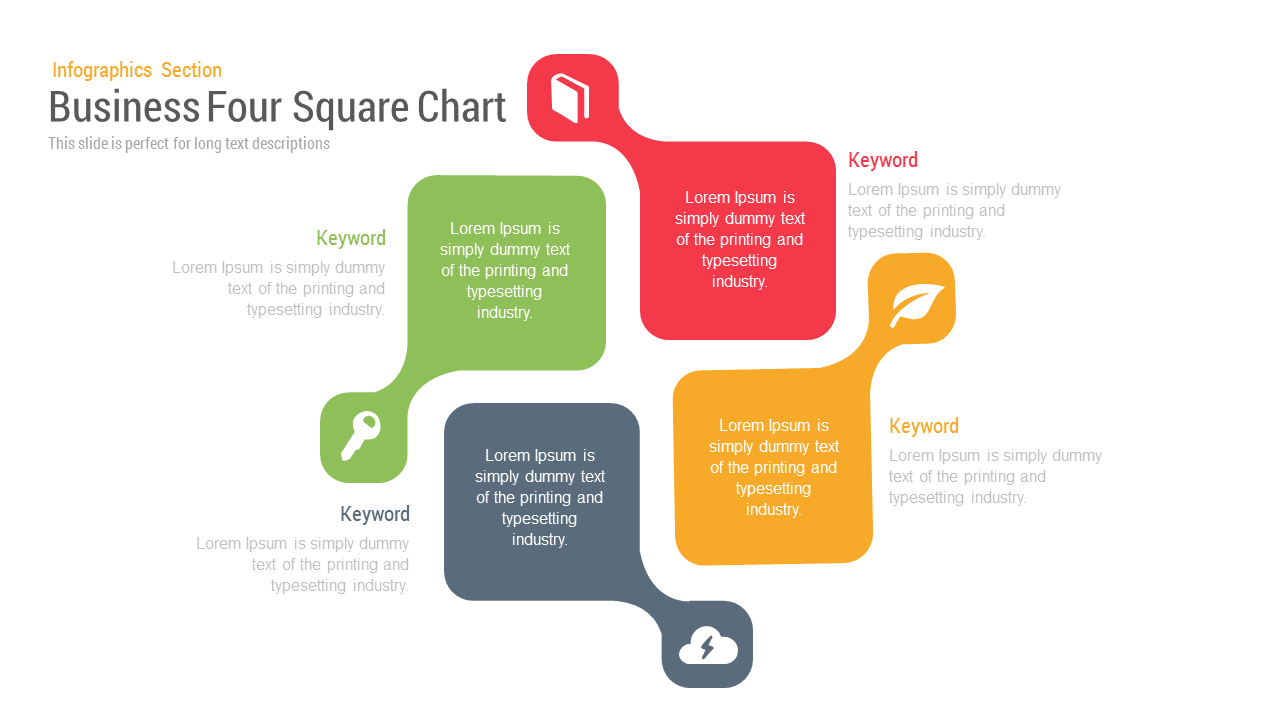
Business Four Square Chart template for PowerPoint & Google Slides
Business
Four Section Comparison Chart Diagram Template for PowerPoint & Google Slides
Infographics
Product Roadmap Gantt Chart Timeline template for PowerPoint & Google Slides
Gantt Chart
Product Usage Analytics Dashboard Chart Template for PowerPoint & Google Slides
Bar/Column
Sales vs Budget Performance Chart Template for PowerPoint & Google Slides
Bar/Column
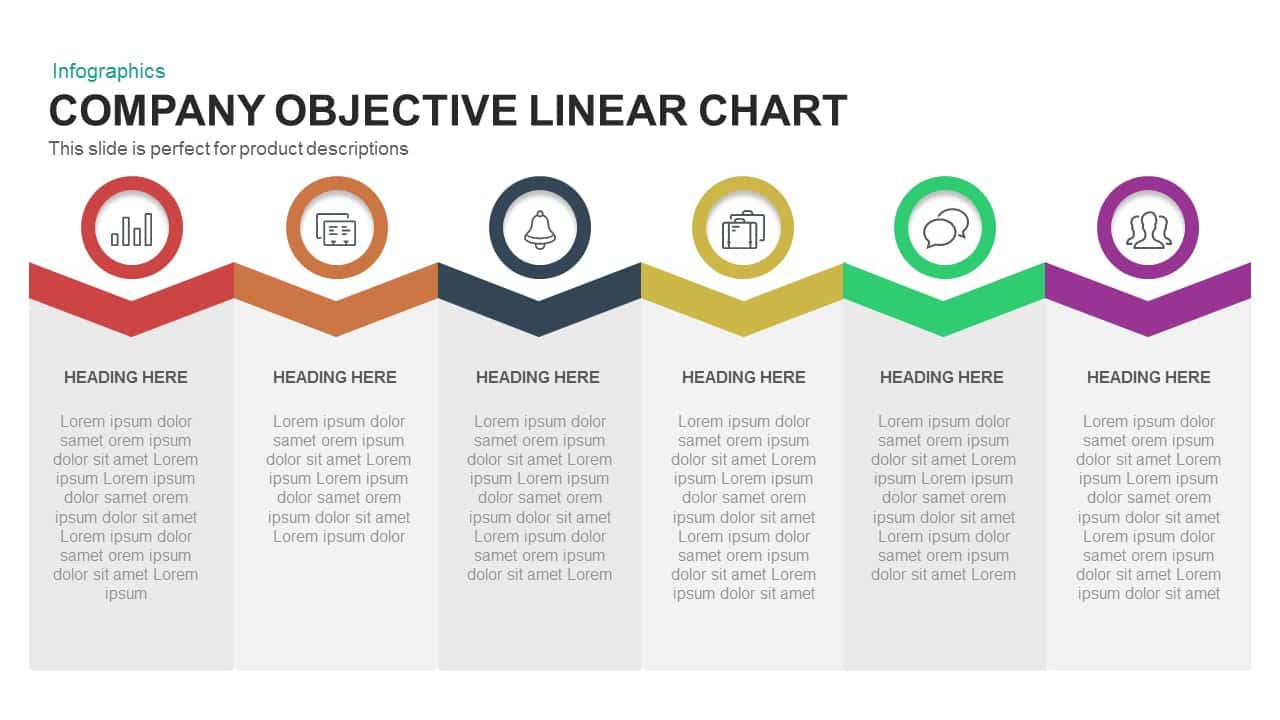
Company Objective Linear Chart Template for PowerPoint & Google Slides
Flow Charts

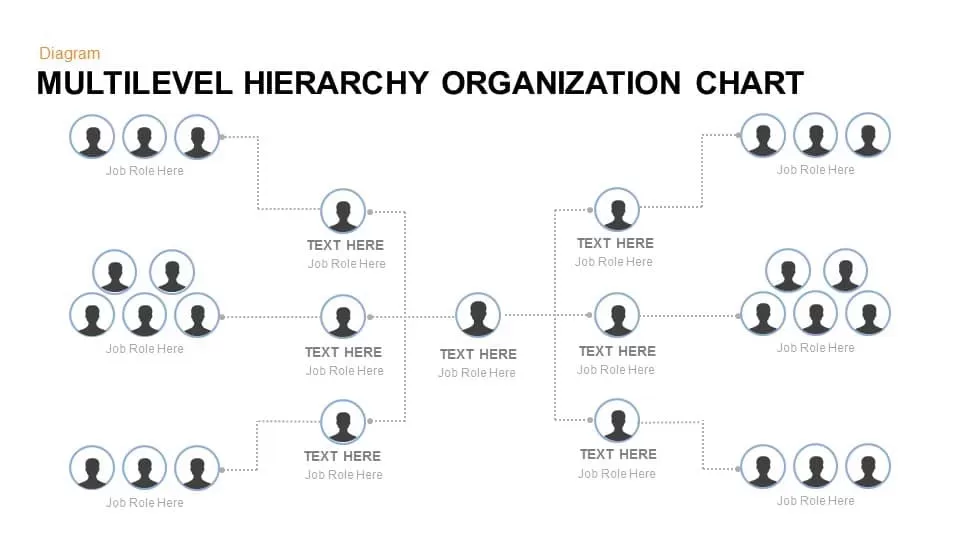
Multilevel Hierarchy Organization Chart template for PowerPoint & Google Slides
Org Chart
Comparison Chart Overview template for PowerPoint & Google Slides
Comparison Chart
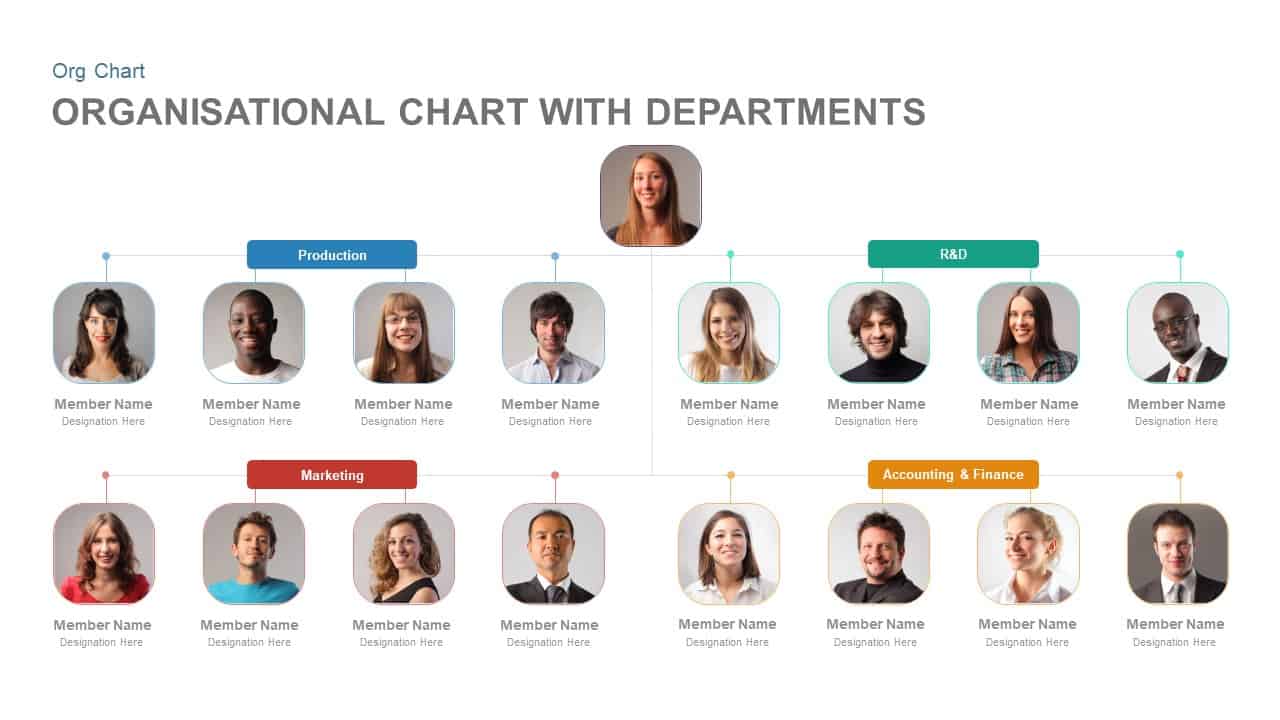
Organisational Chart with Departments Template for PowerPoint & Google Slides
Org Chart
Modern Colorful Circular Org Chart Template for PowerPoint & Google Slides
Org Chart
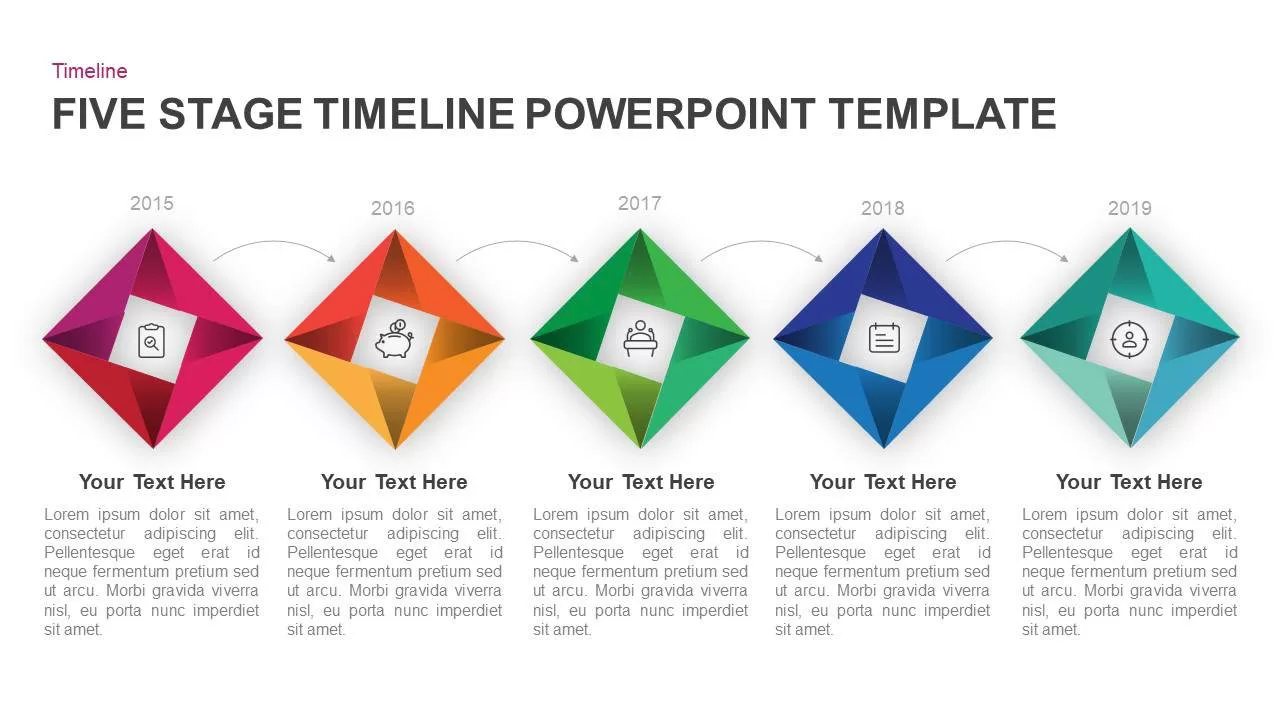
Five-Stage Diamond Timeline Chart Template for PowerPoint & Google Slides
Timeline
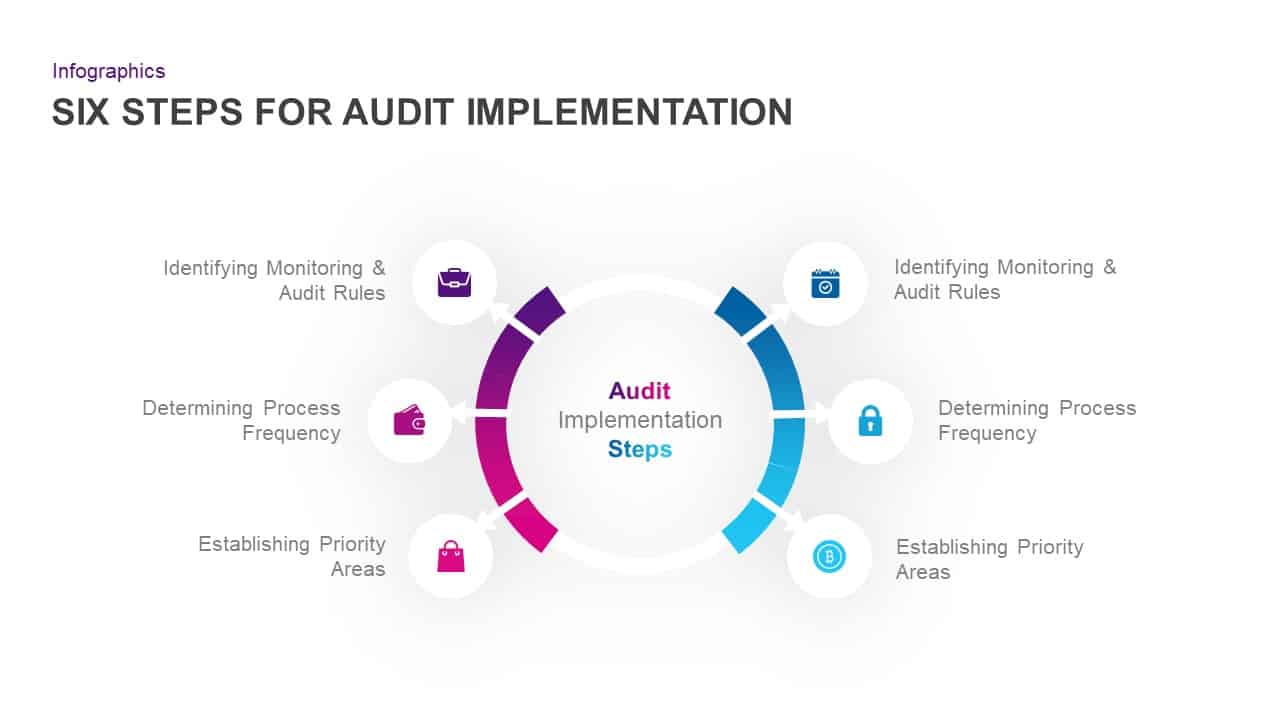
Six-Step Audit Implementation Chart Template for PowerPoint & Google Slides
Circular

BMI Category Comparison Chart Template for PowerPoint & Google Slides
Comparison
Creative Organizational Chart Template for PowerPoint & Google Slides
Org Chart
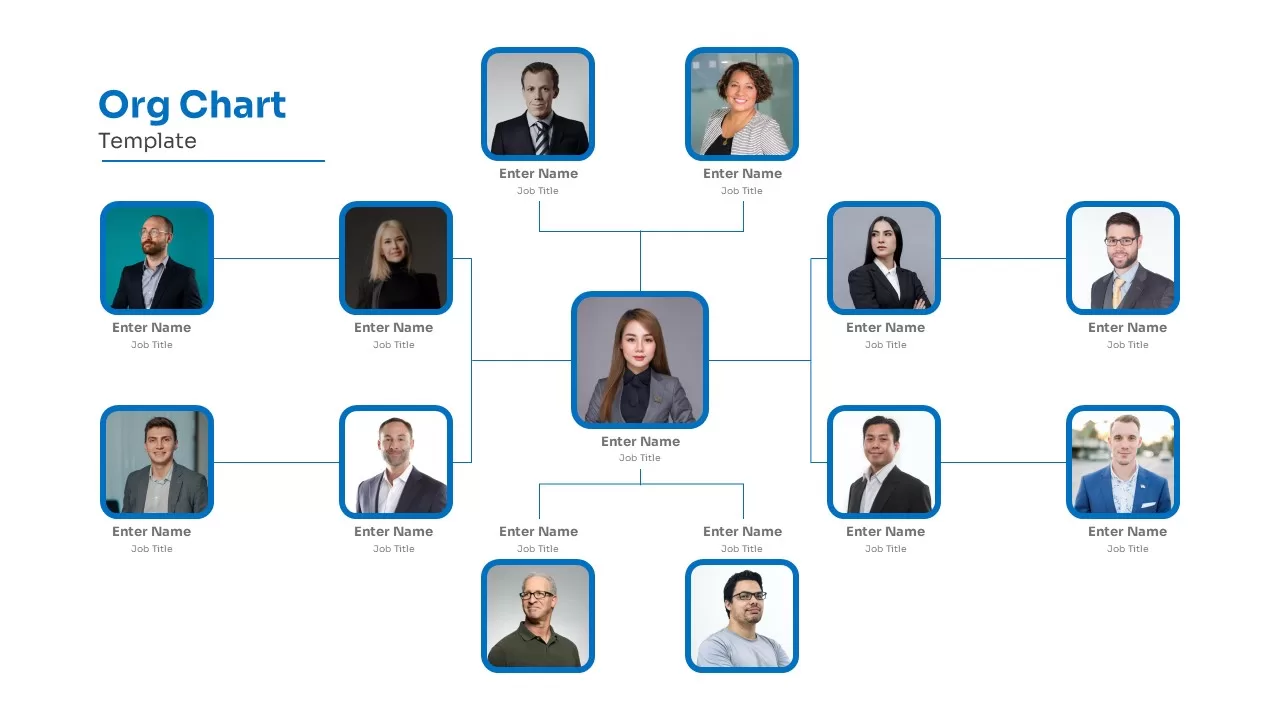
Professional Organizational Chart Diagram Template for PowerPoint & Google Slides
Org Chart
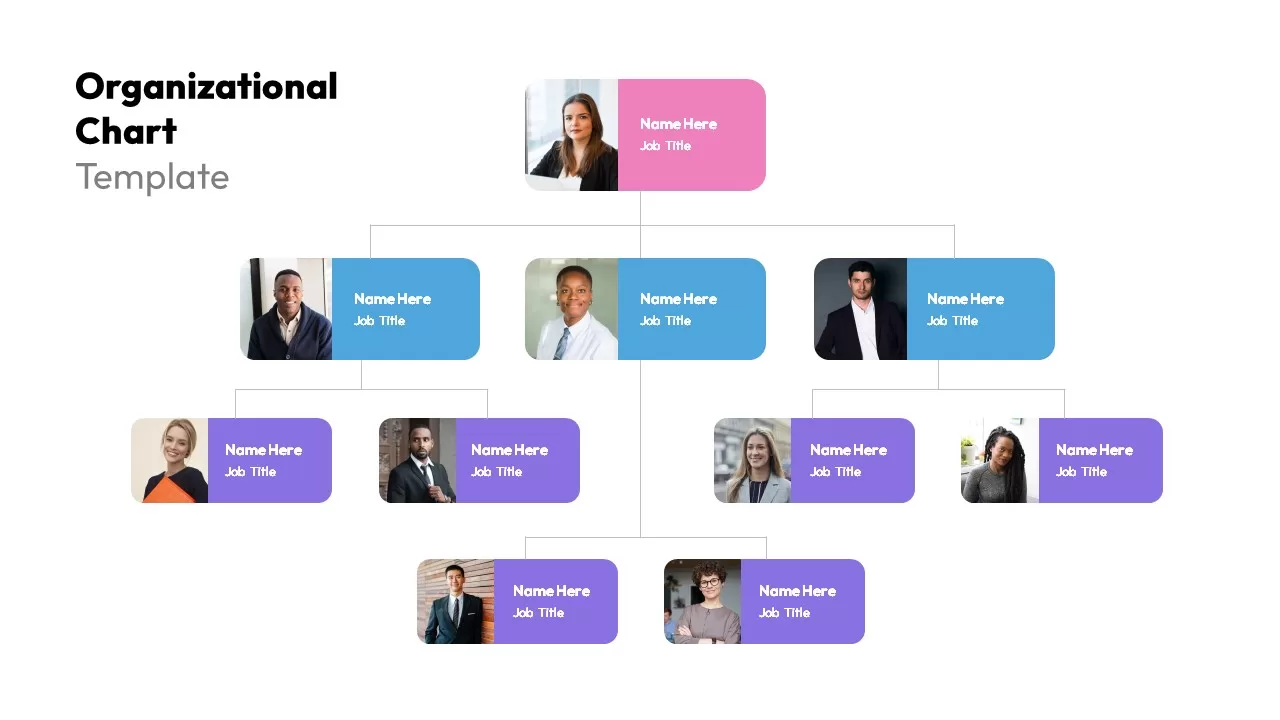
Modern Photo-Based Organizational Chart Template for PowerPoint & Google Slides
Org Chart
Modern Image-Based Organizational Chart Template for PowerPoint & Google Slides
Infographics
Organizational Chart Structure template for PowerPoint & Google Slides
Business Plan
Flow Chart Template for PowerPoint & Google Slides
Flow Charts
Interactive Project Gantt Chart Timeline Template for PowerPoint & Google Slides
Gantt Chart
Dynamic Benchmarking Comparison Chart Template for PowerPoint & Google Slides
Comparison Chart
Donut Chart Data Breakdown template for PowerPoint & Google Slides
Pie/Donut
MABA Attractiveness Matrix Chart Template for PowerPoint & Google Slides
Comparison Chart
Waffle Chart Data Visualization Template for PowerPoint & Google Slides
Comparison Chart
People Demographic Comparison Chart Template for PowerPoint & Google Slides
Comparison
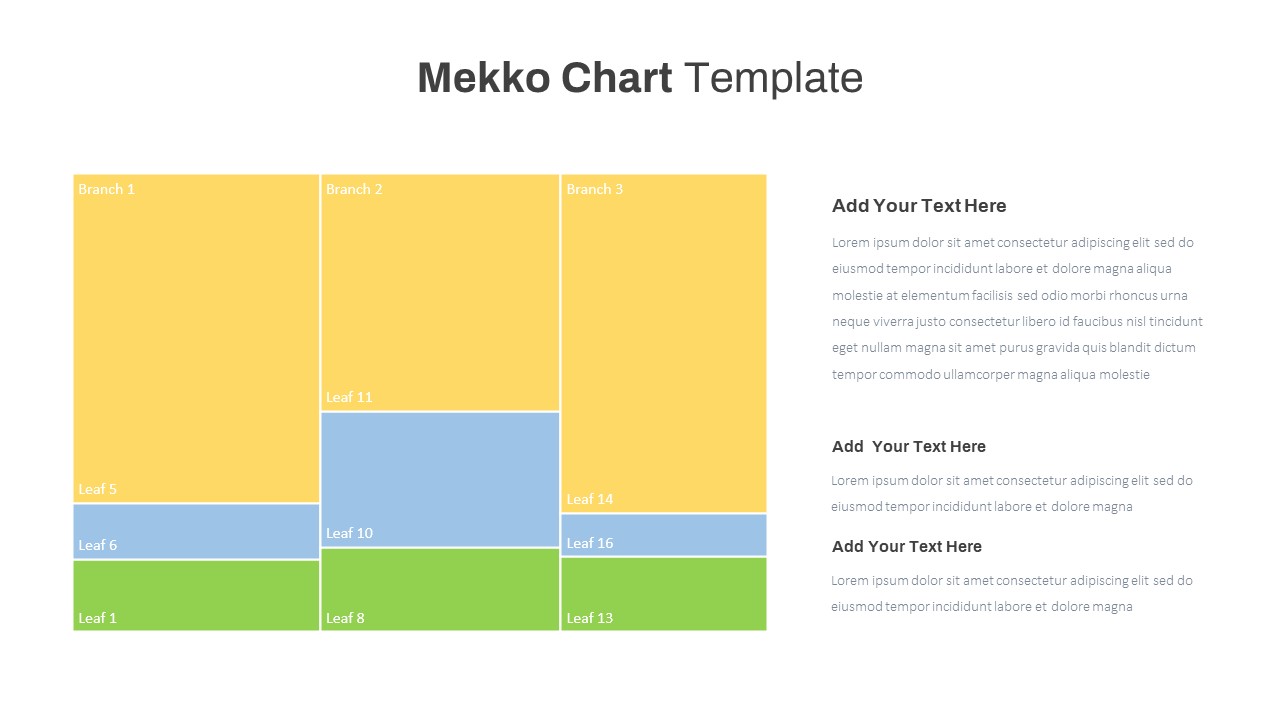
Mekko Chart with Segmented Branches & Leaves Template for PowerPoint & Google Slides
Bar/Column
Rectangle Area Chart with Gradient Fill Template for PowerPoint & Google Slides
Comparison Chart
Waterfall Chart Data Visualization Template for PowerPoint & Google Slides
Comparison Chart
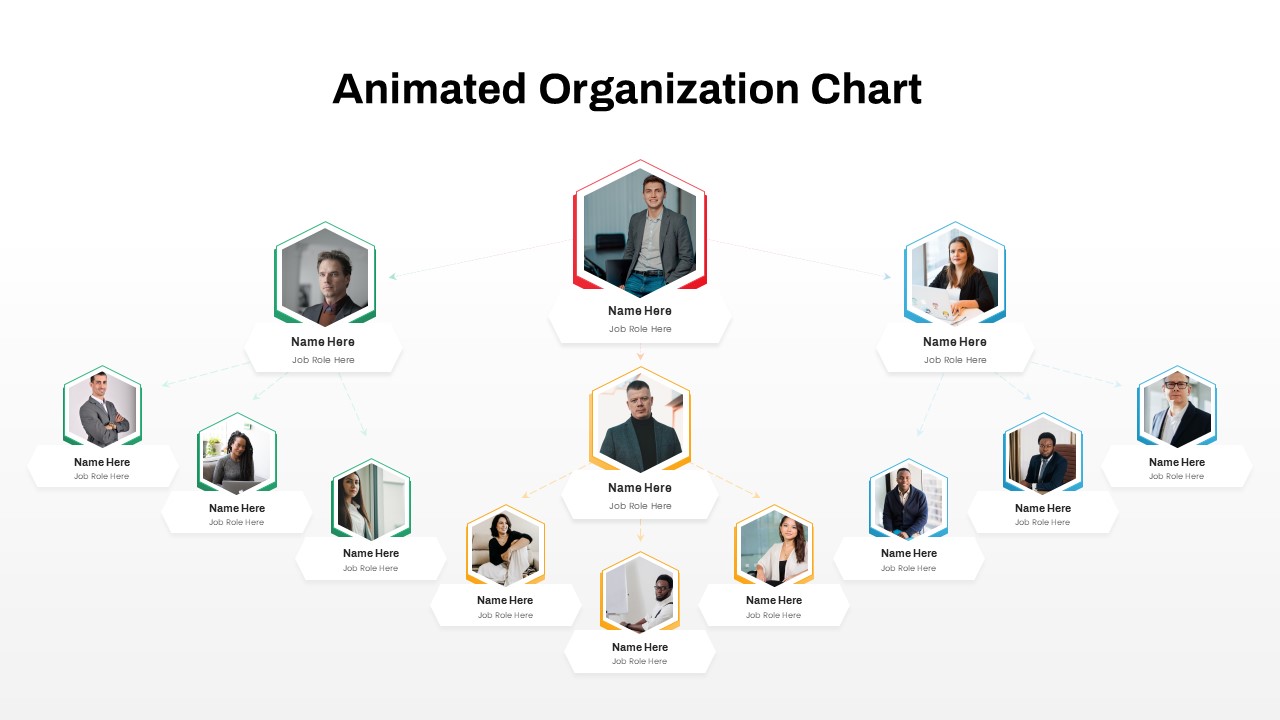
Animated Hexagon Org Chart Diagram Template for PowerPoint & Google Slides
Org Chart
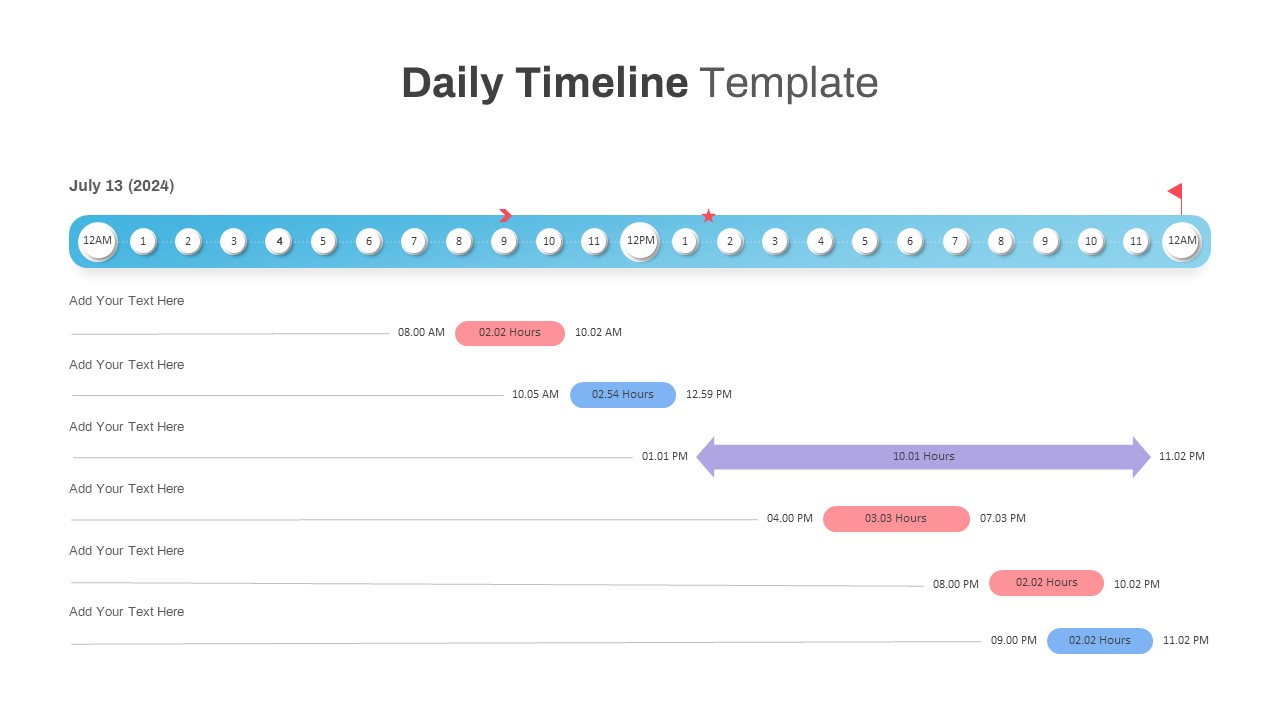
Interactive Daily Timeline Schedule Chart Template for PowerPoint & Google Slides
Timeline
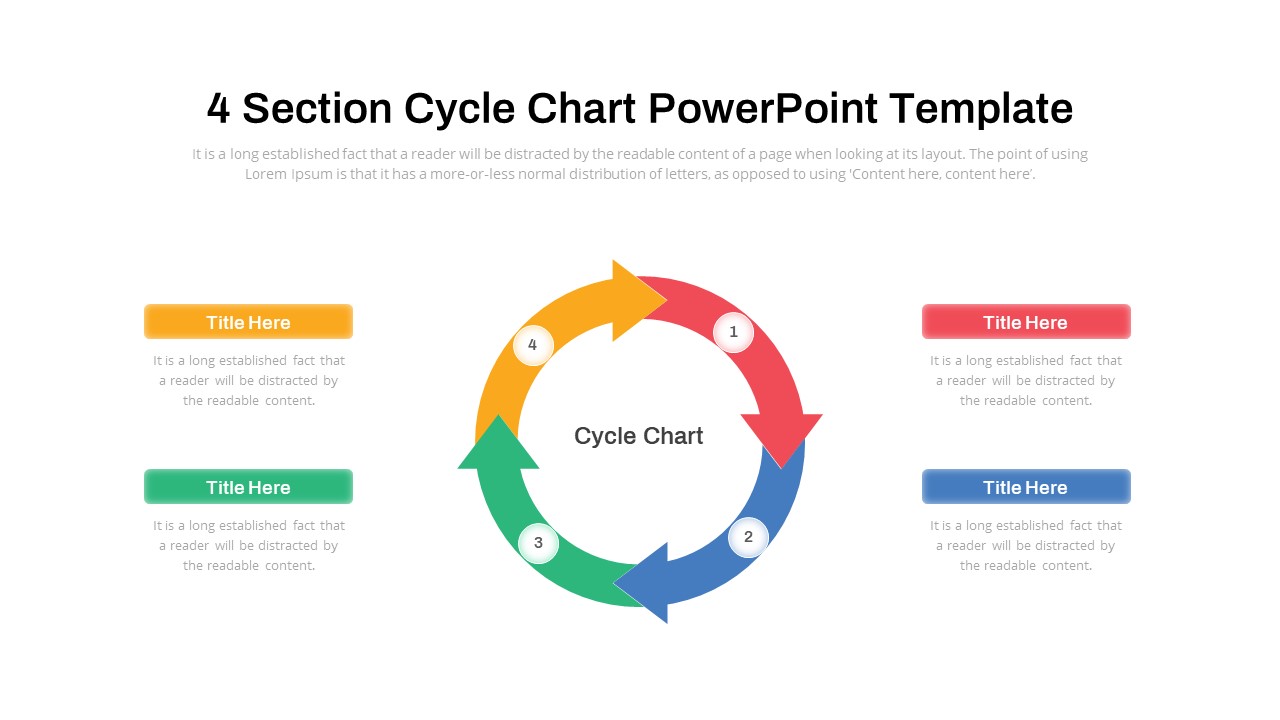
Cycle Chart Template for PowerPoint & Google Slides
Circular
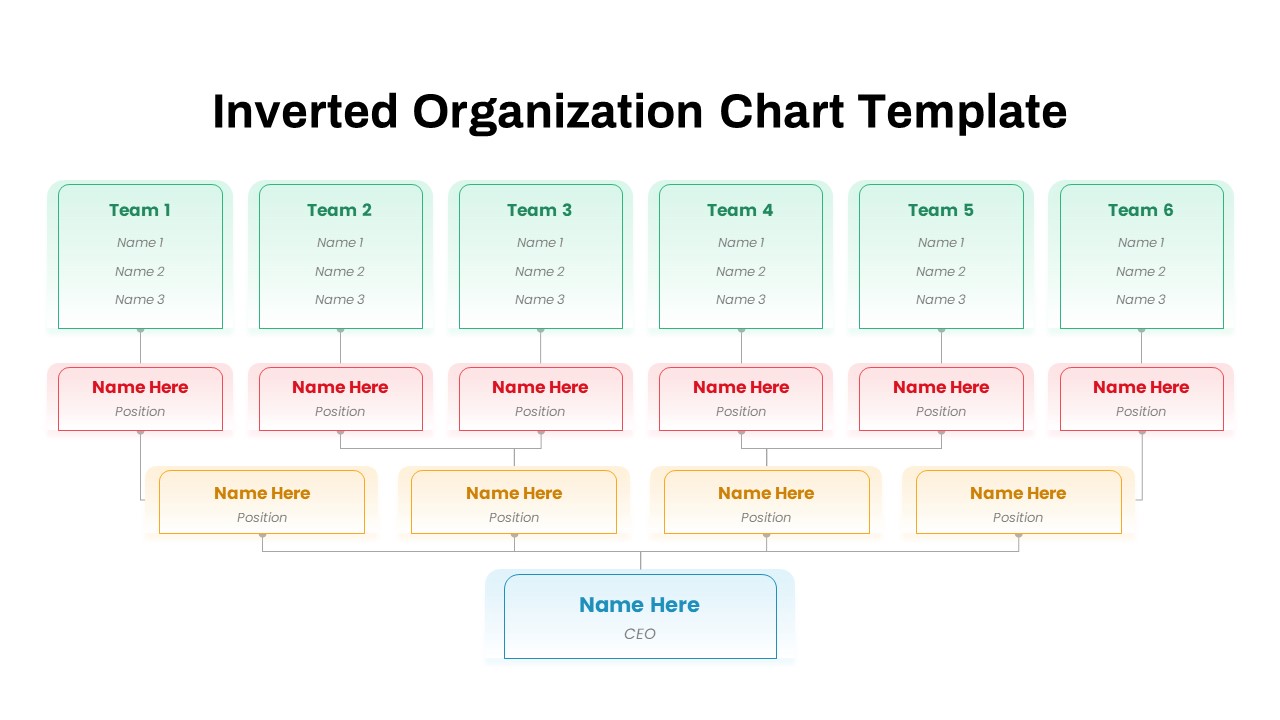
Inverted Organization Chart Diagram Template for PowerPoint & Google Slides
Org Chart
Multi-Level Wheel Chart Diagram template for PowerPoint & Google Slides
Pie/Donut
Multi-Level Colorful Pyramid Chart Template for PowerPoint & Google Slides
Pyramid
Quarterly Gross Profit Rate Chart Template for PowerPoint & Google Slides
Revenue
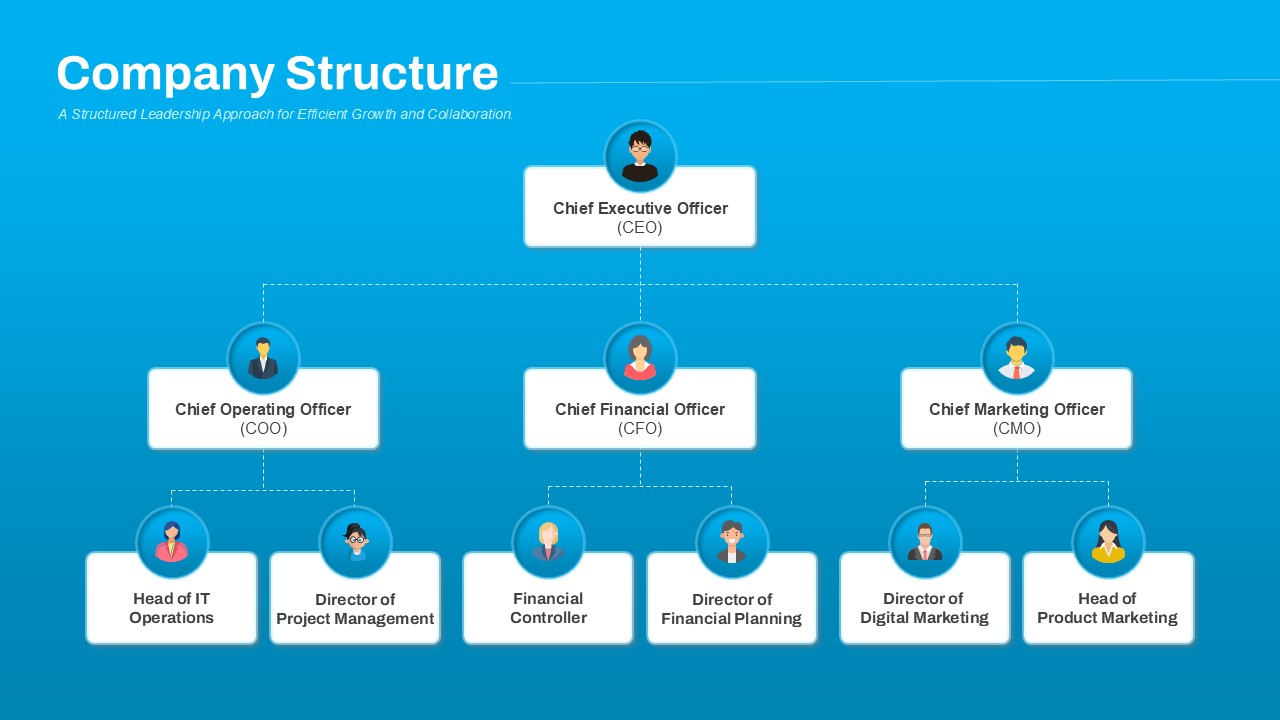
Company Structure Hierarchical Org Chart Template for PowerPoint & Google Slides
Org Chart
Profile Comparison Chart template for PowerPoint & Google Slides
Comparison Chart
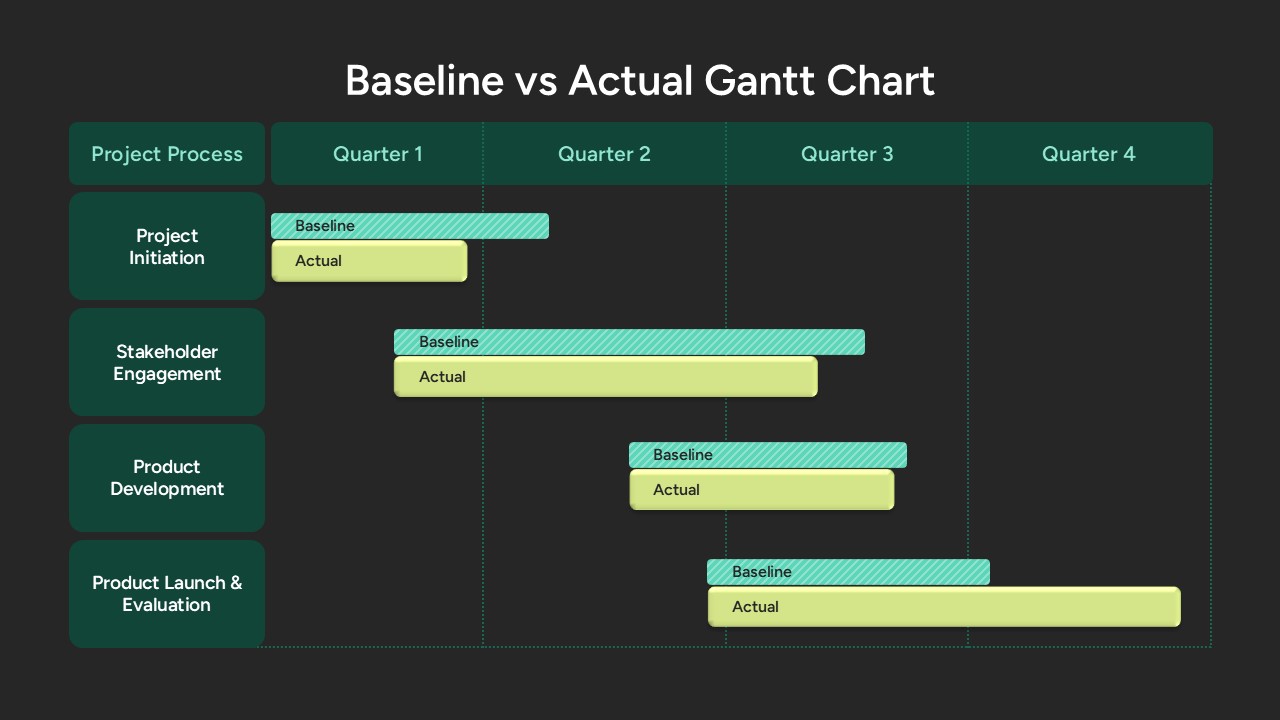
Baseline vs Actual Gantt Chart Template for PowerPoint & Google Slides
Gantt Chart
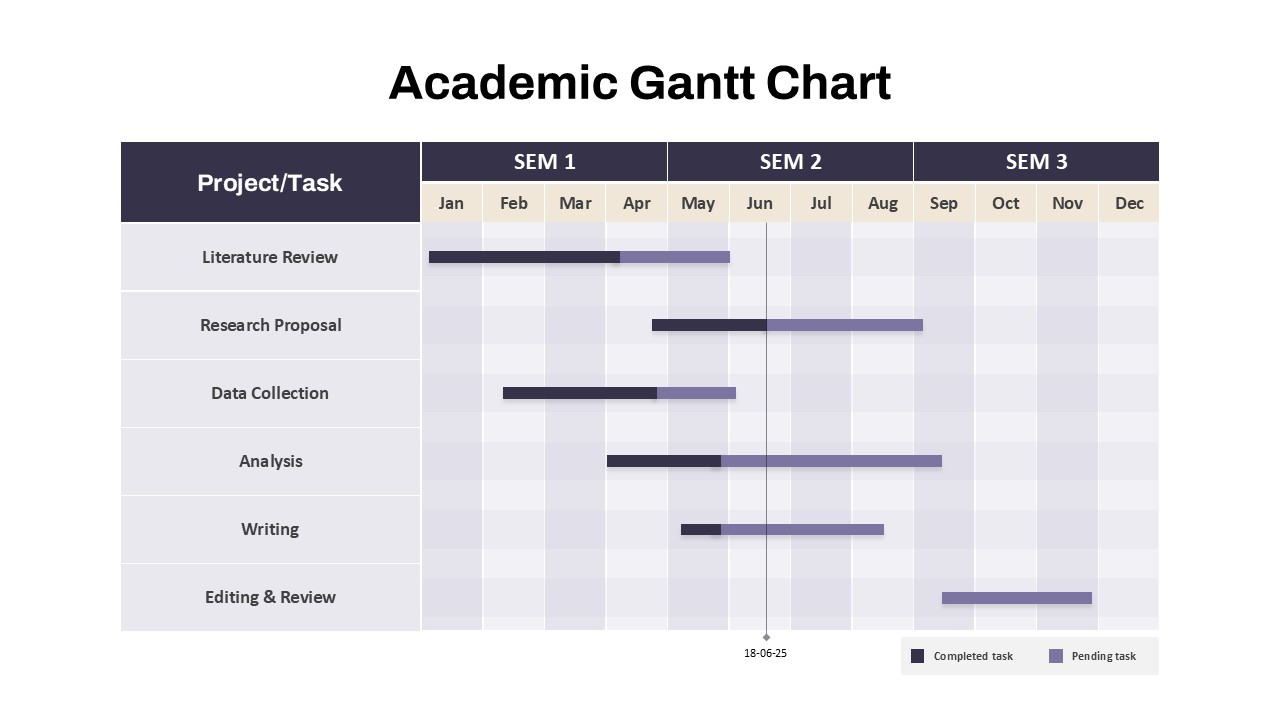
Academic Gantt Chart template for PowerPoint & Google Slides
Business
Disaster Response Role Matrix RACI Chart Template for PowerPoint & Google Slides
Project Status
Horizontal Organizational Chart Template for PowerPoint & Google Slides
Org Chart
Yearly Gantt Chart with Presentation Template for PowerPoint & Google Slides
Gantt Chart
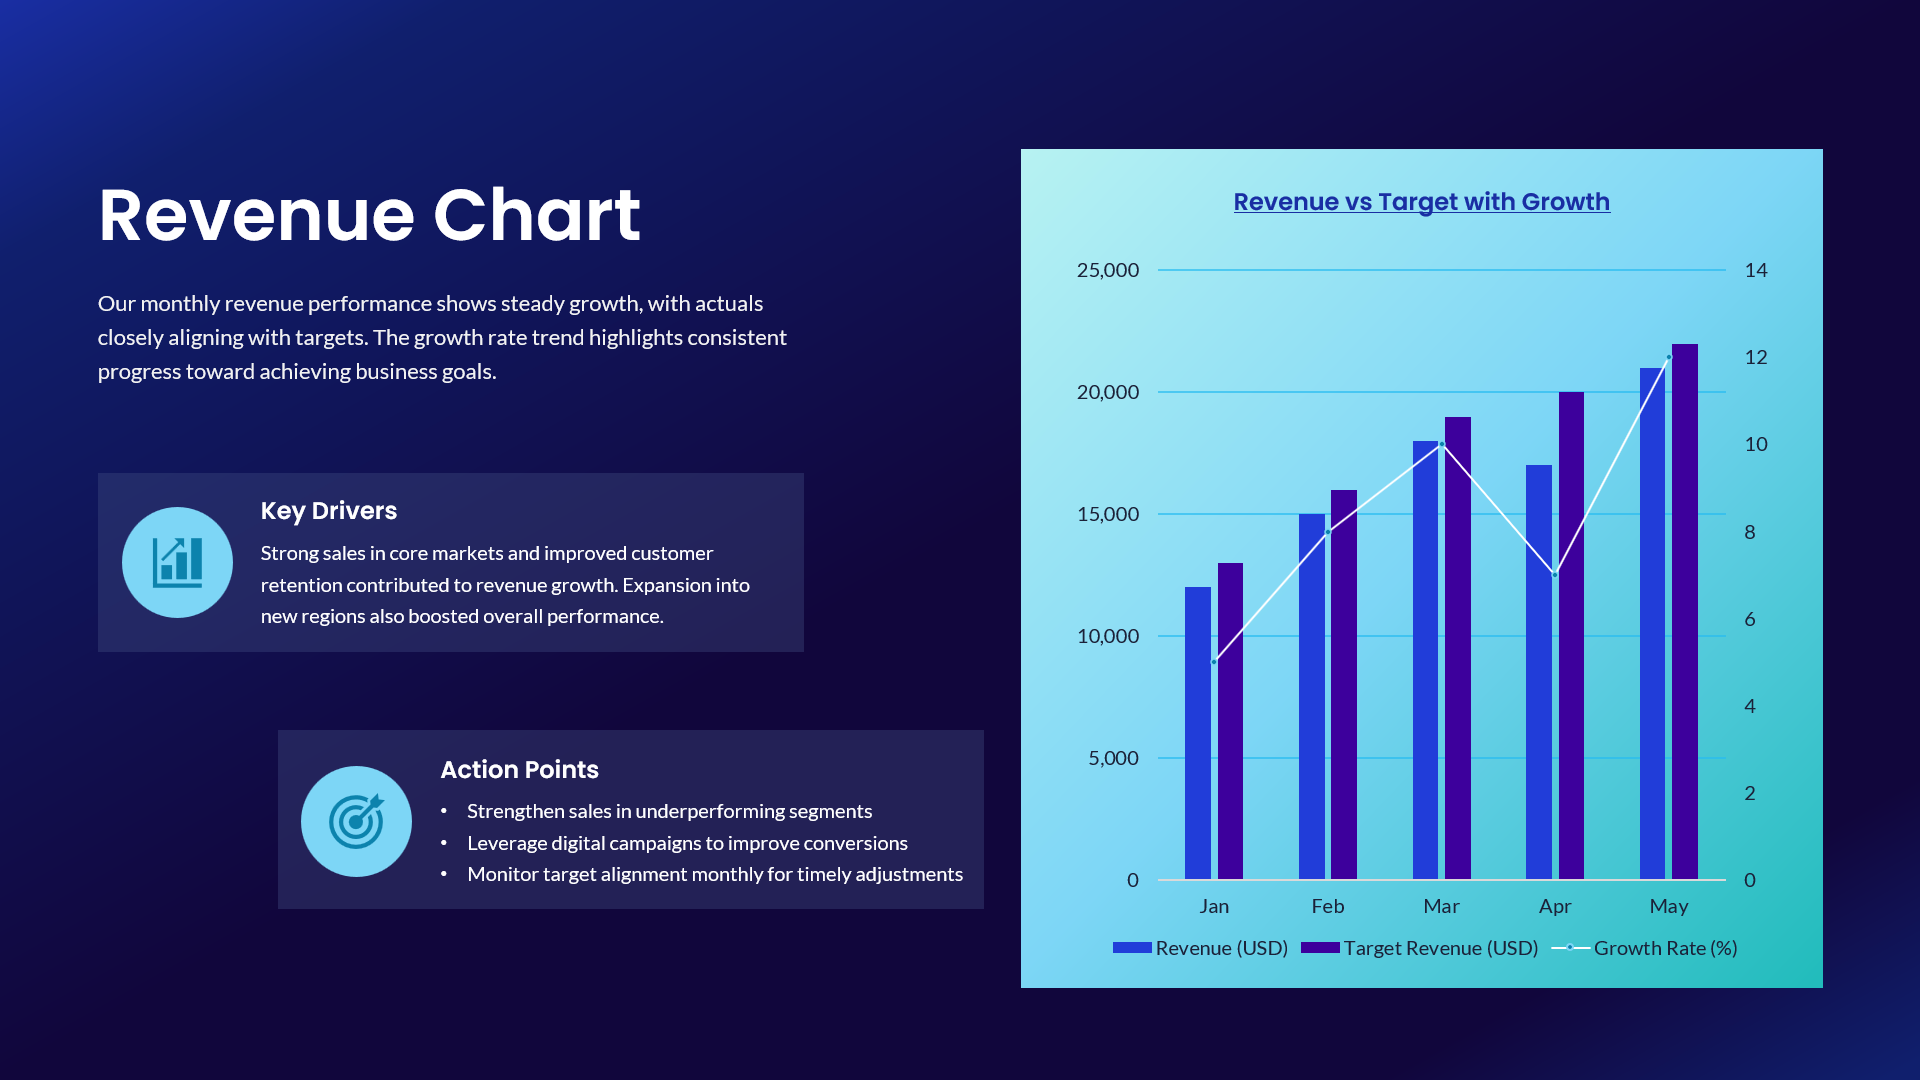
Revenue vs Target Growth Chart Template for PowerPoint & Google Slides
Revenue