Circular Timeline Infographics Template for PowerPoint & Google Slides
Description
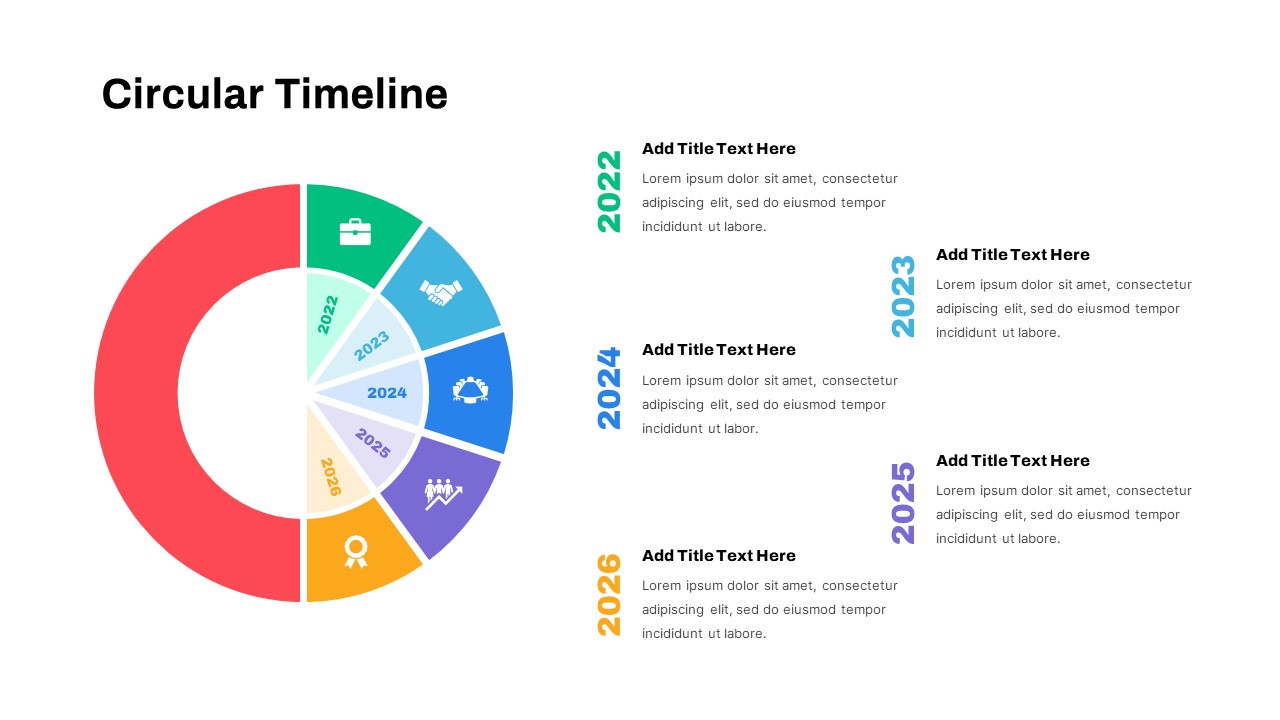
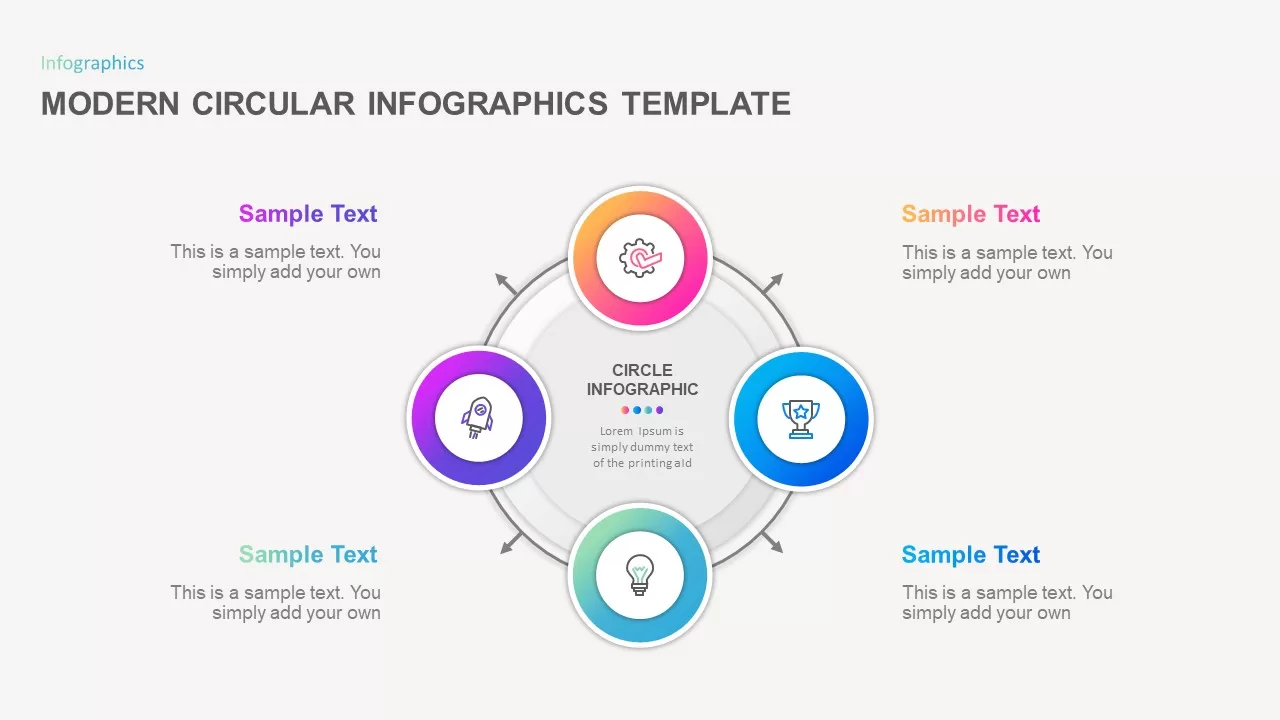
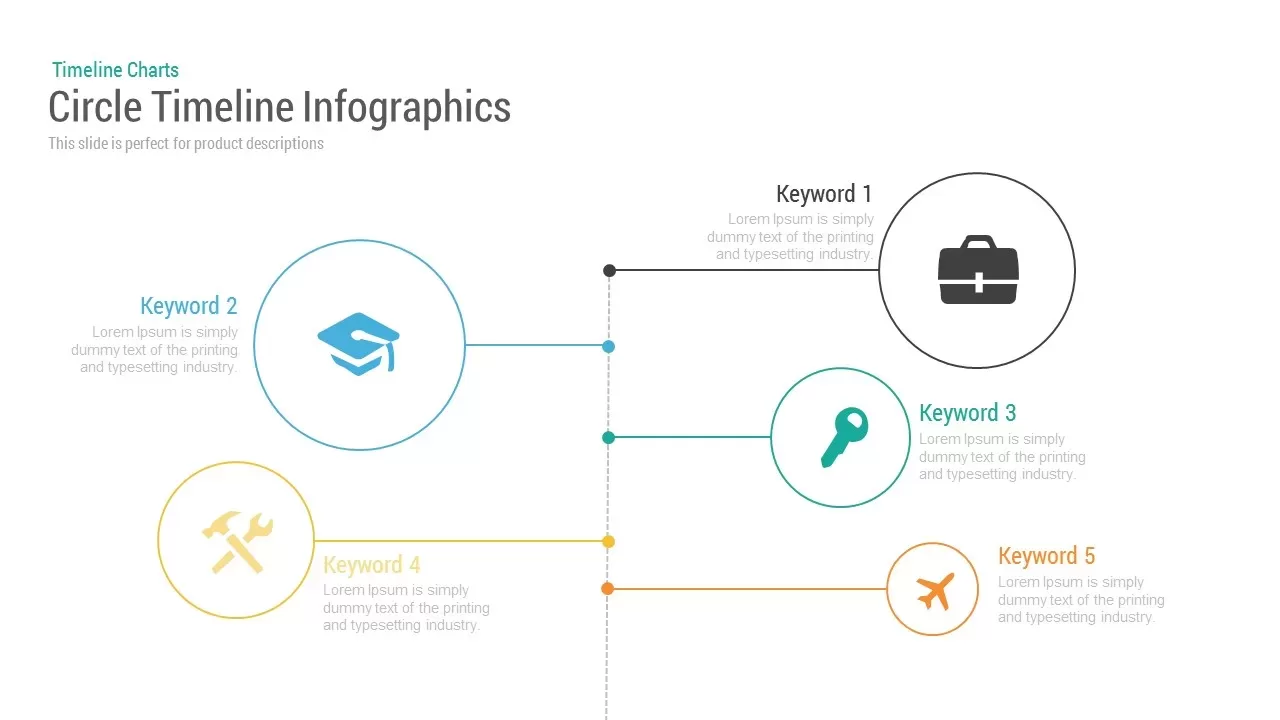
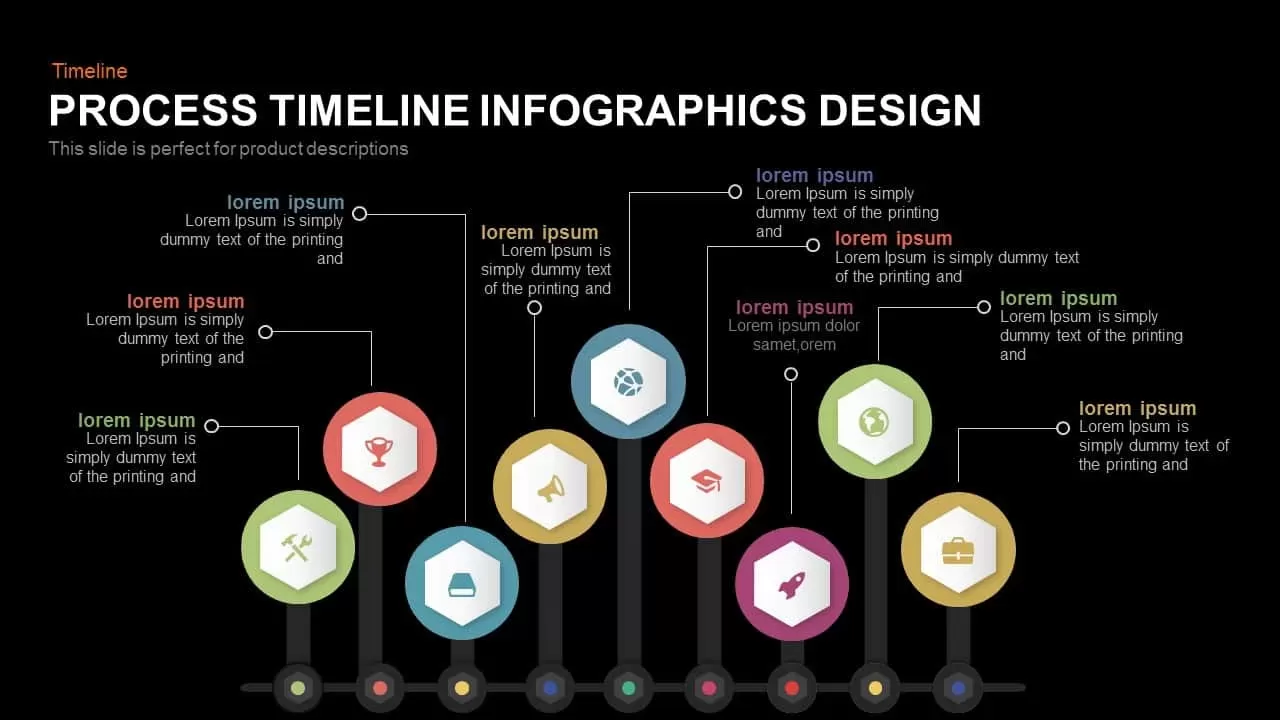
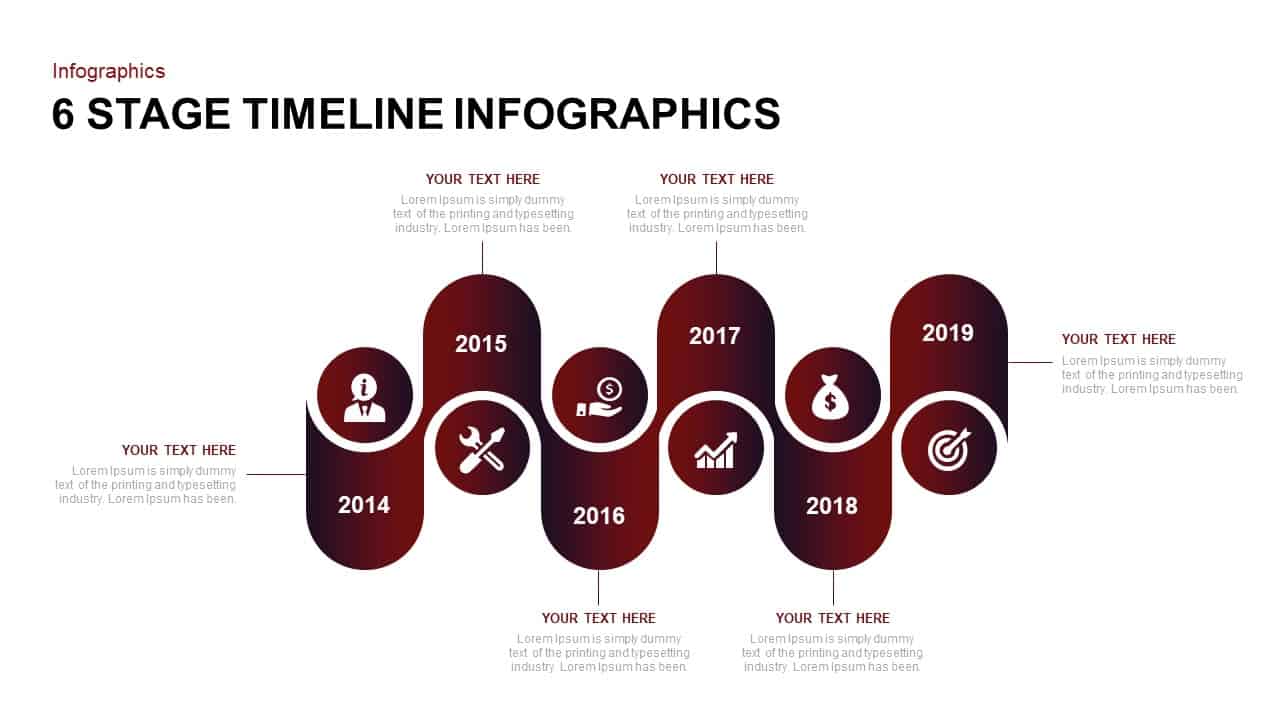
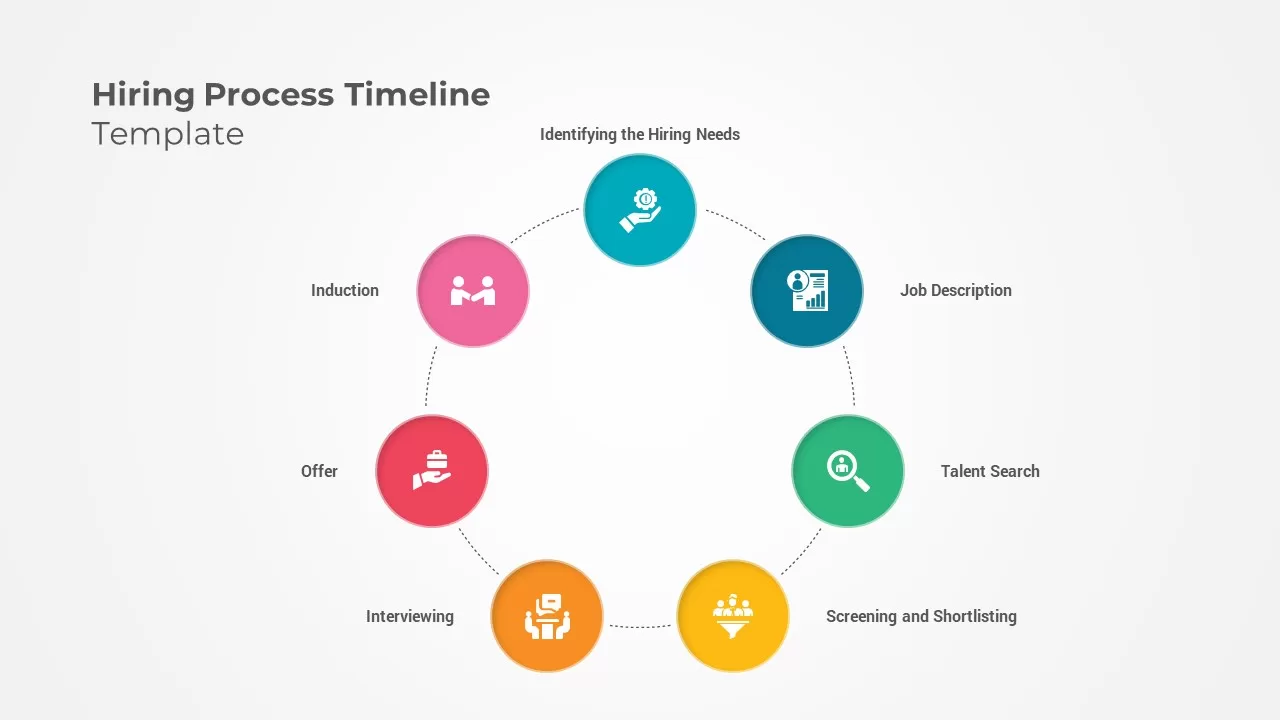
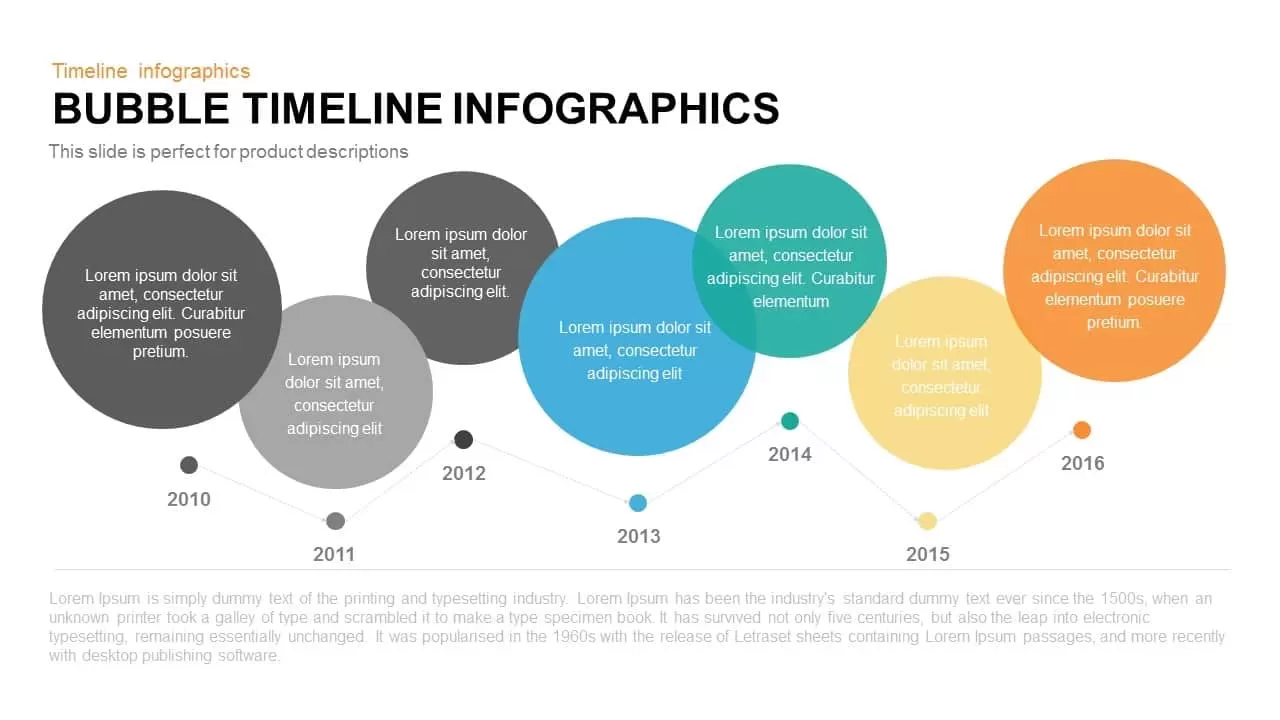
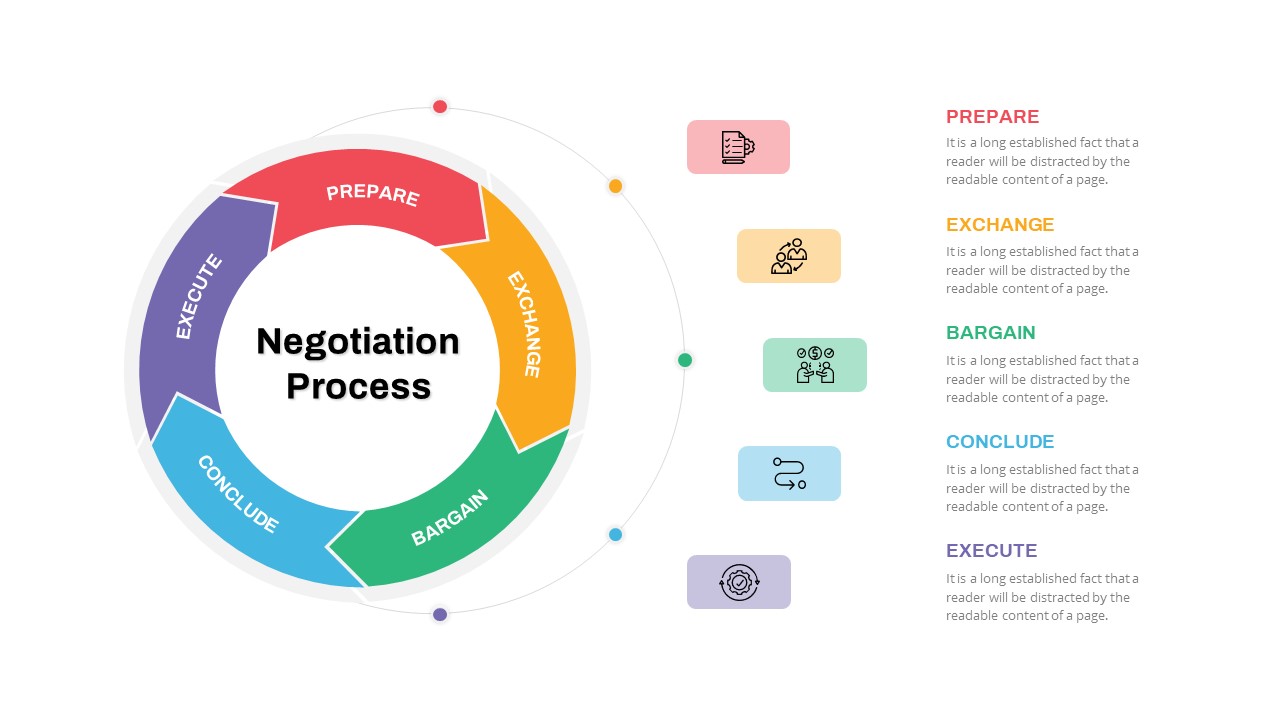
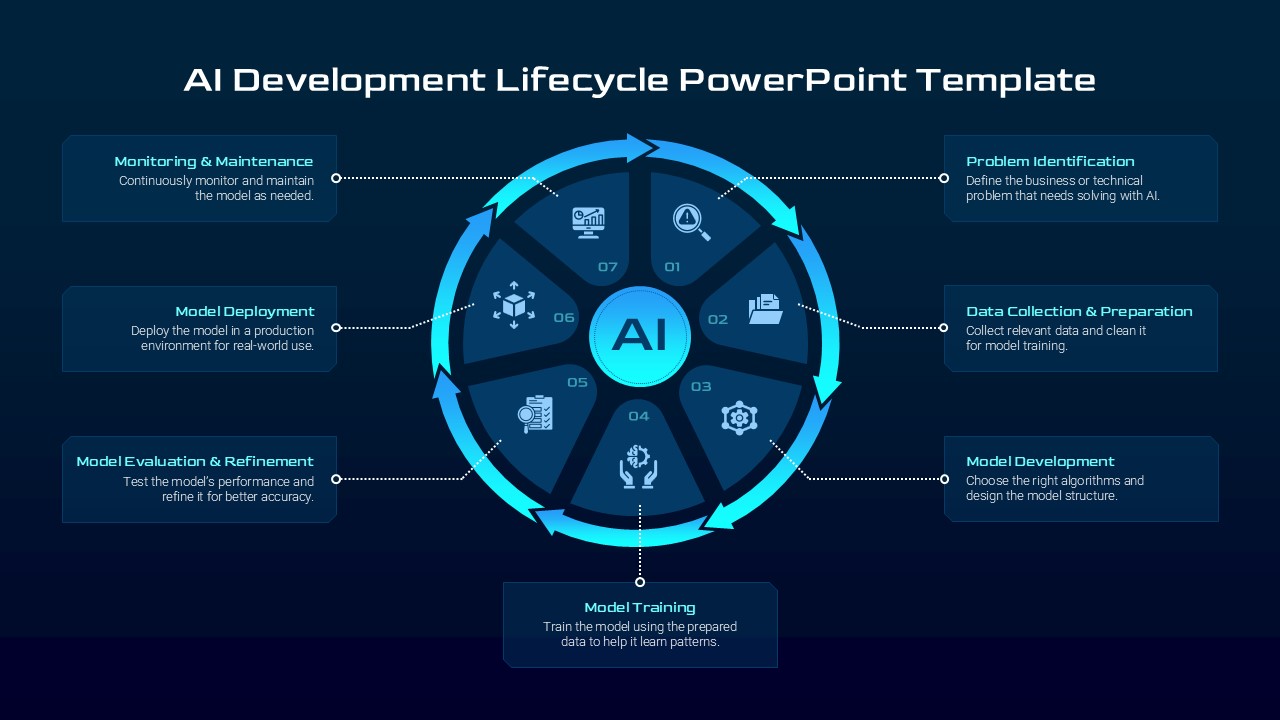
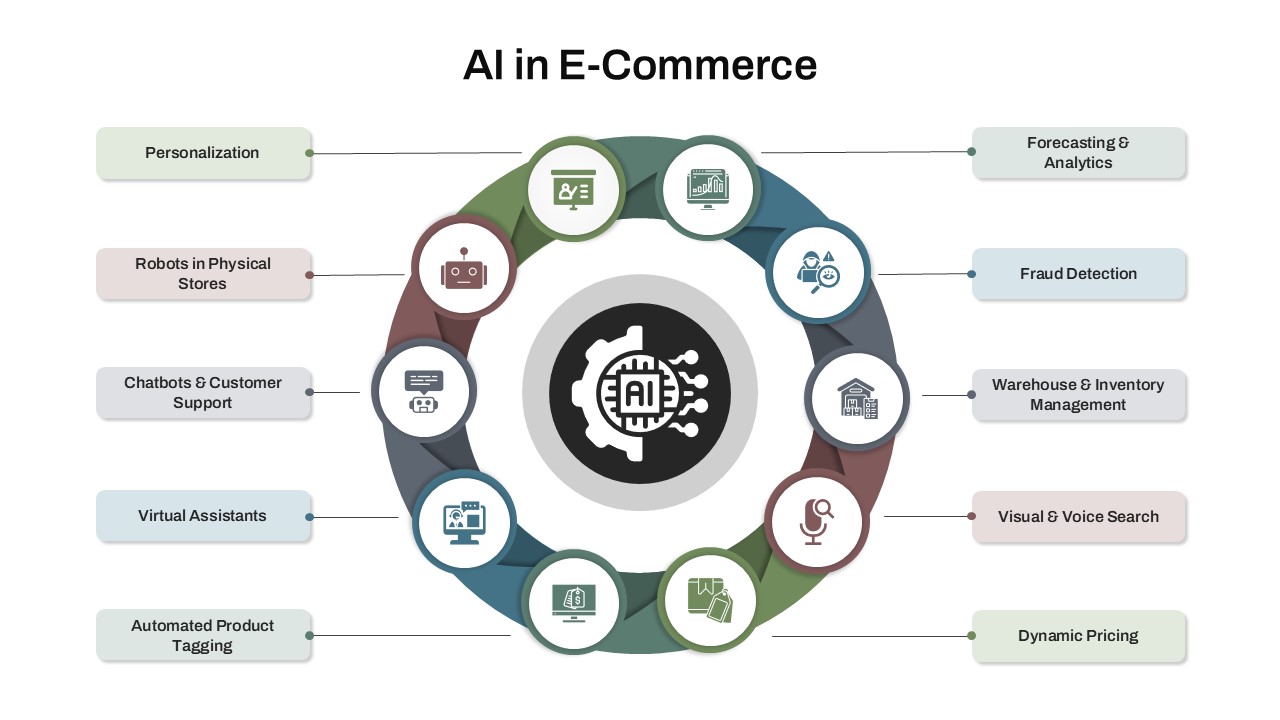
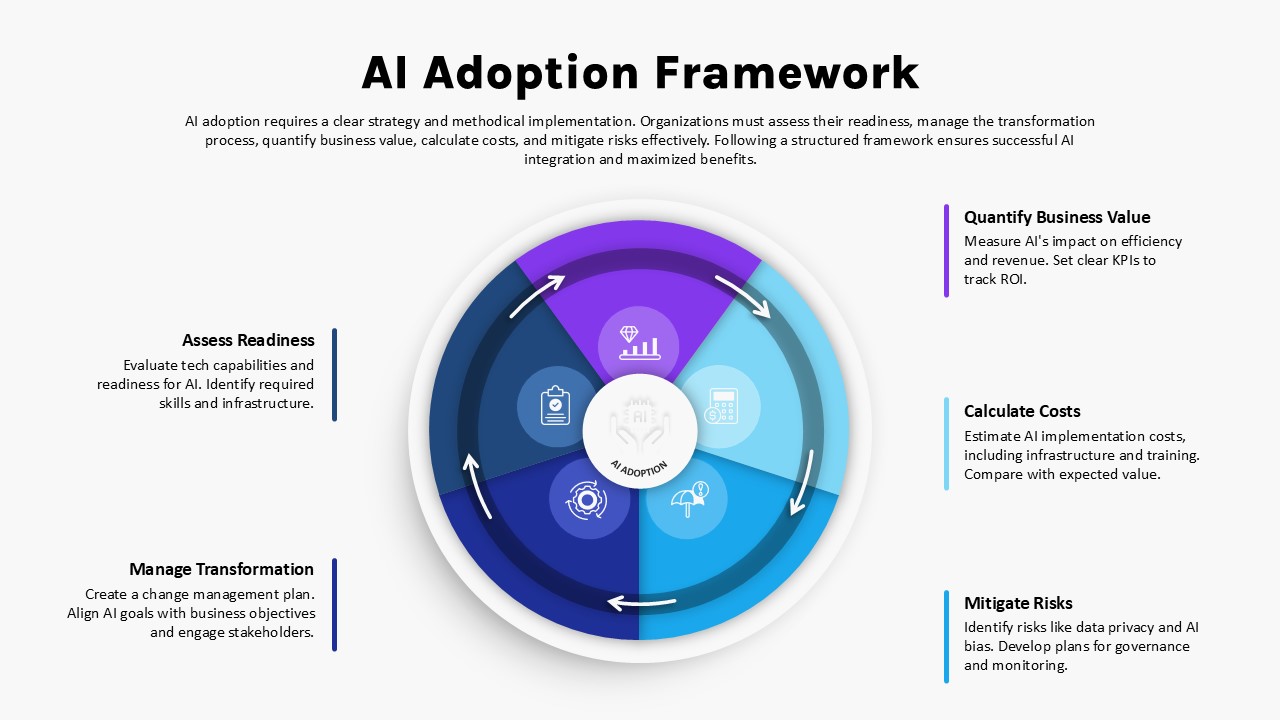
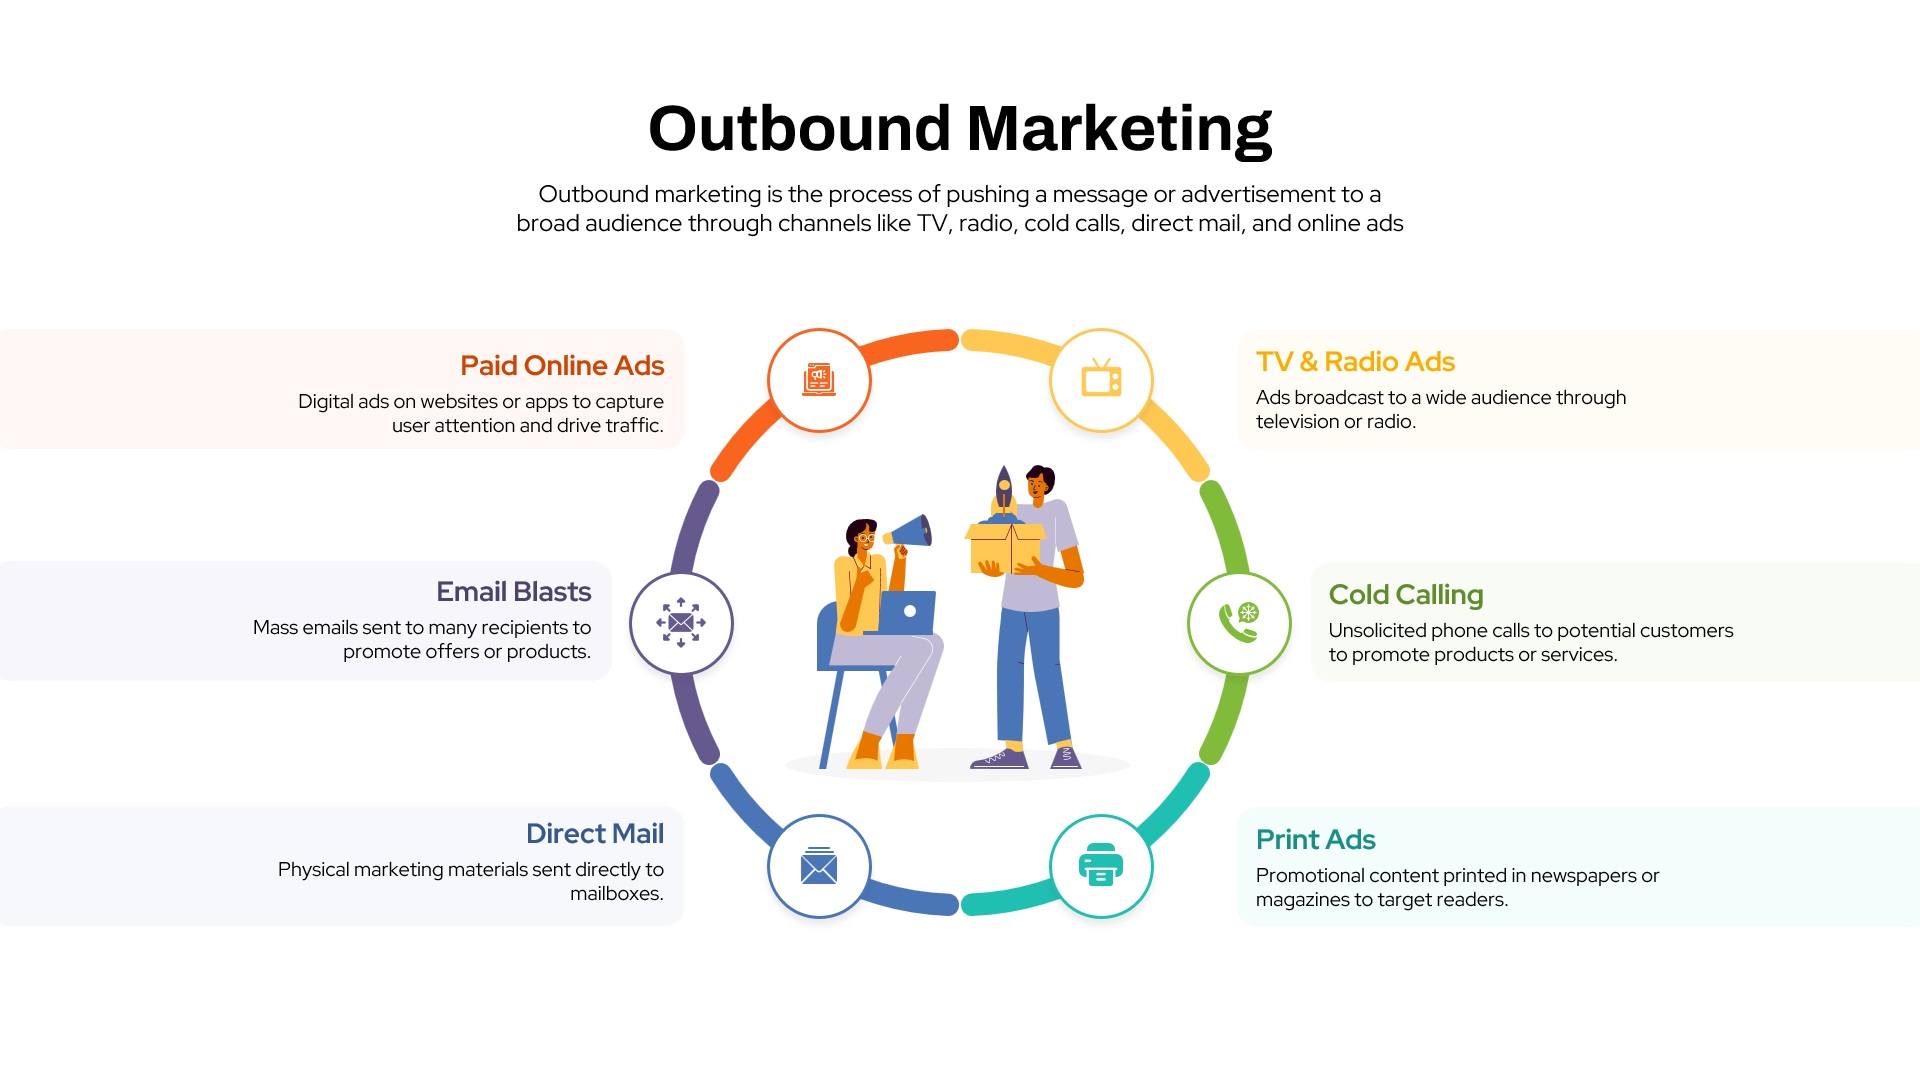
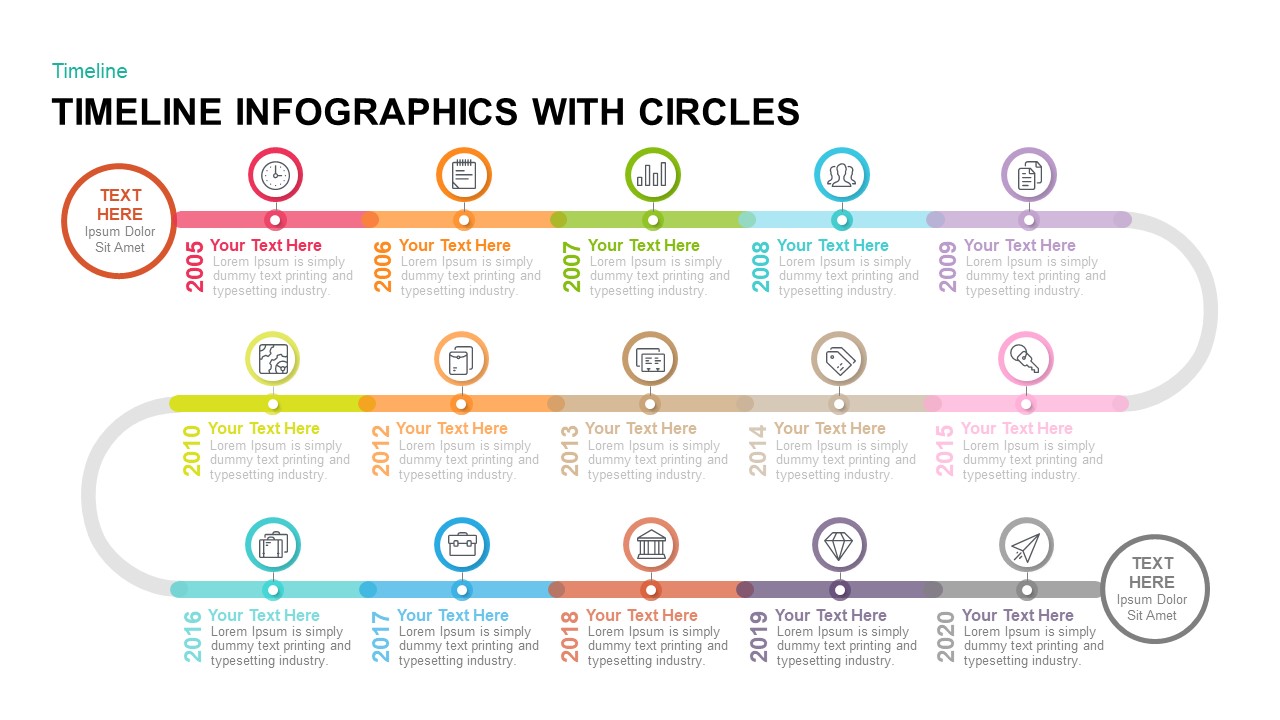
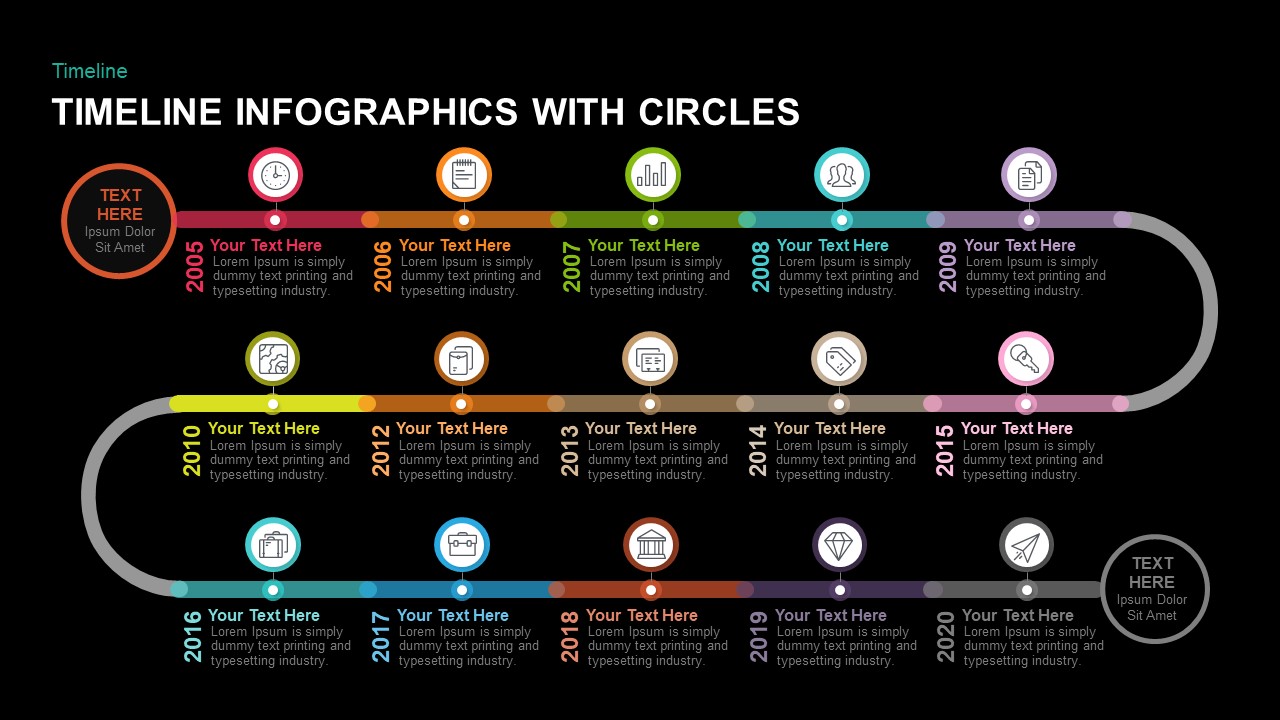
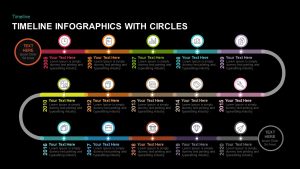
This vibrant circular timeline infographic slide visualizes up to sixteen sequential milestones along a looping path of color-coded dots and icons. Each year marker sits above or below the central curve, connected by fine lines to text callouts for clear annotations—ideal for showcasing product launches, campaign rollouts, or project phases. The smooth, rounded path wraps back to the start point, reinforcing the cyclical nature of processes, while distinctive iconography highlights key events at a glance. A clean white canvas and consistent sans-serif typography ensure maximum readability, and the balanced layout supports both short headlines and multi-line descriptions without crowding.
Built on master slides for both PowerPoint and Google Slides, this fully editable template leverages vector shapes for rapid customization. Swap out icons, recolor dots, or adjust the curve’s path with simple drag controls to match your brand palette. Text placeholders automatically expand for longer entries, eliminating manual resizing. Apply sequential entrance animations to each node to guide your audience through the story in stages, or use emphasis effects on critical years to spotlight pivotal moments. High-resolution vectors guarantee flawless rendering on large-screen presentations, printed handouts, or PDF reports.
Whether you’re presenting a company’s decade-long evolution, mapping technology adoption cycles, or detailing research timelines, this circular infographic keeps viewers engaged and oriented. The modular design supports extension to additional years or contraction for shorter spans, making it a versatile asset across decks. Pair this slide with complementary layouts—such as process flows, milestone roadmaps, or comparison charts—to build a cohesive, professional presentation that captures both overview and detail.
Who is it for
Corporate strategists, project managers, and marketing teams will leverage this slide for annual reviews, product roadmaps, and campaign timelines. Consultants, trainers, and educators can also employ the circular layout to illustrate learning modules, research milestones, or customer-journey loops.
Other Uses
Repurpose this design for risk-assessment cycles, compliance checkpoints, or budget planning intervals. Customize iconography and colors to map service delivery phases, stakeholder engagement stages, or performance-measurement periods—offering a clear, memorable framework for any time-based narrative.
Login to download this file

Item ID
SB00937
Related Templates

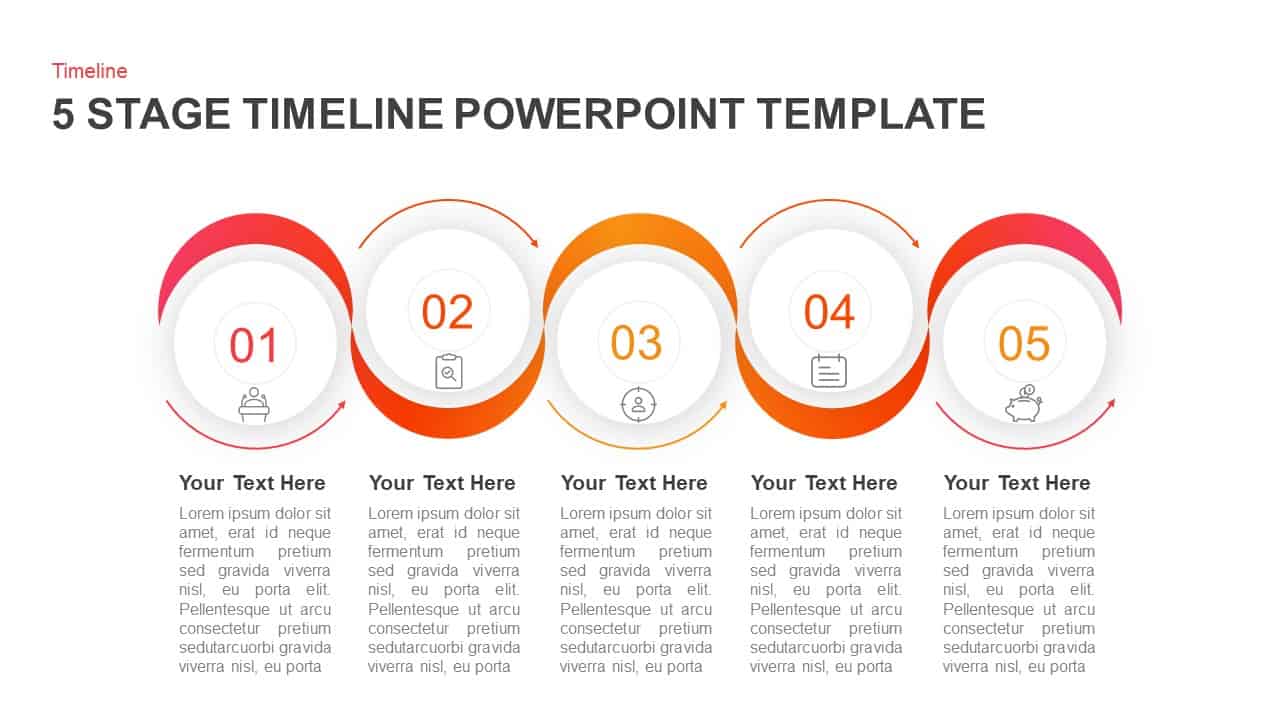
5 Stage Circular Timeline Infographic Template for PowerPoint & Google Slides
Timeline

Free Five-Step Circular Timeline Infographic Template for PowerPoint & Google Slides
Timeline
Free
Circular Timeline Infographic Template for PowerPoint & Google Slides
Timeline
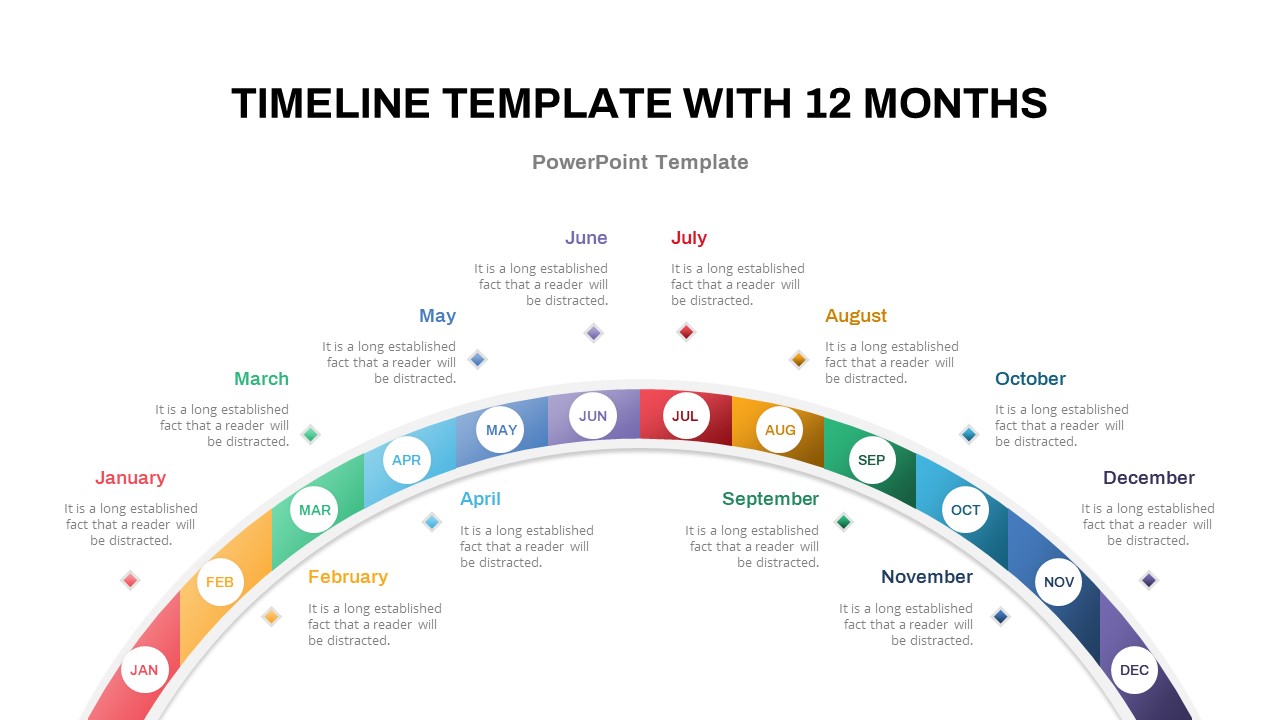
12-Month Semi-Circular Timeline Diagram Template for PowerPoint & Google Slides
Timeline
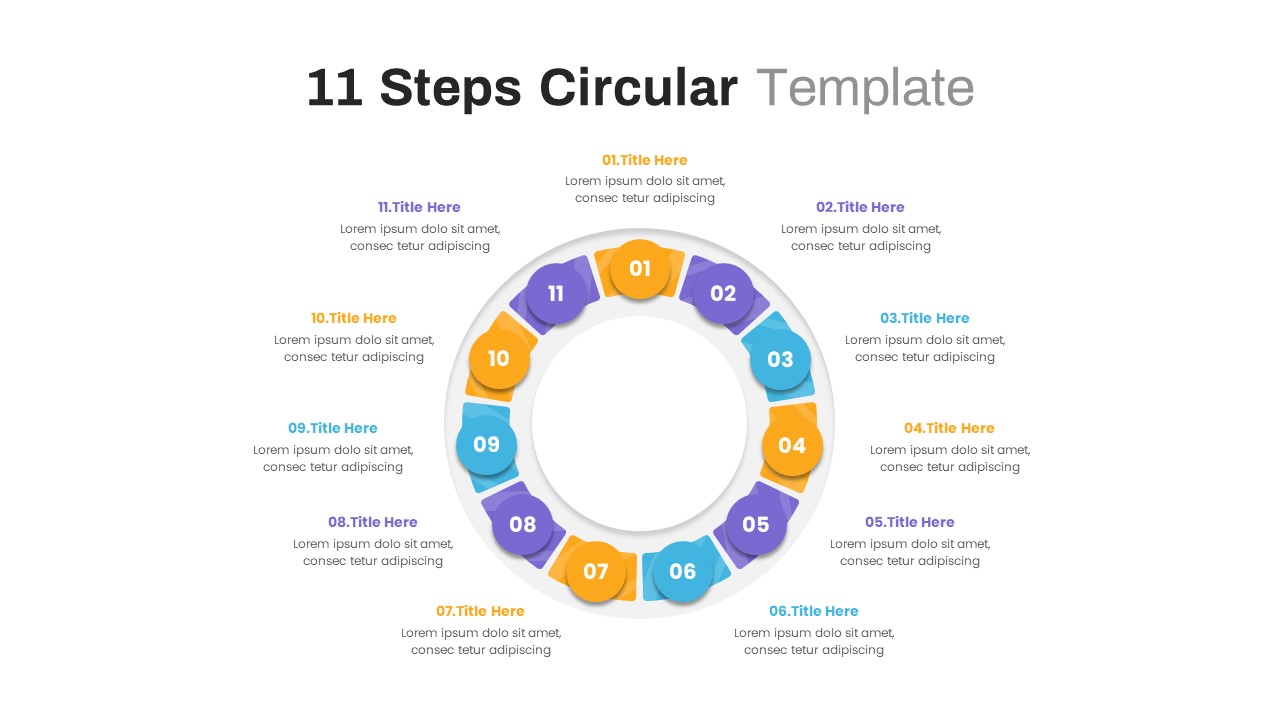
Modern 11-Step Circular Timeline Template for PowerPoint & Google Slides
Timeline
3D Arrow Infographics Circular Flow Template for PowerPoint & Google Slides
Arrow

Four-Step Circular Process Infographics Template for PowerPoint & Google Slides
Circular
Modern Circular Infographics Template for PowerPoint & Google Slides
Circular
Five-Step Circular Badge Infographics Template for PowerPoint & Google Slides
Circular
Six-Step Circular Diagram Infographics Template for PowerPoint & Google Slides
Circular
8-Step Circular Diagram Infographics Template for PowerPoint & Google Slides
Circular
Supply Chain Circular Process Infographics Template for PowerPoint & Google Slides
Business Strategy
8-Step Circular Gear Infographics Diagram for PowerPoint & Google Slides
Process
Circle Timeline Infographics template for PowerPoint & Google Slides
Timeline

Dynamic Circle Timeline Infographics template for PowerPoint & Google Slides
Timeline
Process Timeline Infographics Design template for PowerPoint & Google Slides
Timeline
Multi-Stage Timeline Infographics Template for PowerPoint & Google Slides
Timeline
Five-Stage Arrow Infographics Timeline Template for PowerPoint & Google Slides
Arrow
Timeline Arrow Infographics Diagram Template for PowerPoint & Google Slides
Timeline
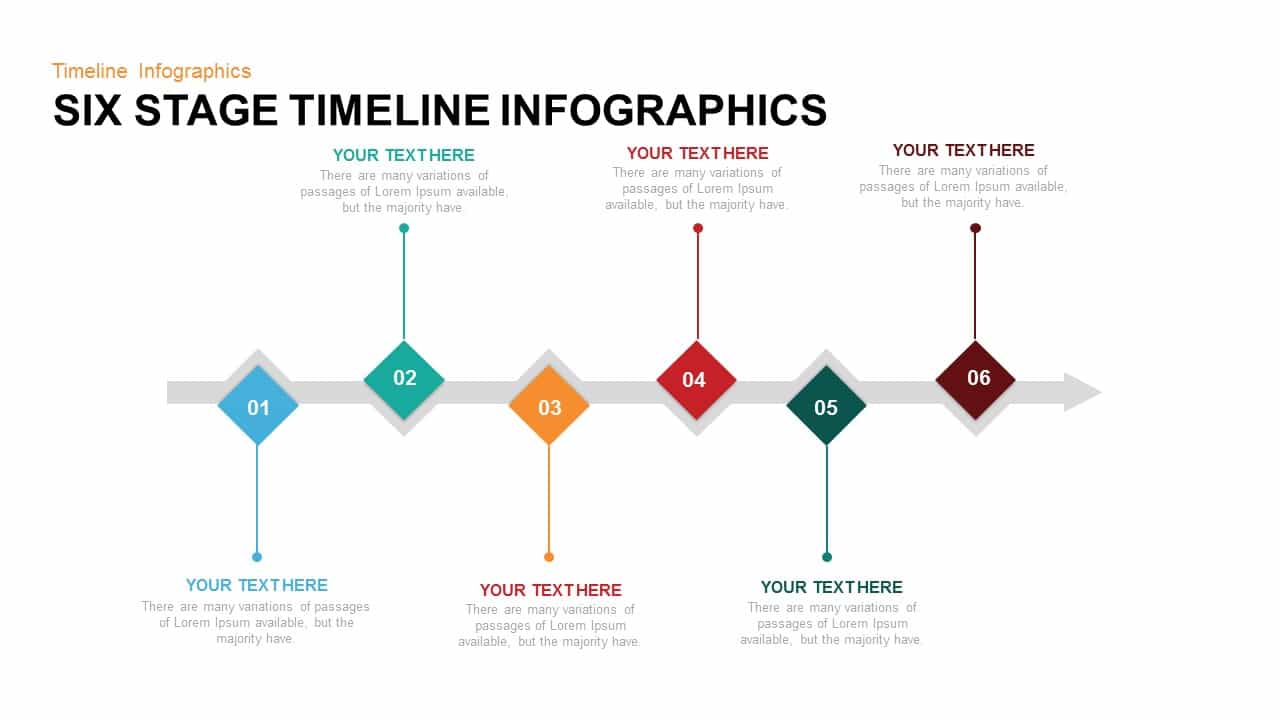
Six Stage Timeline Infographics Template for PowerPoint & Google Slides
Timeline

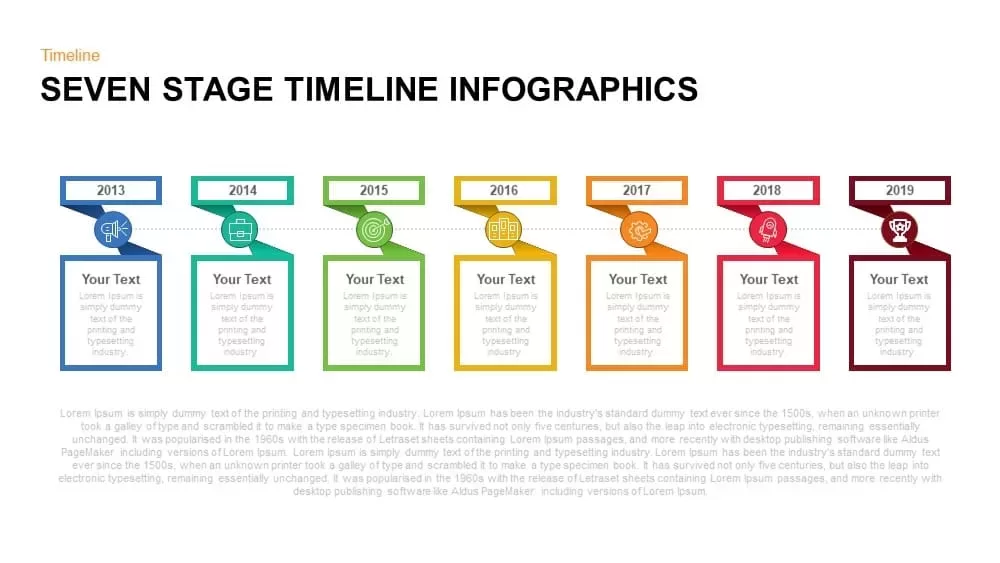
Seven-Stage Timeline Infographics Template for PowerPoint & Google Slides
Timeline
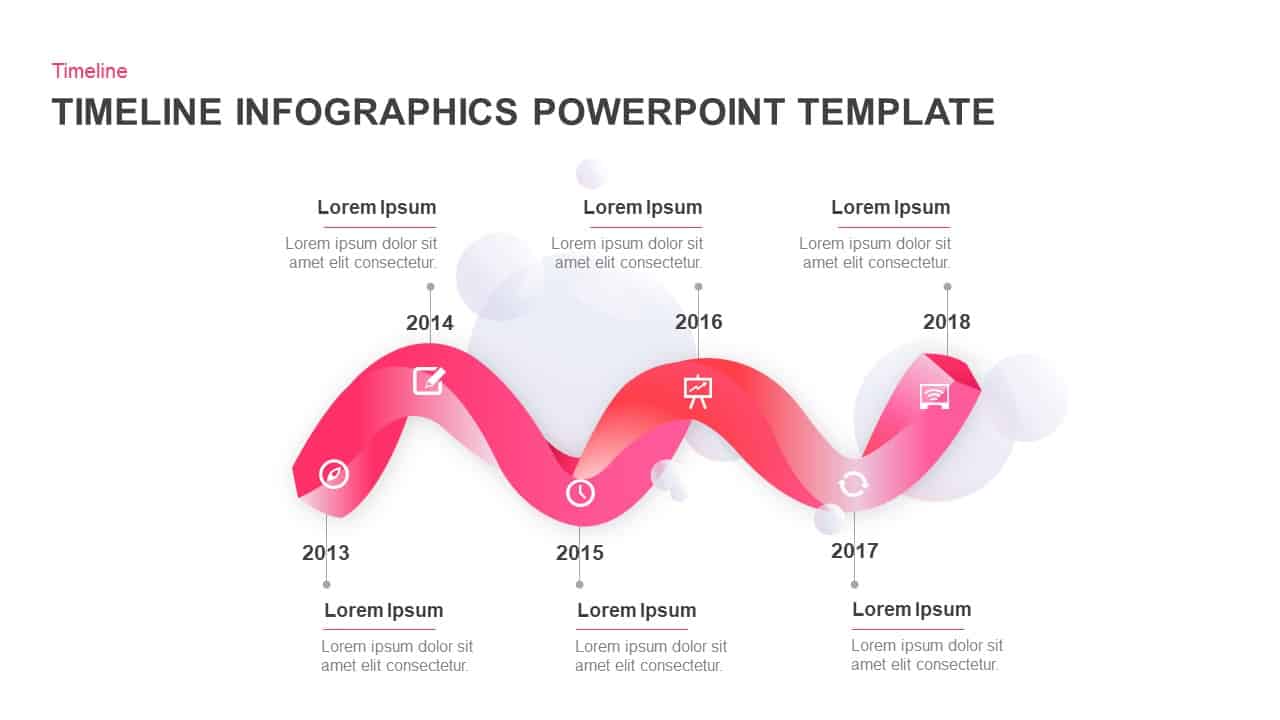
Wavy Ribbon Timeline Infographics Template for PowerPoint & Google Slides
Timeline
Six-Stage Timeline Infographics Slide Template for PowerPoint & Google Slides
Timeline
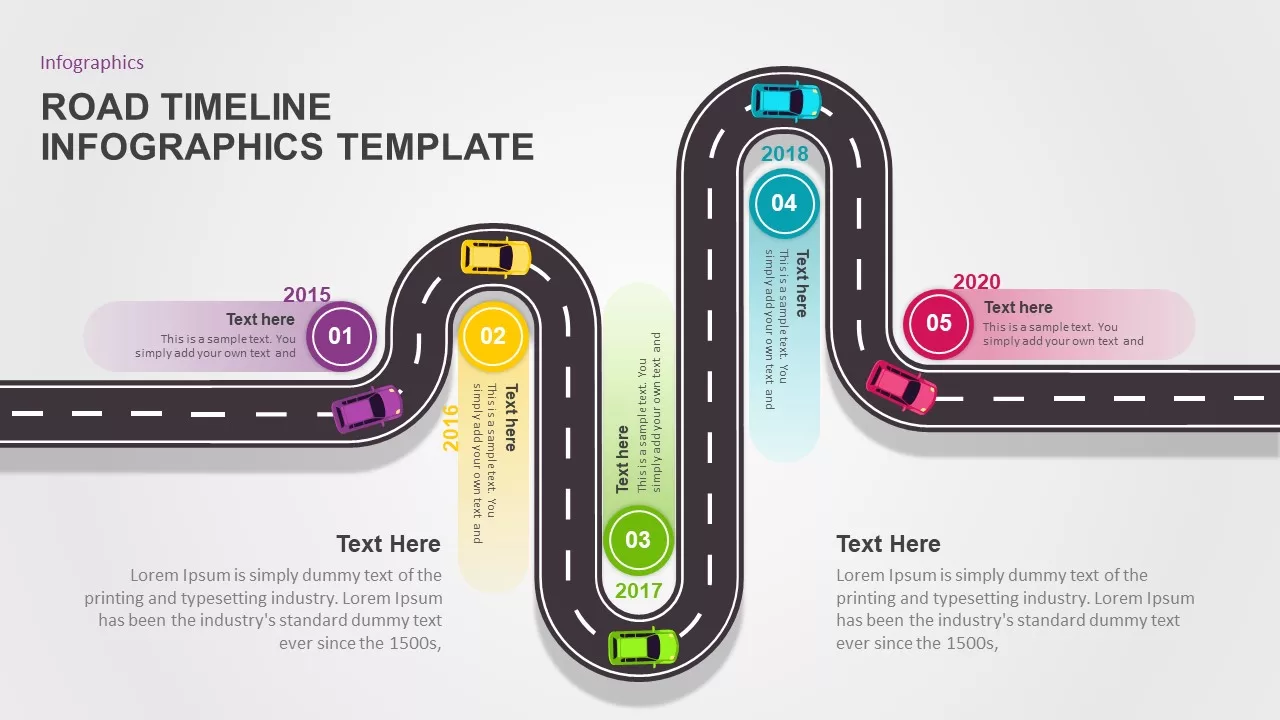
Road Timeline Infographics Template for PowerPoint & Google Slides
Timeline
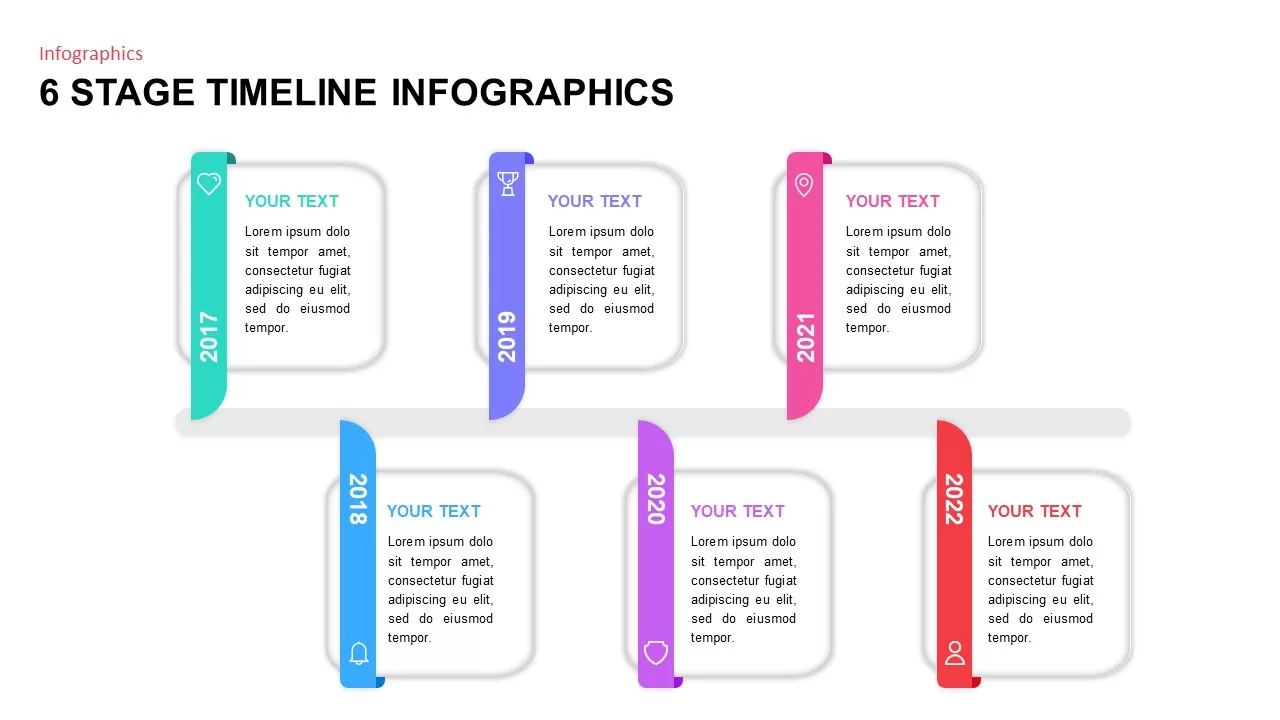
6 Stage Timeline Infographics template for PowerPoint & Google Slides
Timeline
Animated Timeline Infographics template for PowerPoint & Google Slides
Timeline
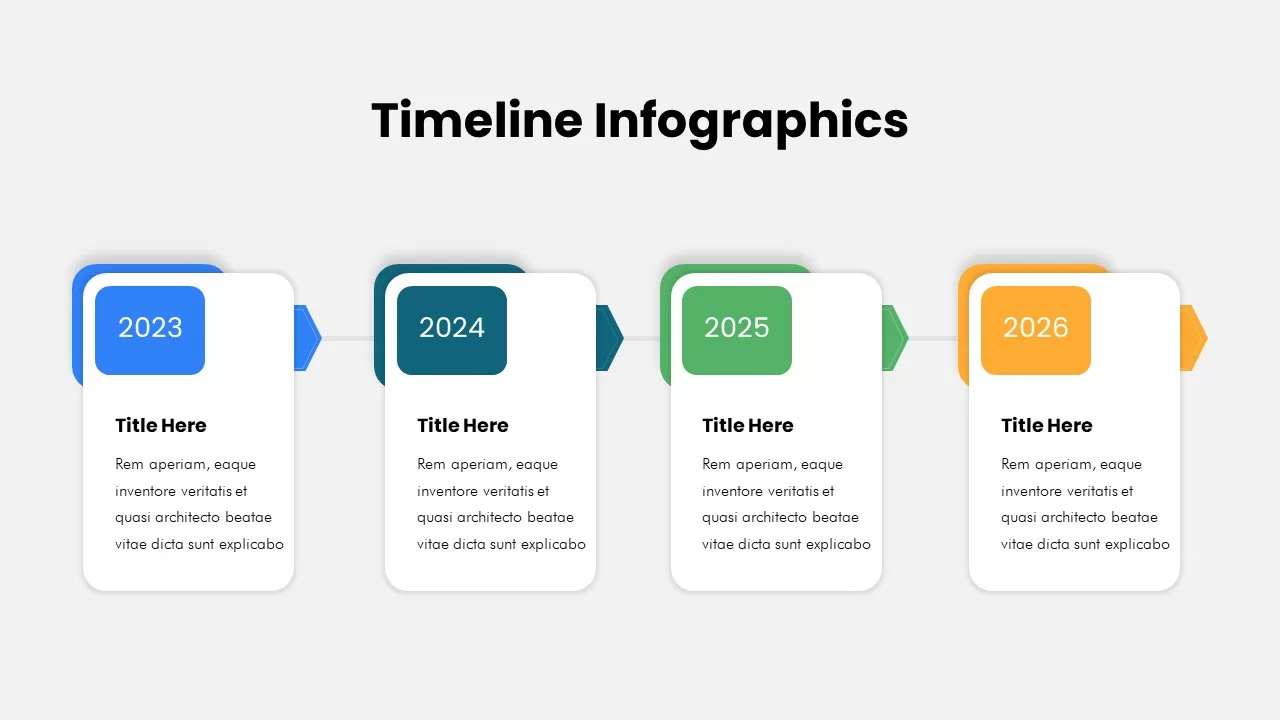
Timeline Infographics template for PowerPoint & Google Slides
Timeline
Hiring Process Timeline Infographics Template for PowerPoint & Google Slides
Recruitment

Free Colorful Timeline Infographics Template for PowerPoint & Google Slides
Timeline
Free
Timeline Infographics for PowerPoint & Google Slides
Timeline
3D Timeline Infographics for PowerPoint & Google Slides
Project Status
Bubble Timeline Infographics PowerPoint Template and Keynote
Business
3D Circular Diagram template for PowerPoint & Google Slides
Circular
Circular Flow Diagram Template for PowerPoint & Google Slides
Infographics
8 Steps Circular Process Diagram Template for PowerPoint & Google Slides
Process
Six Step Creative Circular Diagram Template for PowerPoint & Google Slides
Circular
Six Steps Circular CRM Diagram Template for PowerPoint & Google Slides
Customer Journey
Six Section Circular Infographic Diagram Template for PowerPoint & Google Slides
Circular
Four-Stage Business Circular Diagram Template for PowerPoint & Google Slides
Process
Five-Section Circular Arrow Diagram Template for PowerPoint & Google Slides
Circular
Three-Stage Circular Options Chart Template for PowerPoint & Google Slides
Comparison
Four Section Circular Text Boxes Diagram Template for PowerPoint & Google Slides
Circular
Eight-Step Circular Diagram Infographic Template for PowerPoint & Google Slides
Circular
PEST Analysis Circular Diagram Template for PowerPoint & Google Slides
PEST
4 Staged Circular Business Process Diagram template for PowerPoint & Google Slides
Process
Modern Colorful Circular Org Chart Template for PowerPoint & Google Slides
Org Chart
Six-Stage Circular Diagram Process Template for PowerPoint & Google Slides
Circular
Five Layer Circular Ring Diagram Template for PowerPoint & Google Slides
Circular
Five Stage Circular Arrow Diagram Template for PowerPoint & Google Slides
Process
Five-Stage Circular Flow Diagram Template for PowerPoint & Google Slides
Circular
4 Ps of Management Circular Diagram Template for PowerPoint & Google Slides
Circular
4 Factors Circular Diagram Infographic Template for PowerPoint & Google Slides
Circular
Circular CRM Process Diagram Infographic Template for PowerPoint & Google Slides
Circular
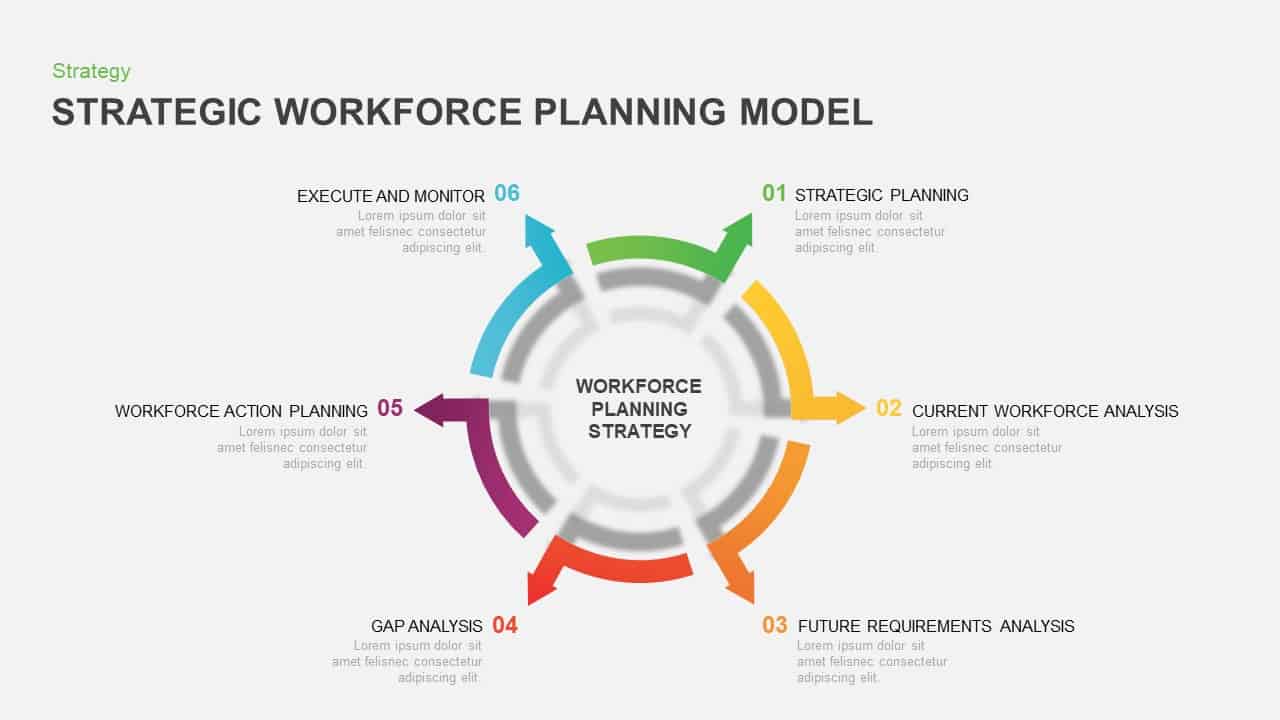
Strategic Workforce Planning Circular Template for PowerPoint & Google Slides
Circular
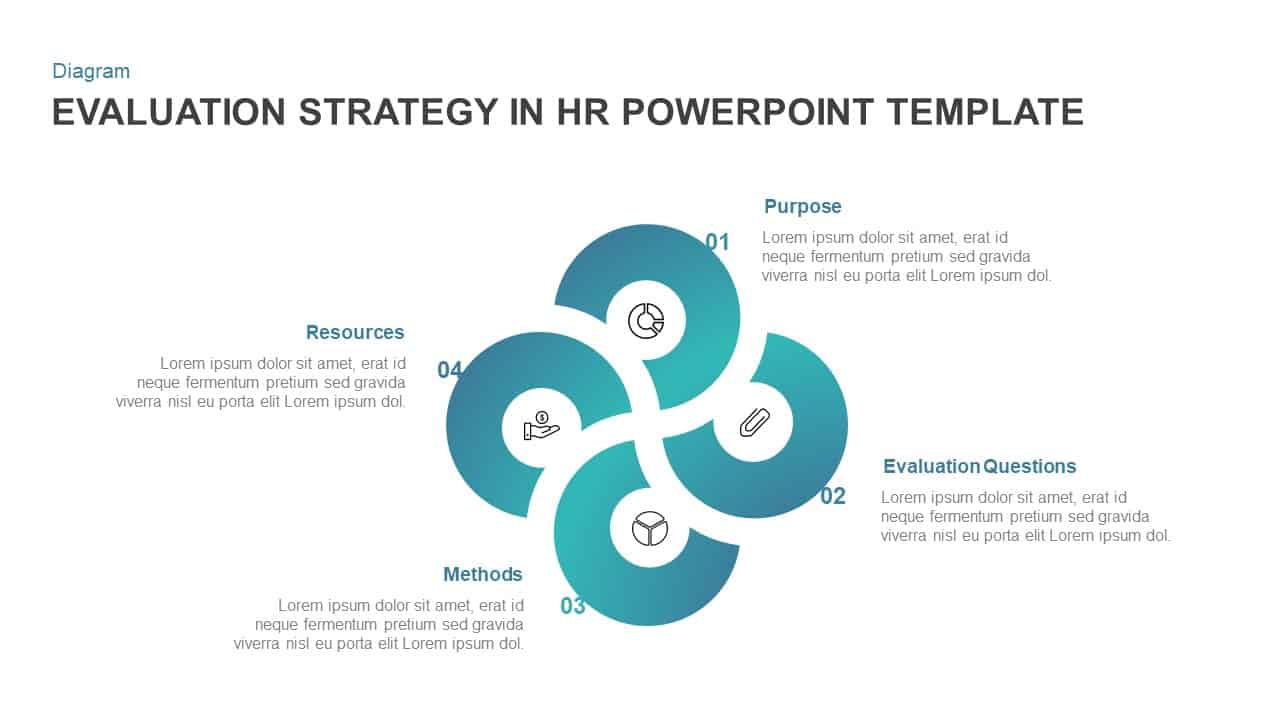
HR Evaluation Strategy Circular Diagram Template for PowerPoint & Google Slides
Circular
Value Chain Circular Process Diagram Template for PowerPoint & Google Slides
Business Models
Six-Stage Circular Flow Diagram Template for PowerPoint & Google Slides
Circular
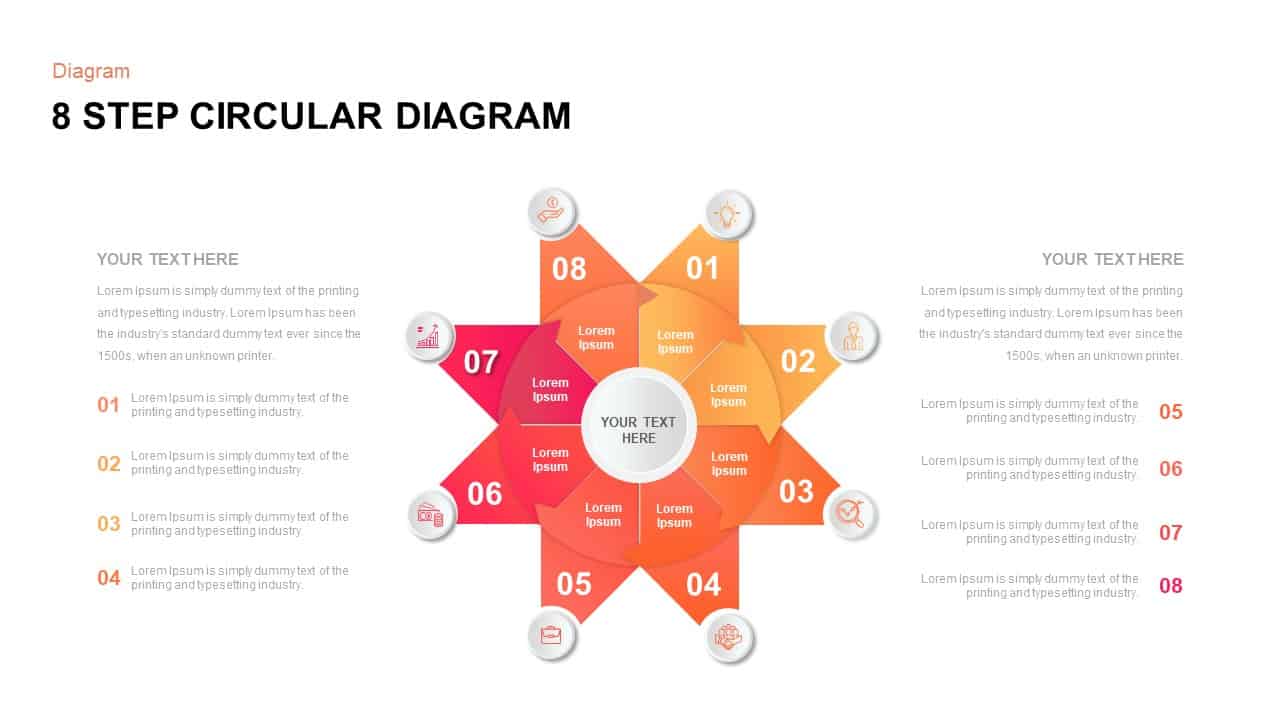
Eight Step Circular Diagram Template for PowerPoint & Google Slides
Circular
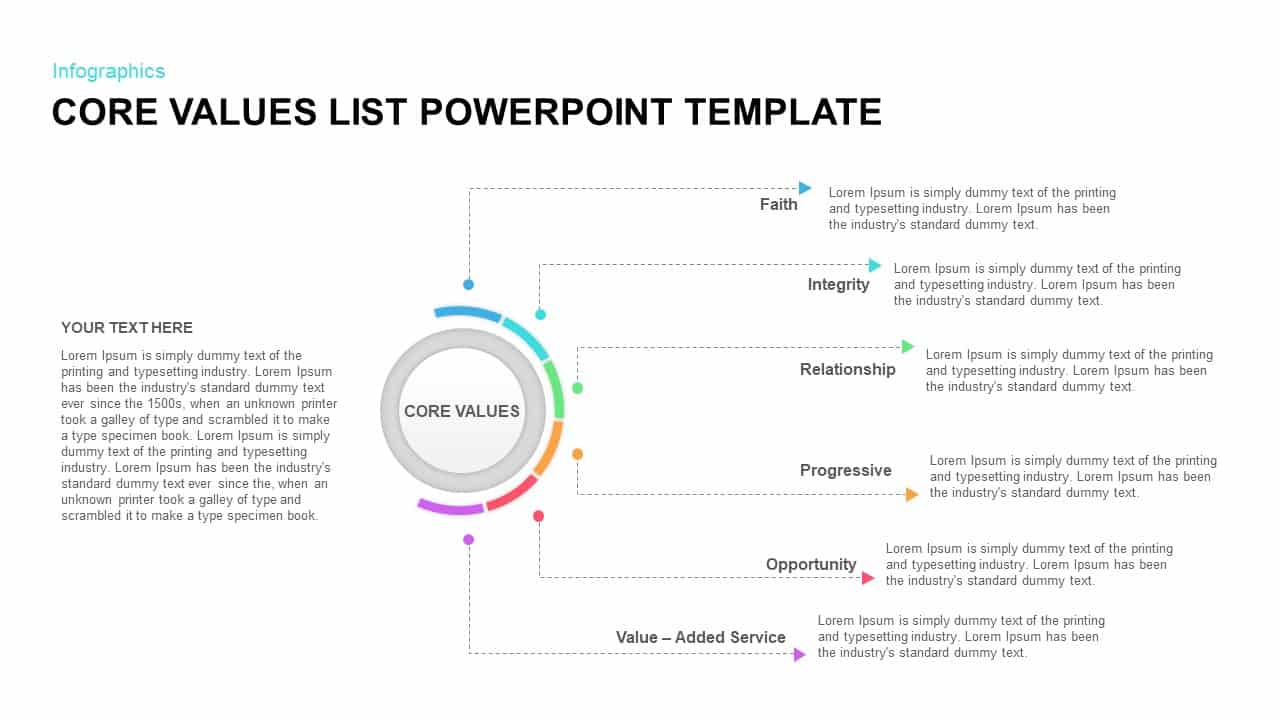
Circular Core Values Infographic List Template for PowerPoint & Google Slides
Circular
5-Step Circular Gradient Process Flow Template for PowerPoint & Google Slides
Process
Agile Lifecycle Circular Diagram Template for PowerPoint & Google Slides
Circular
2-8 Step Circular Diagram Template for PowerPoint & Google Slides
Infographics
4MAT Learning Cycle Circular Diagram Template for PowerPoint & Google Slides
Circular
4-Step Circular PDCA Cycle Diagram Template for PowerPoint & Google Slides
Process
SWOT Analysis Circular Infographic Template for PowerPoint & Google Slides
SWOT
Circular 3D Cube Six-Segment Diagram Template for PowerPoint & Google Slides
Infographics
Circular Business Ecosystem Diagram Template for PowerPoint & Google Slides
Business Strategy
Concentric Circular Arrow Cycle Diagram Template for PowerPoint & Google Slides
Process
Four-Segment Circular Arrow Cycle Template for PowerPoint & Google Slides
Circular
Circular Arrows Process Flow template for PowerPoint & Google Slides
Process
Circular Arrows Process Flow template for PowerPoint & Google Slides
Process
Healthcare Nursing Circular Infographic Template for PowerPoint & Google Slides
Nursing
Ten Step Circular Process Infographic Template for PowerPoint & Google Slides
Process
10 Step Circular Process Diagram Template for PowerPoint & Google Slides
Circular
Circular Image Gallery & KPI Metrics Template for PowerPoint & Google Slides
Pie/Donut
Negotiation Process Circular Diagram Template for PowerPoint & Google Slides
Circular
Circular Sustainability Infographic Template for PowerPoint & Google Slides
Process
HROps Hub and Spoke Circular Diagram Template for PowerPoint & Google Slides
Circular
Circular Business Strategy Infographic Template for PowerPoint & Google Slides
Circular
Professional Circular Pain Points Template for PowerPoint & Google Slides
Circular
Entry Strategy Circular Diagram Template for PowerPoint & Google Slides
Circular
Test Strategy Circular Diagram Template for PowerPoint & Google Slides
Circular
Circular Capital Allocation Diagram Template for PowerPoint & Google Slides
Business Models
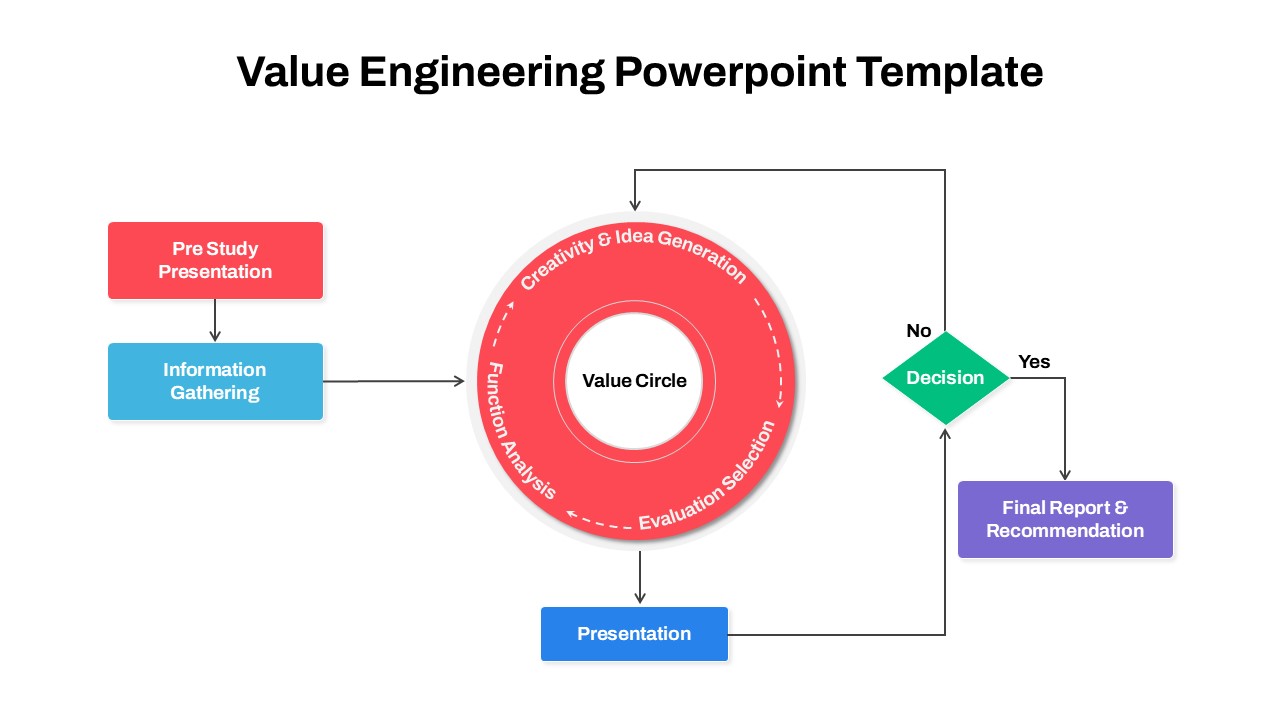
Circular Value Engineering Diagram Template for PowerPoint & Google Slides
Process
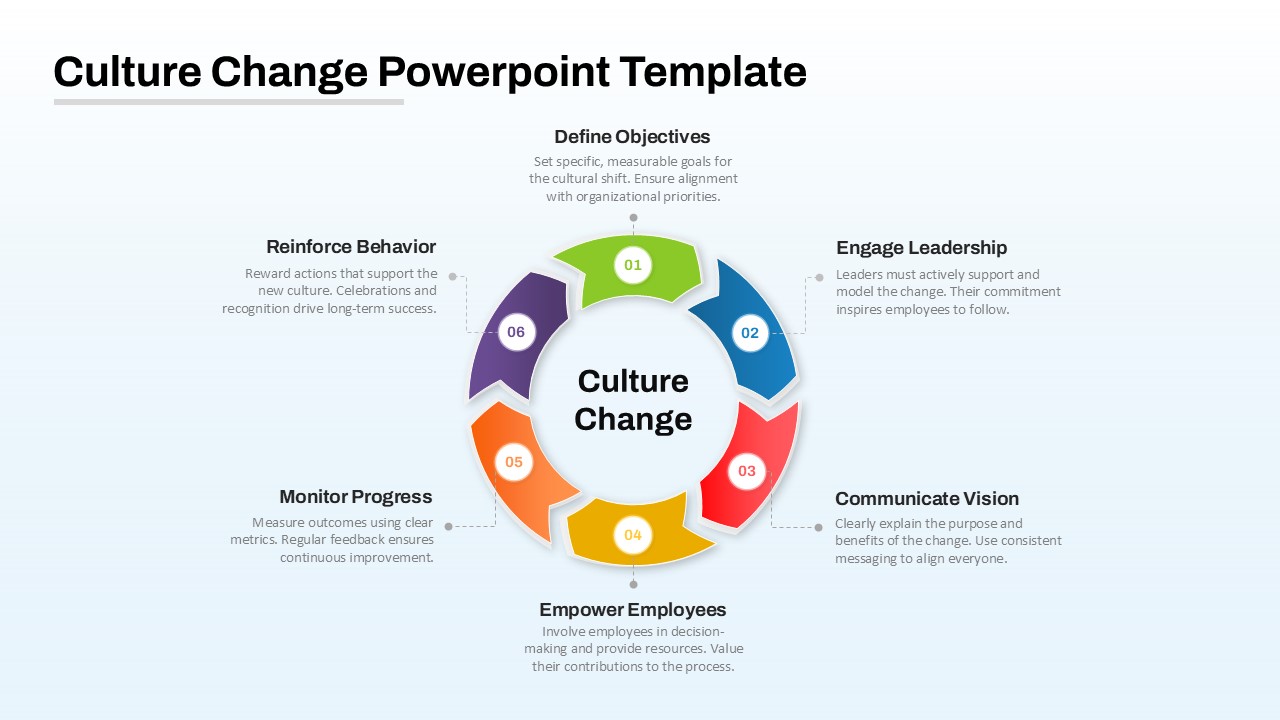
Culture Change Circular Process Diagram Template for PowerPoint & Google Slides
Process
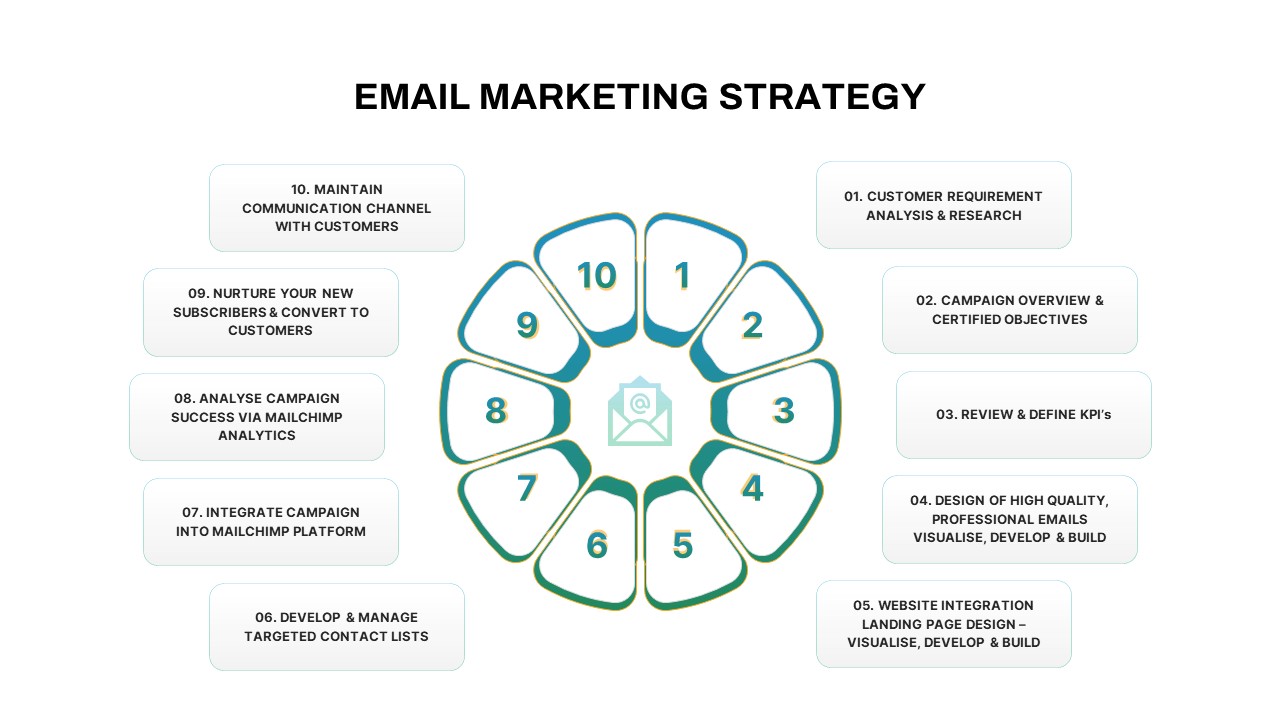
Email Marketing Strategy Circular Template for PowerPoint & Google Slides
Process
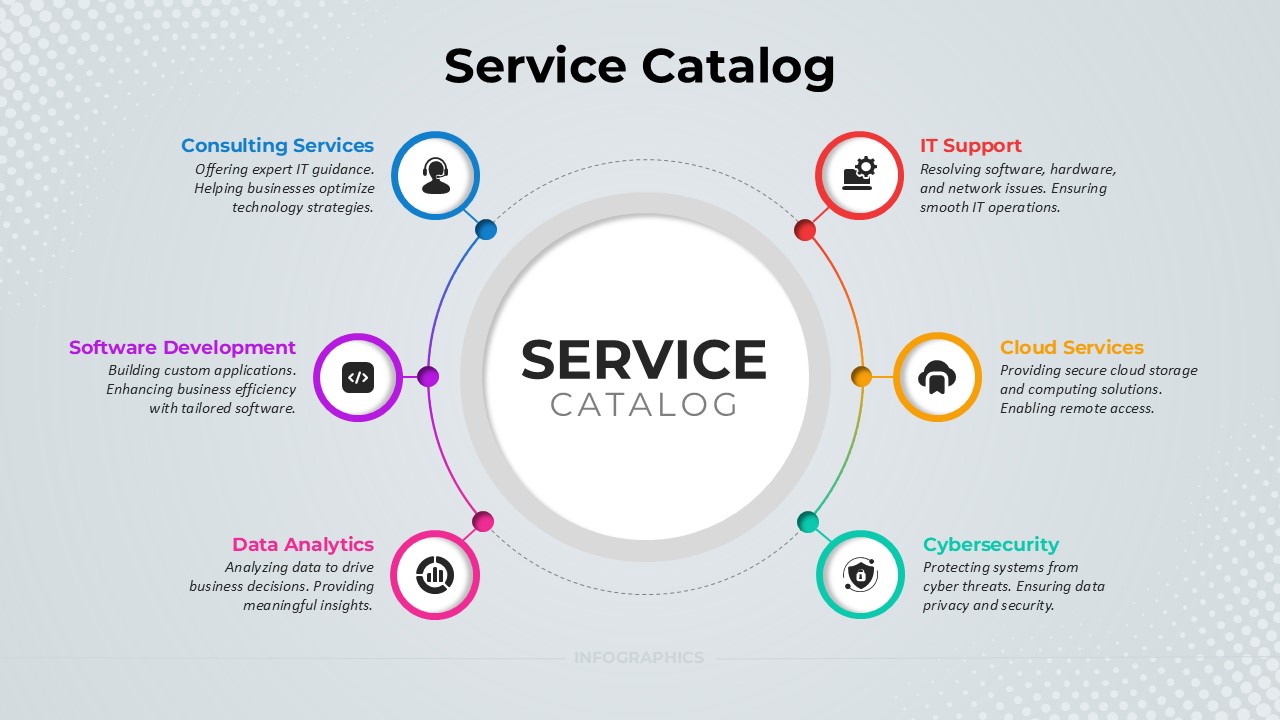
Service Catalog Circular Infographic Template for PowerPoint & Google Slides
Circular
AI Development Lifecycle Dark Circular Template for PowerPoint & Google Slides
Circular
AI in E-Commerce Circular Infographic Template for PowerPoint & Google Slides
AI
AI Adoption Framework Circular Diagram Template for PowerPoint & Google Slides
AI
Outbound Marketing Circular Diagram Template for PowerPoint & Google Slides
Advertising
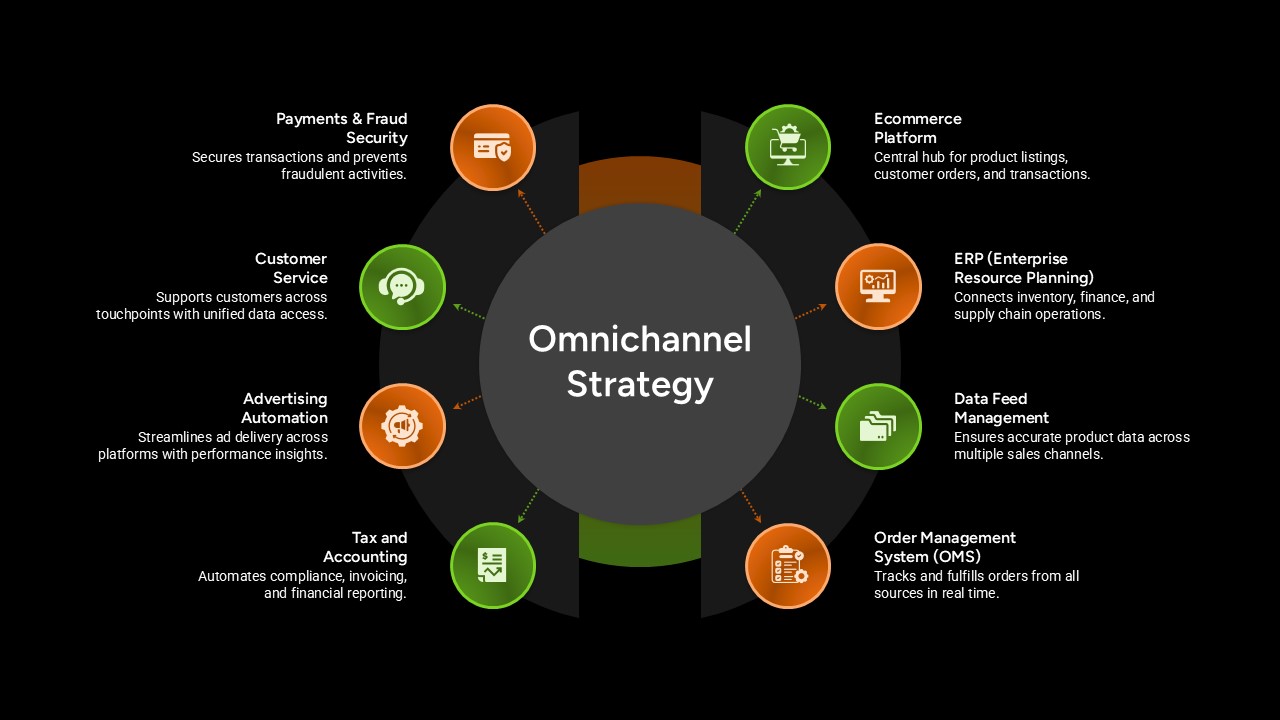
Omnichannel Strategy Circular Diagram Template for PowerPoint & Google Slides
Digital Marketing
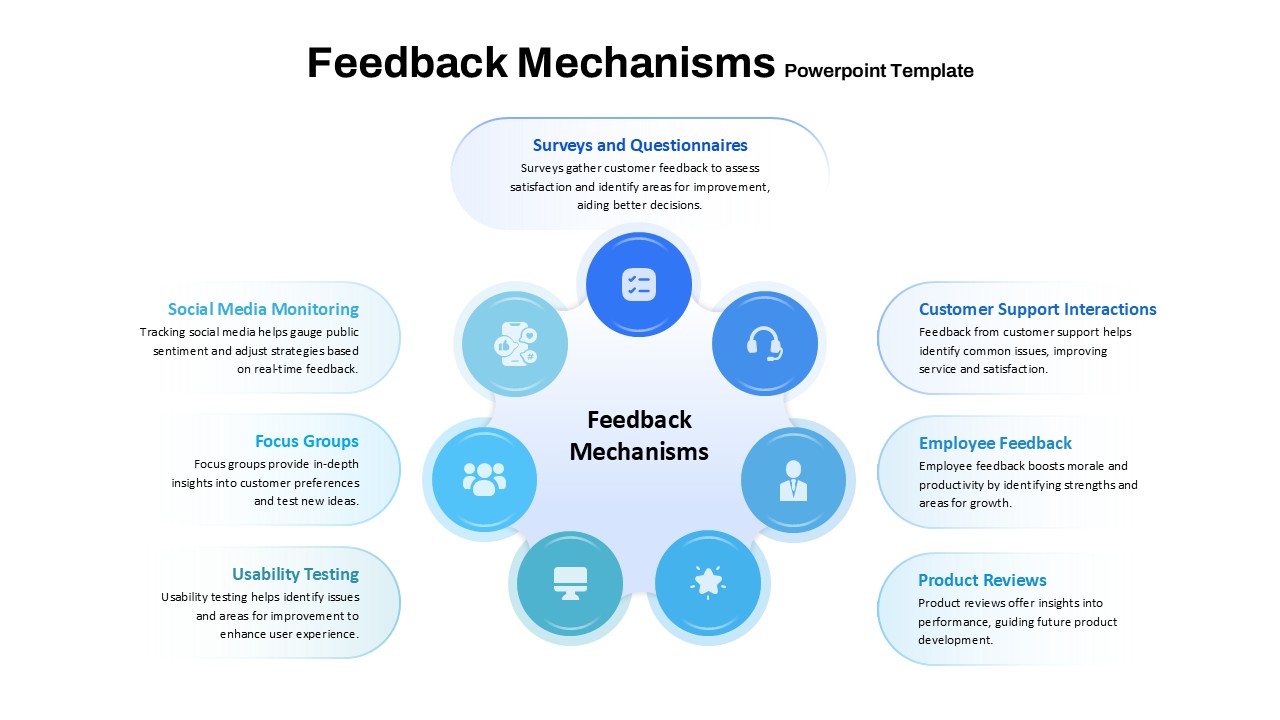
Feedback Mechanisms Circular Diagram Template for PowerPoint & Google Slides
Circular
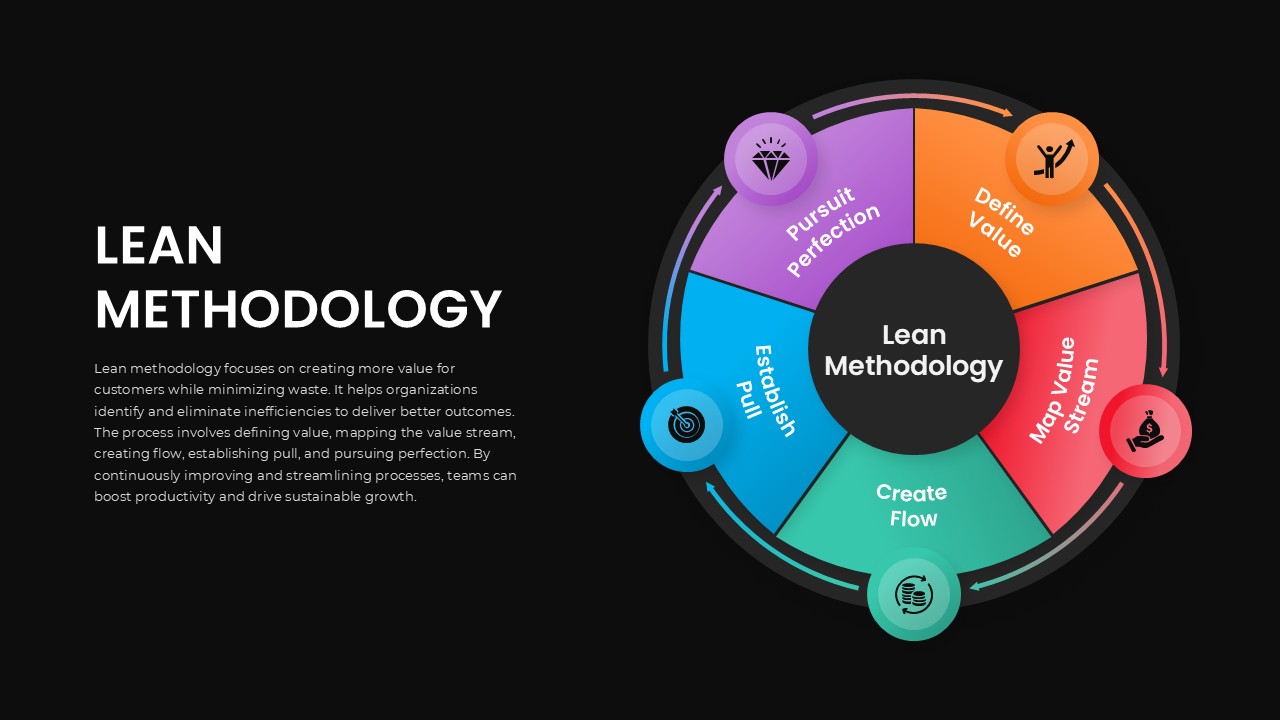
Lean Methodology Circular Process Template for PowerPoint & Google Slides
Process
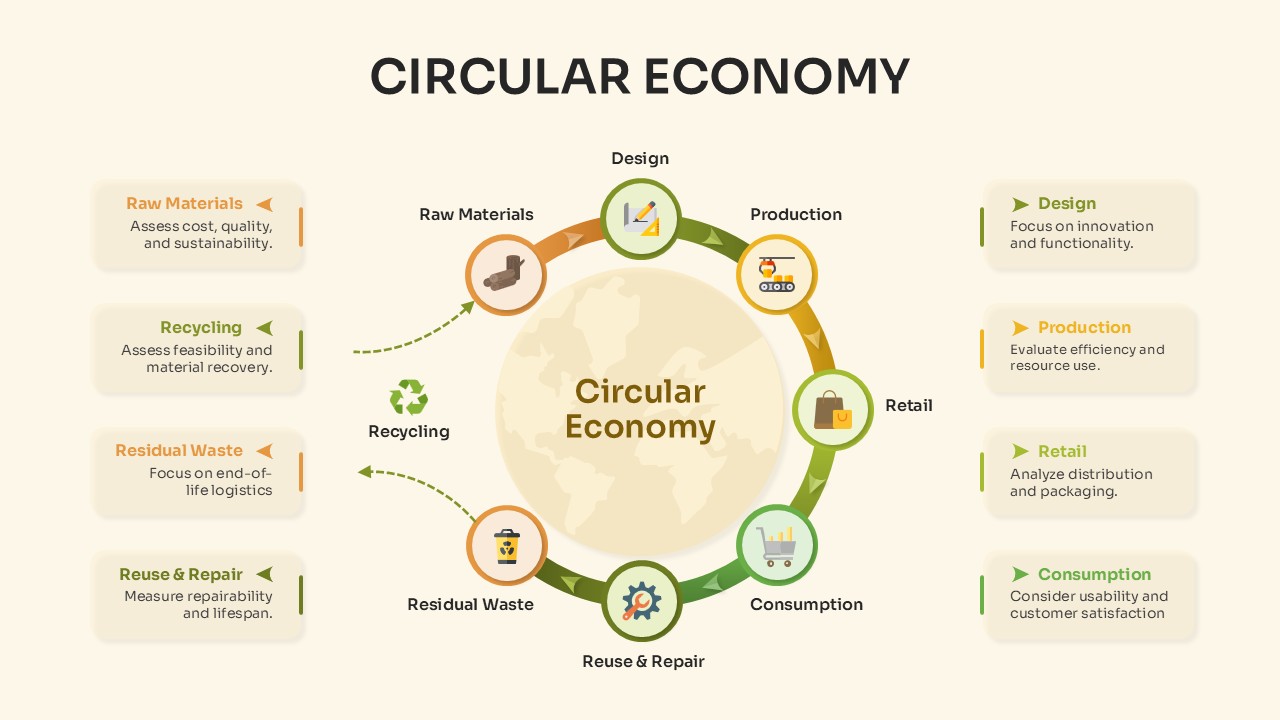
Circular Economy Process Overview Template for PowerPoint & Google Slides
Circular
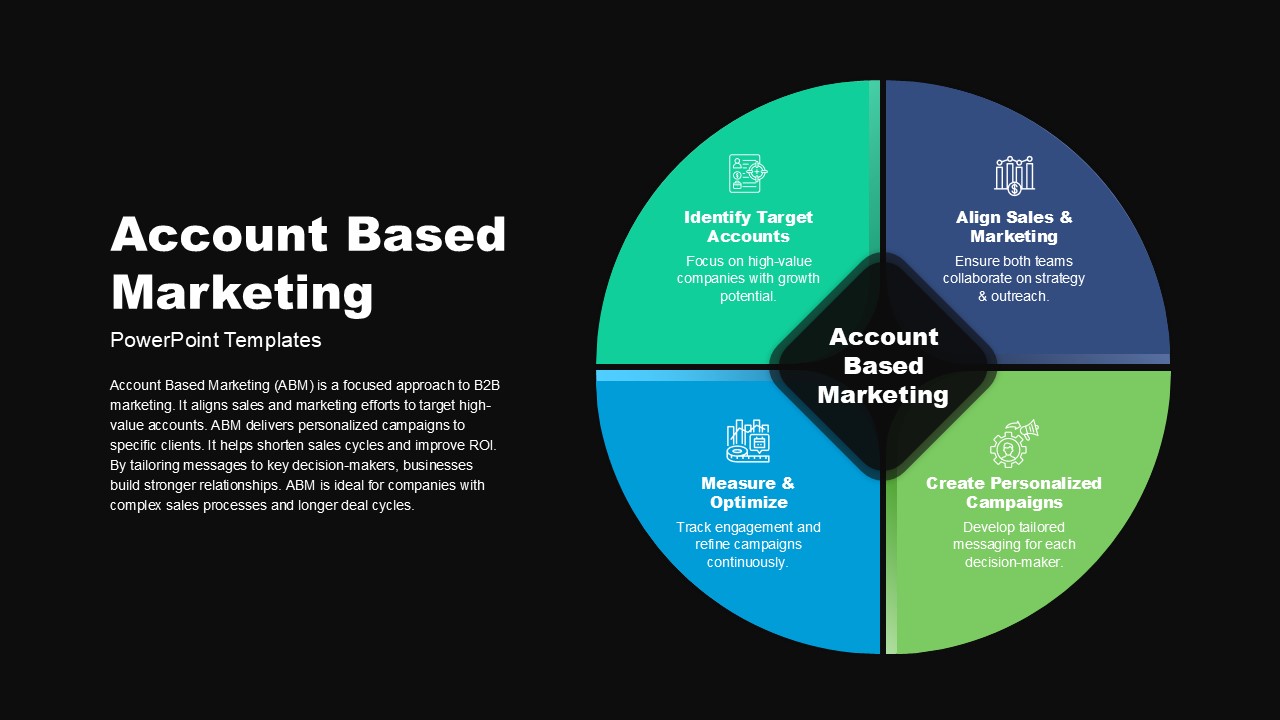
Account Based Marketing Circular Infographic Template for PowerPoint & Google Slides
Marketing
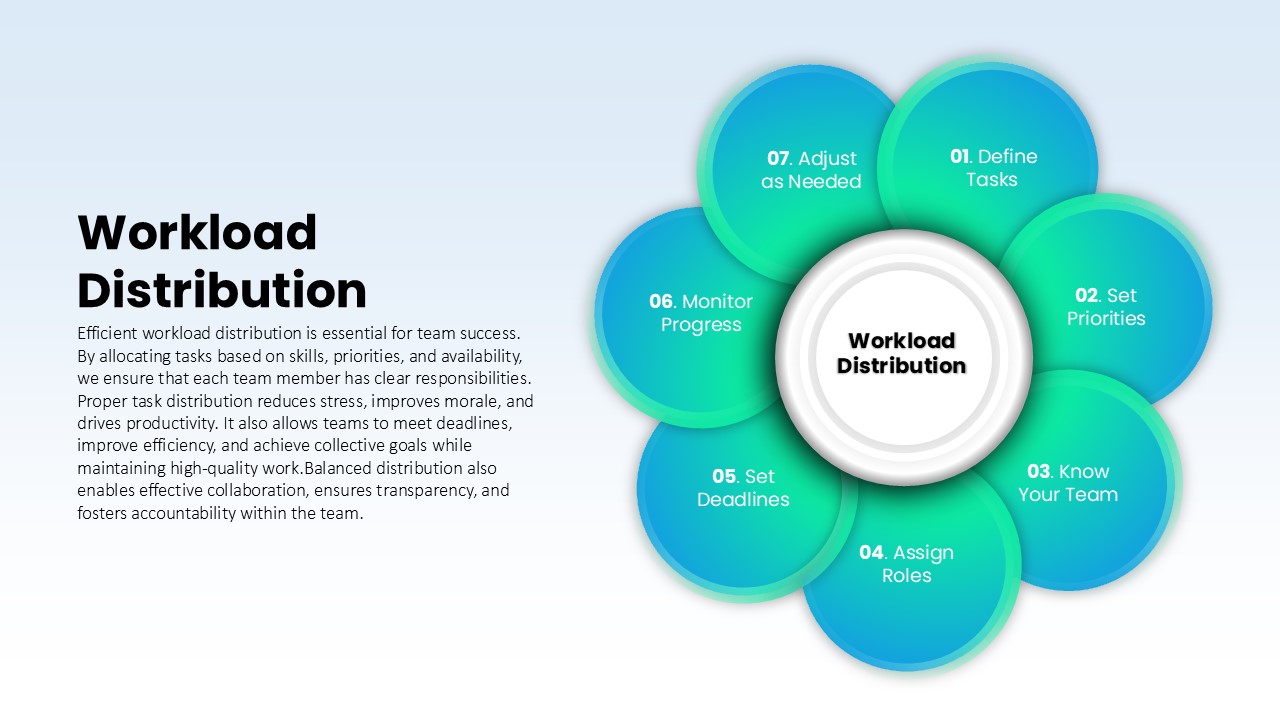
Workload Distribution Circular Diagram Template for PowerPoint & Google Slides
Circular
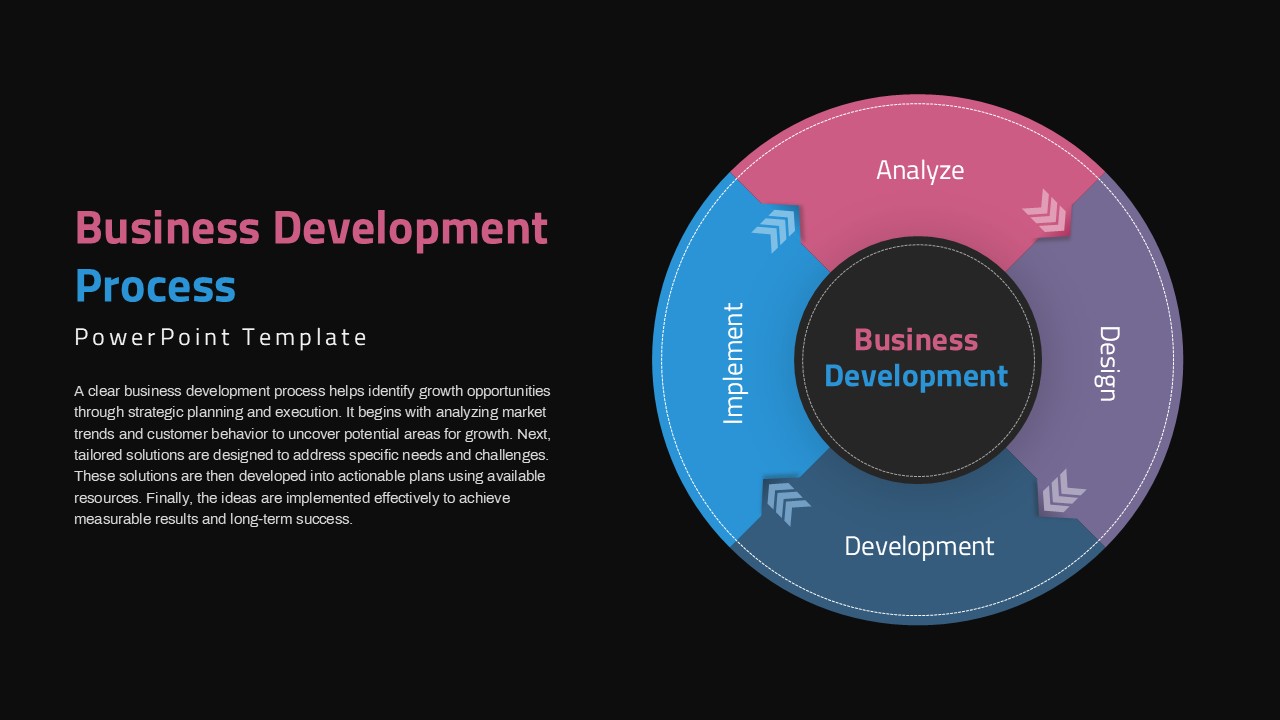
Circular Business Development Process Template for PowerPoint & Google Slides
Process
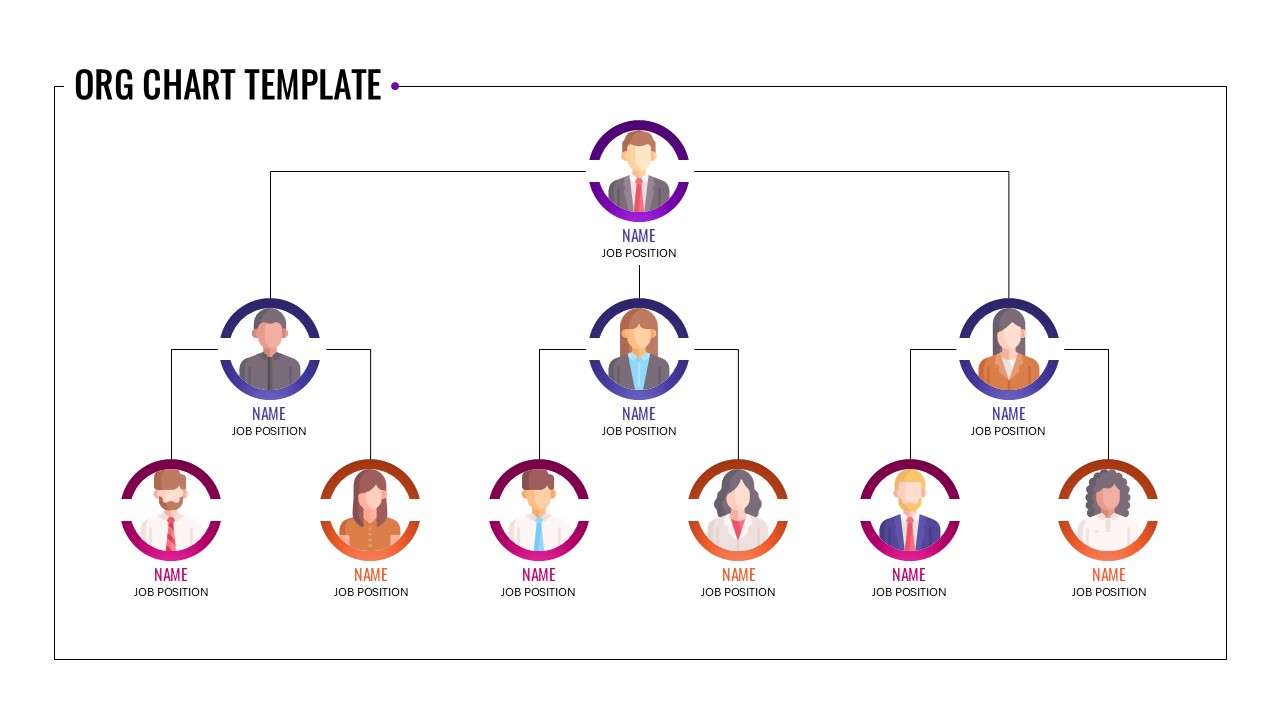
Circular Sample Org Chart Template for PowerPoint & Google Slides
Org Chart
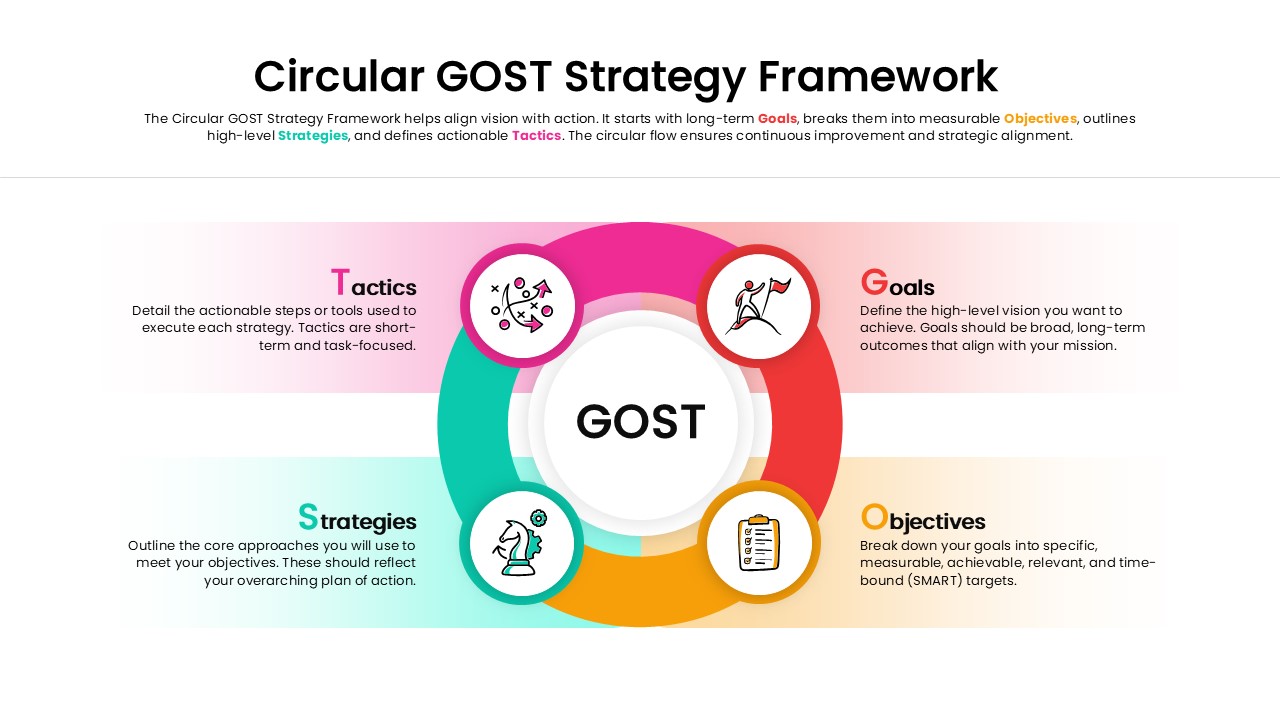
Circular GOST Strategy Framework Template for PowerPoint & Google Slides
Goals