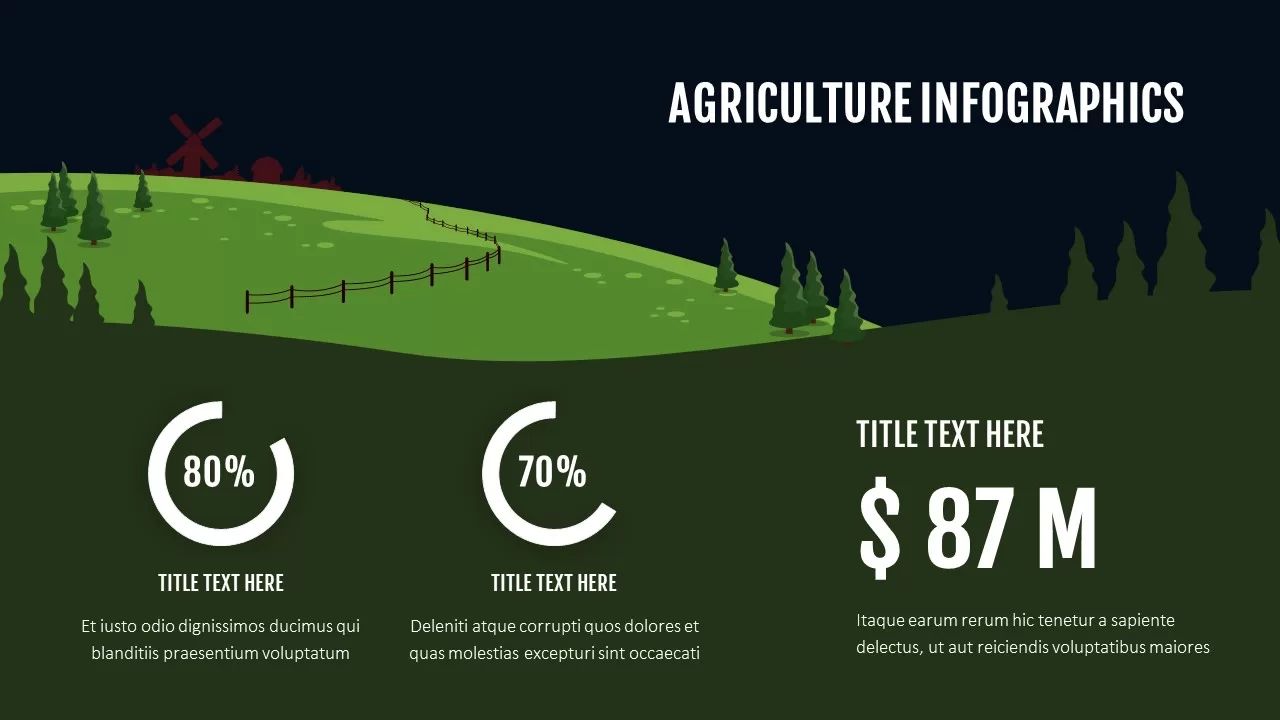
Agriculture Infographics Slide with Progress Rings & Metrics Template for PowerPoint & Google Slides


Description
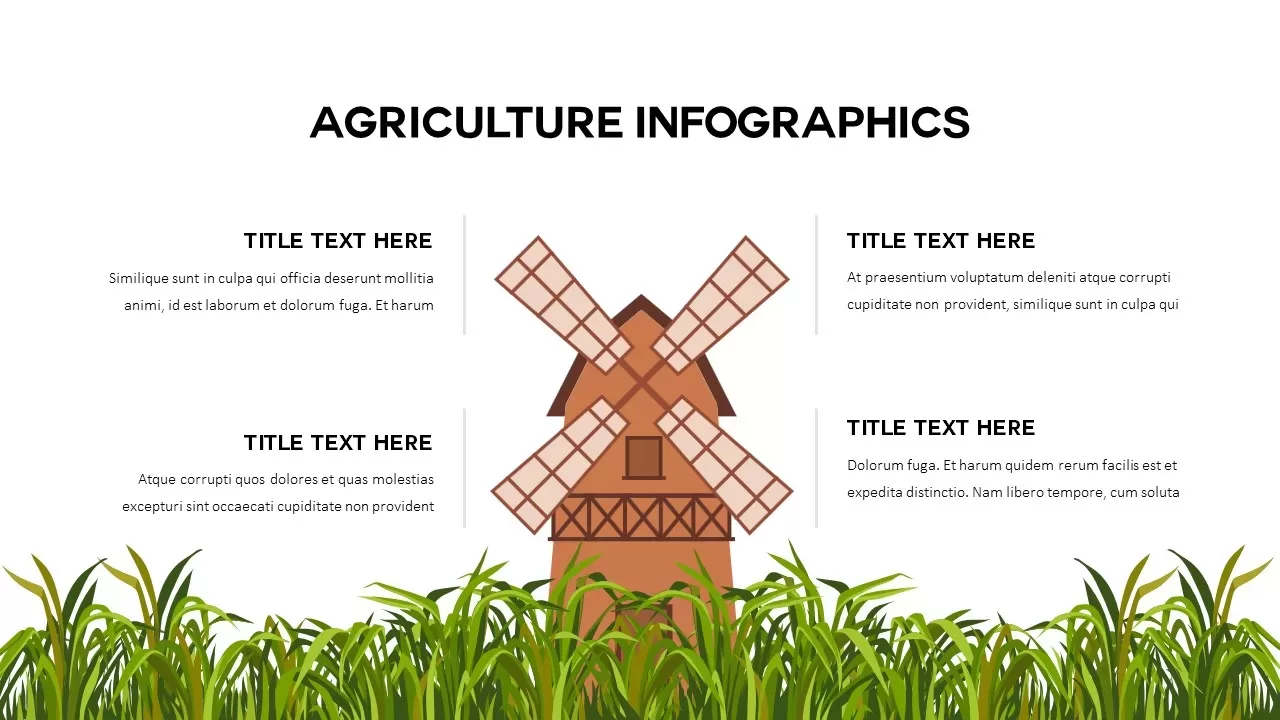
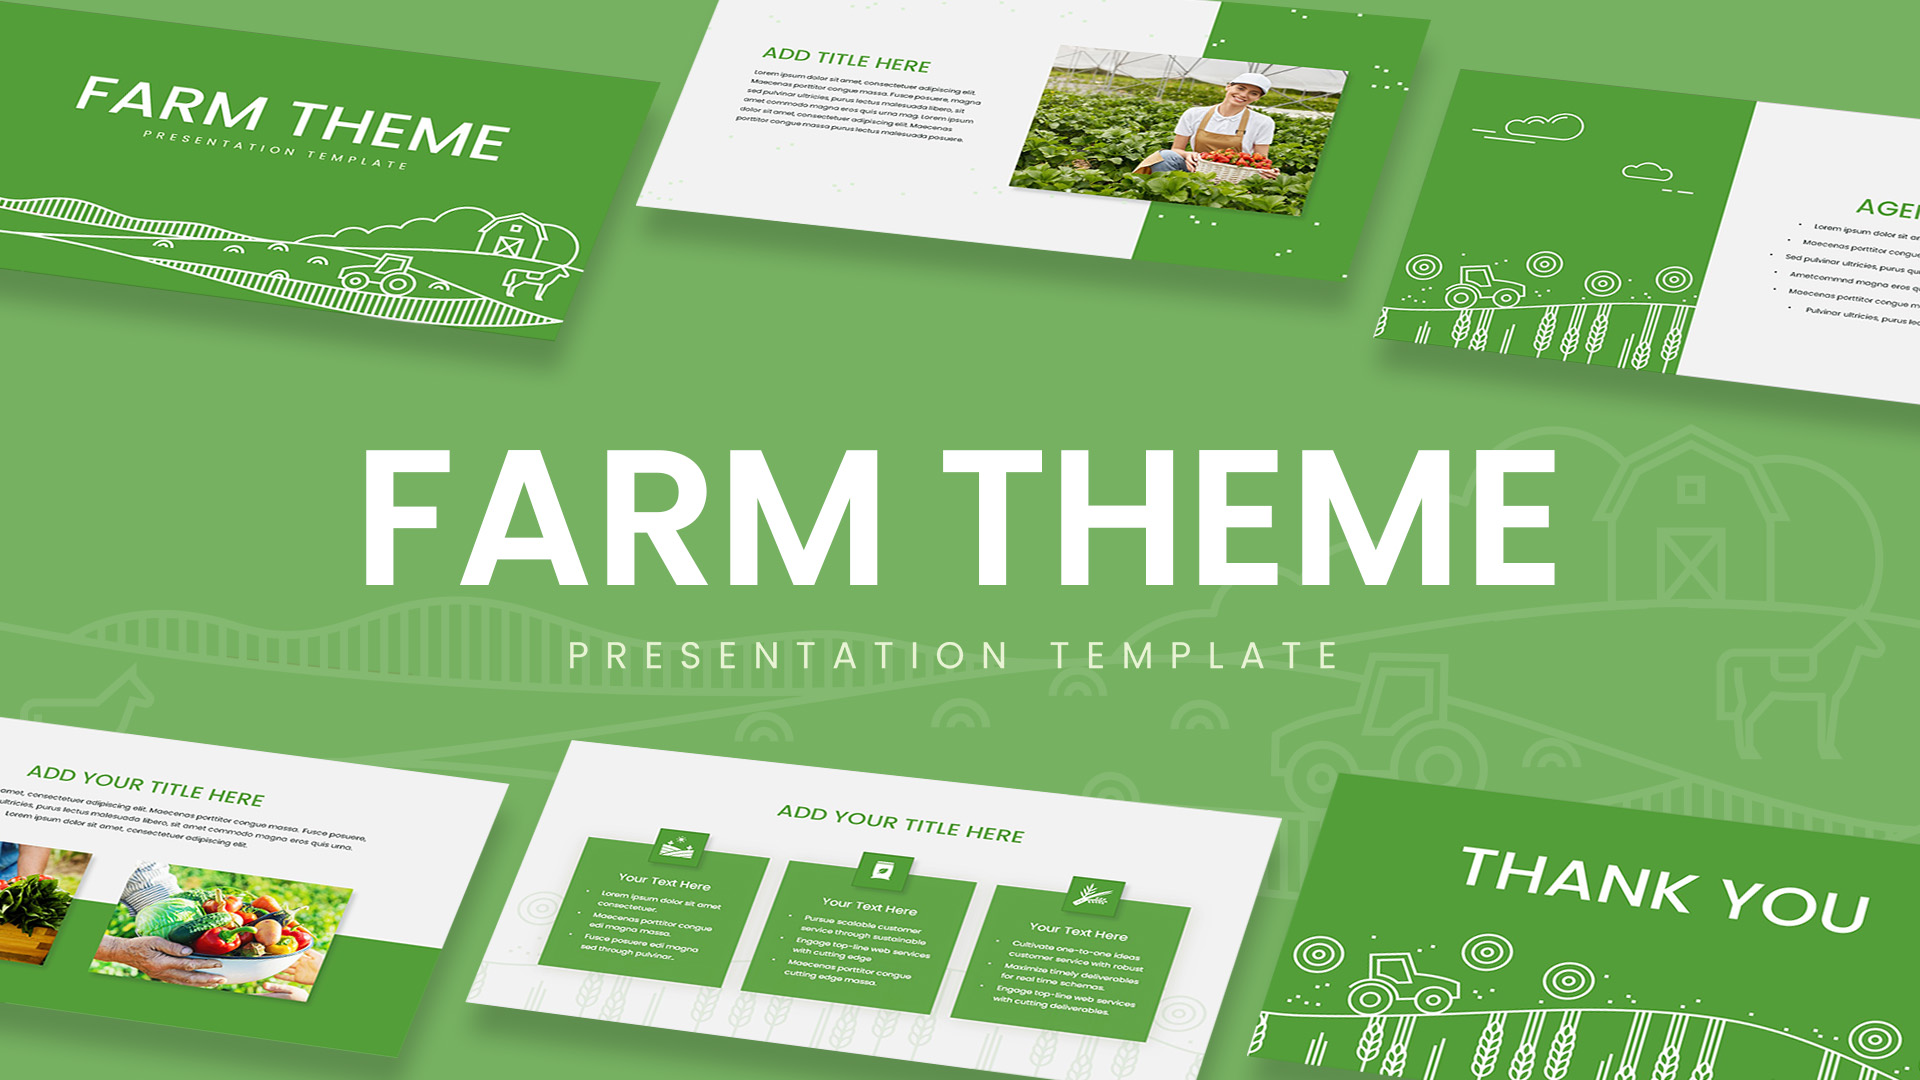
Visualize agricultural performance metrics and key financial figures with this Agriculture Infographics slide for PowerPoint & Google Slides. A stylized landscape backdrop featuring rolling green hills and a windmill sets the theme, while two clean, white circular progress rings display percentages—80% and 70%—against a contrasting dark-green footer. Beneath each ring, editable headings and descriptive text placeholders let you explain crop yields, sustainability targets, or resource utilization. To the right, a bold metric callout highlights your top-line figure (e.g., $87 M) with supporting text for revenue, investment, or harvest volume. All elements are built with vector shapes on master slides, so you can adjust percentages, swap out text, change colors, and scale the landscape graphic without disrupting alignment. Generous white space, minimalist sans-serif typography, and subtle drop shadows maintain a professional look that keeps your audience focused on the data.
Who is it for
Agribusiness managers, farm cooperative leaders, agronomists, and agricultural consultants who need a clear, visually engaging slide to report on crop performance, financial outcomes, or sustainability metrics.
Other Uses
Repurpose this slide to showcase environmental impact statistics, food production forecasts, operational KPIs, or any scenario where progress rings and a prominent financial figure communicate results at a glance.
Login to download this file

Item ID
SB02967
Related Templates

iPad App Mockup with Progress Metrics Template for PowerPoint & Google Slides
Bar/Column
Agriculture Windmill Infographics Template for PowerPoint & Google Slides
Comparison
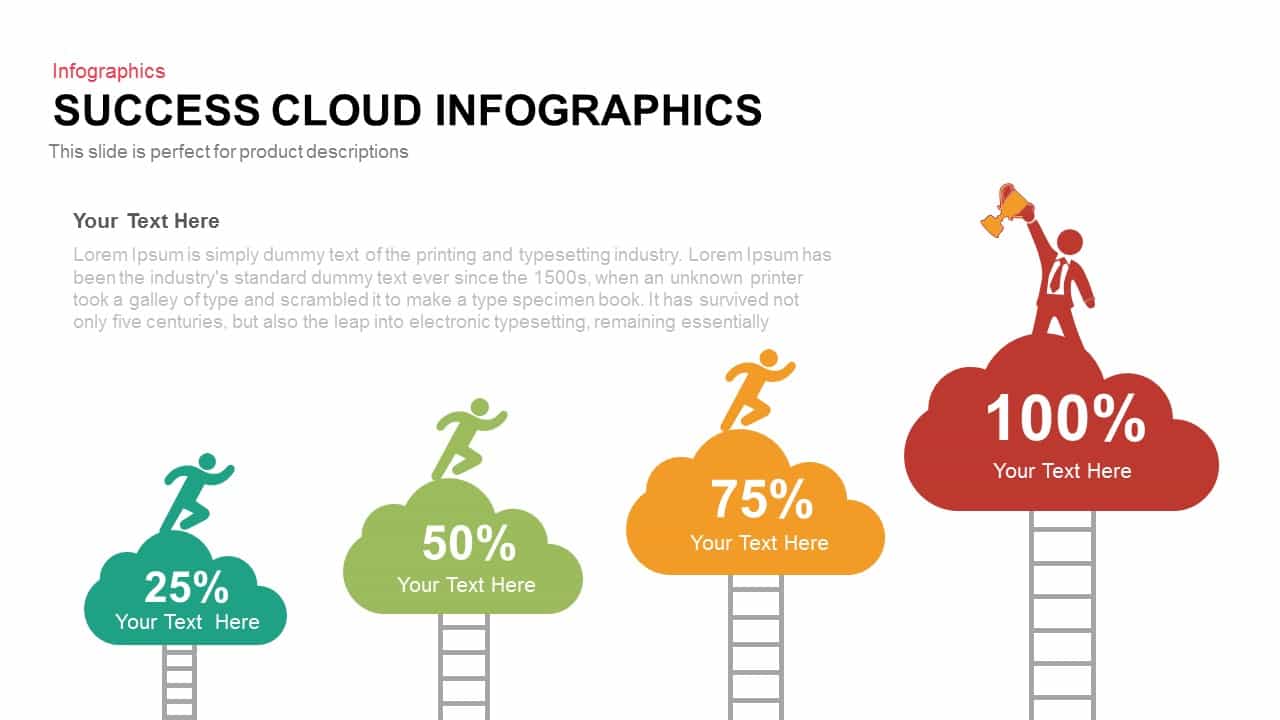
Success Cloud Progress Infographics Template for PowerPoint & Google Slides
Charts
Colorful Block Infographic Metrics Slide Template for PowerPoint & Google Slides
Infographics
Benchmarking Metrics Comparison Slide Template for PowerPoint & Google Slides
Pie/Donut
Social Media Analysis Metrics Slide Deck Template for PowerPoint & Google Slides
Digital Marketing
LinkedIn Metrics Infographic Slide Template for PowerPoint & Google Slides
Digital Marketing
Instagram Infographic Metrics Slide Template for PowerPoint & Google Slides
Marketing
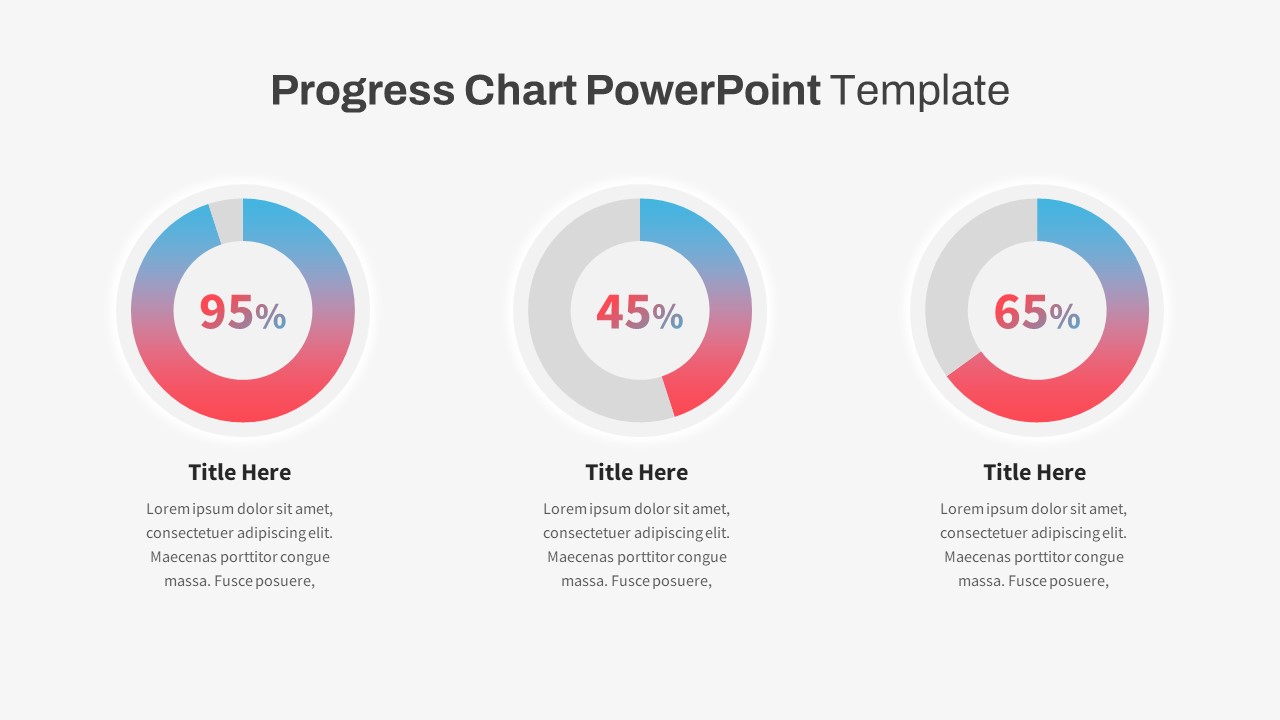
Progress Chart Slide for PowerPoint & Google Slides
Charts
Asia Map with KPI Metrics and Legend Template for PowerPoint & Google Slides
World Maps
Bubble Head Metrics Infographic Template for PowerPoint & Google Slides
Circular
Circle Segment Sales Metrics Infographic Template for PowerPoint & Google Slides
Circular
Social Media Metrics template for PowerPoint & Google Slides
Comparison Chart
Mobile Usage Metrics template for PowerPoint & Google Slides
Comparison Chart

Scale Metaphor Metrics Comparison Template for PowerPoint & Google Slides
Charts
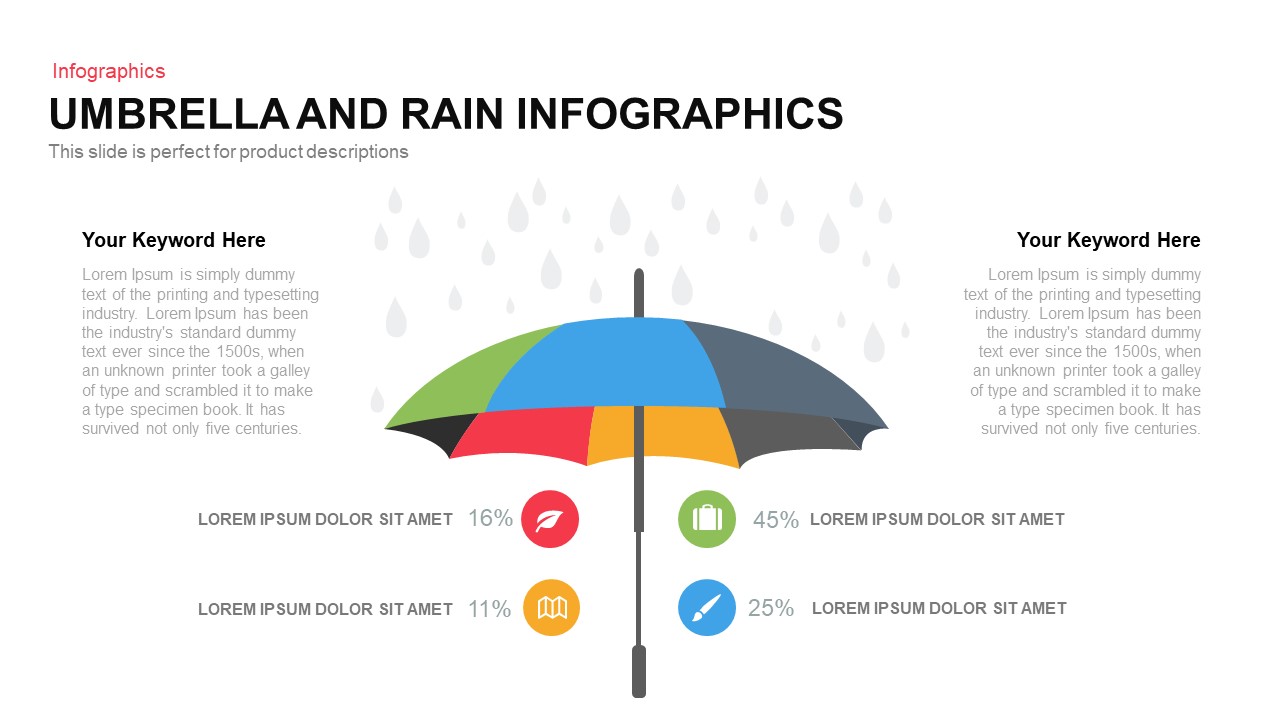
Umbrella and Rain Infographic Metrics Template for PowerPoint & Google Slides
Comparison
Comprehensive Recruitment Metrics Report Template for PowerPoint & Google Slides
Recruitment
Project Status Dashboard with Metrics Template for PowerPoint & Google Slides
Project Status
Circular Image Gallery & KPI Metrics Template for PowerPoint & Google Slides
Pie/Donut
Statistics & Global Metrics Infographic Template for PowerPoint & Google Slides
Bar/Column
Annual Recurring Revenue Metrics Template for PowerPoint & Google Slides
Bar/Column
Facebook Social Metrics Infographic Template for PowerPoint & Google Slides
Graphics
Mastodon Metrics Infographic Dashboard Template for PowerPoint & Google Slides
Business Report
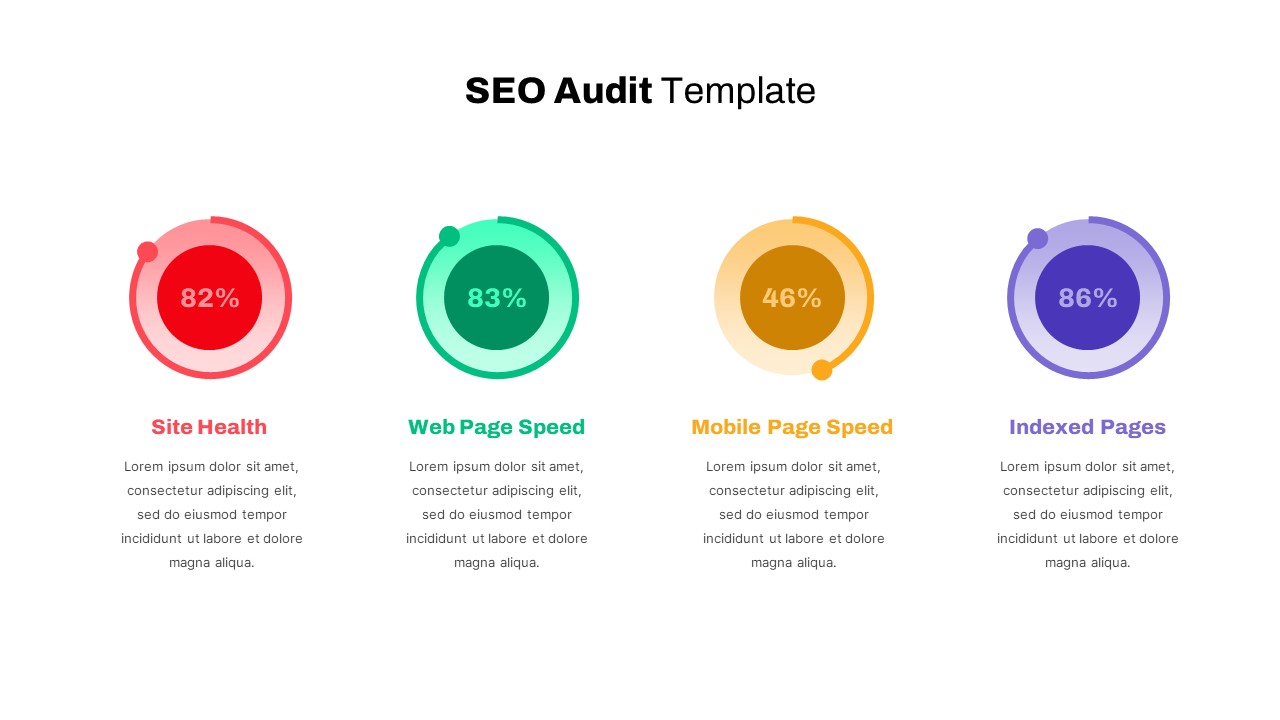
Detailed SEO Audit Metrics Overview Template for PowerPoint & Google Slides
Circular
Free Editable U.S. Map with Regional Metrics Template for PowerPoint & Google Slides
World Maps
Free
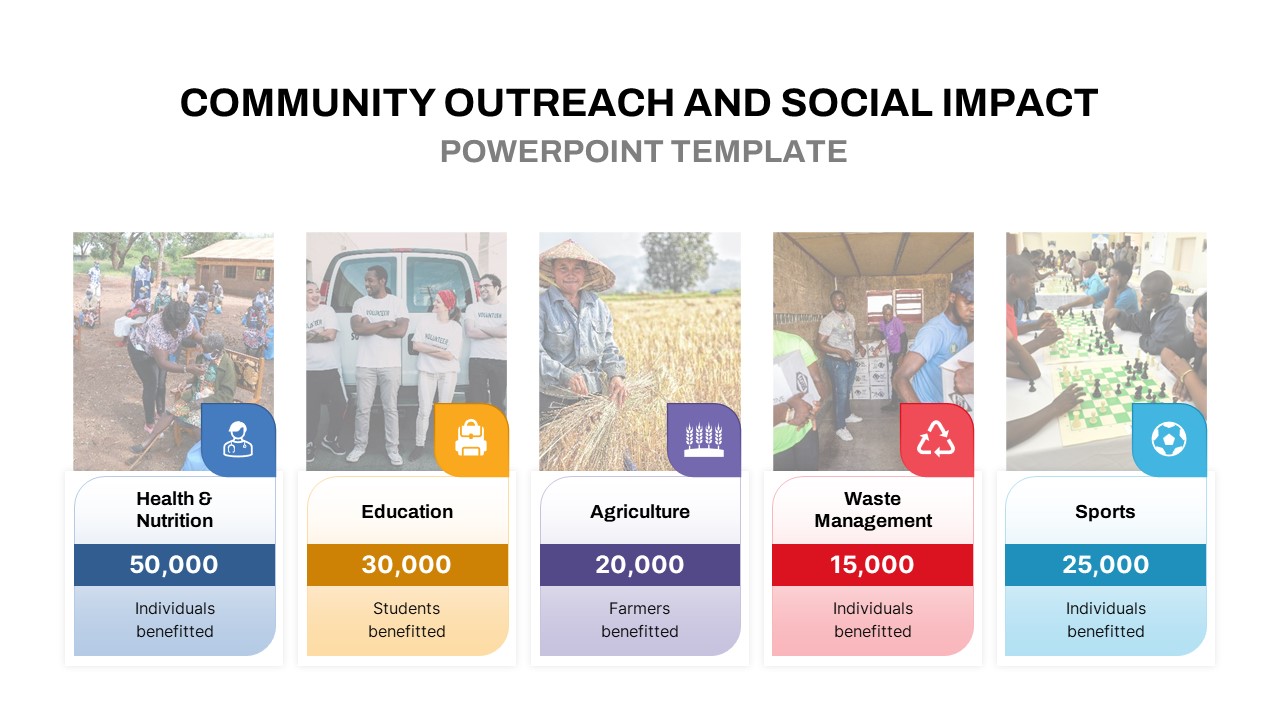
Community Outreach Impact Metrics Template for PowerPoint & Google Slides
Accomplishment
DevOps KPI Dashboard Performance Metrics Template for PowerPoint & Google Slides
Software Development
Purchasing KPI Metrics Dashboard Template for PowerPoint & Google Slides
Business Report
Financial Snapshot & Metrics Overview Template for PowerPoint & Google Slides
Finance
Procurement KPI Dashboard & Metrics Template for PowerPoint & Google Slides
Business Report
Market Validation Metrics Overview Template for PowerPoint & Google Slides
Business
Employee Performance Metrics Dashboard Template for PowerPoint & Google Slides
Employee Performance
Pirate Metrics AARRR Funnel Framework Template for PowerPoint & Google Slides
Funnel
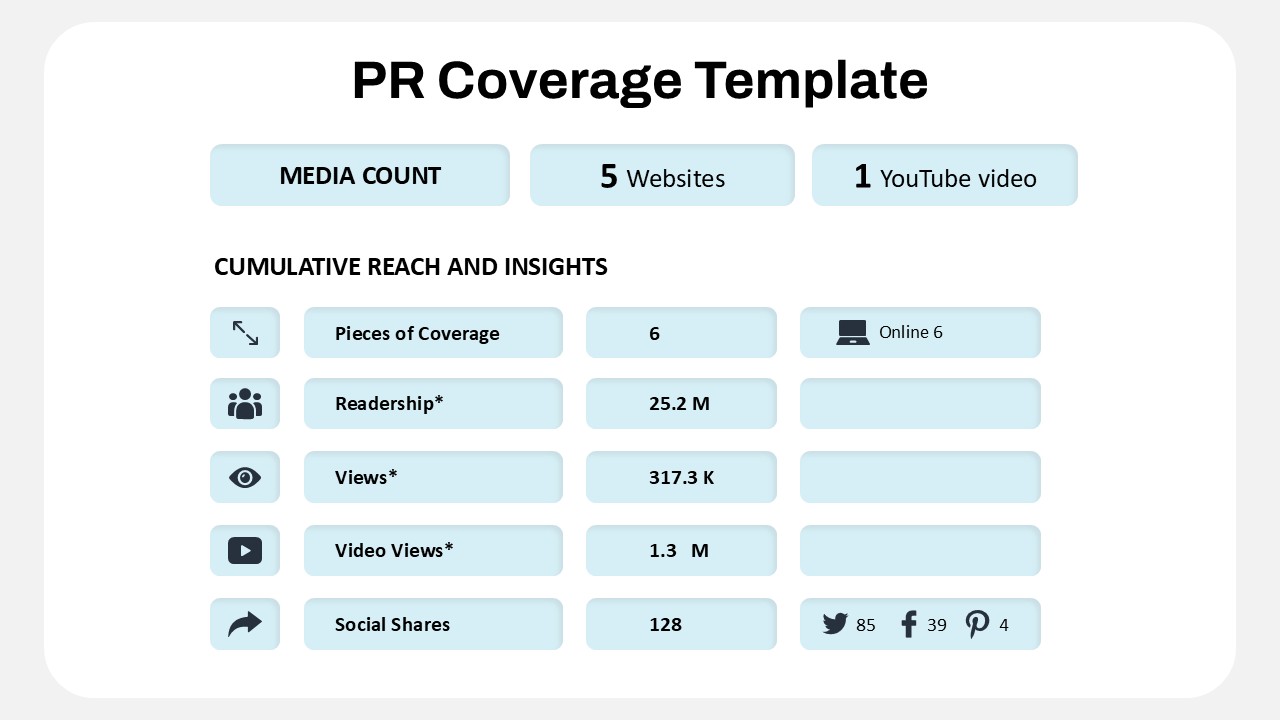
Public Relations Coverage Metrics Template for PowerPoint & Google Slides
Business Report
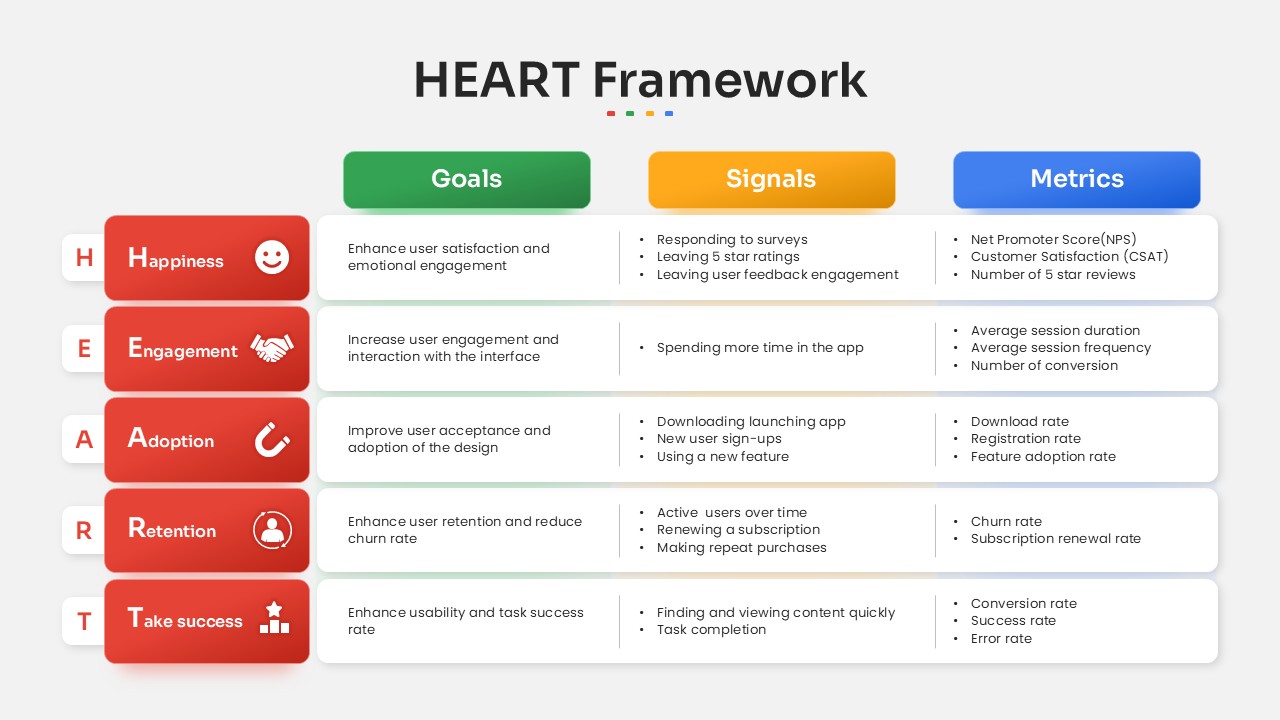
HEART Framework Goals, Signals & Metrics Template for PowerPoint & Google Slides
Process

Farm and Agriculture Pitch Deck Template for PowerPoint & Google Slides
Business Plan

Free Agriculture Company Profile Pitch Deck template for PowerPoint & Google Slides
Company Profile
Free
Sustainable Agriculture Theme Deck for PowerPoint & Google Slides
Business Proposal
Modern Agriculture Business Deck for PowerPoint & Google Slides
Company Profile

Growth Arrow for Progress & Growth template for PowerPoint & Google Slides
Arrow
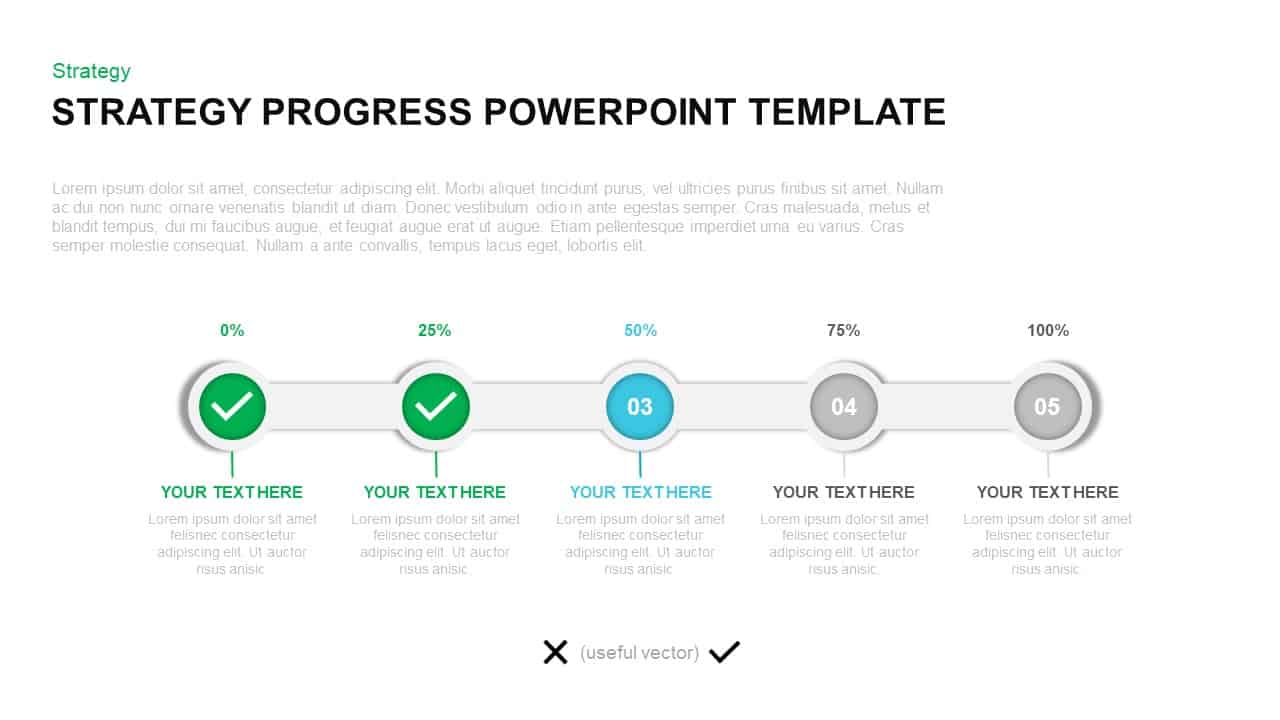
Strategy Progress Timeline Template for PowerPoint & Google Slides
Process
Performance Review Progress Management Template for PowerPoint & Google Slides
Process
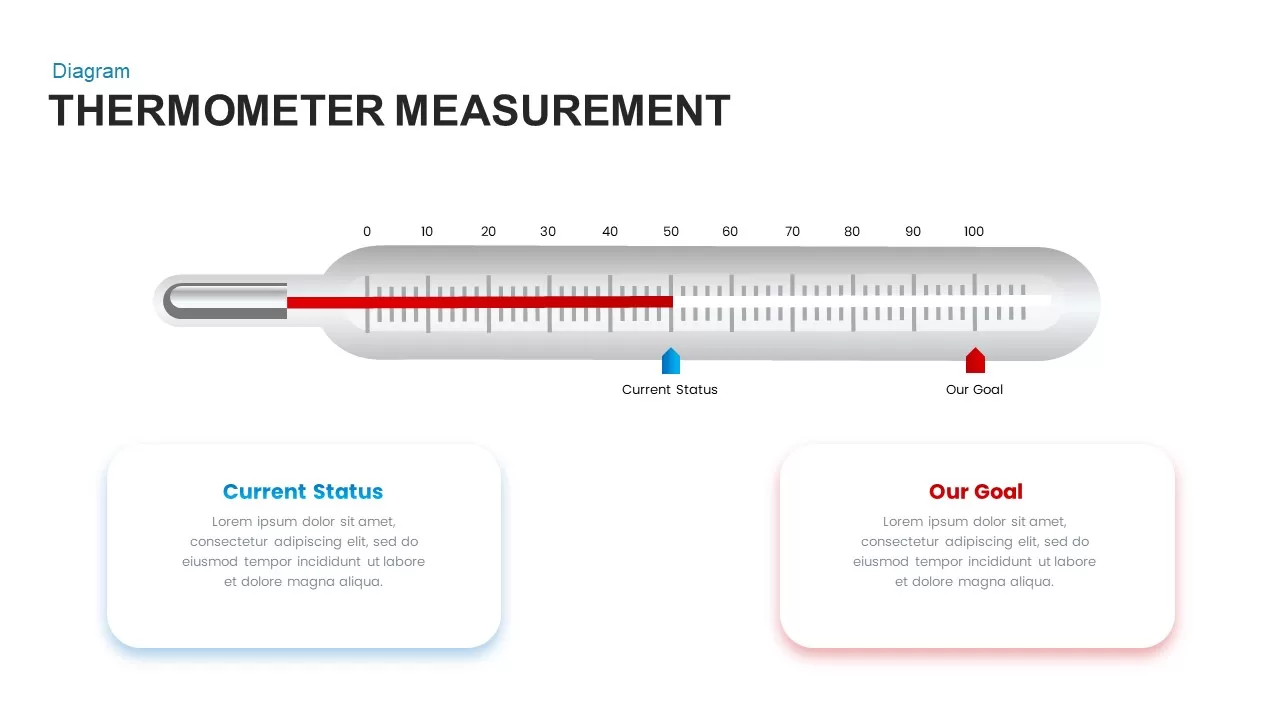
Thermometer Gauge Progress Measurement Template for PowerPoint & Google Slides
Comparison
Free Curved Arrow Progress Chart template for PowerPoint & Google Slides
Project
Free
Dynamic Statistics & Progress Charts Template for PowerPoint & Google Slides
Pie/Donut
Timeline Roadmap with Progress Bar Template for PowerPoint & Google Slides
Timeline
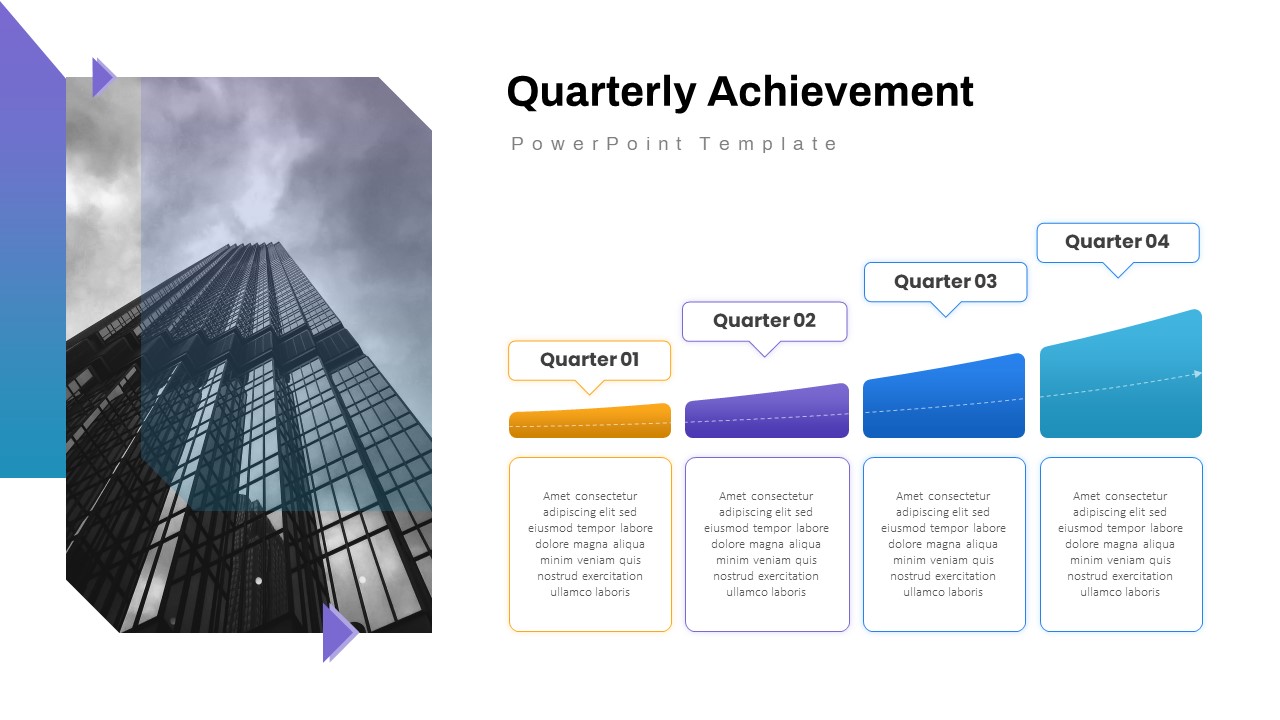
Quarterly Achievement Progress Template for PowerPoint & Google Slides
Accomplishment
Progress Bar and Milestone Visualization Template for PowerPoint & Google Slides
Timeline
Project Progress Dashboard Pie Charts Template for PowerPoint & Google Slides
Project
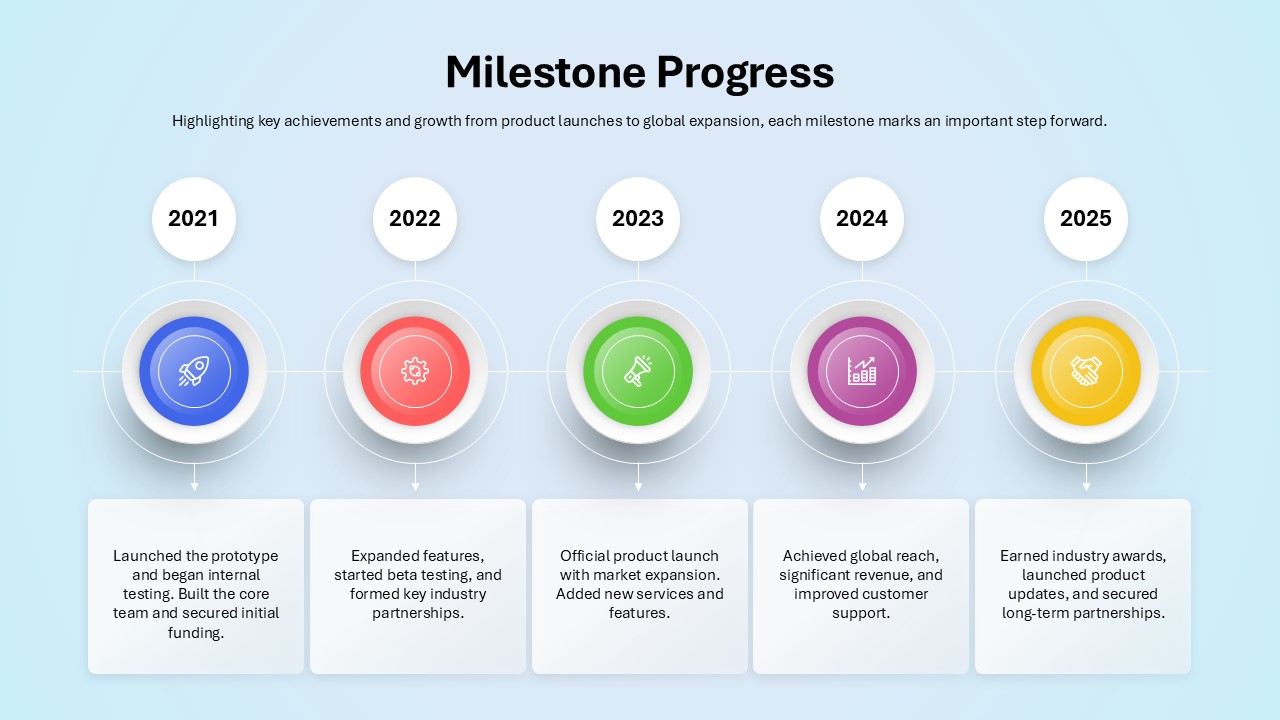
Milestone Progress template for PowerPoint & Google Slides
Business Plan
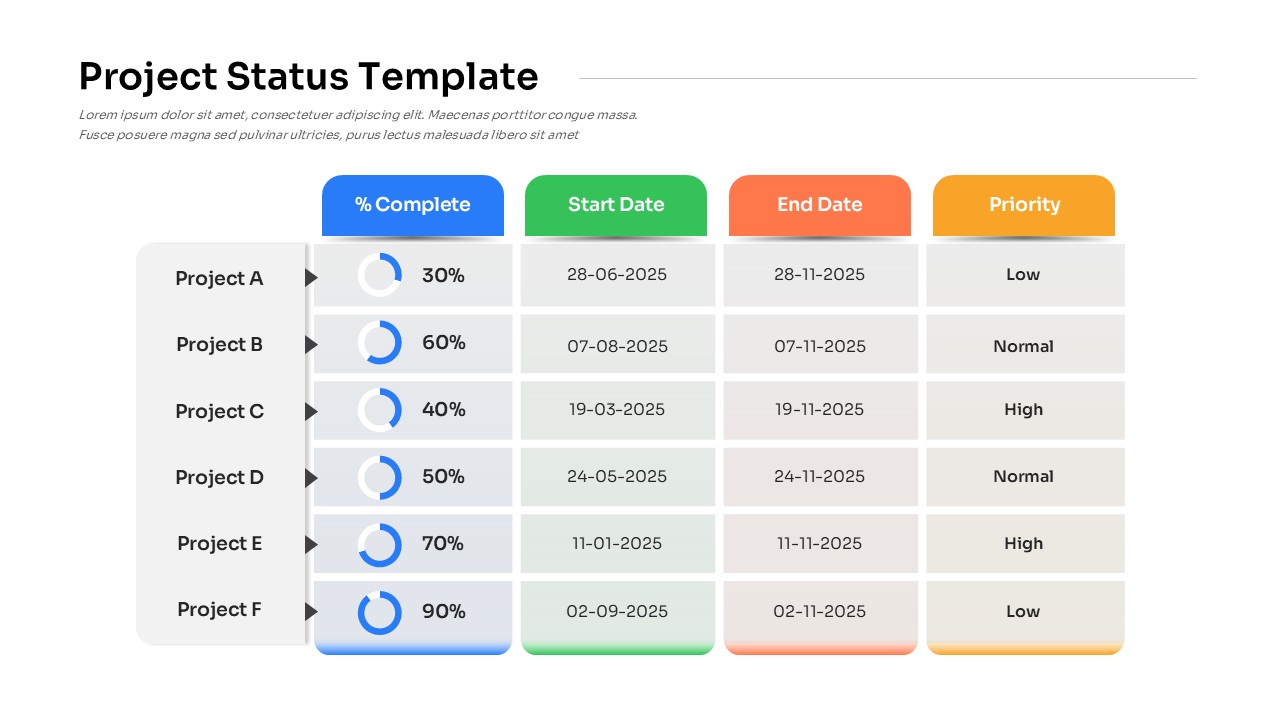
Project Status with Progress & Priority Template for PowerPoint & Google Slides
Table
Progress Bar Graph Layout Design for PowerPoint & Google Slides
Charts
Progress Bar Infographic for PowerPoint & Google Slides
Business
Progress Bar infographic pack for PowerPoint & Google Slides
Business
Agriculture PowerPoint Keynote Background template
Background
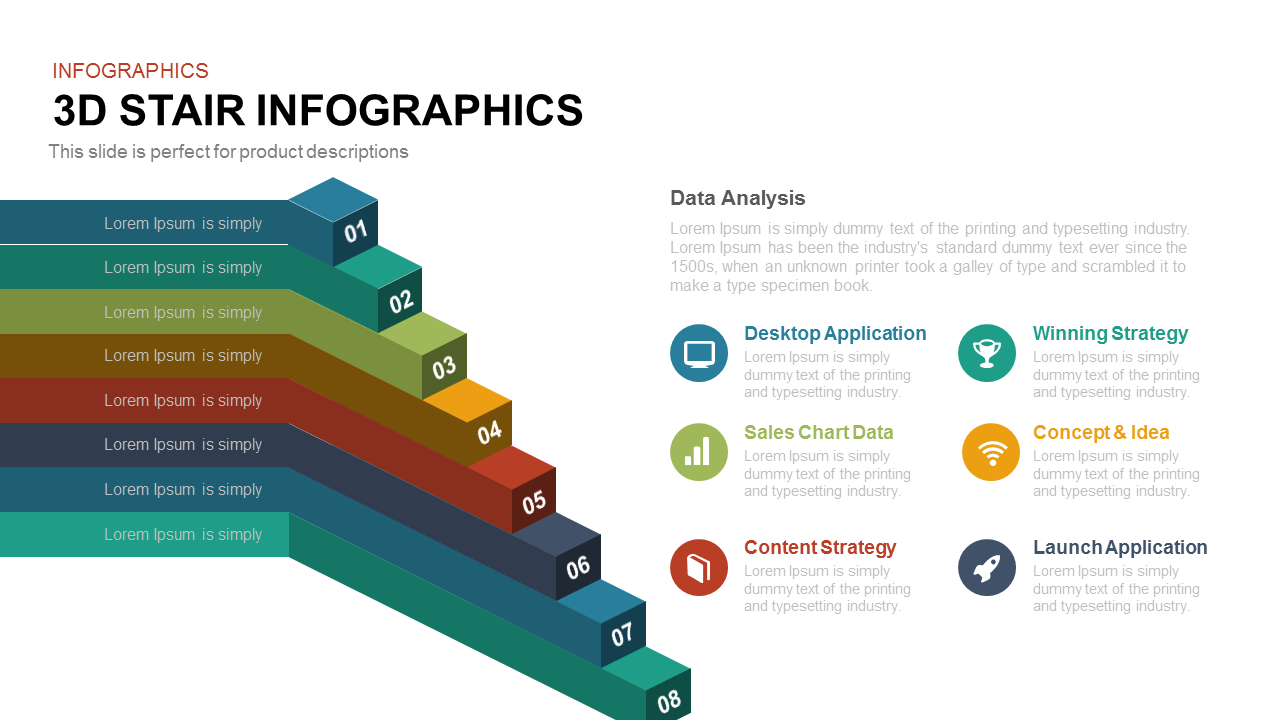
8-Step 3D Stair Infographics Slide template for PowerPoint & Google Slides
Process
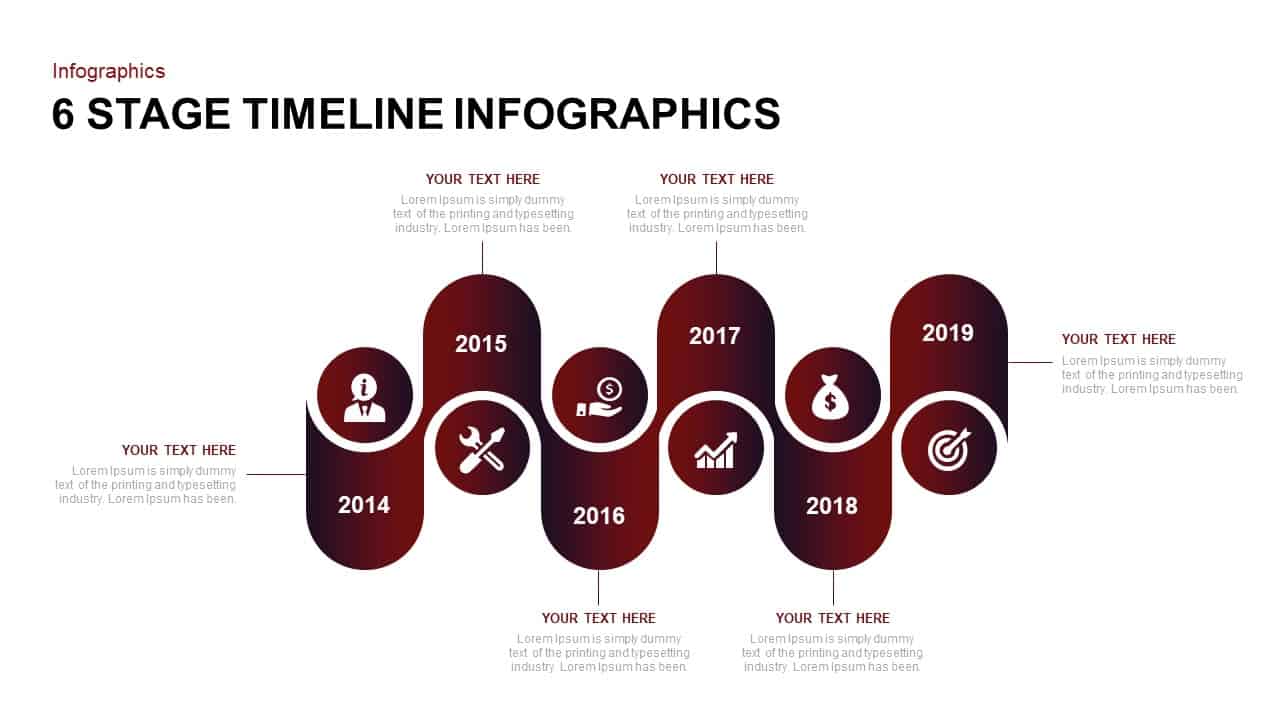
Six-Stage Timeline Infographics Slide Template for PowerPoint & Google Slides
Timeline
3D Pyramid Infographics Slide Template for PowerPoint & Google Slides
Pyramid
3D Cube Pyramid Infographics Slide Template for PowerPoint & Google Slides
Pyramid
Pharmacology Infographics Slide Template for PowerPoint & Google Slides
Health
Free Law Infographics Slide Pack Collection Template for PowerPoint & Google Slides
Infographics
Free
Looking Ahead 3-Slide Infographics Pack Template for PowerPoint & Google Slides
Business
Free Gear Infographics template for PowerPoint & Google Slides
Process
Free
Growth Infographics template for PowerPoint & Google Slides
Arrow
3D Bar Chart Data Infographics Template for PowerPoint & Google Slides
Bar/Column
Puzzle Pipe Infographics Process Flow Template for PowerPoint & Google Slides
Process
5-Stage Arrow Infographics Process Flow Template for PowerPoint & Google Slides
Arrow
Four Swoosh Arrow Infographics template for PowerPoint & Google Slides
Arrow
Eight-Segment 3D Arrow Infographics Template for PowerPoint & Google Slides
Arrow
Five Arrow Infographics Diagram Template for PowerPoint & Google Slides
Arrow
Growth Sign Board Infographics template for PowerPoint & Google Slides
Timeline
Triangle Process Infographics template for PowerPoint & Google Slides
Process
Linear Chain Link Infographics Template for PowerPoint & Google Slides
Process
Free Bulb Puzzle Infographics Diagram Template for PowerPoint & Google Slides
Process
Free
Business Roadmap Infographics template for PowerPoint & Google Slides
Roadmap
Scrum Process & Roles Infographics Template for PowerPoint & Google Slides
Scrum
Venn Diagram Infographics Pack Template for PowerPoint & Google Slides
Circular
Comprehensive Scrum Infographics Pack Template for PowerPoint & Google Slides
Scrum
Editable Pillars Infographics Pack Template for PowerPoint & Google Slides
Infographics
Cube Core Infographics Template for PowerPoint & Google Slides
Process

Creative Cycle Process Infographics Template for PowerPoint & Google Slides
Process
Time Management Infographics Template for PowerPoint & Google Slides
Process
Modern 5-Step Flow Infographics Template for PowerPoint & Google Slides
Process
Rainbow Cloud Infographics Diagram Template for PowerPoint & Google Slides
Process
Medical Infographics Data Visualization Template for PowerPoint & Google Slides
Health
Isometric 3D Cube Shapes Infographics Template for PowerPoint & Google Slides
Infographics
Six-Step Circular Diagram Infographics Template for PowerPoint & Google Slides
Circular
3, 4, and 5 Step Gear Infographics Template for PowerPoint & Google Slides
Process
Free Colorful Process Flow Infographics Template for PowerPoint & Google Slides
Process
Free
Agenda Infographics Diamond template for PowerPoint & Google Slides
Business Plan
Weisbord’s Six Box Model Infographics Template for PowerPoint & Google Slides
Circular
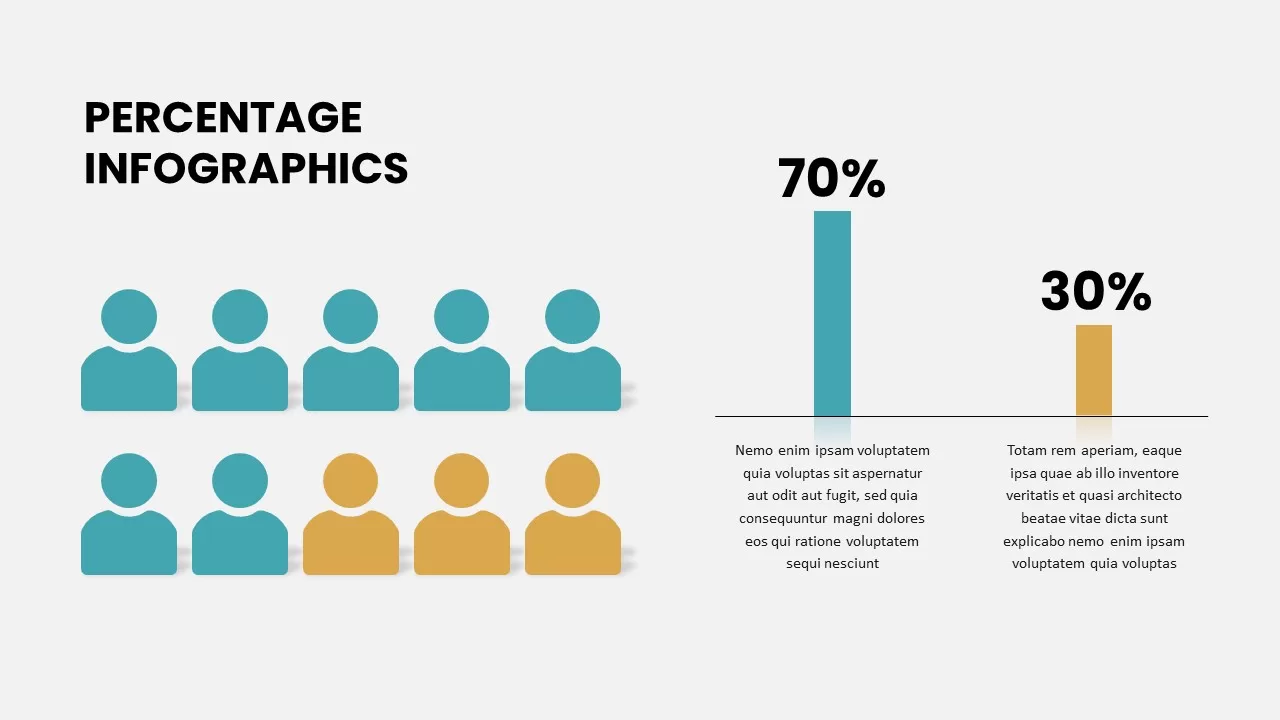
Free Percentage Infographics template for PowerPoint & Google Slides
Comparison
Free
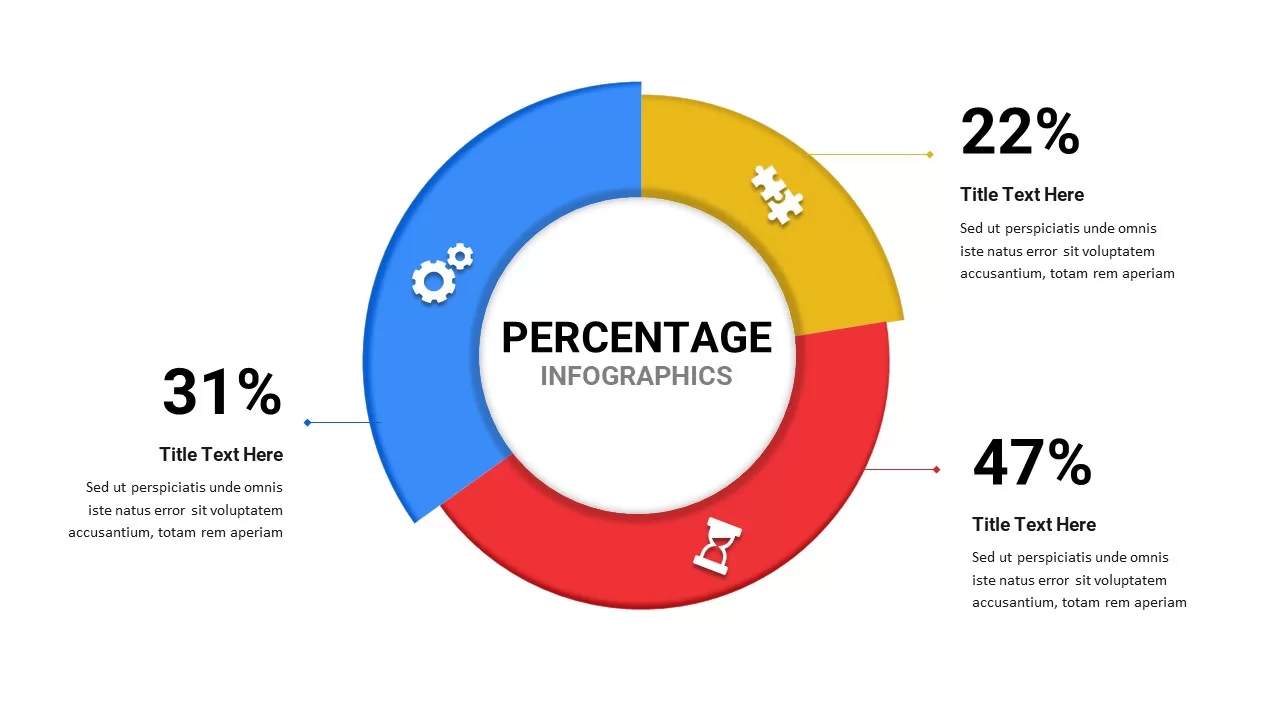
Percentage Infographics template for PowerPoint & Google Slides
Comparison
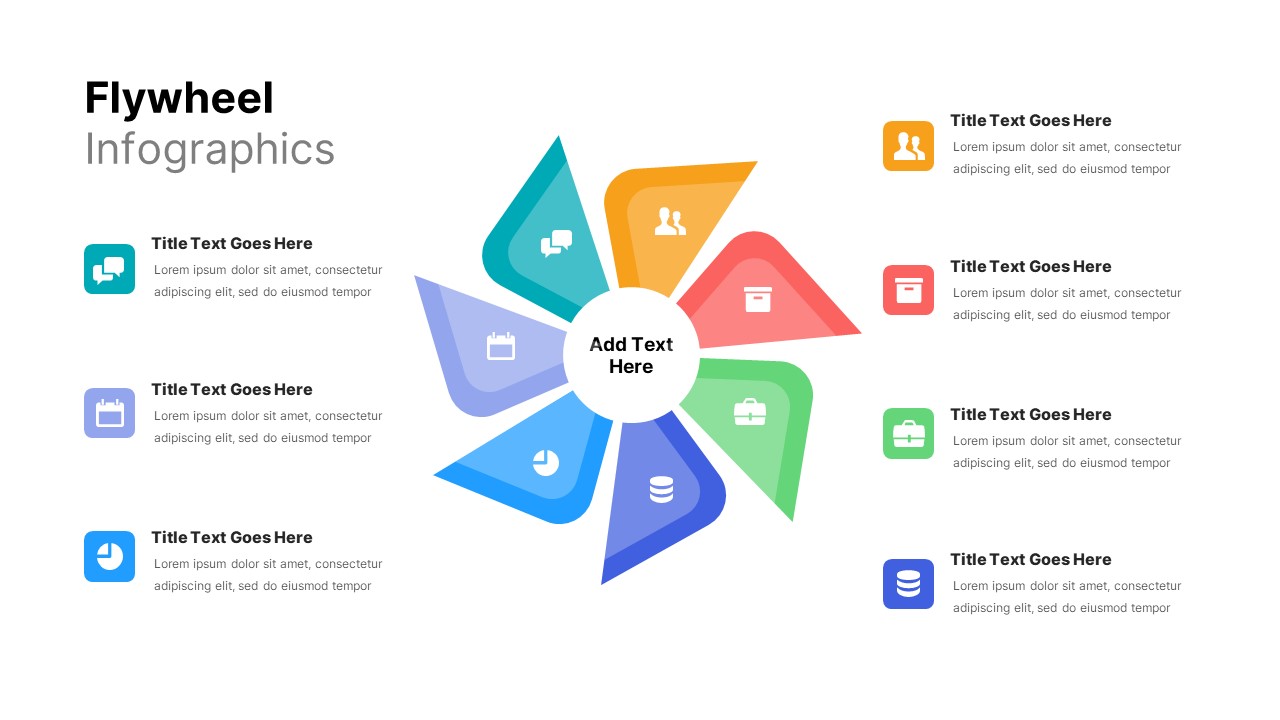
Flywheel Infographics template for PowerPoint & Google Slides
Business Strategy
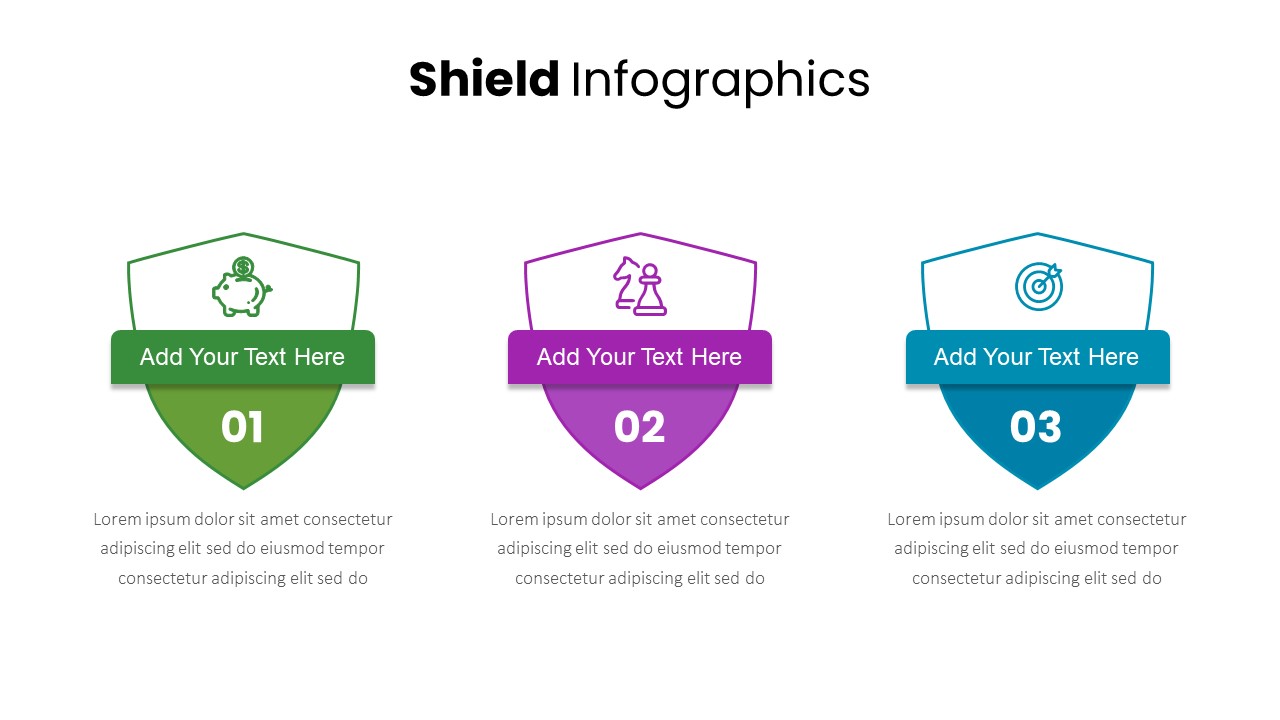
Three-Part Shield Infographics Template for PowerPoint & Google Slides
Comparison
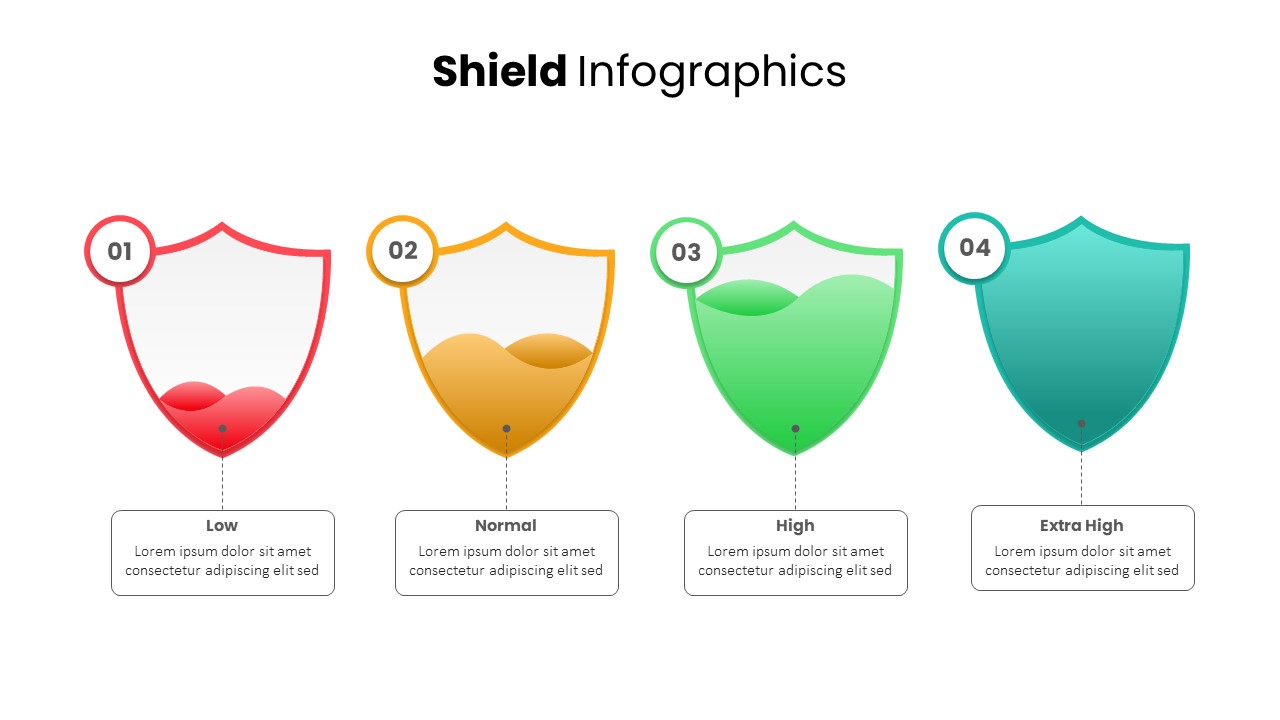
Shield Infographics Risk Indicators Template for PowerPoint & Google Slides
Infographics
Surgery Infographics Comparison Template for PowerPoint & Google Slides
Health
Free Roadmap Infographics Pack Template for PowerPoint & Google Slides
Pitch Deck
Free
Banking Service & Finance Infographics Template for PowerPoint & Google Slides
Finance
Free
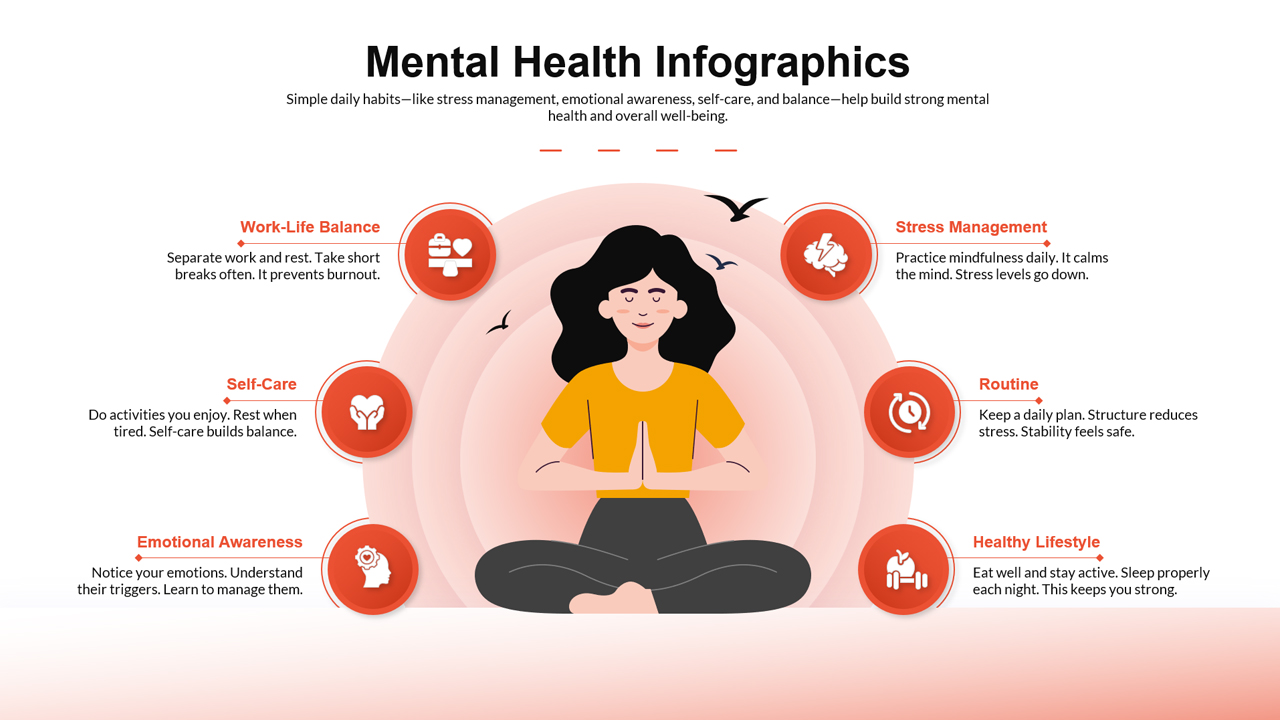
Mental Health Infographics Template for PowerPoint & Google Slides
Health