8-Step Circular Gear Infographics Diagram for PowerPoint & Google Slides

Description
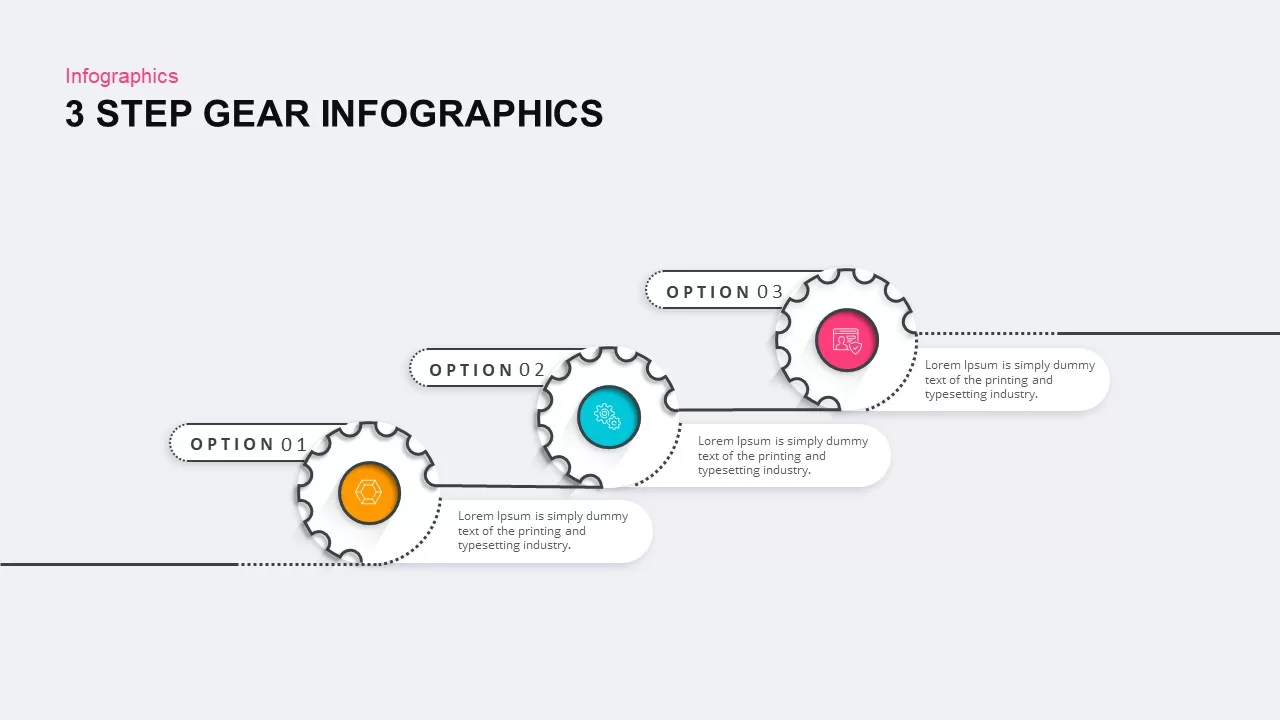
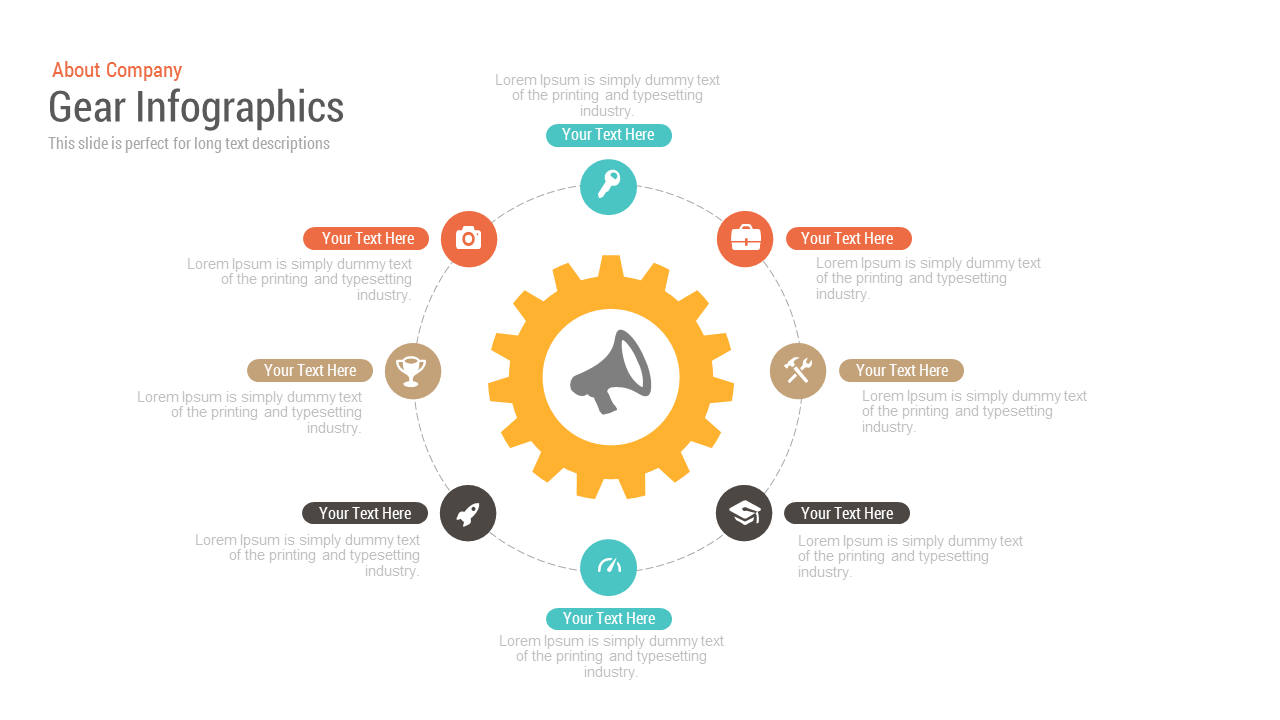
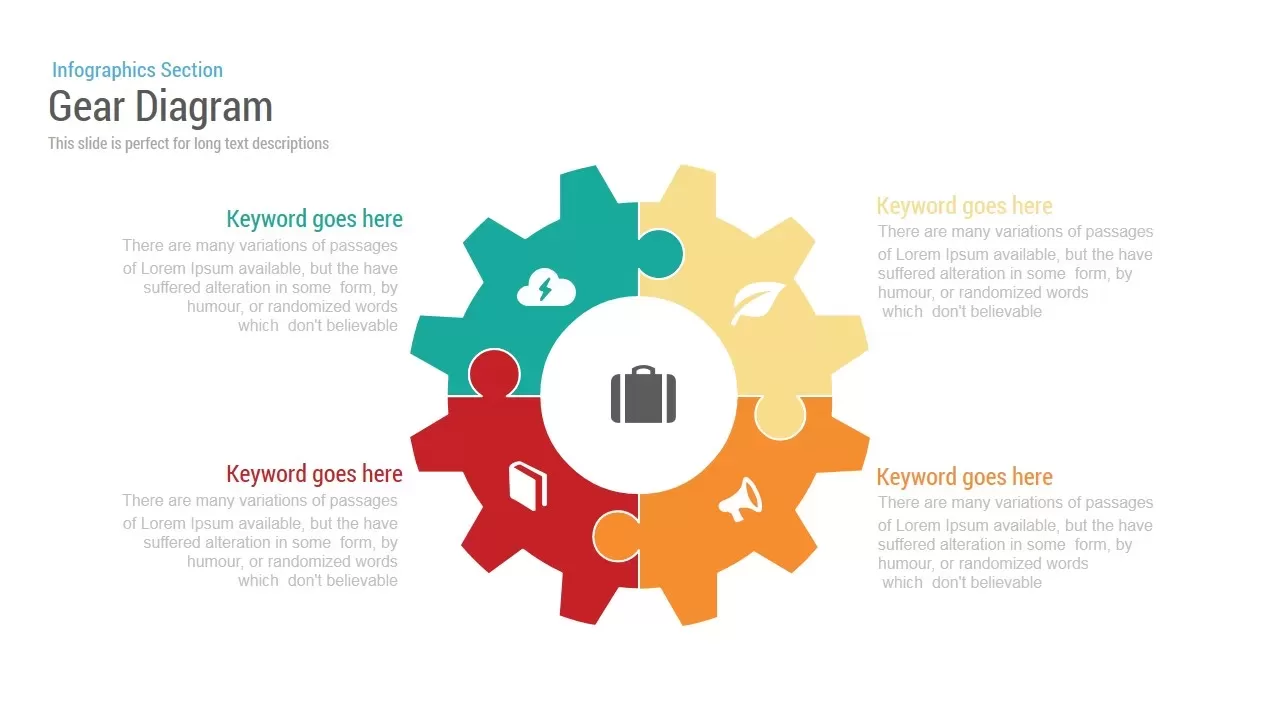
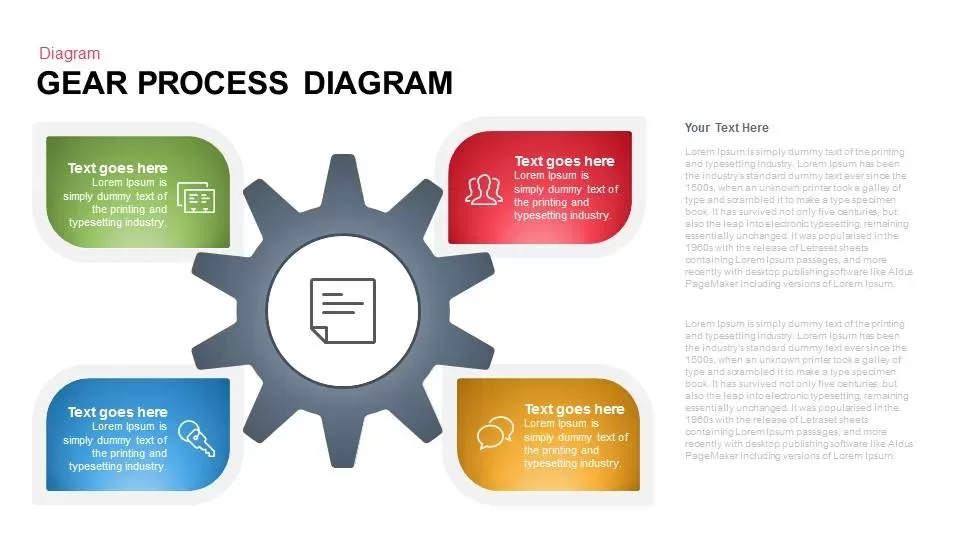
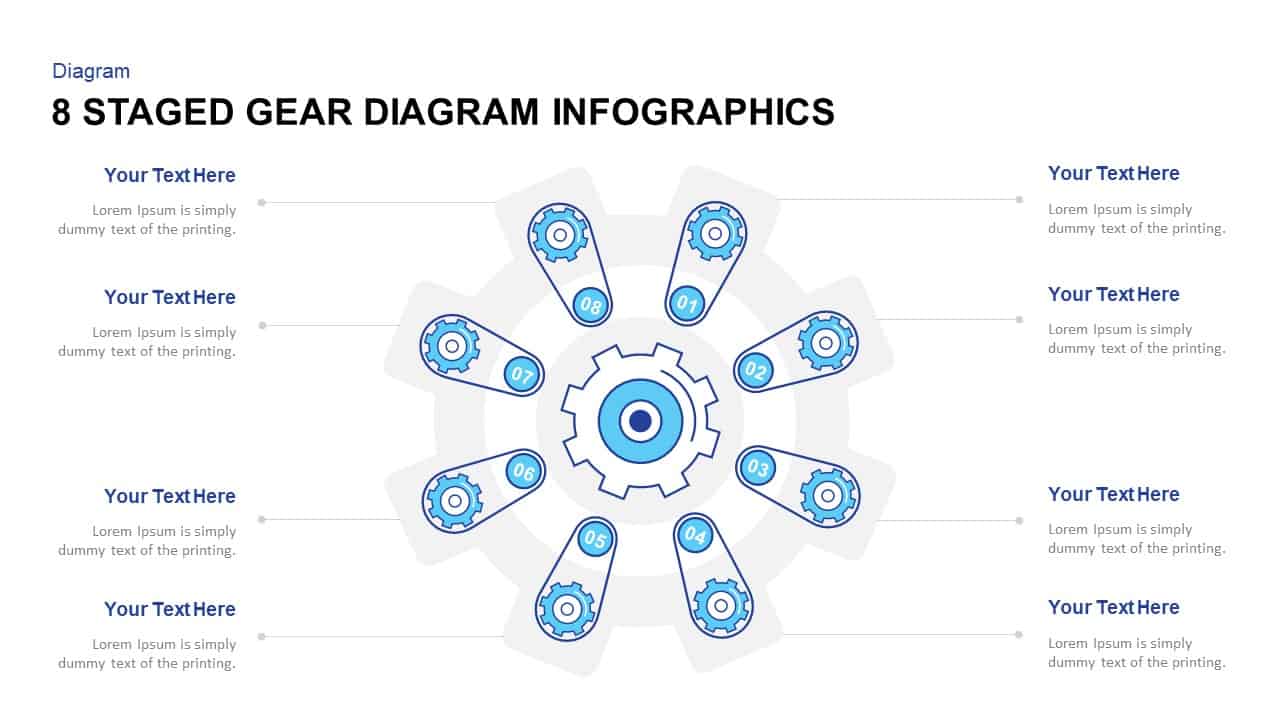
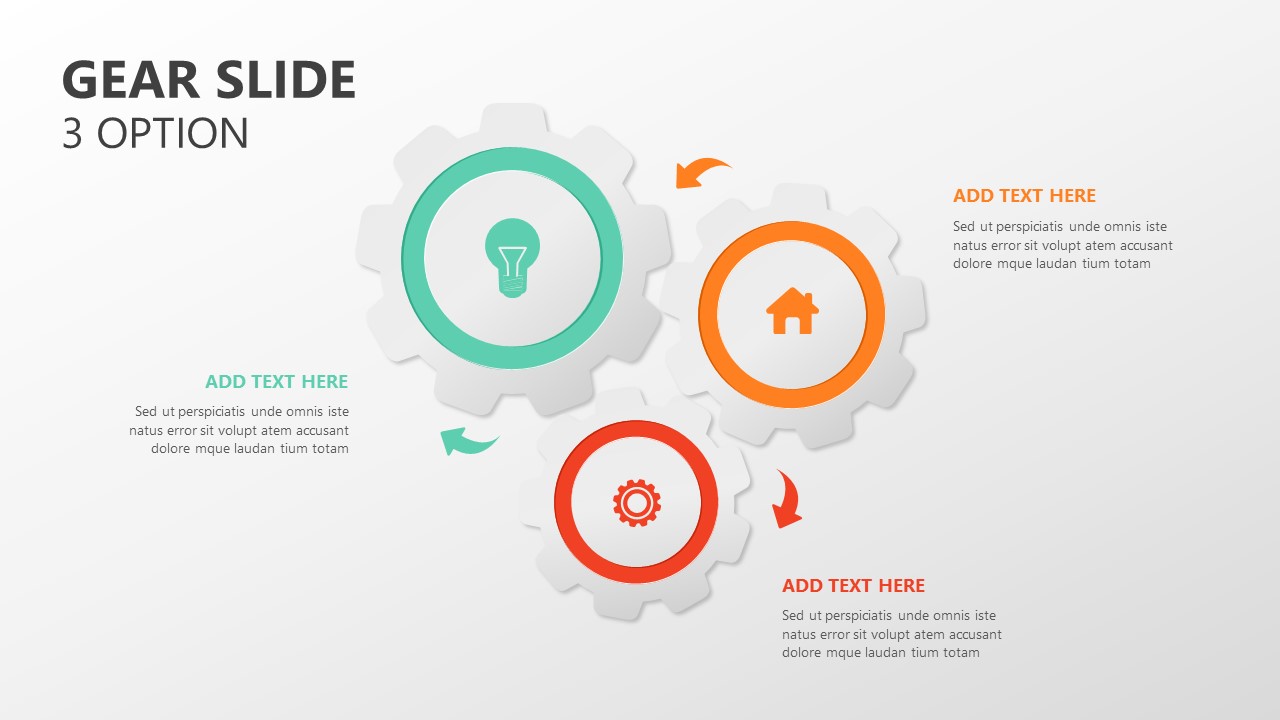
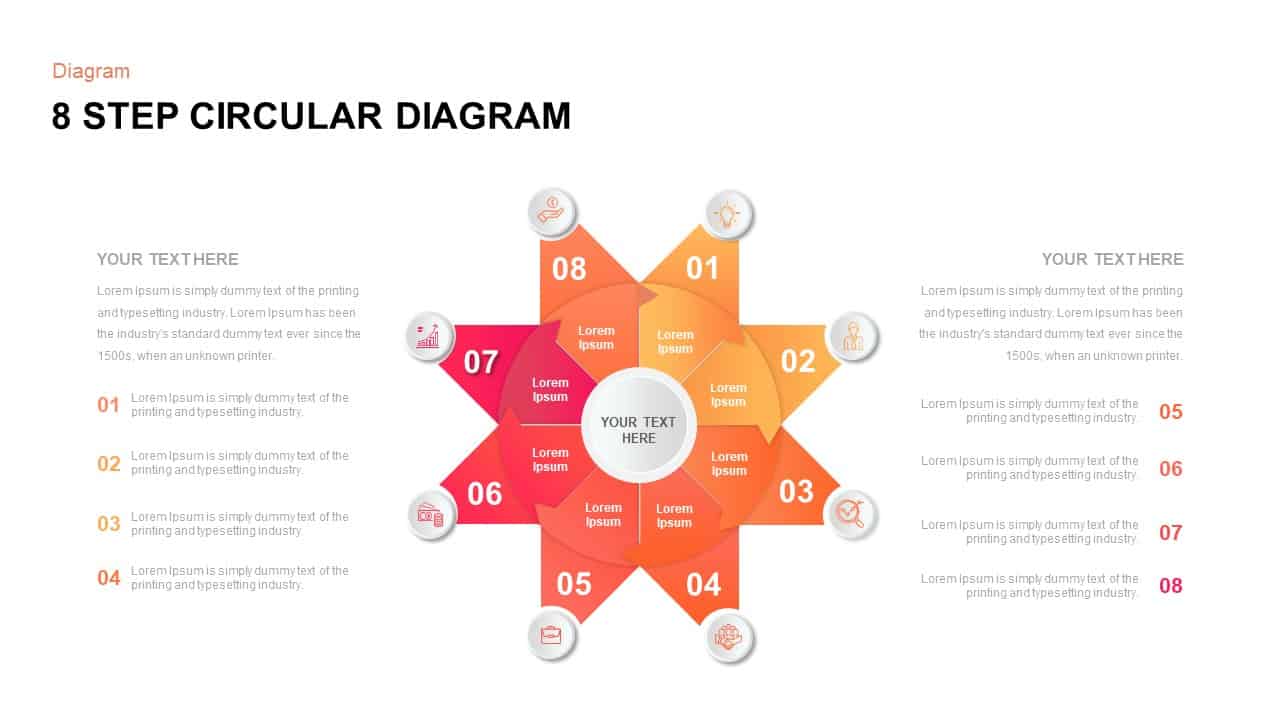
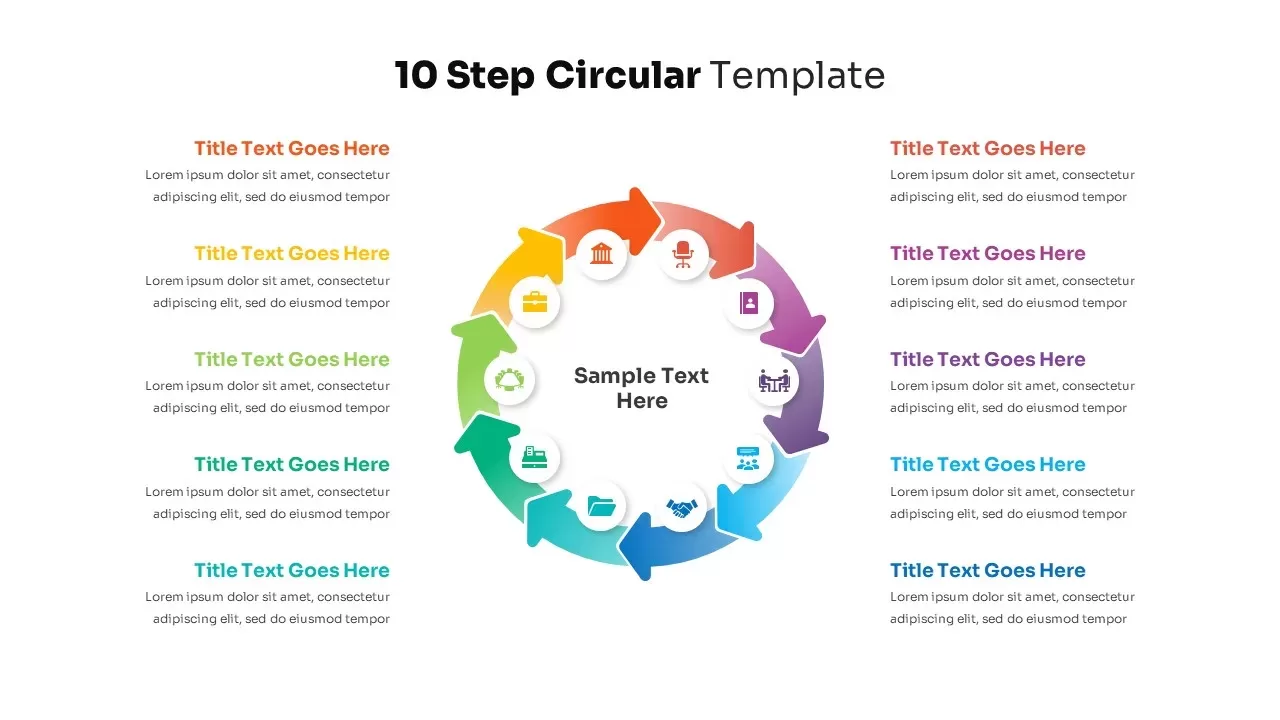
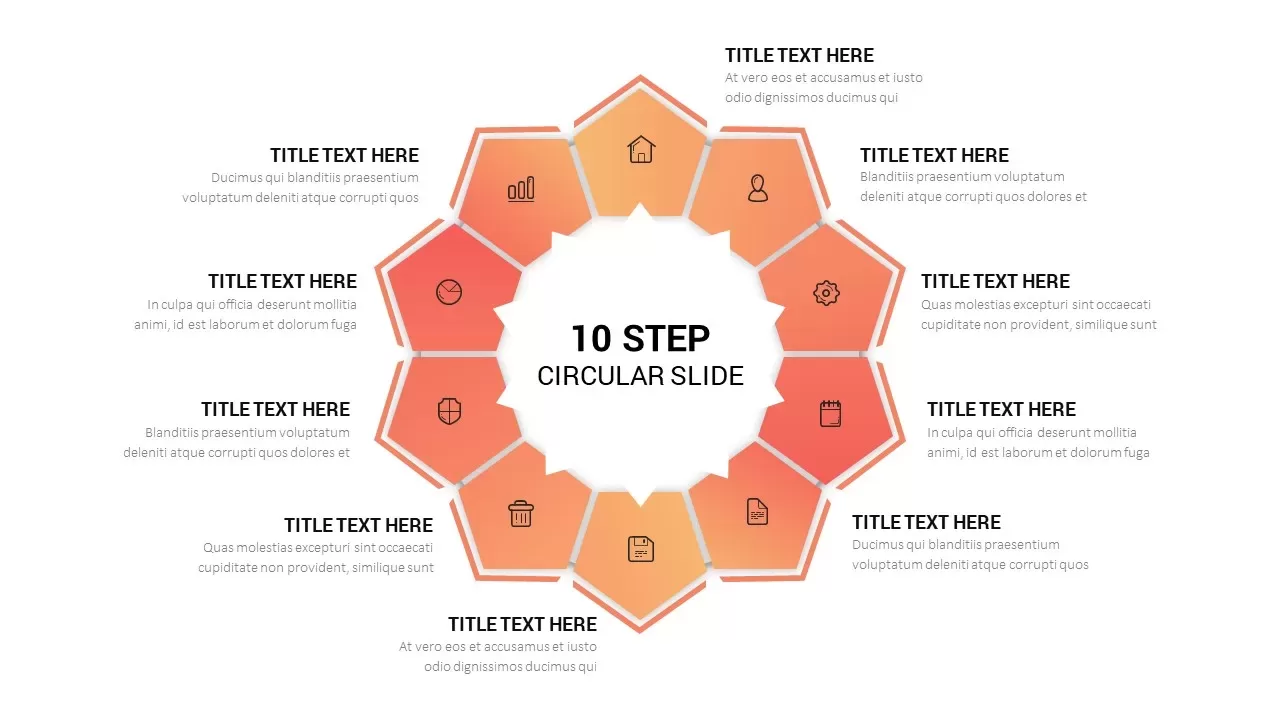
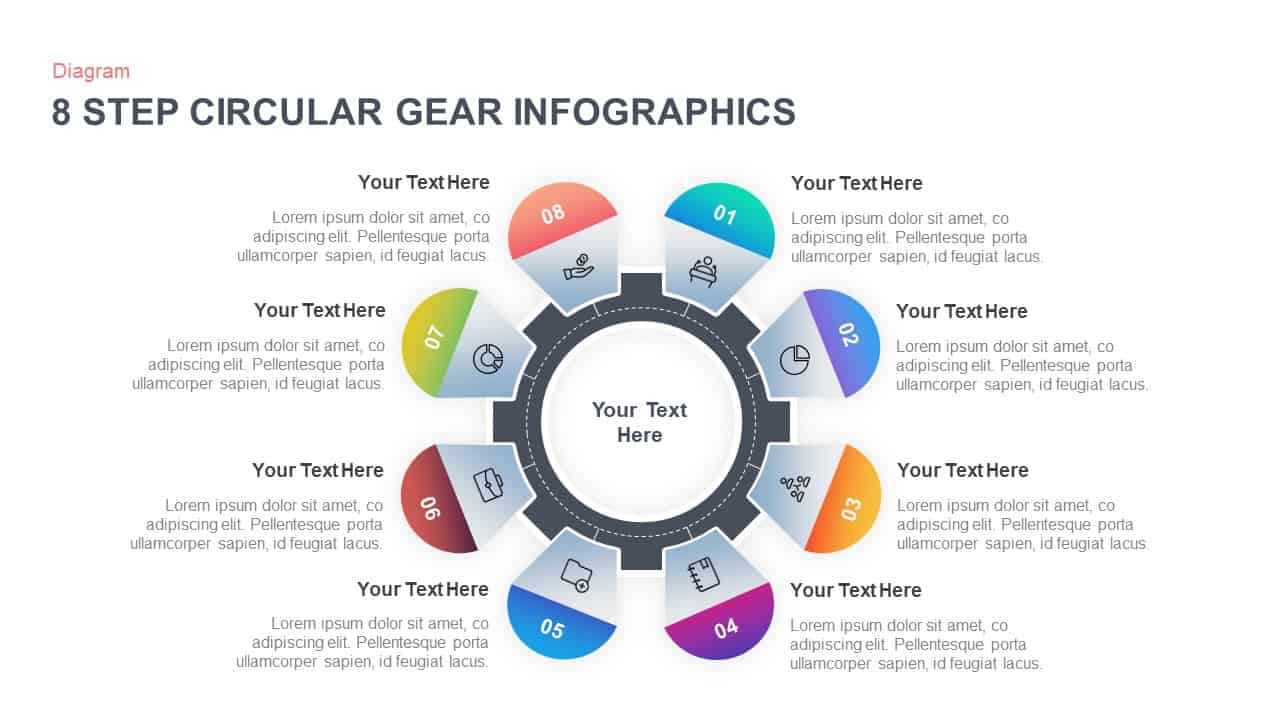
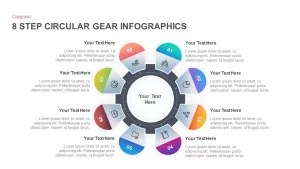
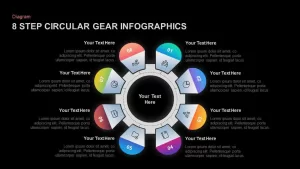
This 8-step circular gear infographic is designed to help you visually represent a sequence of steps, processes, or stages in a dynamic, easy-to-follow format. Each segment of the circular gear is distinctly color-coded with icons to match its associated text, making it ideal for showcasing workflows, project timelines, or business strategies. The simple, modern layout provides space for clear explanations, making the data accessible and visually engaging. The infographic’s vibrant design features a gradient of colors, from blue to green, purple to orange, ensuring that each step stands out for emphasis. Whether you’re crafting a roadmap, explaining a cycle, or illustrating a linear process, this slide is a perfect fit for corporate or educational presentations.
Editable placeholders allow for quick adjustments to the text and icons, offering maximum customization to suit your specific needs. The flexible design ensures that the infographic will adapt well to various industries and topics. Optimized for both PowerPoint and Google Slides, it provides full clarity across devices without the worry of formatting issues. Whether used in a business proposal, a project status update, or a client presentation, this template will help you present data effectively, drawing your audience’s attention to key details.
Who is it for
This diagram is ideal for project managers, business consultants, team leaders, and educators who need to communicate step-by-step processes, workflows, or methodologies clearly and concisely. It is particularly useful in strategic meetings, operational planning sessions, or process optimization workshops.
Other Uses
Beyond business applications, this infographic can be used in educational settings to teach concepts that involve sequential steps or processes. It’s also useful in workshops, team-building exercises, and client presentations where clear visual communication of a process or framework is essential.
Login to download this file

Item ID
SB01580
Related Templates

8-Step Circular Gear Infographic Diagram Template for PowerPoint & Google Slides
Circular
3, 4, and 5 Step Gear Infographics Template for PowerPoint & Google Slides
Process
6-Part Circular Gear Infographic Diagram Template for PowerPoint & Google Slides
Process

Five-Step Gear Process Diagram Template for PowerPoint & Google Slides
Process

4 Step Gear Diagram Template for PowerPoint & Google Slides
Process

Three-Step Triangular Gear Diagram Template for PowerPoint & Google Slides
Process
Dynamic Gear Diagram Infographics Template for PowerPoint & Google Slides
Process
Six-Step Circular Diagram Infographics Template for PowerPoint & Google Slides
Circular
8-Step Circular Diagram Infographics Template for PowerPoint & Google Slides
Circular
Dynamic Four-Step Gear Process Template for PowerPoint & Google Slides
Process
Free Gear Infographics template for PowerPoint & Google Slides
Process
Free
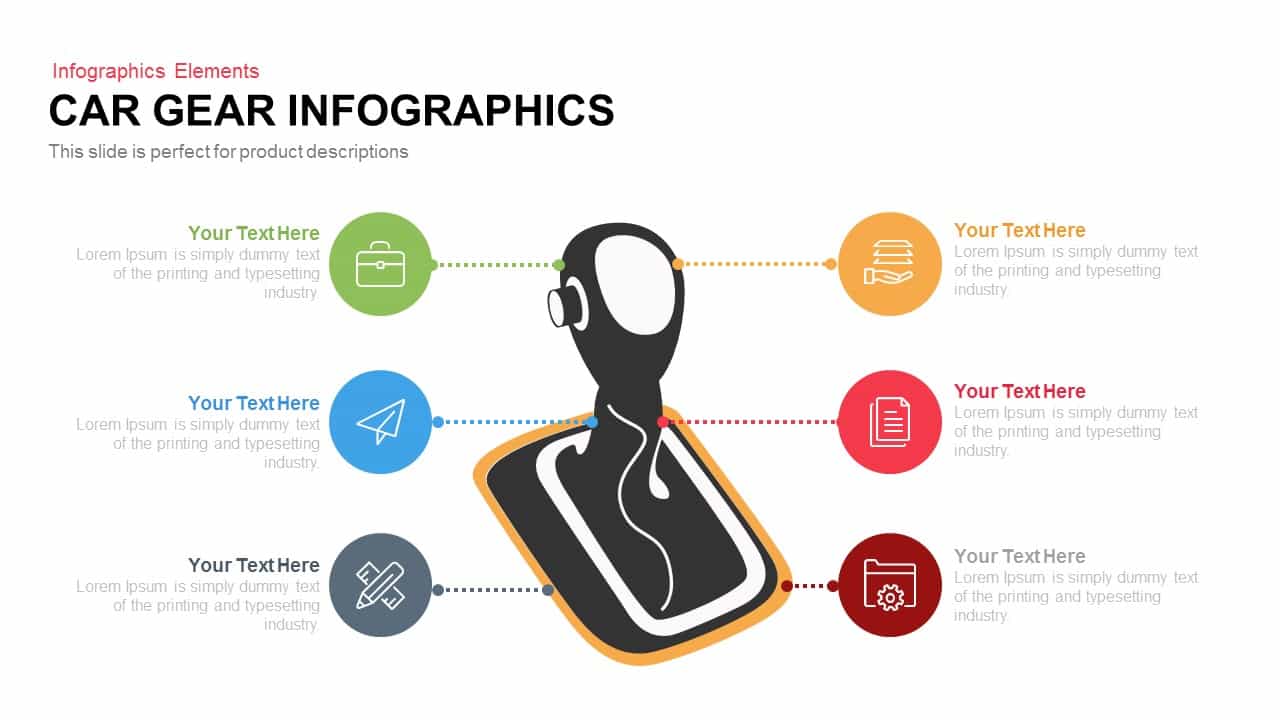
Car Gear Infographics Template for PowerPoint & Google Slides
Infographics
Brain Gear Hub-and-Spoke Infographics template for PowerPoint & Google Slides
Org Chart
Four-Step Circular Process Infographics Template for PowerPoint & Google Slides
Circular
Five-Step Circular Badge Infographics Template for PowerPoint & Google Slides
Circular
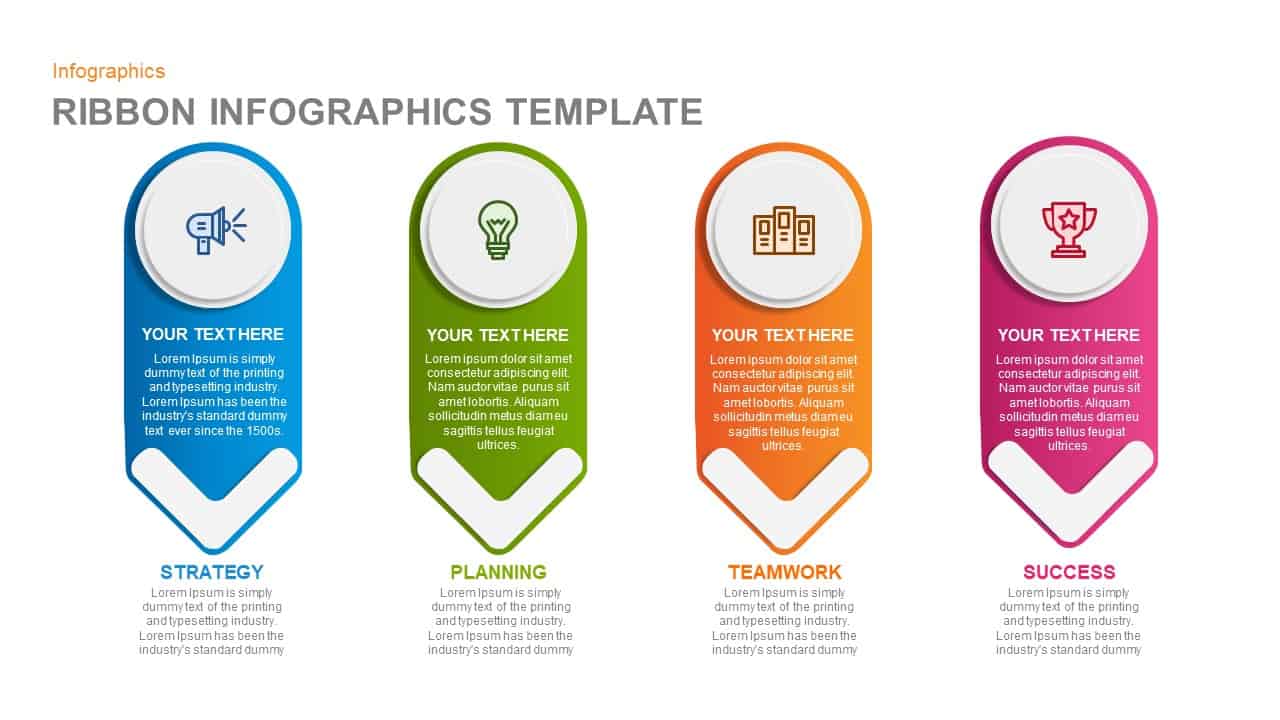
Ribbon Infographics Step-by-Step Process Template for PowerPoint & Google Slides
Process
Gear Process Diagram PowerPoint Template for PowerPoint & Google Slides
Process
Gear Process Diagram template for PowerPoint & Google Slides
Process
Gear Diagram template for PowerPoint & Google Slides
Process
Professional 3D Gear Process Diagram Template for PowerPoint & Google Slides
Process
Gear Process Phase Diagram template for PowerPoint & Google Slides
Process
Four Gear Section Diagram Template for PowerPoint & Google Slides
Circular

Dynamic 4 Gear Process Diagram Template for PowerPoint & Google Slides
Process
Colorful Modern CRM Gear Diagram Template for PowerPoint & Google Slides
Customer Experience
Gear Pie Diagram Data Visualization Template for PowerPoint & Google Slides
Pie/Donut
Six-Staged Gear Diagram Framework Template for PowerPoint & Google Slides
Process
Gear Process Diagram for PowerPoint & Google Slides
Process
Gear Flow Diagram template for PowerPoint & Google Slides
Process

Modern Four Stage Gear Diagram Template for PowerPoint & Google Slides
Process
Artificial Intelligence Gear Diagram Template for PowerPoint & Google Slides
Process
Marketing Risk Management Gear Diagram Template for PowerPoint & Google Slides
Risk Management
SWOT Analysis Gear Diagram Slide Template for PowerPoint & Google Slides
SWOT
Supply Chain Process Gear Diagram Template for PowerPoint & Google Slides
Process
Six Sigma Gear Process Diagram Template for PowerPoint & Google Slides
Process
Six-Stage Gear Wheel Diagram Template for PowerPoint & Google Slides
Circular
Four-Stage Gear Process Diagram Template for PowerPoint & Google Slides
Process
5-Stage Gear Process Flow Diagram Template for PowerPoint & Google Slides
Process
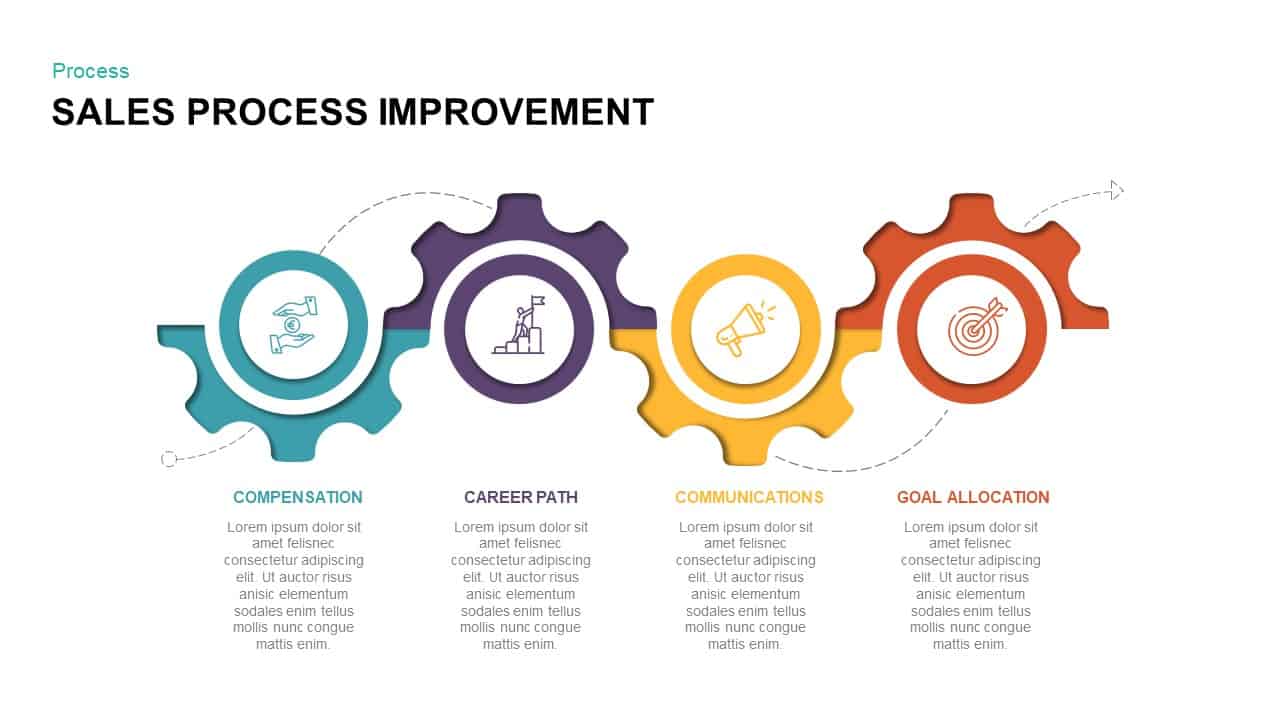
Sales Process Improvement Gear Diagram Template for PowerPoint & Google Slides
Process
Eight-Stage Gear Diagram Process Template for PowerPoint & Google Slides
Process
Modern Gear Venn Diagram Infographic Template for PowerPoint & Google Slides
Comparison
Six-Option Gear Diagram Slide Template for PowerPoint & Google Slides
Circular
Gear Process Diagram Template for PowerPoint & Google Slides
Process
Gear Process Diagram Template for PowerPoint & Google Slides
Process
Cloud Gear Automation Diagram Template for PowerPoint & Google Slides
Cloud Computing
4 Step Creative Circular Diagram Template for PowerPoint & Google Slides
Infographics
Six Step Creative Circular Diagram Template for PowerPoint & Google Slides
Circular
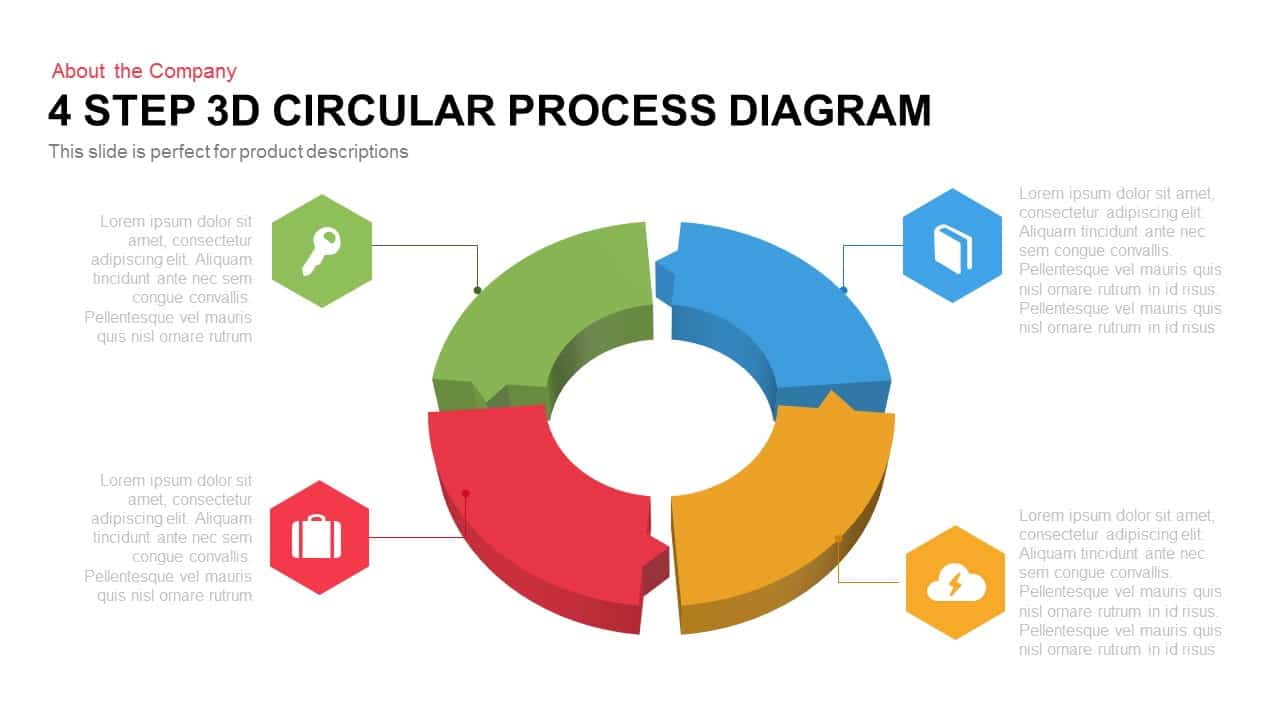
4 Step 3D Circular Process Diagram template for PowerPoint & Google Slides
Process
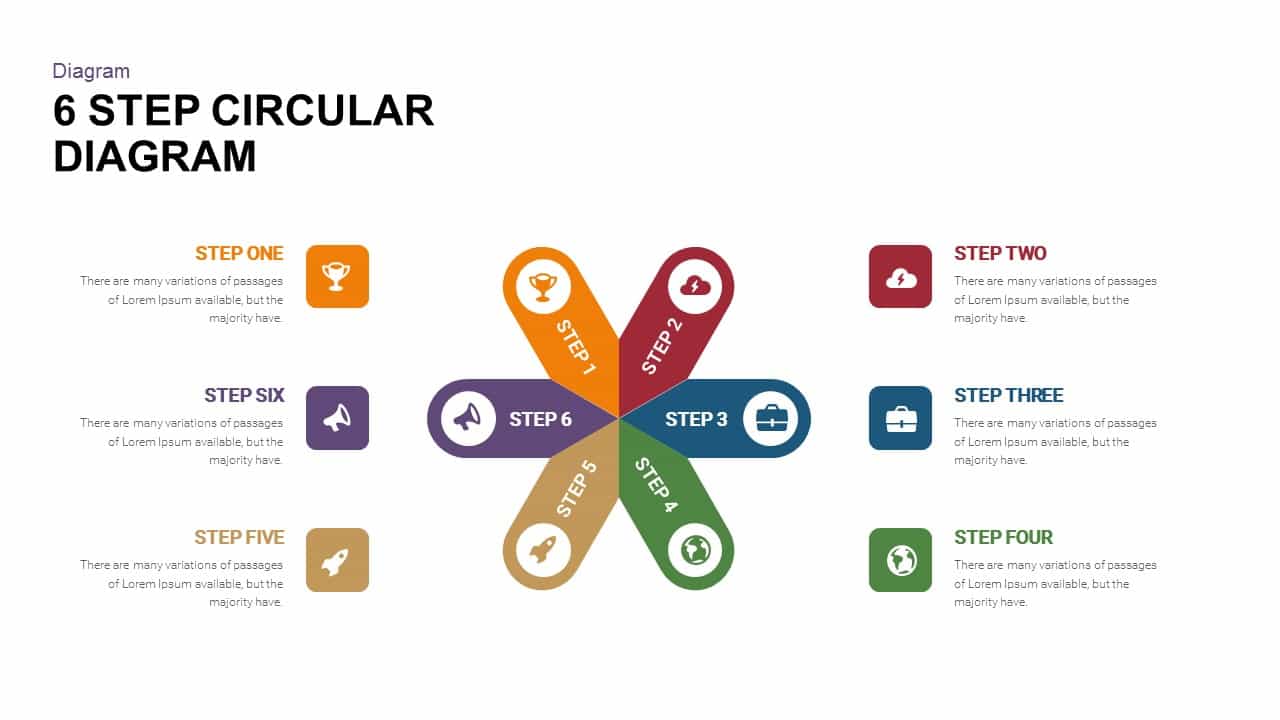
6 Step Circular Diagram for PowerPoint & Google Slides
Process
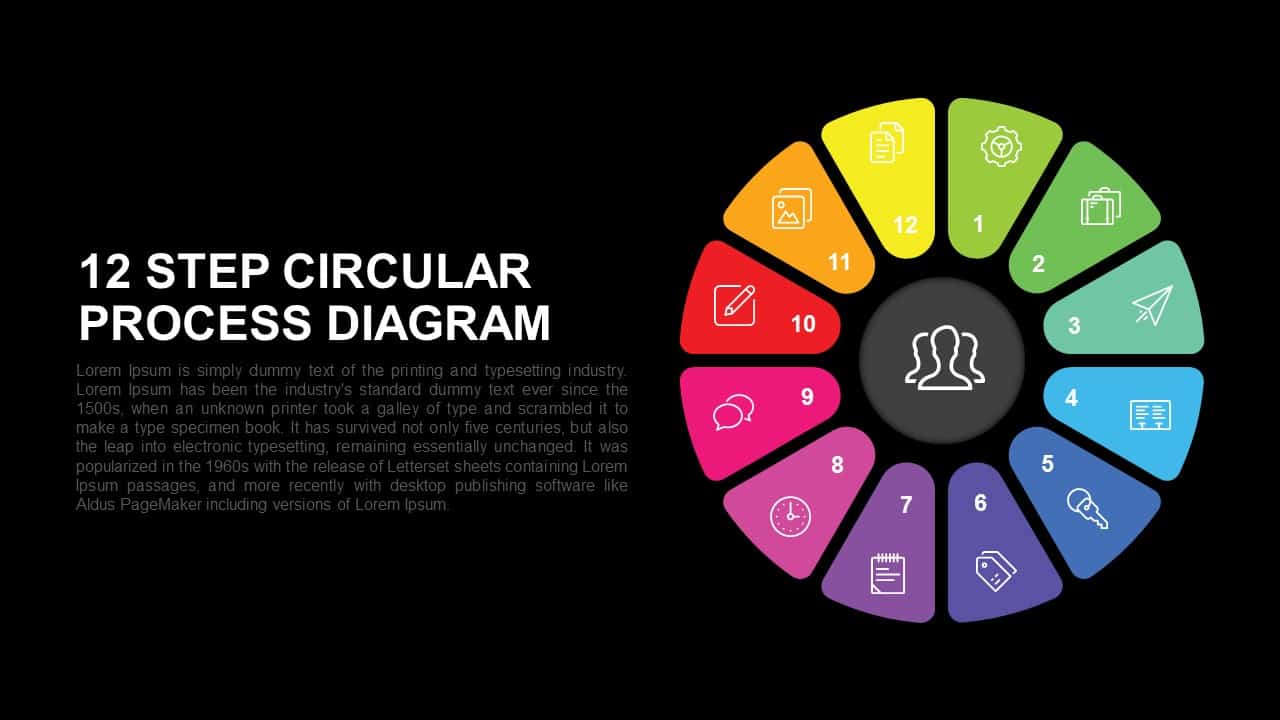
12 Step Circular Diagram for PowerPoint & Google Slides
Process
8-Step Circular Arrow Diagram Template for PowerPoint & Google Slides
Arrow
Eight-Step Circular Diagram Infographic Template for PowerPoint & Google Slides
Circular
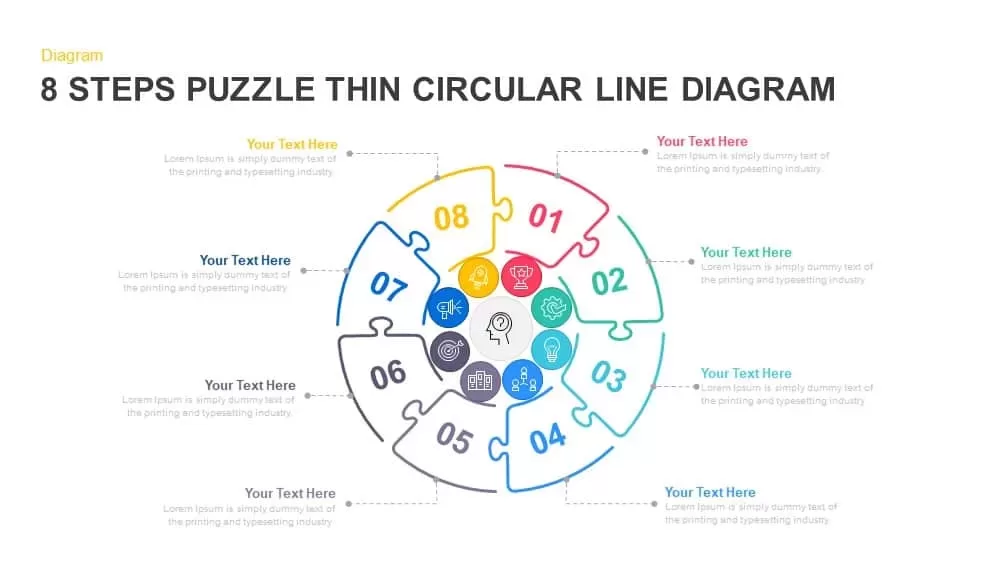
8-Step Puzzle Circular Diagram Template for PowerPoint & Google Slides
Circular
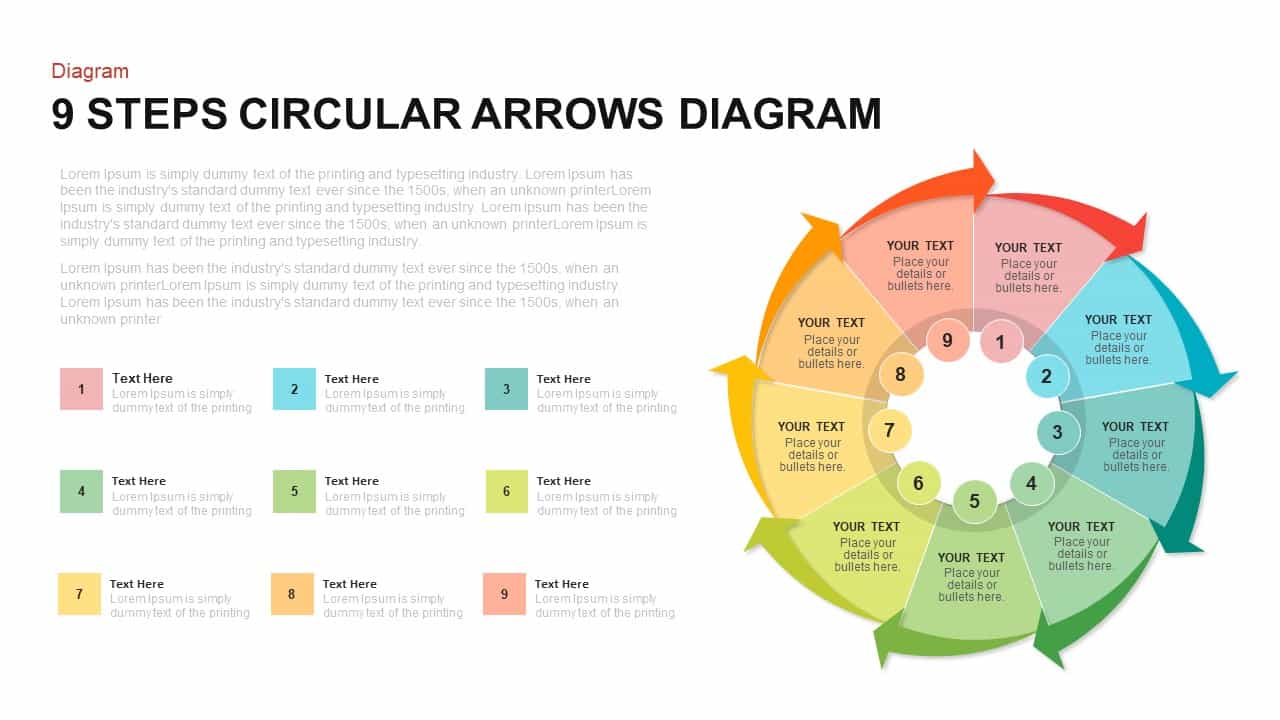
9-Step Circular Arrows Process Diagram Template for PowerPoint & Google Slides
Process
Five-Step Circular Process Diagram Template for PowerPoint & Google Slides
Circular
Circular Three-Step Infographic Diagram Template for PowerPoint & Google Slides
Circular
8 Step Circular Process Flow Diagram Template for PowerPoint & Google Slides
Process
6-Step Circular Process Flow Diagram Template for PowerPoint & Google Slides
Process
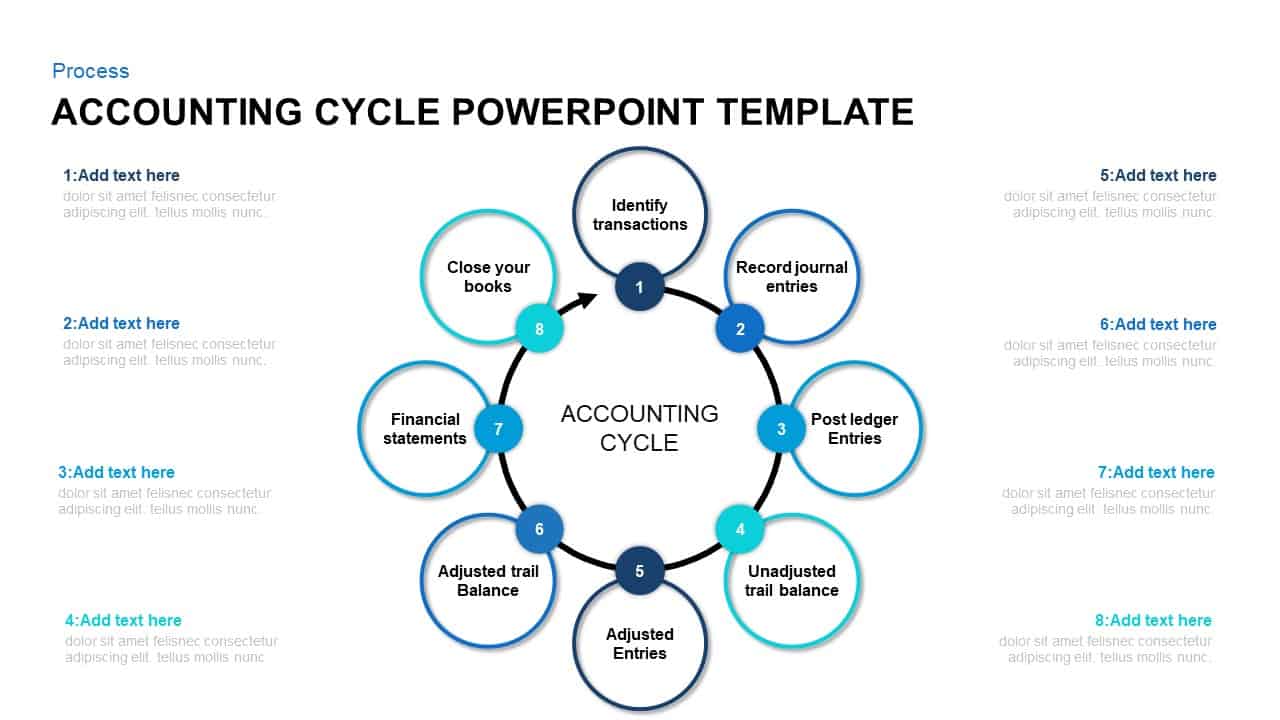
8-Step Circular Accounting Cycle Diagram Template for PowerPoint & Google Slides
Accounting
Eight Step Circular Diagram Template for PowerPoint & Google Slides
Circular
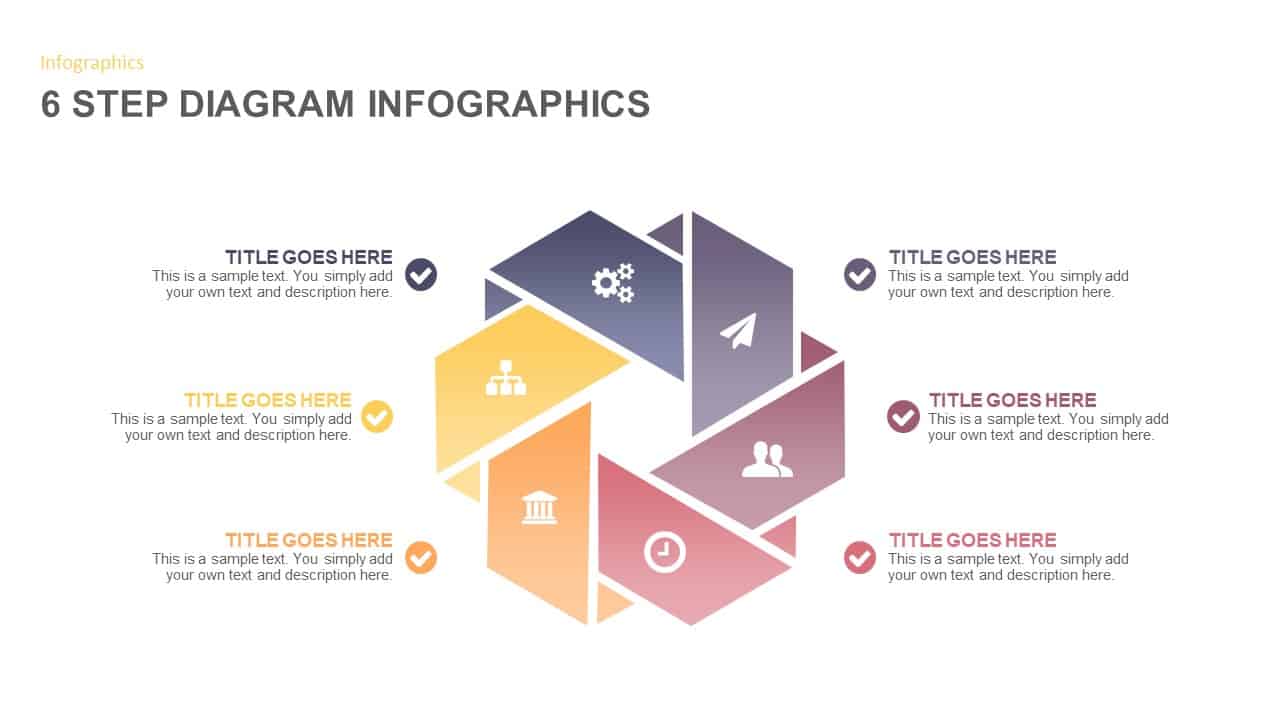
6-Step Circular Diagram Infographic Template for PowerPoint & Google Slides
Circular
2-8 Step Circular Diagram Template for PowerPoint & Google Slides
Infographics
4-Step Circular Infographic Diagram Template for PowerPoint & Google Slides
Circular
5-Step Circular Puzzle Diagram Template for PowerPoint & Google Slides
Circular
4-Step Circular PDCA Cycle Diagram Template for PowerPoint & Google Slides
Process
3 Step Creative Circular Diagram for PowerPoint & Google Slides
Process
Free Circular Multi-Step Flow Chart Diagram Template for PowerPoint & Google Slides
Flow Charts
Free
Three-Step Circular Arrows Diagram Template for PowerPoint & Google Slides
Process
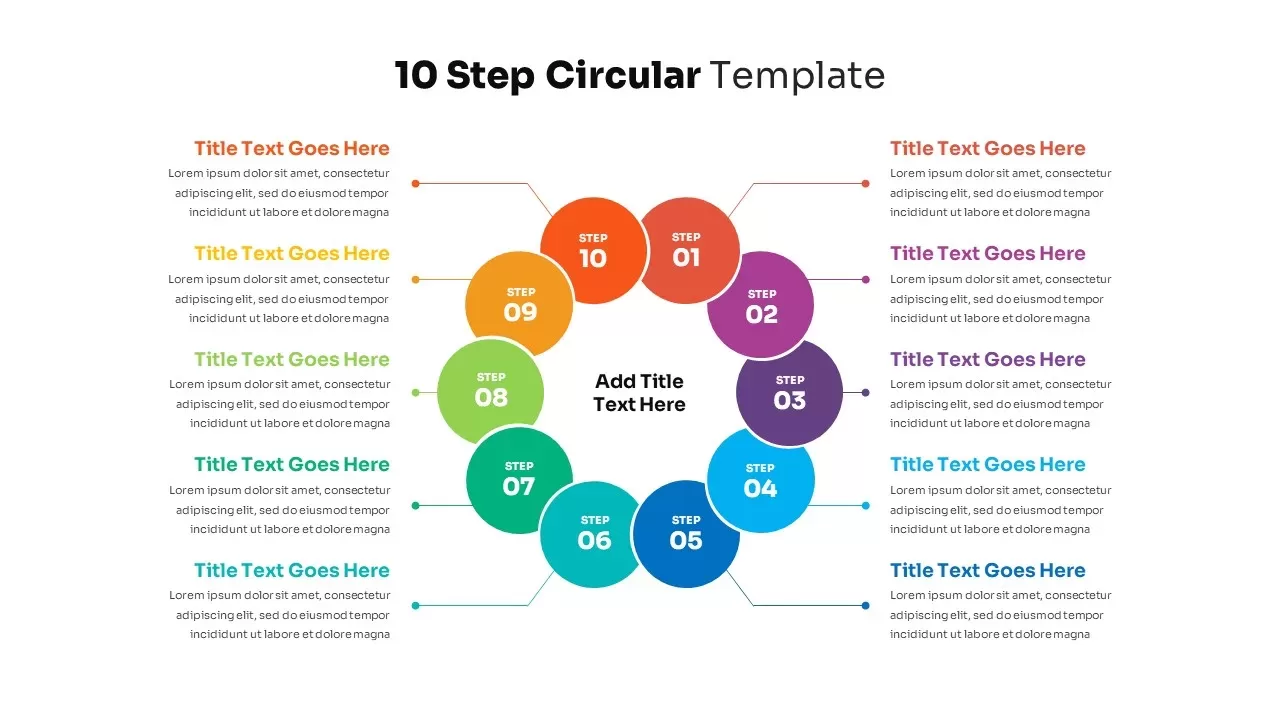
10-Step Circular Process Diagram Template for PowerPoint & Google Slides
Process
10-Step Colorful Circular Diagram Template for PowerPoint & Google Slides
Circular
10-Step Circular Process Diagram Template for PowerPoint & Google Slides
Process
10 Step Circular Process Diagram Template for PowerPoint & Google Slides
Circular
10-Step Circular Diagram Template for PowerPoint & Google Slides
Circular
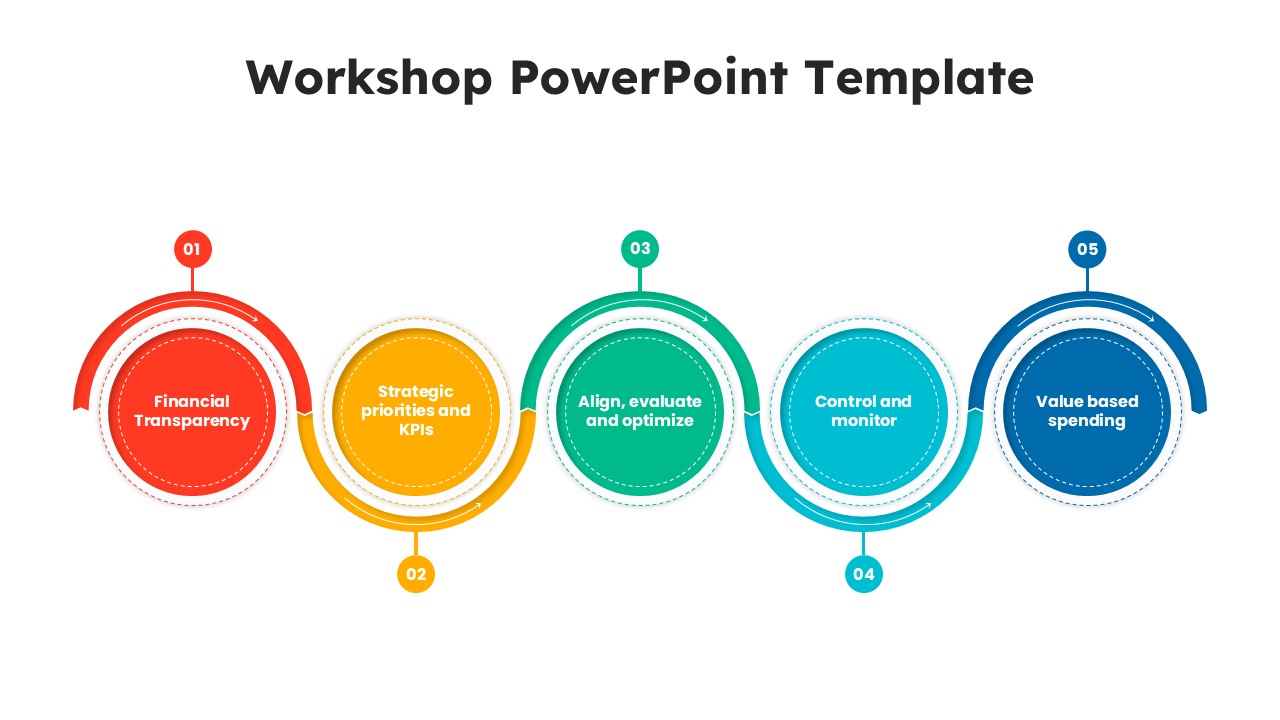
Workshop 5-Step Circular Process Diagram Template for PowerPoint & Google Slides
Circular
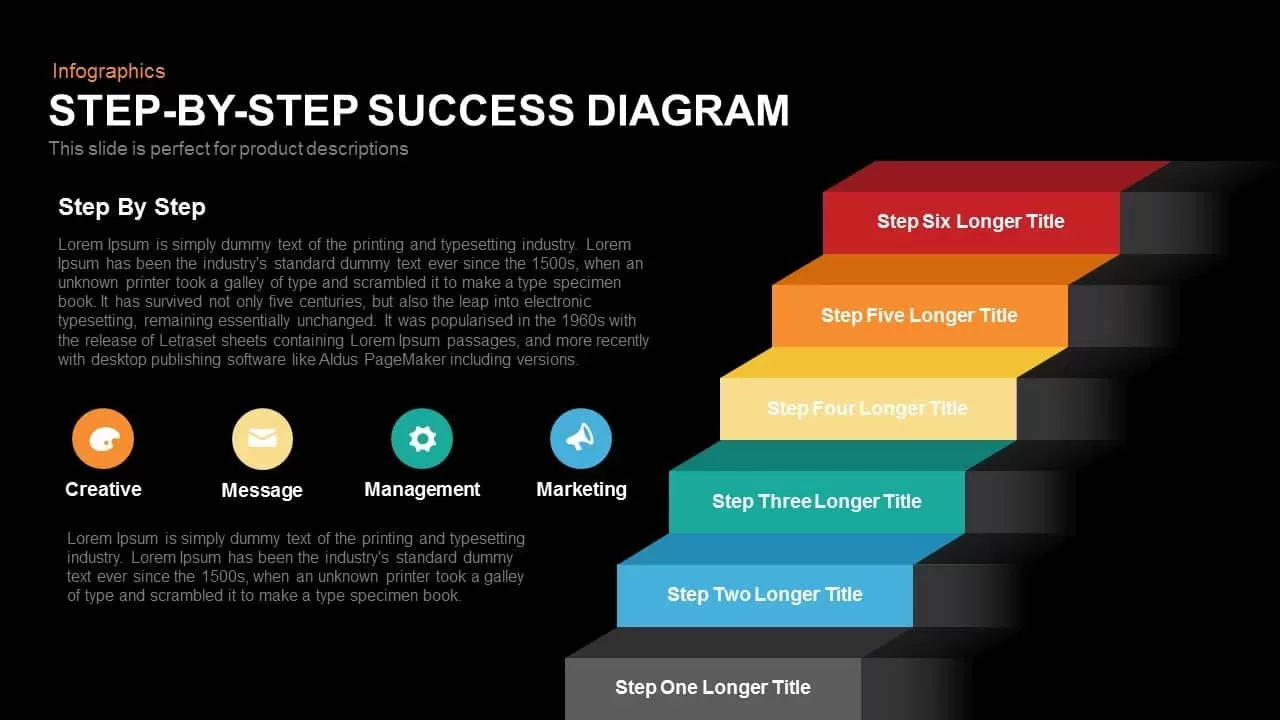
Step-by-Step Success Staircase Diagram template for PowerPoint & Google Slides
Process
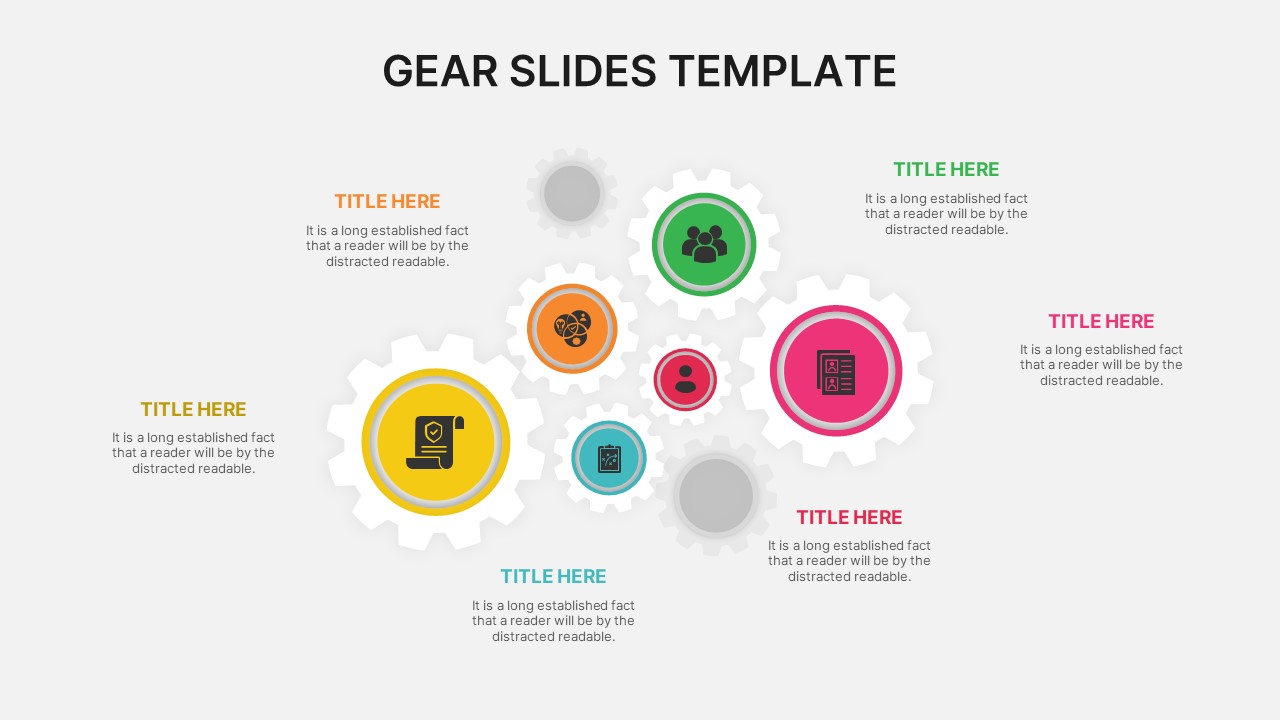
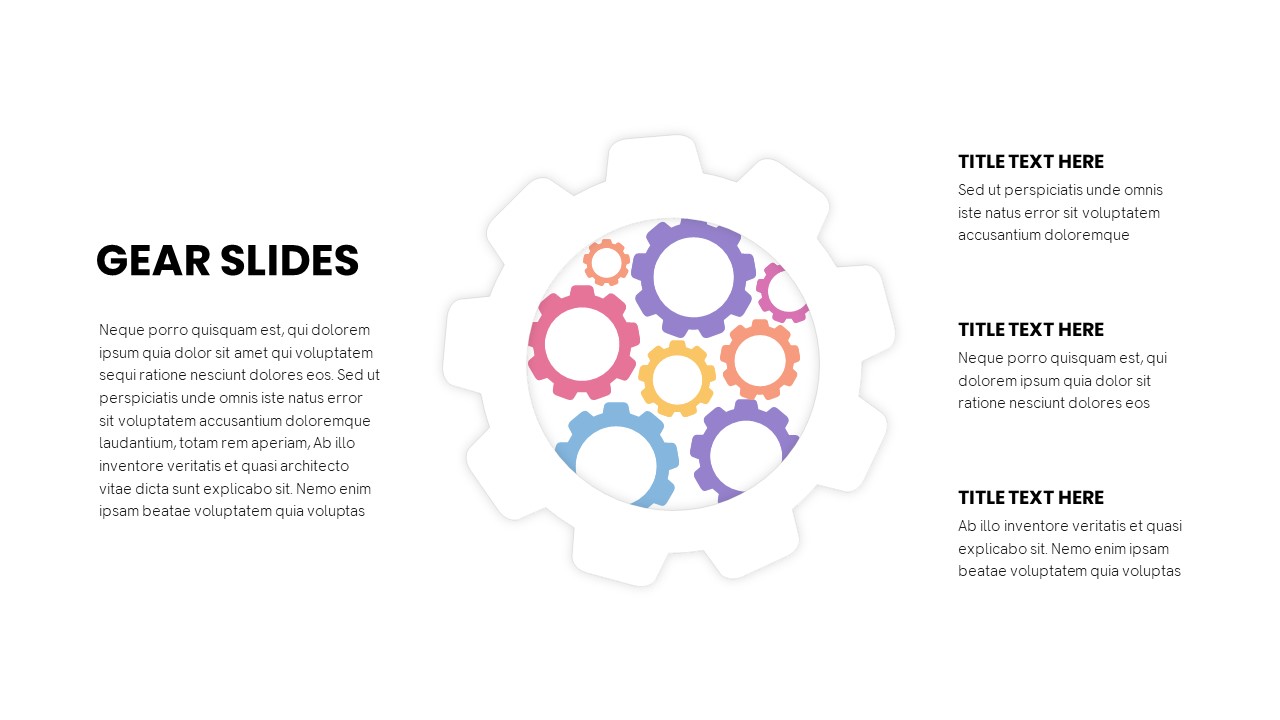
Gear Slides for PowerPoint & Google Slides
Infographics
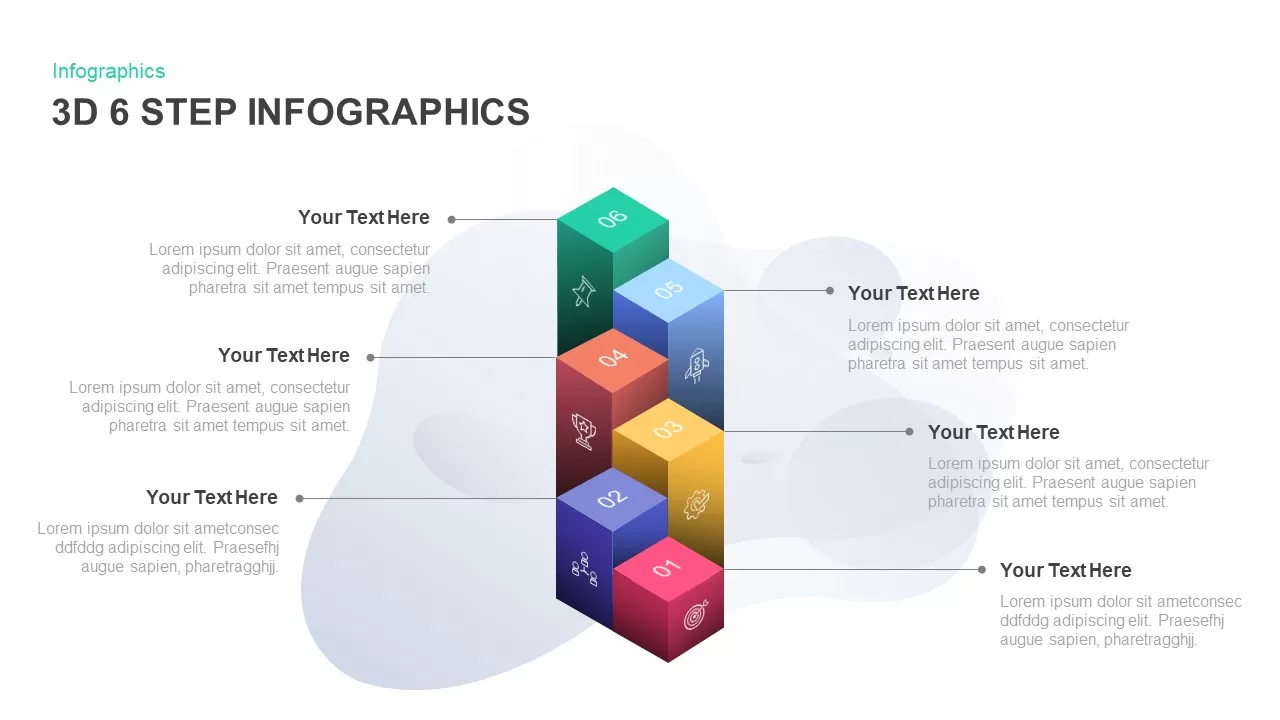
3D 6-Step Infographics Process Diagram Template for PowerPoint & Google Slides
Infographics
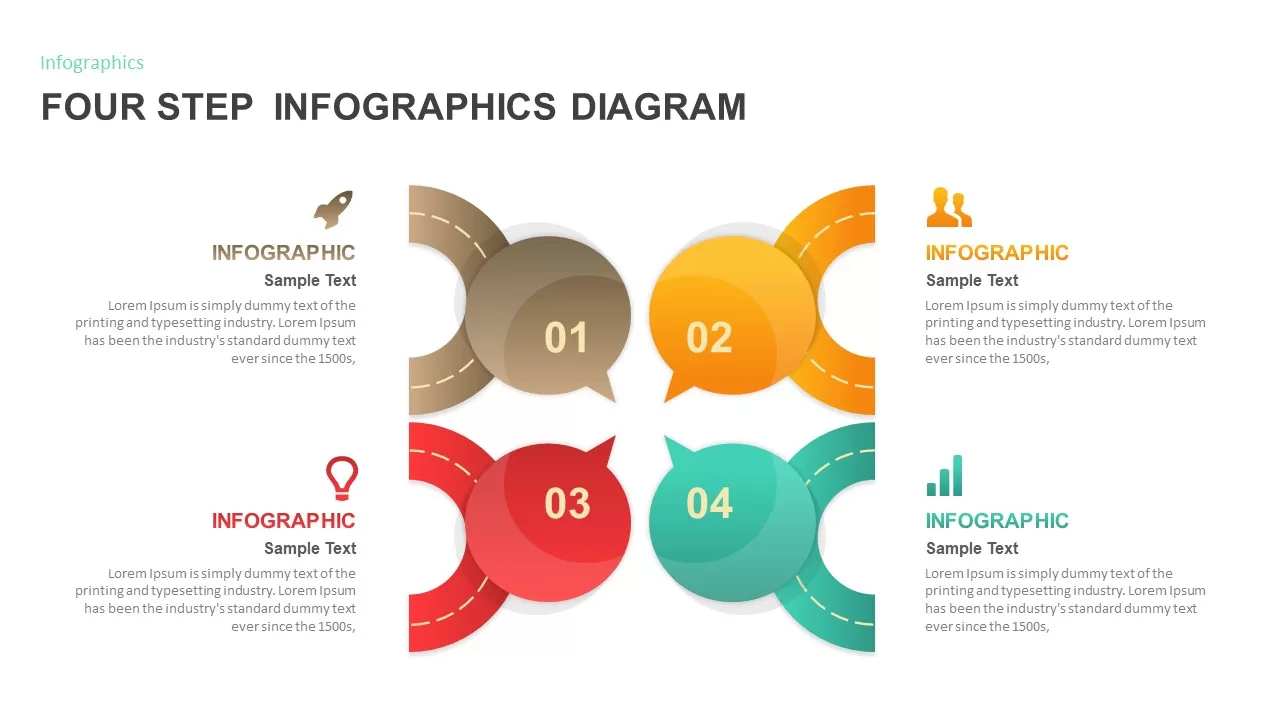
Four Step Infographics Diagram for PowerPoint & Google Slides
Process
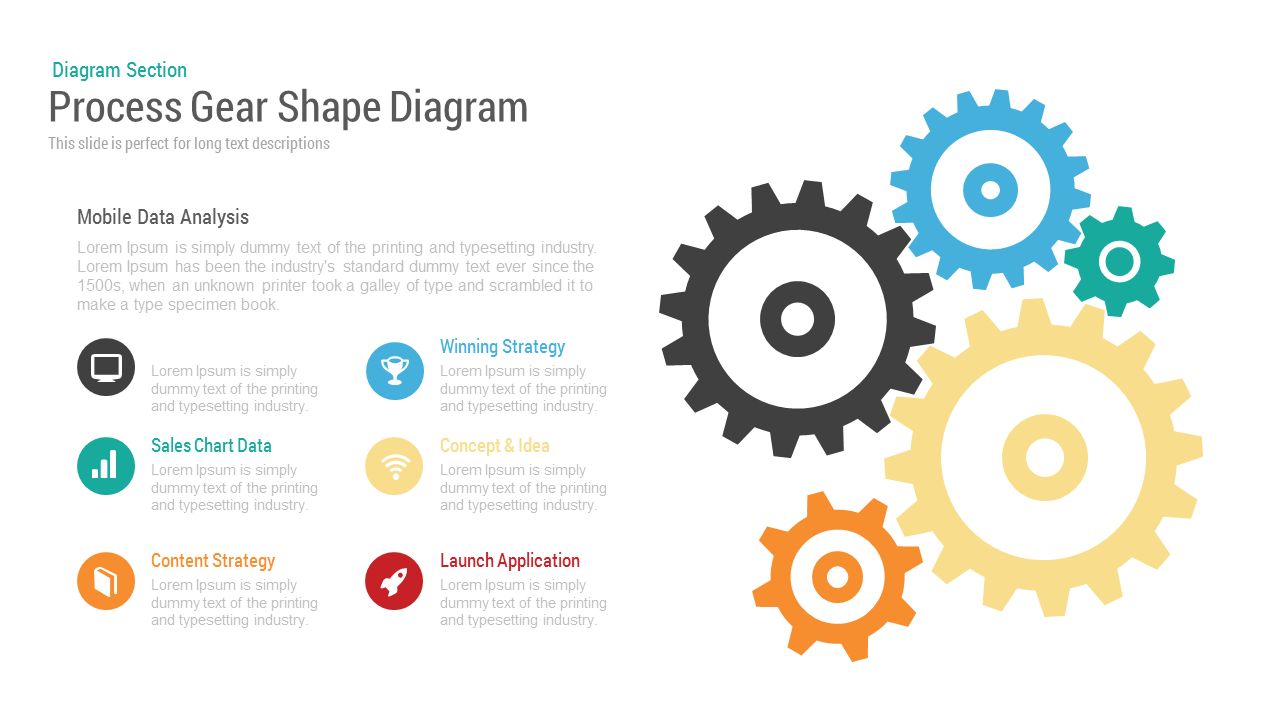
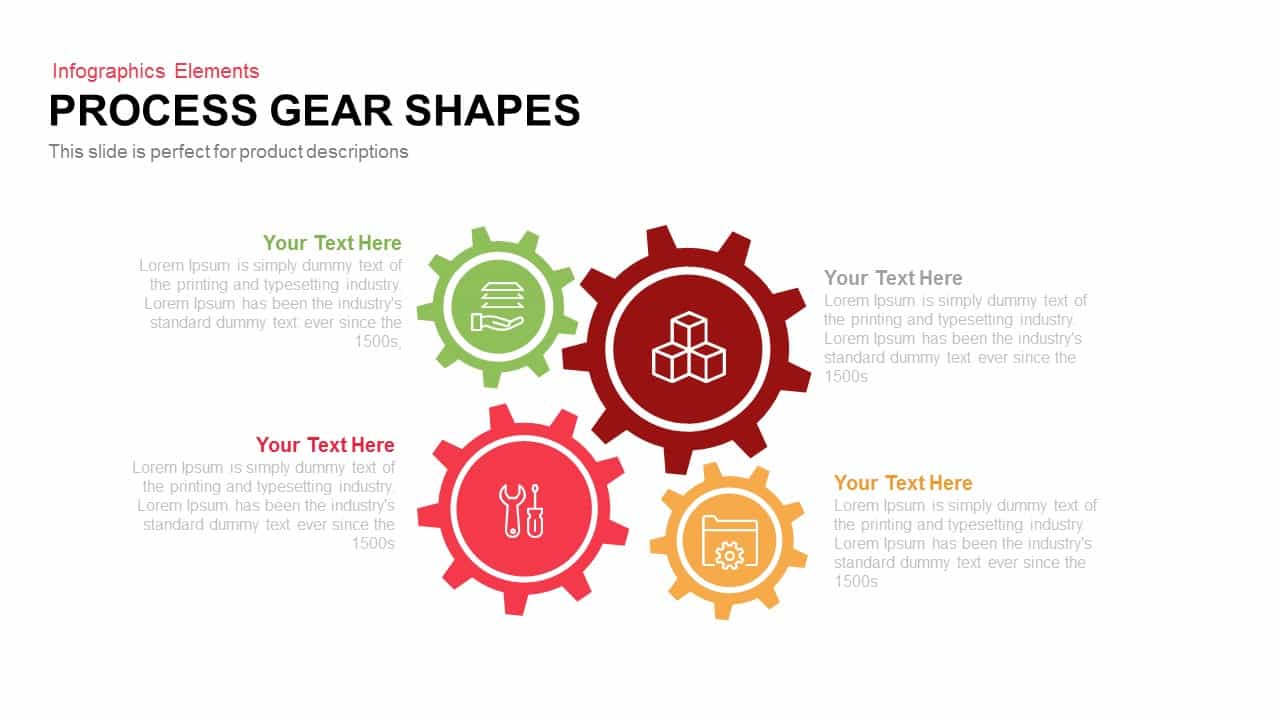
Process Gear Shapes Template for PowerPoint & Google Slides
Infographics

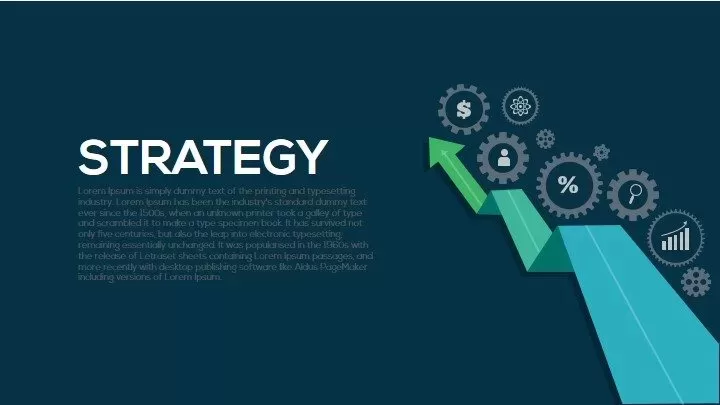
Strategy Arrow and Gear Icons Template for PowerPoint & Google Slides
Infographics
Support Services Gear Infographic Template for PowerPoint & Google Slides
Business
Corporate Mission Statement Gear Slide Template for PowerPoint & Google Slides
Vision and Mission
Three-Option Gear Infographic Pro Template for PowerPoint & Google Slides
Process
Three-Phase Planning Gear Infographic Template for PowerPoint & Google Slides
Process
Animated Gear Slide for Process Mapping Template for PowerPoint & Google Slides
Process
Animated Multi-Gear Cluster Infographic Template for PowerPoint & Google Slides
Process
Six Colorful Gear Shapes Infographic Template for PowerPoint & Google Slides
Process
Free
4-Step Circular Roadmap Infographic Template for PowerPoint & Google Slides
Roadmap
5-Step Circular Gradient Process Flow Template for PowerPoint & Google Slides
Process
Colorful 5-Step Circular Process Template for PowerPoint & Google Slides
Process
3 Step Circular Process Fidget Spinner Template for PowerPoint & Google Slides
Process
3 & 4 Step Circular Process Infographic Template for PowerPoint & Google Slides
Process
Layered Circular Four-Step Agenda Slide Layout Template for PowerPoint & Google Slides
Agenda
Free Five-Step Circular Timeline Infographic Template for PowerPoint & Google Slides
Timeline
Free
Ten Step Circular Process Infographic Template for PowerPoint & Google Slides
Process
Ten-Step Circular Process Infographic Template for PowerPoint & Google Slides
Circular
Modern 11-Step Circular Timeline Template for PowerPoint & Google Slides
Timeline
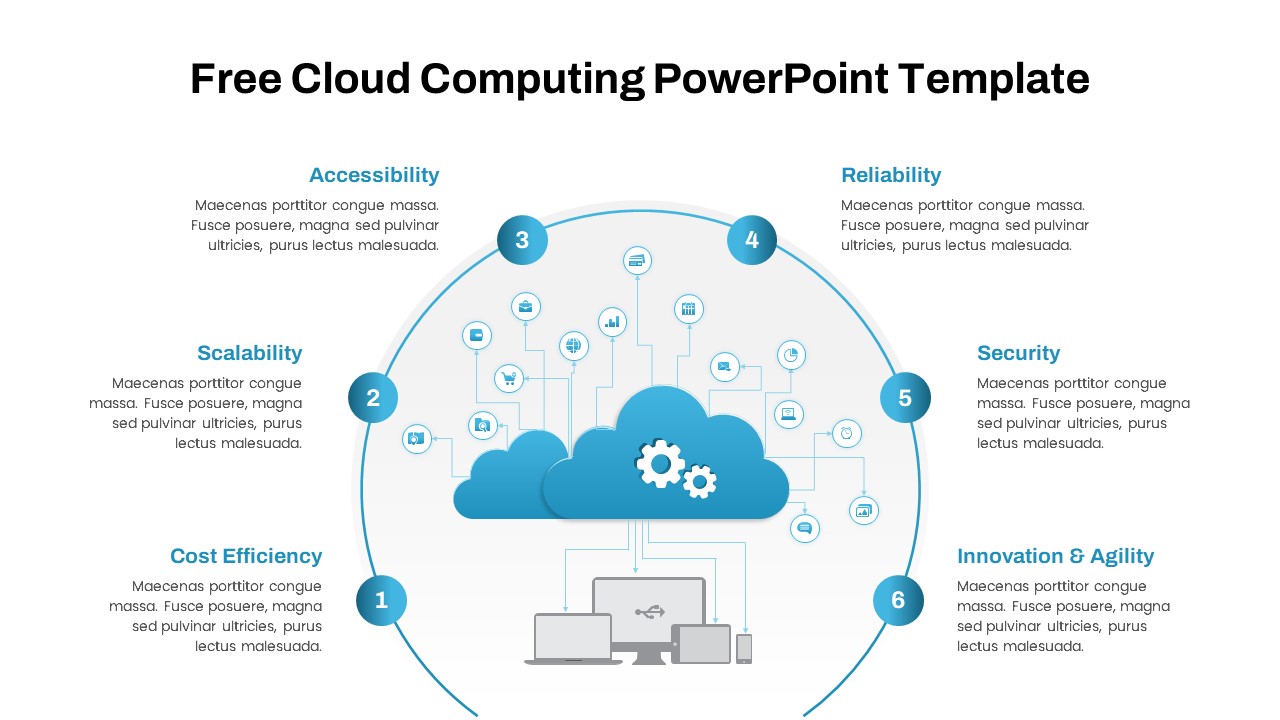
Free Cloud Computing Six-Step Circular Template for PowerPoint & Google Slides
Cloud Computing
Free
3D Arrow Infographics Circular Flow Template for PowerPoint & Google Slides
Arrow
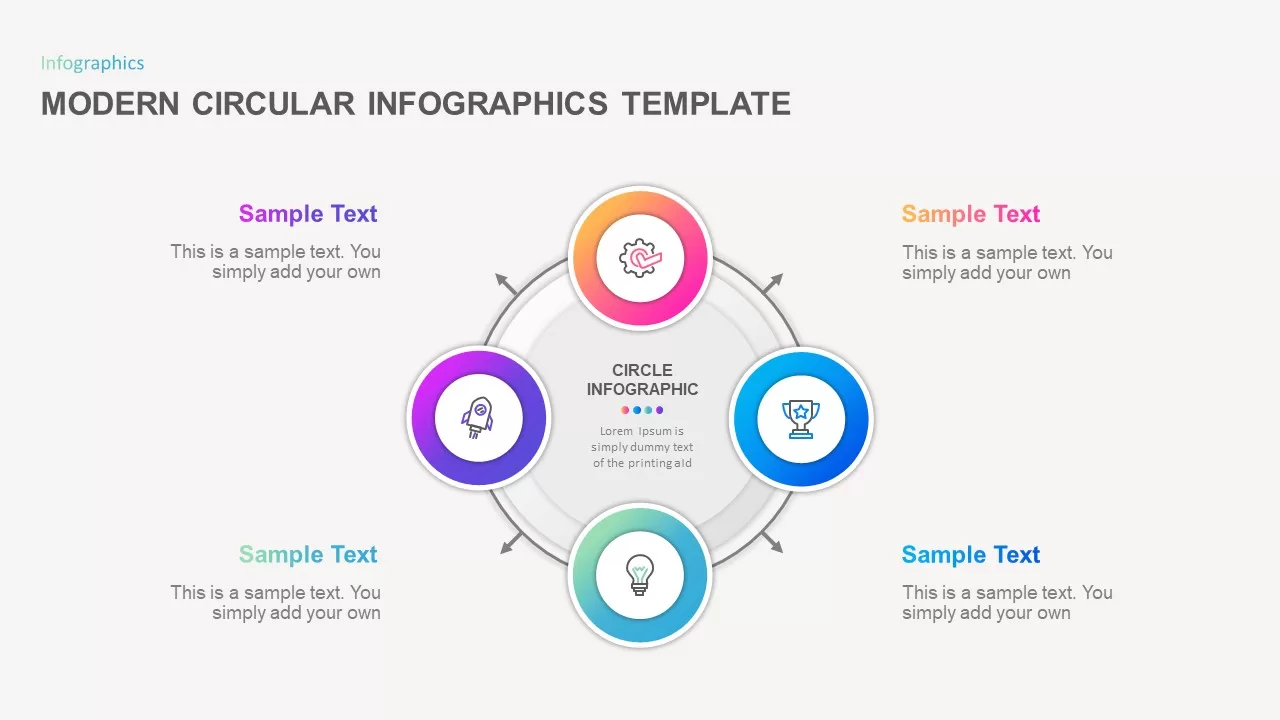
Modern Circular Infographics Template for PowerPoint & Google Slides
Circular
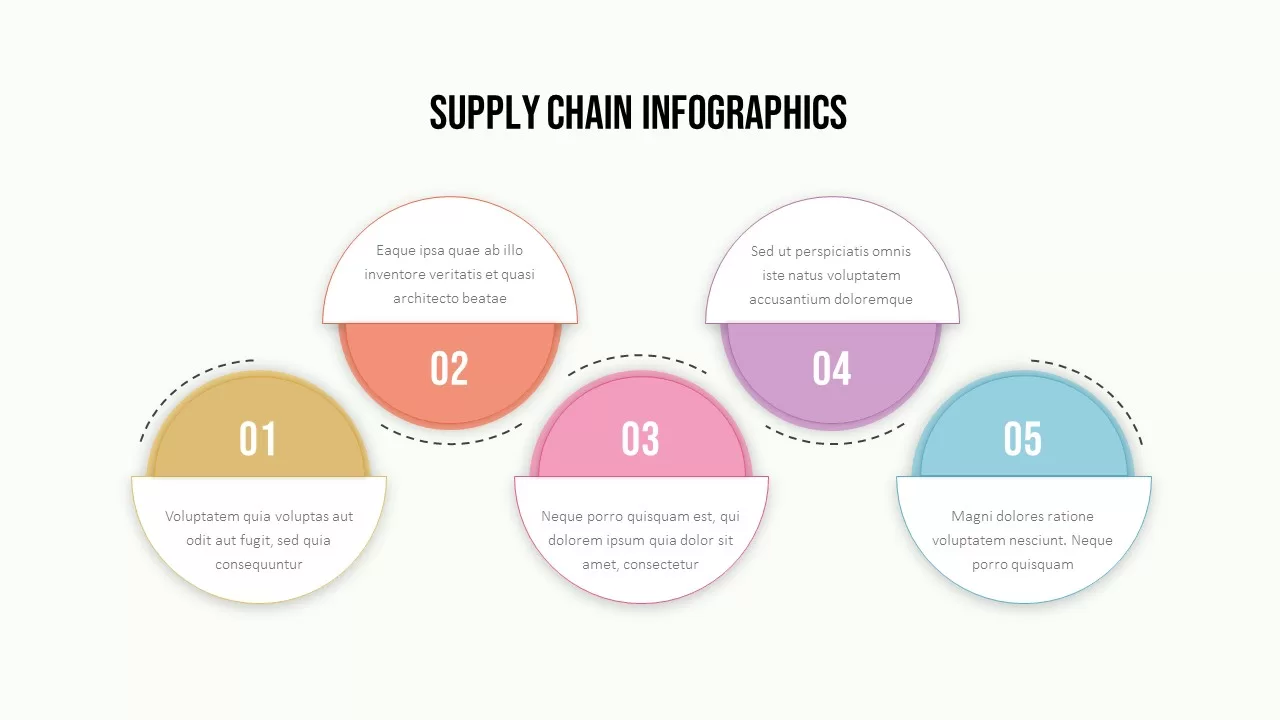
Supply Chain Circular Process Infographics Template for PowerPoint & Google Slides
Business Strategy