Free 3D Pie Chart template for PowerPoint & Google Slides


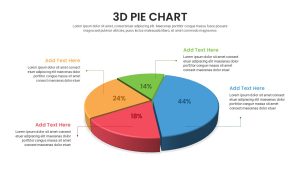
Free 3d Pie Chart PowerPoint Template
Free 3d pie chart PowerPoint template and keynote – Creating data representation is a usual task in today’s modern workplace. Viewers can easily understand the information with clear statistical tools rather than using memos, or explanative documents. Business executives and other professionals from different fields trust more and more in statistical representations because key performance indicators can be monitored in an intuitive style.
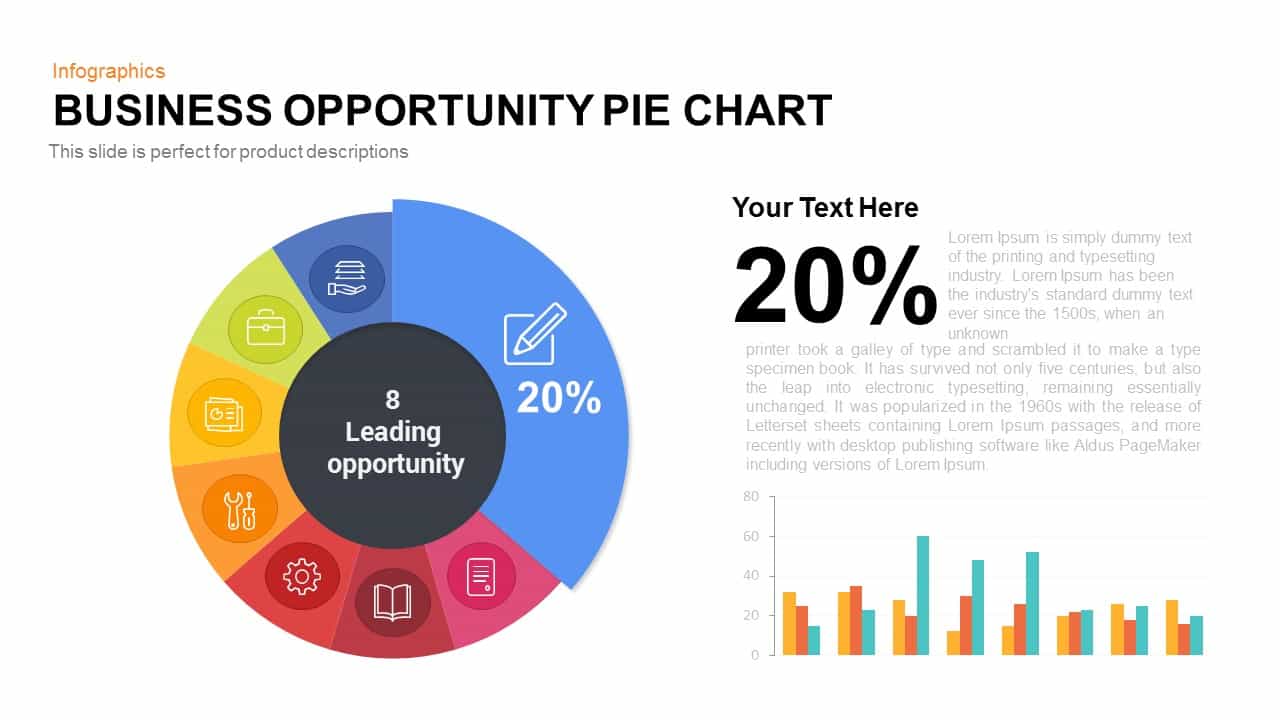
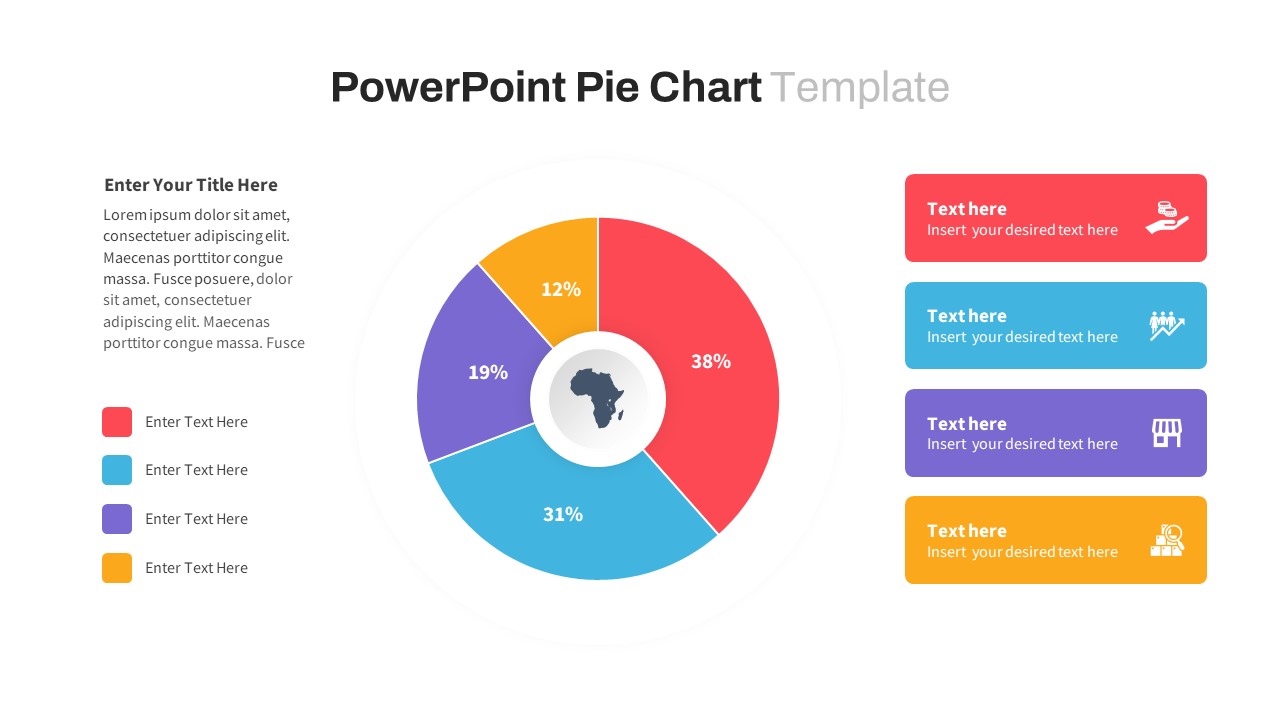
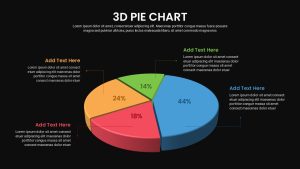
Free 3d pie chart PowerPoint template and keynote helps to show proportions and percentages between categories, by dividing a circle into proportional segments. Each arc length represents a proportion of each group, whereas the full circle represents the total sum of all the data. Pie charts are perfects for providing the viewer a quick view of the segmented distribution of the data. Analyzed values can exactly display with these four segmented pie charts. Each segment carried relatively distinguishable values. If the presenter uses to display product-wise sales, they can easily monitor which product has the maximum market possession. Here the green part shows the maximum and the light blue shows the minimum of the product market possession. A pie chart is common for all fields which depends on statistics and concrete data. Physical sciences, as well as social sciences, always use scientific and statistical methods for their inquiry, even biological sciences and behavioral sciences couldn’t avoid the possibilities of statistics. Bio-informatics and data analytics required statistics and pie charts to show verified data. So there is no field that can be exempted from the sphere of statistics and its data representation techniques. A pie chart is a graphical data representation tool that can use every field of knowledge.
Free 3d pie chart PowerPoint template and keynote slide can be used to display your data is been split according to your analytic results and reports. The user can change color codes and background without affecting the image resolution. Presenters can search our charts and data menu for a quick illustration of information.
Free 3d Pie Chart PowerPoint template and Keynote can be used to show how your data is been split according to your data the service and the analytic results of the report, The template is designed in 16: 9 aspect ratio. You can access more Free PowerPoint template & 3d shape PowerPoint templates created by Slidebazaar. Grab them now!
This 3d chart is not in editable in Excel format.
Login to download this file

Item ID
SBF00004
Related Templates

Business Opportunity Pie Chart Template for PowerPoint & Google Slides
Pie/Donut
Car Sales Market Share Pie Chart Template for PowerPoint & Google Slides
BCG
3D pie chart infographic template for PowerPoint & Google Slides
Pie/Donut
Dynamic Bar-of-Pie Chart Comparison Template for PowerPoint & Google Slides
Pie/Donut
Quarterly Comparison Pie Chart Template for PowerPoint & Google Slides
Pie/Donut
Segmented Pie Chart Infographic with Icons for PowerPoint & Google Slides
Pie/Donut

Pie Segment Diagram Four-Step Process Template for PowerPoint & Google Slides
Pie/Donut
Gear Pie Diagram Data Visualization Template for PowerPoint & Google Slides
Pie/Donut
Social Media Market Share Pie Charts Template for PowerPoint & Google Slides
Pie/Donut
Project Progress Dashboard Pie Charts Template for PowerPoint & Google Slides
Project
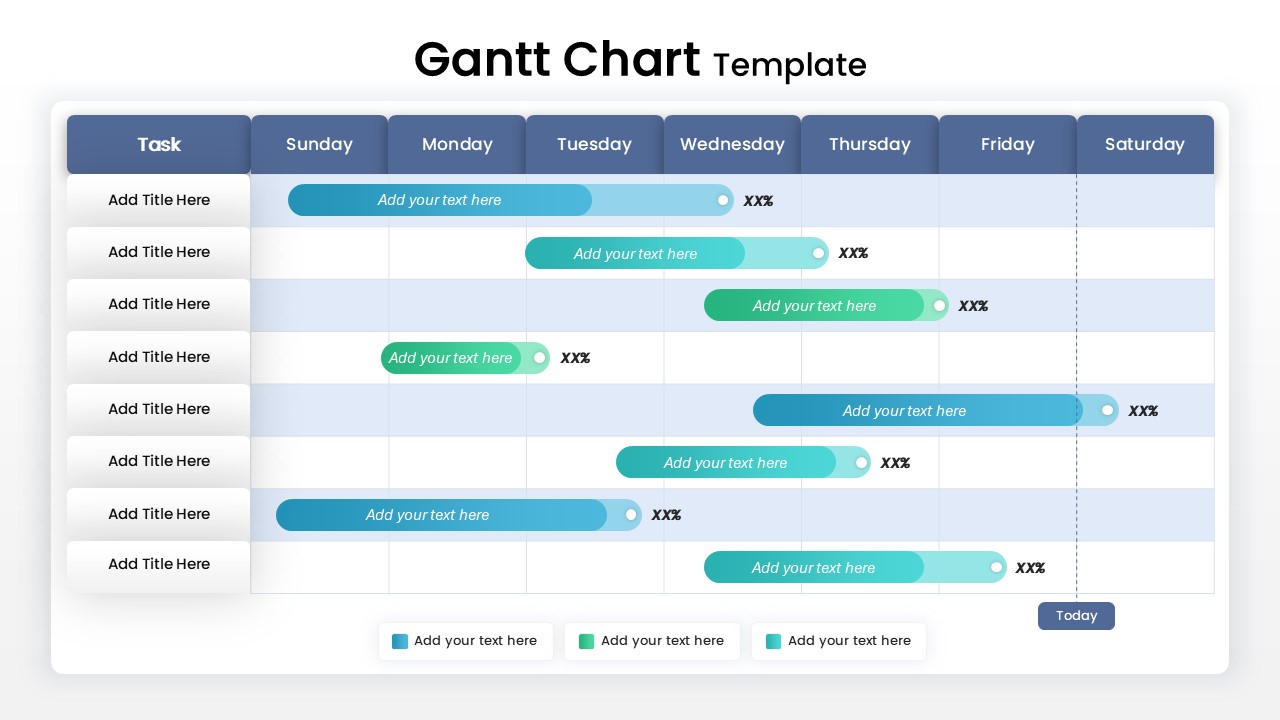
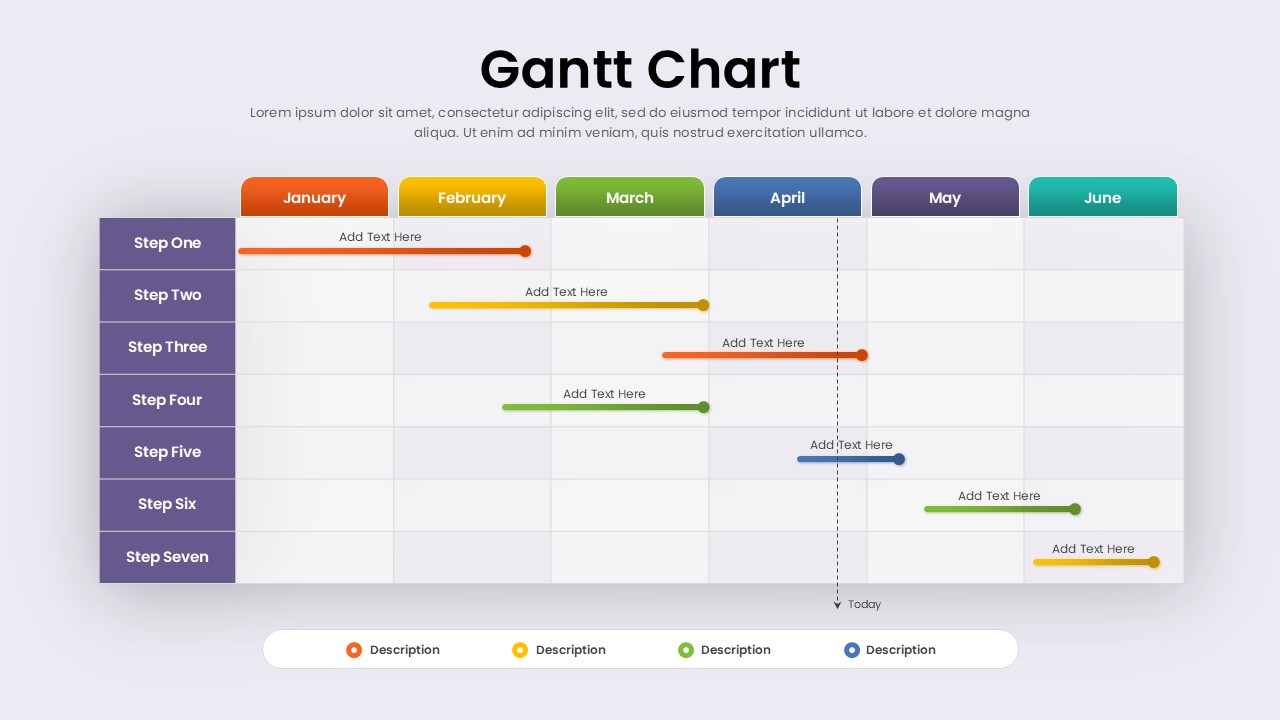
Free Professional Gantt Chart Pack – 4 Slides Template for PowerPoint & Google Slides
Gantt Chart
Free
Free Circular Multi-Step Flow Chart Diagram Template for PowerPoint & Google Slides
Flow Charts
Free
Free Curved Arrow Progress Chart template for PowerPoint & Google Slides
Project
Free
Free Stacked Column Chart Data Visualization Template for PowerPoint & Google Slides
Bar/Column
Free
Free Editable Simple Column Chart Slide Template for PowerPoint & Google Slides
Bar/Column
Free
Free Learning Retention Pyramid Chart Template for PowerPoint & Google Slides
Pyramid
Free
Free Versatile Product Comparison Chart Template for PowerPoint & Google Slides
Charts
Free
Free Corporate Hierarchy Organizational Chart Template for PowerPoint & Google Slides
Org Chart
Free
Free Organizational Chart for PowerPoint & Google Slides
Business
Free
Quad Chart Infographic Pack of 8 Slides Template for PowerPoint & Google Slides
Comparison Chart
Circle Strategy Creative Chart template for PowerPoint & Google Slides
Business Strategy
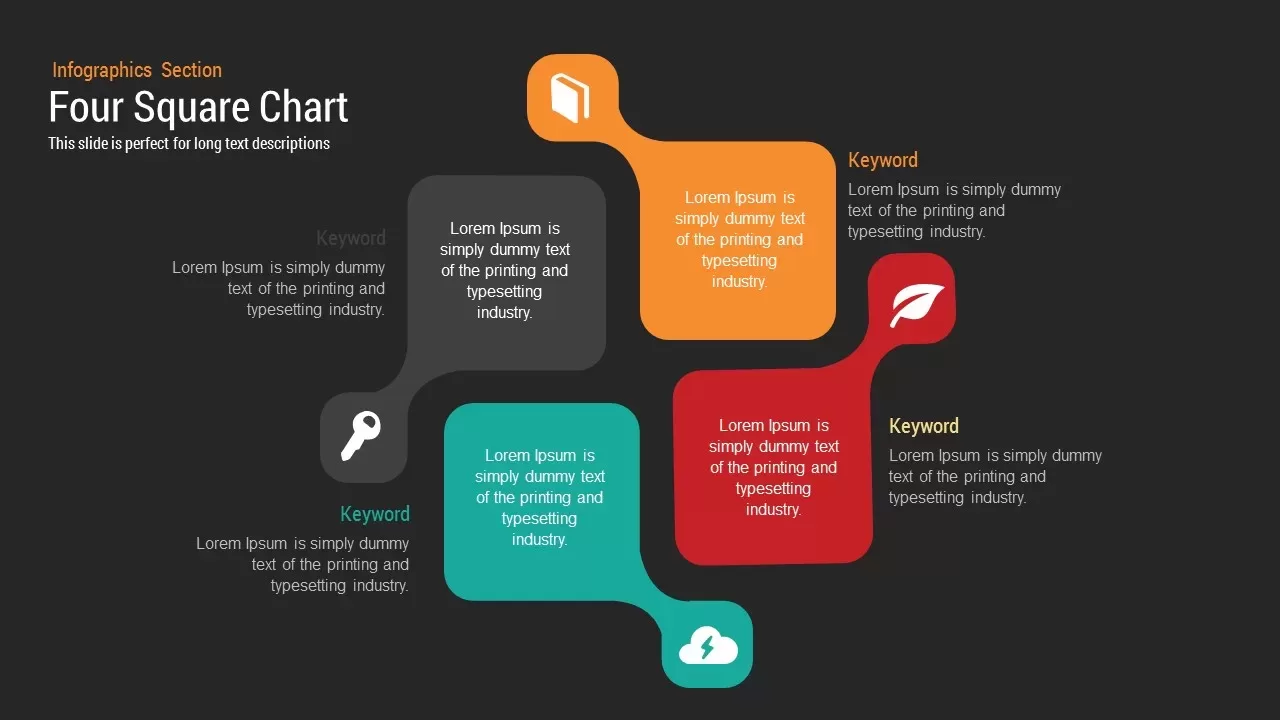
Four Square Chart template for PowerPoint & Google Slides
Charts
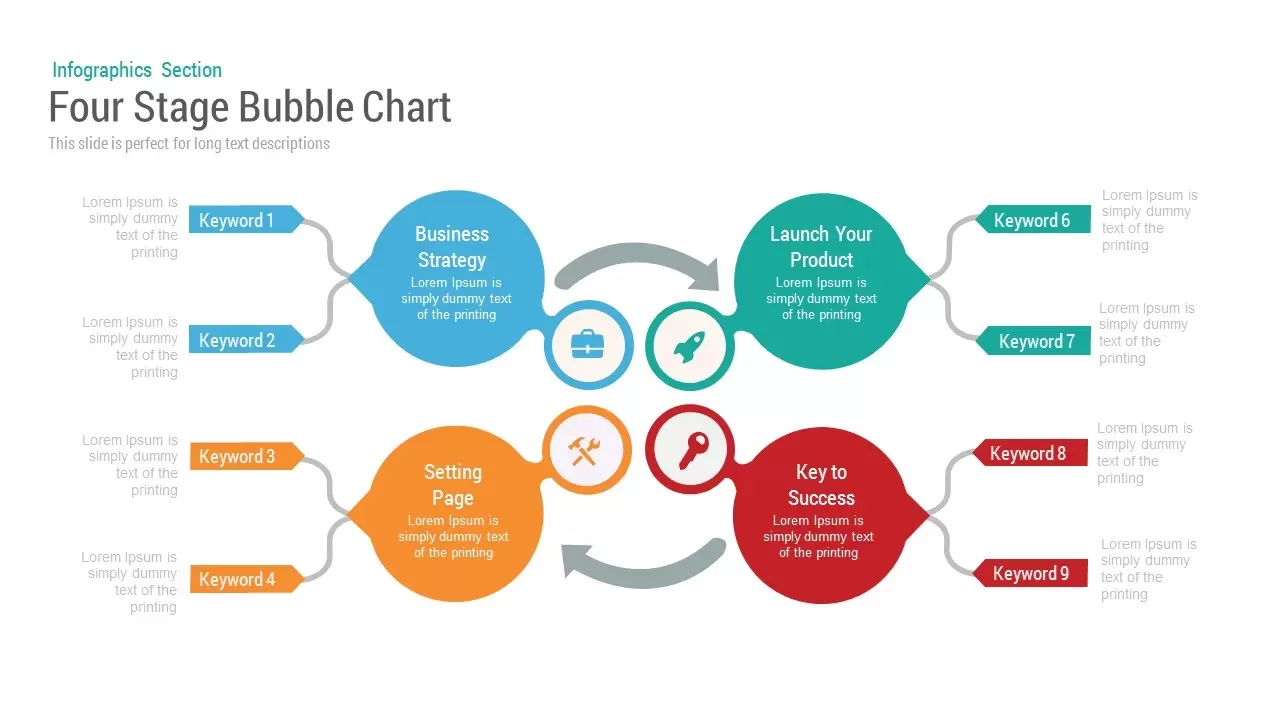
Bubble Chart template for PowerPoint & Google Slides
Charts
Creative SWOT Chart template for PowerPoint & Google Slides
SWOT

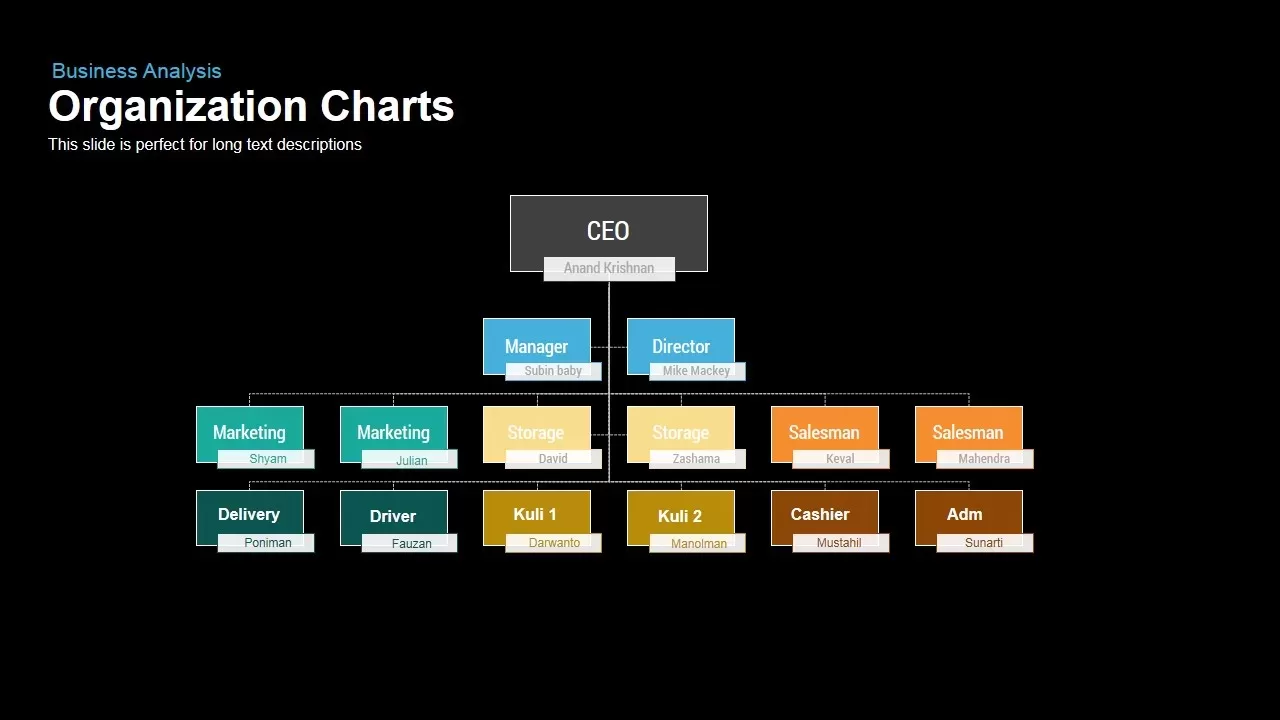
Corporate Organization Chart template for PowerPoint & Google Slides
Org Chart
Donut Chart template for PowerPoint & Google Slides
Pie/Donut
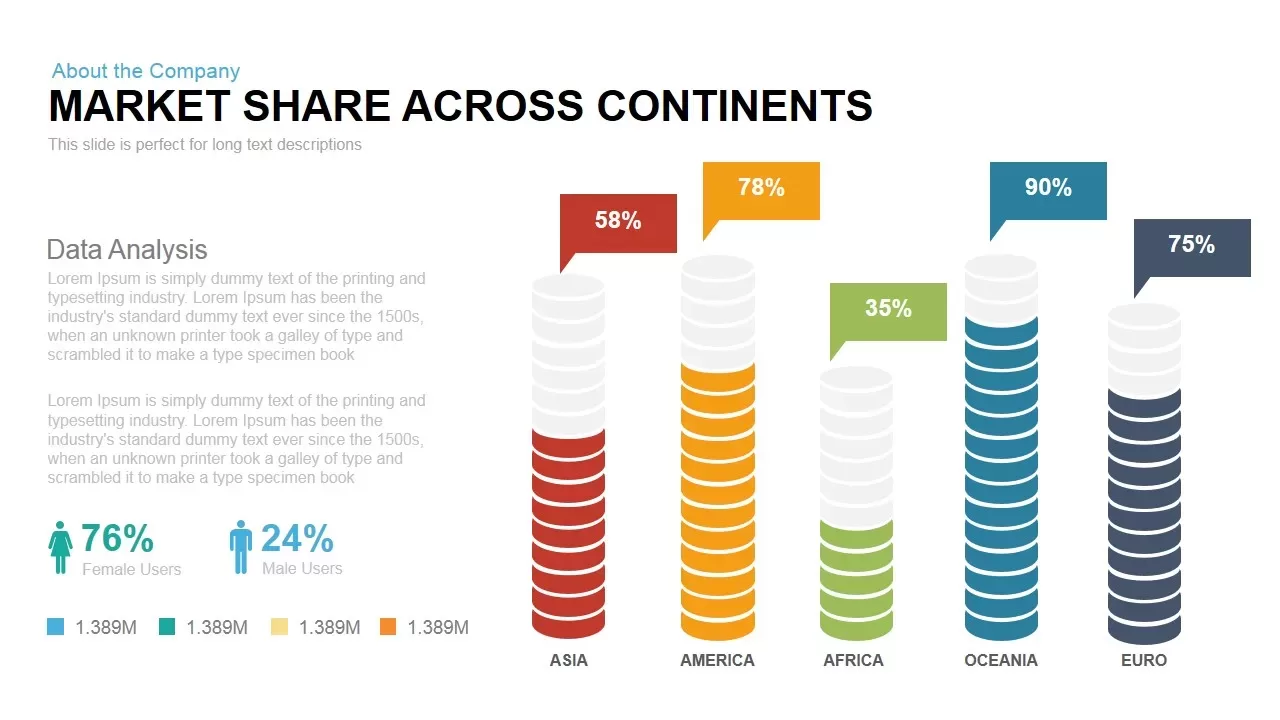
Global Market Share Cylinder Chart Template for PowerPoint & Google Slides
Bar/Column
Business Organization Chart Hierarchy Template for PowerPoint & Google Slides
Org Chart
Creative Dynamic Gantt Chart Timeline Template for PowerPoint & Google Slides
Timeline
Simple Organizational Chart Infographic Template for PowerPoint & Google Slides
Org Chart
Organizational Chart Template for PowerPoint & Google Slides
Org Chart
Pencil Bar Chart Data Analysis Template for PowerPoint & Google Slides
Bar/Column
Creative Organization Chart Diagram Template for PowerPoint & Google Slides
Org Chart
Corporate Org Chart template for PowerPoint & Google Slides
Org Chart

Fully Editable Gantt Chart Timeline template for PowerPoint & Google Slides
Gantt Chart
Modern Ten-Block Section Title Chart template for PowerPoint & Google Slides
Comparison

Product Usage Analytics Dashboard Chart Template for PowerPoint & Google Slides
Bar/Column
Five-Stage People Infographic Chart template for PowerPoint & Google Slides
Process
Sales vs Budget Performance Chart Template for PowerPoint & Google Slides
Bar/Column
Interactive Product Comparison Bar Chart Template for PowerPoint & Google Slides
Bar/Column
Organization Chart Overview template for PowerPoint & Google Slides
Org Chart
Organizational Chart Structure template for PowerPoint & Google Slides
Org Chart

Application Revenue Line Chart KPI Template for PowerPoint & Google Slides
Revenue
Organization Department Hexagon Chart Template for PowerPoint & Google Slides
Org Chart
Corporate Organizational Chart Hierarchy Template for PowerPoint & Google Slides
Org Chart
For and Against Vote Count Bar Chart Template for PowerPoint & Google Slides
Bar/Column
Entertainment Industry Revenue Bar Chart Template for PowerPoint & Google Slides
Bar/Column
Employee Personality Distribution Chart Template for PowerPoint & Google Slides
Bar/Column
Capital Structure Dynamic Split Chart Template for PowerPoint & Google Slides
Comparison Chart
Business Growth Metaphor Chart Template for PowerPoint & Google Slides
Business
PERT Chart Project Management template for PowerPoint & Google Slides
Project Status
Professional Organizational Chart Diagram Template for PowerPoint & Google Slides
Org Chart
Flow Chart Template for PowerPoint & Google Slides
Flow Charts
Flow Chart template for PowerPoint & Google Slides
Flow Charts
Project Gantt Chart Template for PowerPoint & Google Slides
Gantt Chart
Cost Reduction Strategy Donut Chart Template for PowerPoint & Google Slides
Pie/Donut
Statistics Infographic & KPI Bar Chart Template for PowerPoint & Google Slides
Bar/Column
Colorful Functional Organization Chart Template for PowerPoint & Google Slides
Org Chart
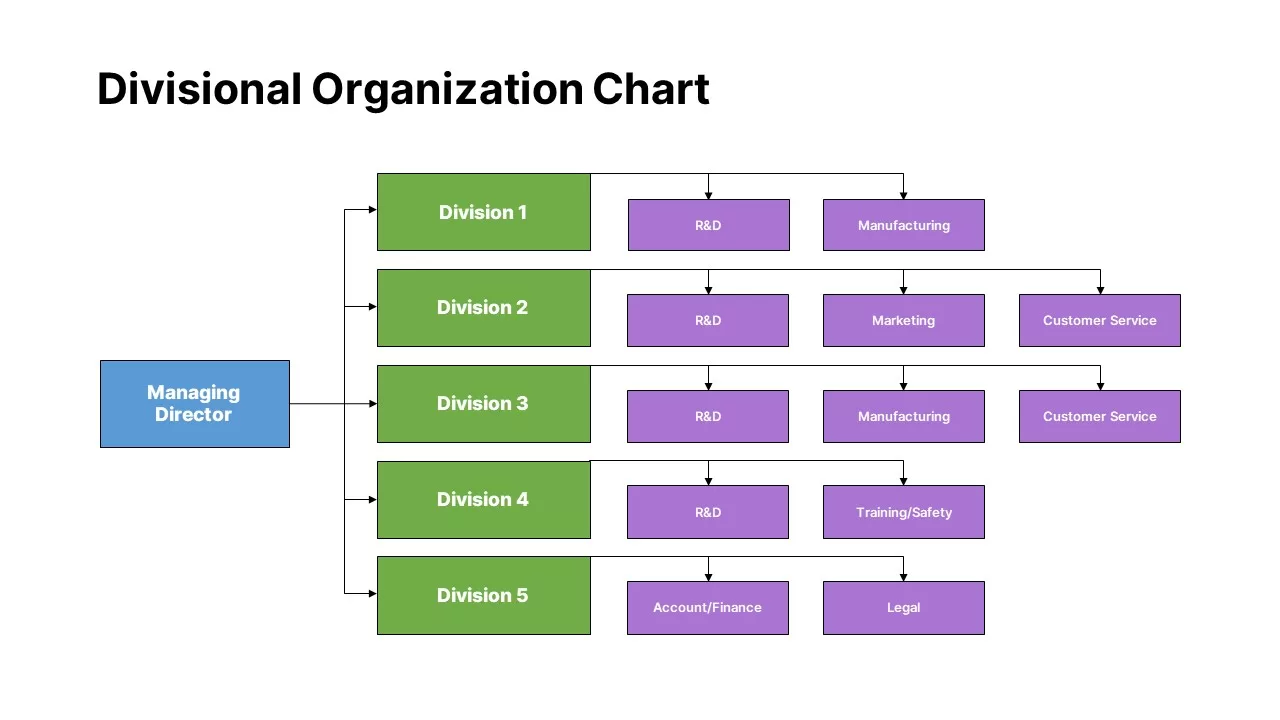
Divisional Organization Chart Template for PowerPoint & Google Slides
Org Chart
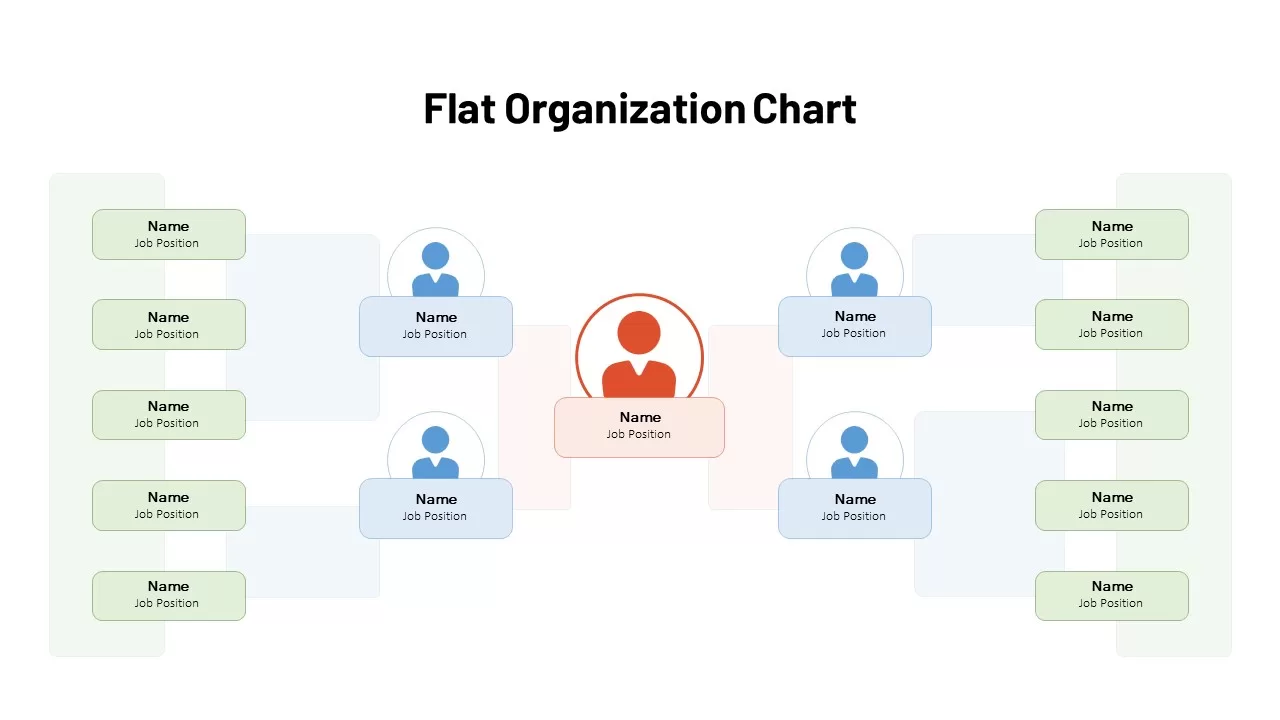
Flat Organization Chart Diagram Template for PowerPoint & Google Slides
Org Chart
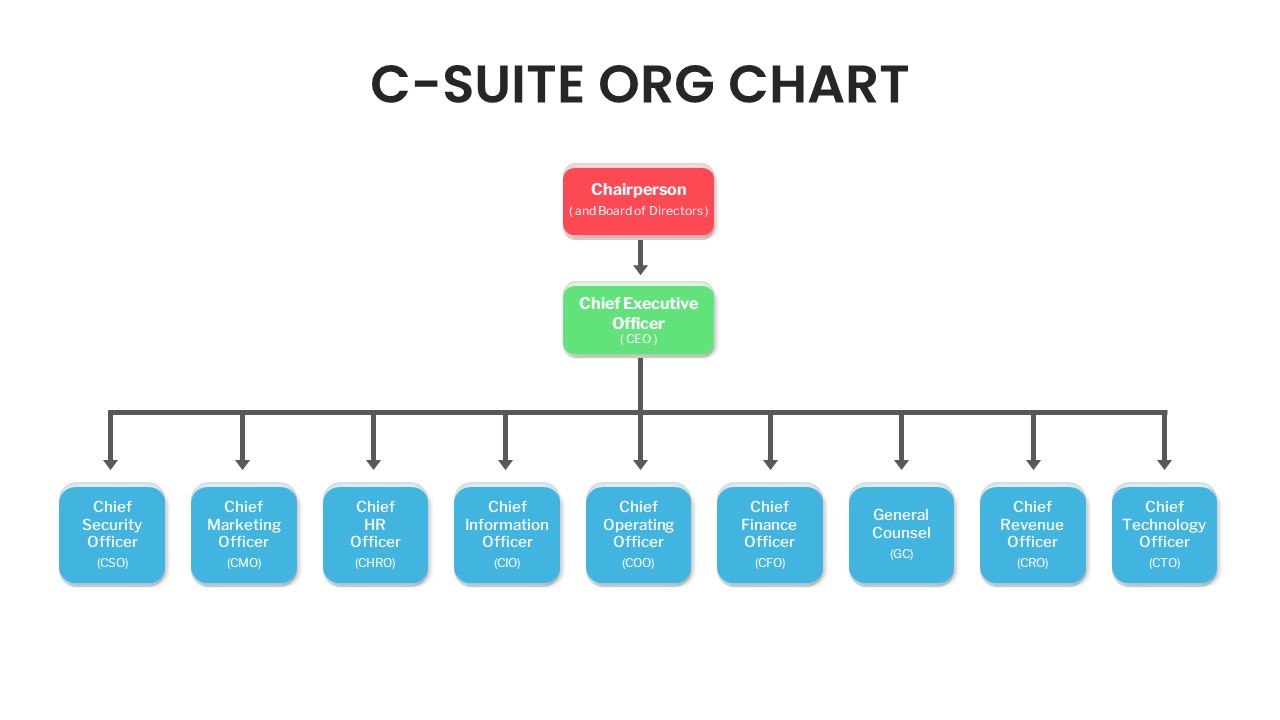
C-Suite Executive Org Chart Diagram Template for PowerPoint & Google Slides
Org Chart
Editable Multi-Series Peak Line Chart Template for PowerPoint & Google Slides
Comparison Chart
Professional 100% Stacked Column Chart Template for PowerPoint & Google Slides
Bar/Column
Professional Quad Chart Layout Template for PowerPoint & Google Slides
Pie/Donut
Business Timeline Comparison Bar Chart Template for PowerPoint & Google Slides
Comparison Chart
Grouped Column Chart Comparison Template for PowerPoint & Google Slides
Bar/Column
Multiple Line Chart Comparison Template for PowerPoint & Google Slides
Comparison Chart
Five-Phase and Three-Phase Phases Chart Template for PowerPoint & Google Slides
Charts
Excel-Driven Gradient Timeline Chart Template for PowerPoint & Google Slides
Multi-Series Line Chart with Icons Template for PowerPoint & Google Slides
Comparison Chart
Multi-Series Vertical Dot Chart Template for PowerPoint & Google Slides
Comparison Chart
Year-over-Year Stacked Gender Bar Chart Template for PowerPoint & Google Slides
Bar/Column
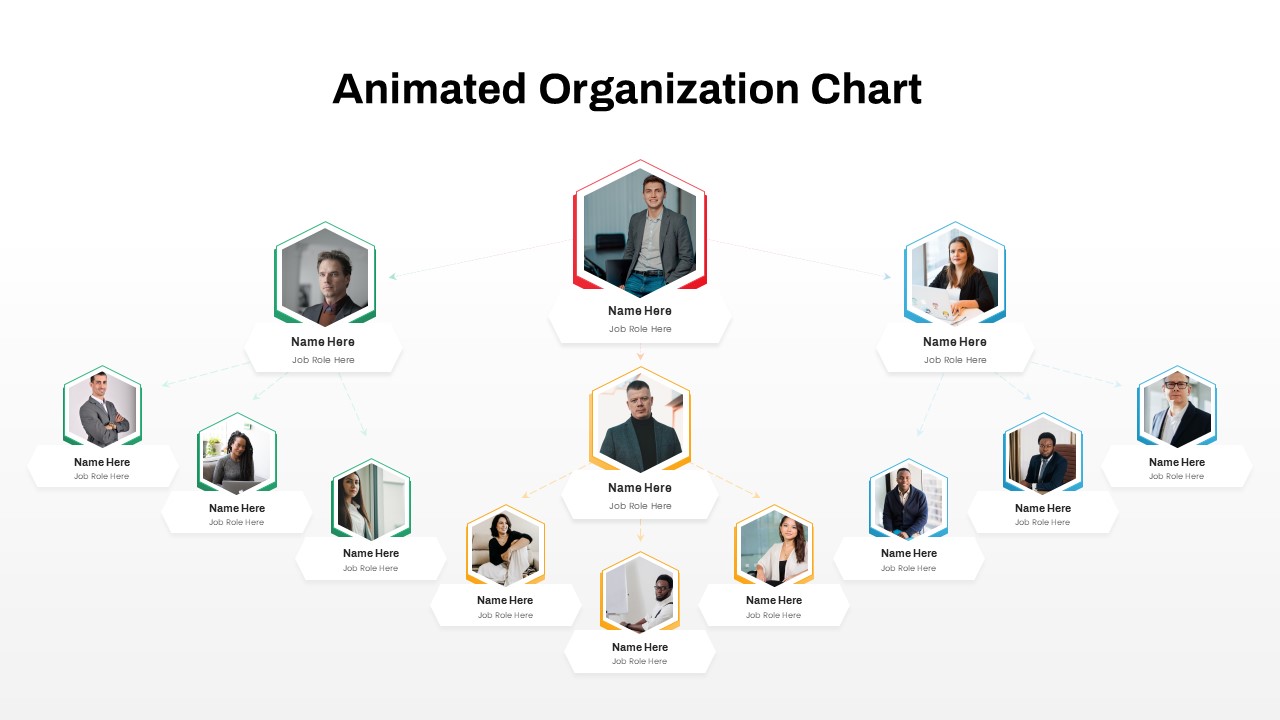
Animated Hexagon Org Chart Diagram Template for PowerPoint & Google Slides
Org Chart
Multi-Style Clock Chart Diagram Template for PowerPoint & Google Slides
Circular
Multipurpose Spline Chart Data Trend Template for PowerPoint & Google Slides
Bar/Column
Professional HR Organization Chart Template for PowerPoint & Google Slides
Org Chart
Wastewater Treatment Process Flow Chart Template for PowerPoint & Google Slides
Flow Charts
Multi-Level Wheel Chart Diagram template for PowerPoint & Google Slides
Pie/Donut
Multi-Level Colorful Pyramid Chart Template for PowerPoint & Google Slides
Pyramid
Flip Chart Four-Step List Layout Template for PowerPoint & Google Slides
Process
Bubble Chart Scatter, Diagram & Matrix Template for PowerPoint & Google Slides
Comparison Chart
Quarterly Gross Profit Rate Chart Template for PowerPoint & Google Slides
Revenue
Annual Growth Trend Analysis Chart template for PowerPoint & Google Slides
Business Report
Quarterly Revenue Comparison Bar Chart Template for PowerPoint & Google Slides
Bar/Column
Quarterly Sales Review Bar Chart Template for PowerPoint & Google Slides
Bar/Column
Professional Table of Organization Chart Template for PowerPoint & Google Slides
Org Chart
Competitor Comparison Chart Design Template for PowerPoint & Google Slides
Comparison
Two-Option Bar Chart Comparison Table Template for PowerPoint & Google Slides
Comparison
Event Planning Gantt Chart template for PowerPoint & Google Slides
Business
Feasibility Matrix Comparison Chart Template for PowerPoint & Google Slides
Comparison Chart
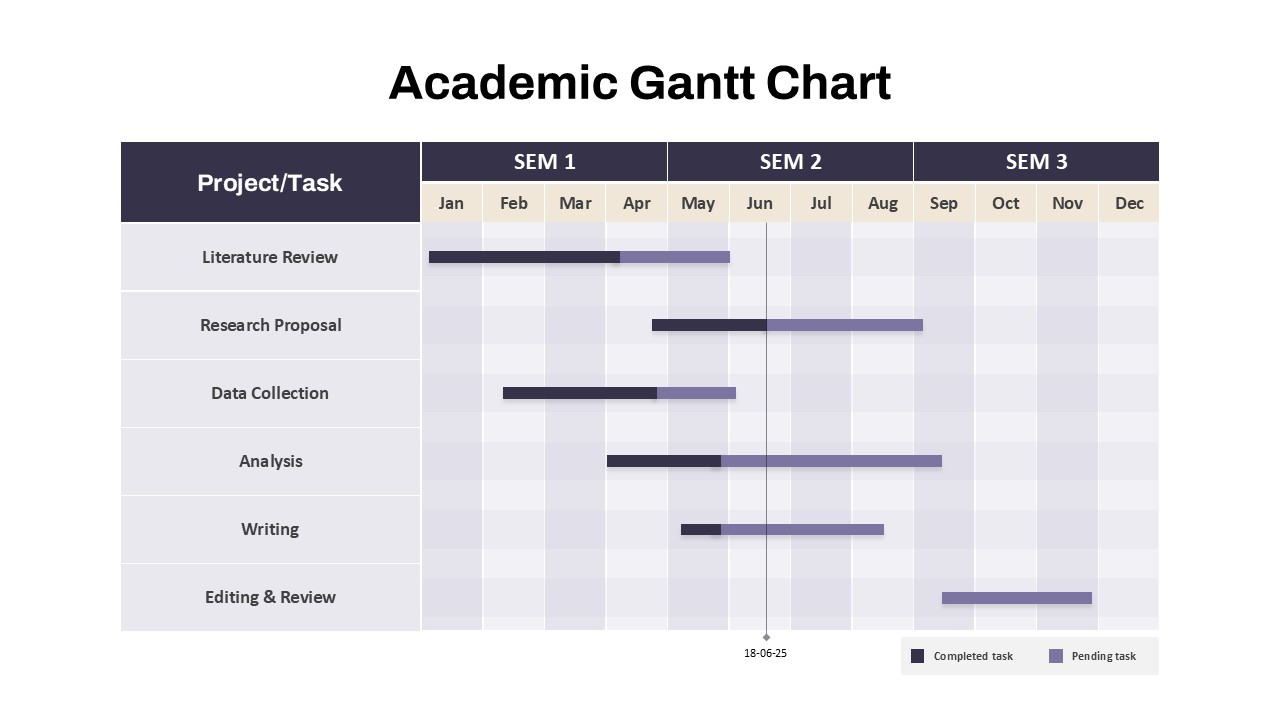
Academic Gantt Chart template for PowerPoint & Google Slides
Business
Bar Gantt Chart Template for PowerPoint & Google Slides
Gantt Chart
Hierarchical Org Chart Infographic Template for PowerPoint & Google Slides
Org Chart
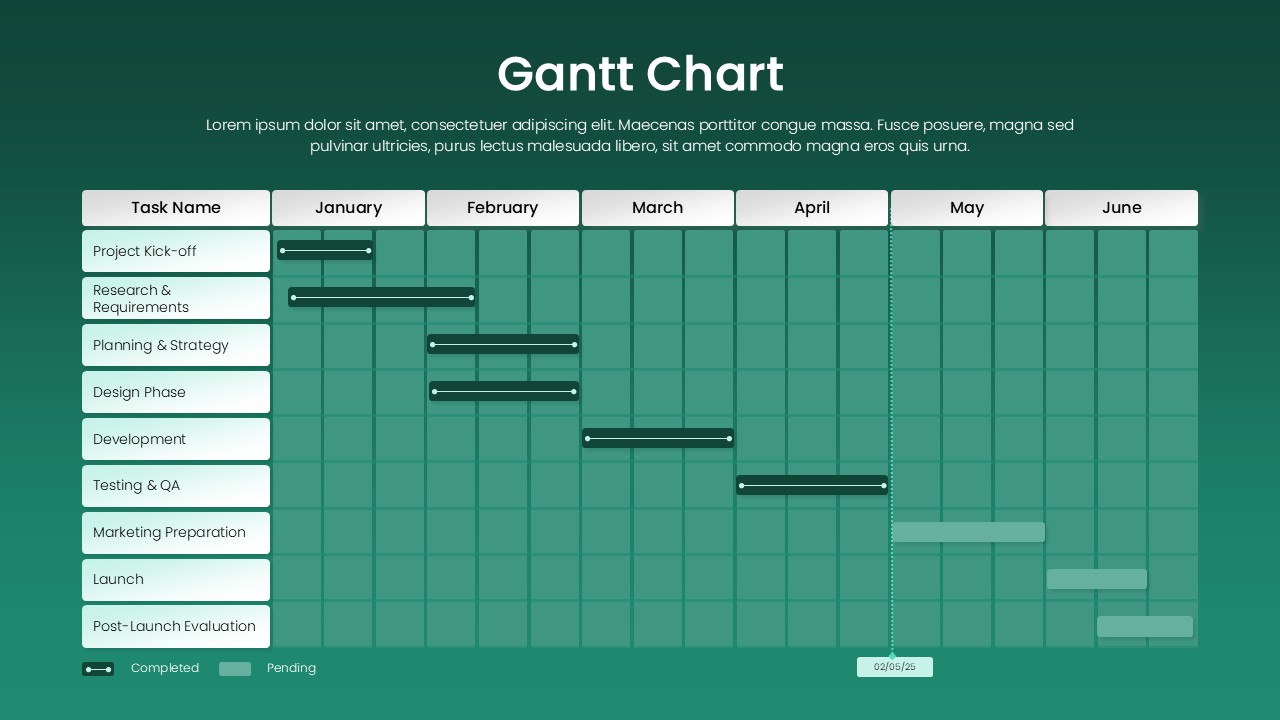
Green Gantt Chart Template for PowerPoint & Google Slides
Gantt Chart
Colorful Annual Gantt Chart Project Planner Template for PowerPoint & Google Slides
Gantt Chart
Weekly Gantt Chart with Milestones Template for PowerPoint & Google Slides
Gantt Chart
7 Step 6 Month Gantt Chart Timeline Template for PowerPoint & Google Slides
Gantt Chart
Three Segment Donut Chart KPI Infographic Template for PowerPoint & Google Slides
Pie/Donut

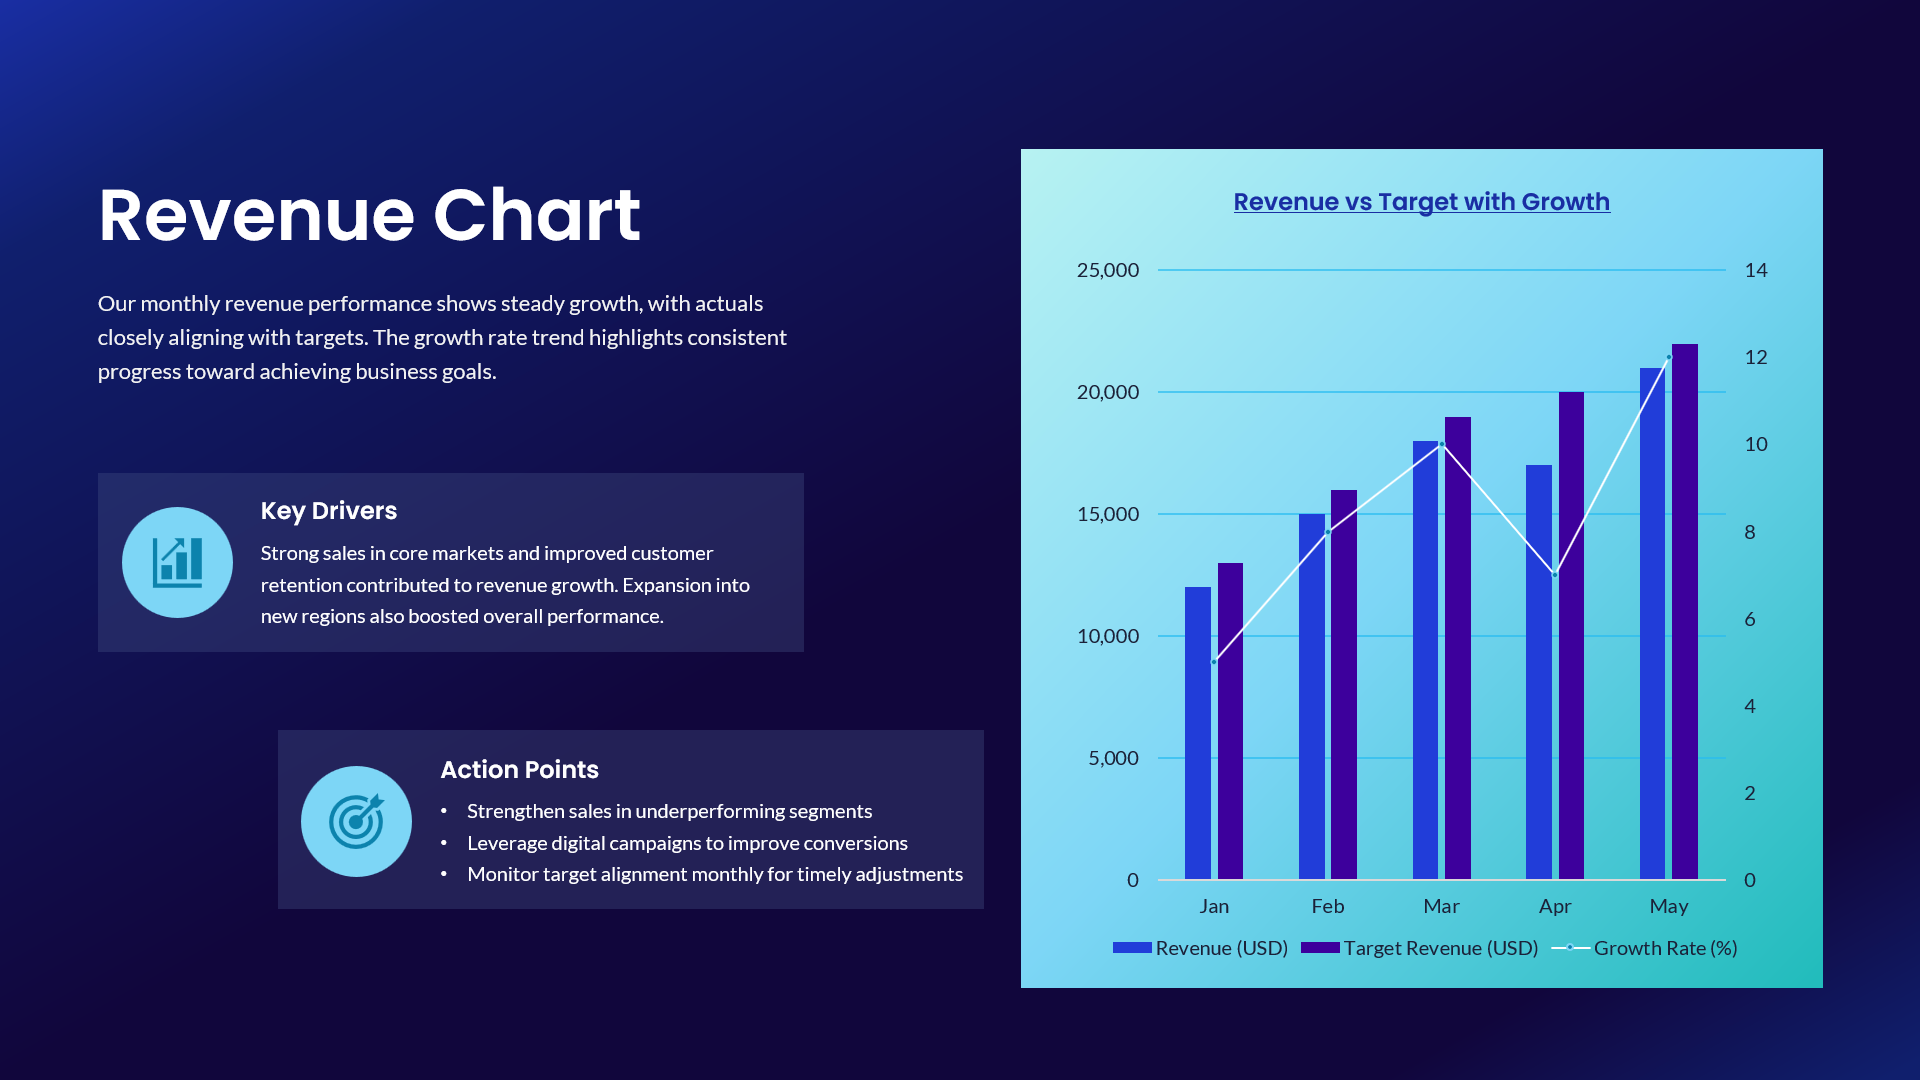
Revenue vs Target Growth Chart Template for PowerPoint & Google Slides
Revenue
Blank Comparison Chart Template for PowerPoint & Google Slides
Comparison Chart