Triangle Cycle PowerPoint Template
Triangle Cycle PowerPoint Template: Enhance Your Presentations with Visual Clarity and Impact
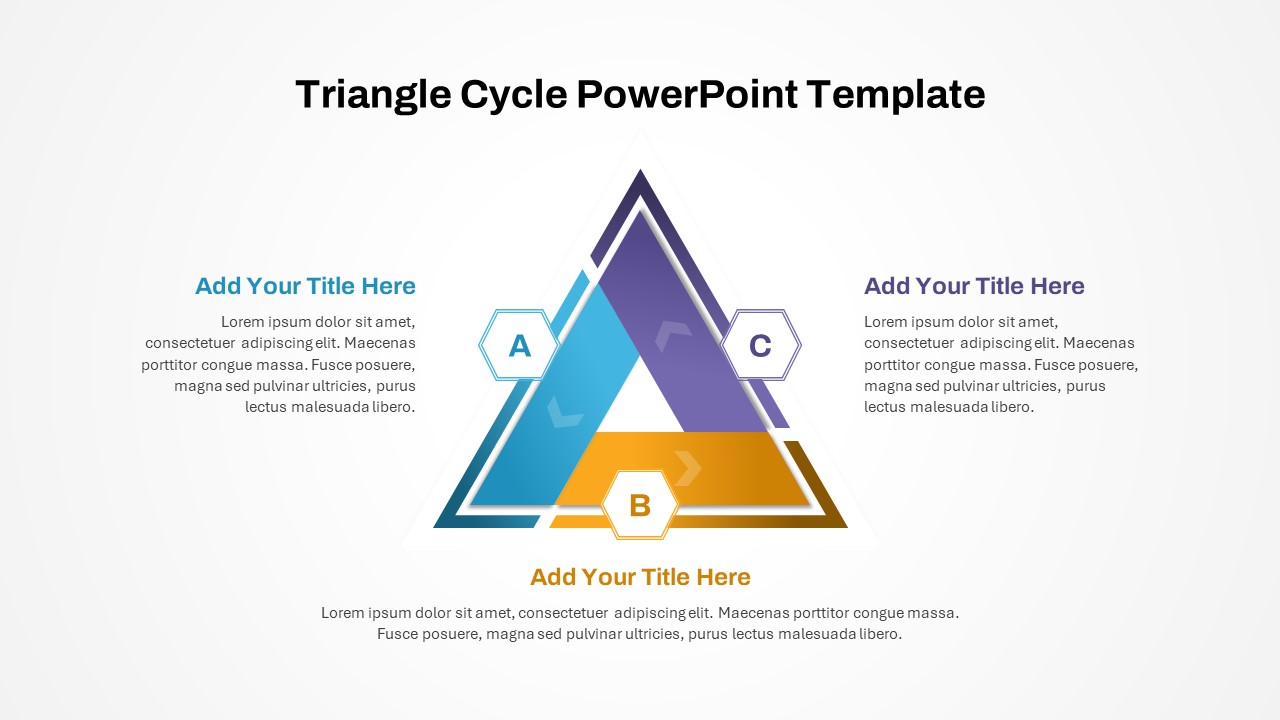
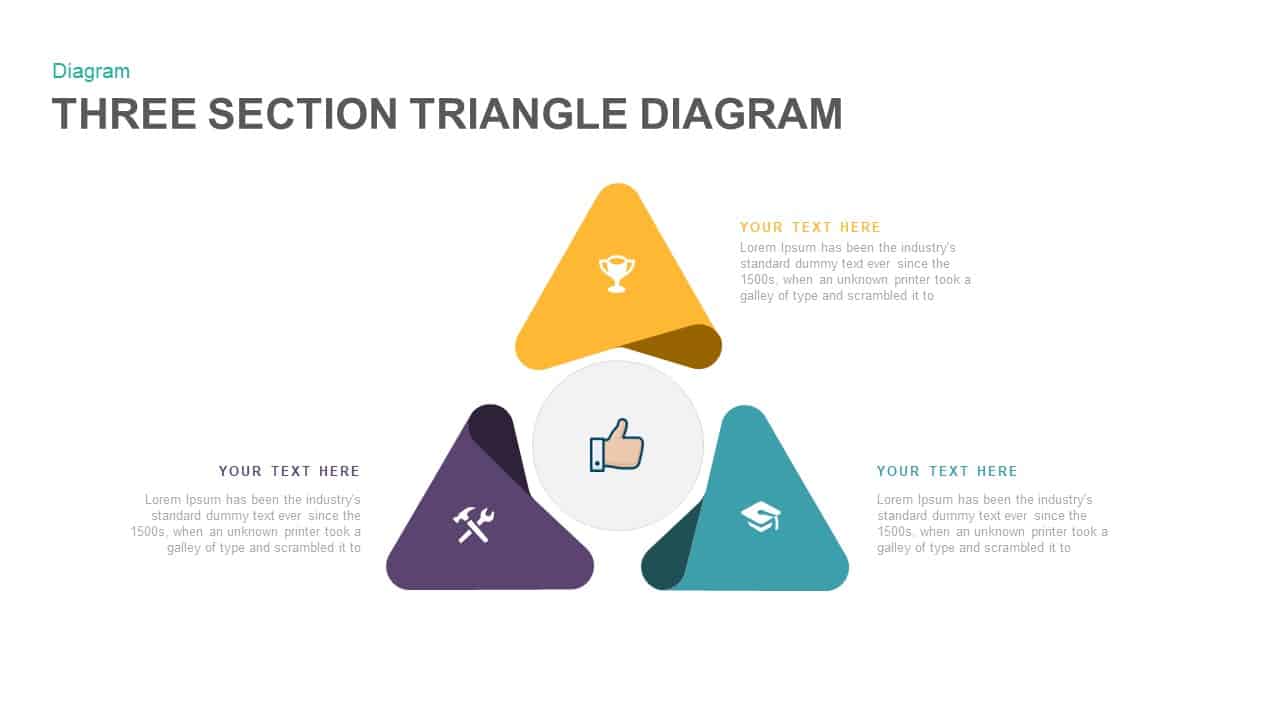
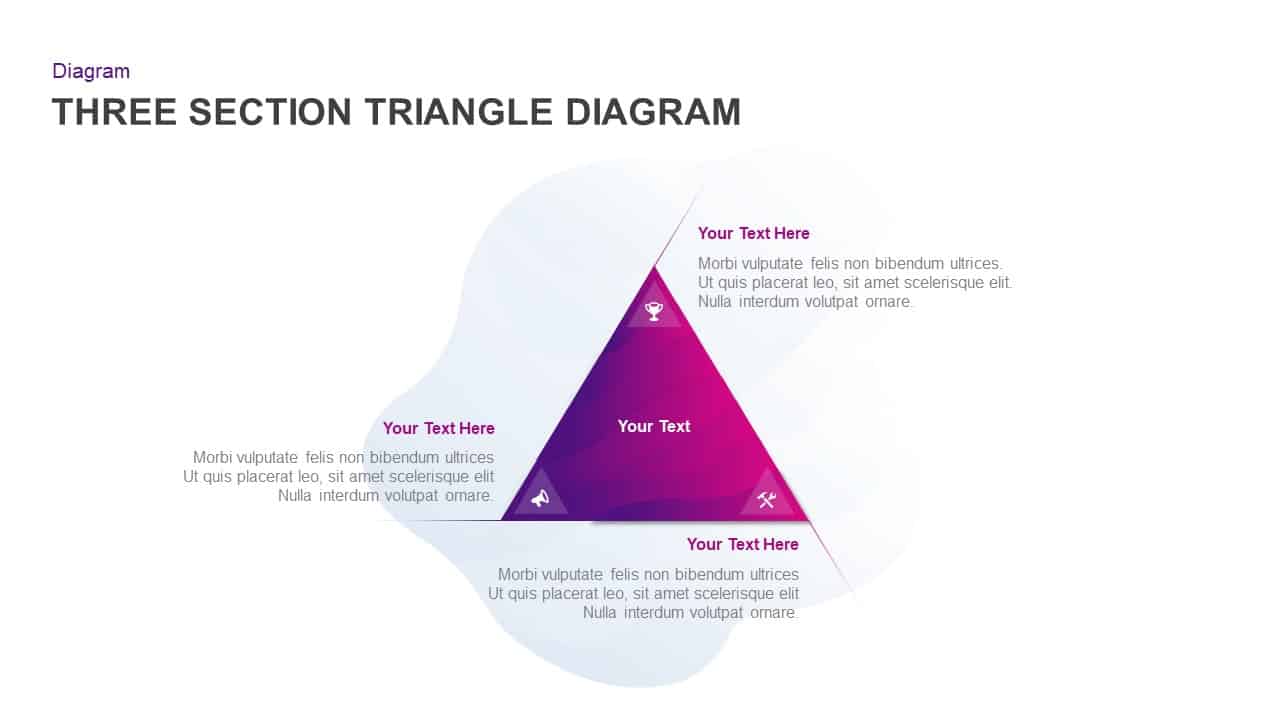
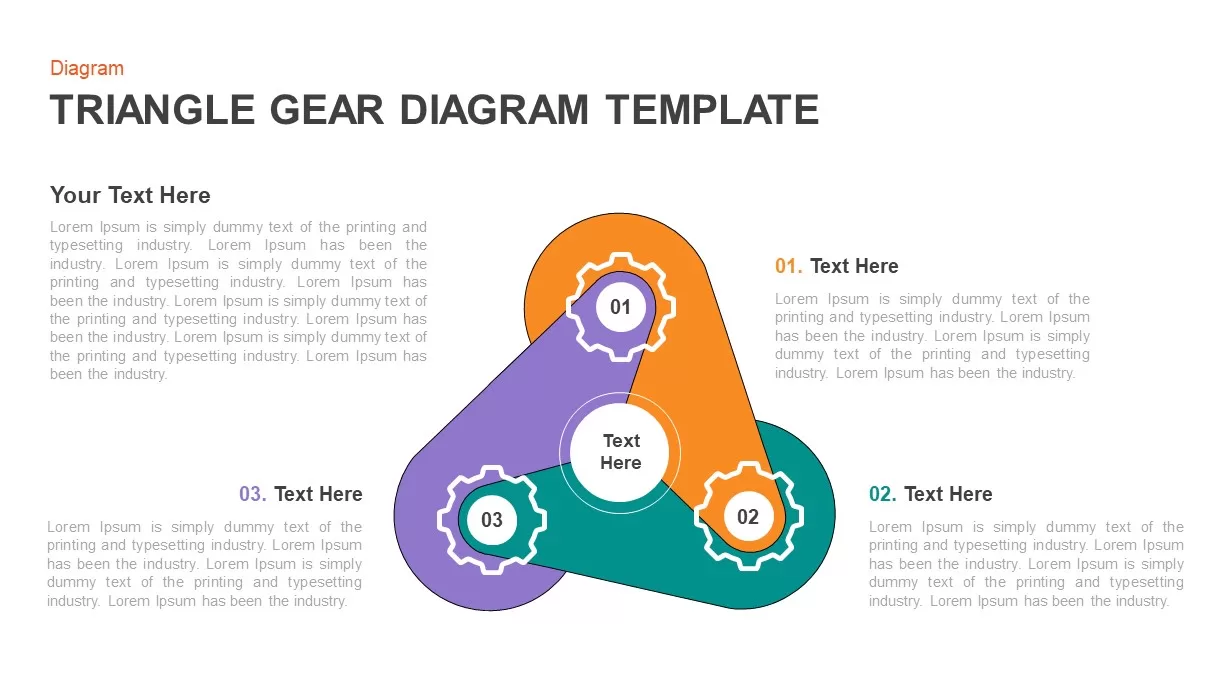
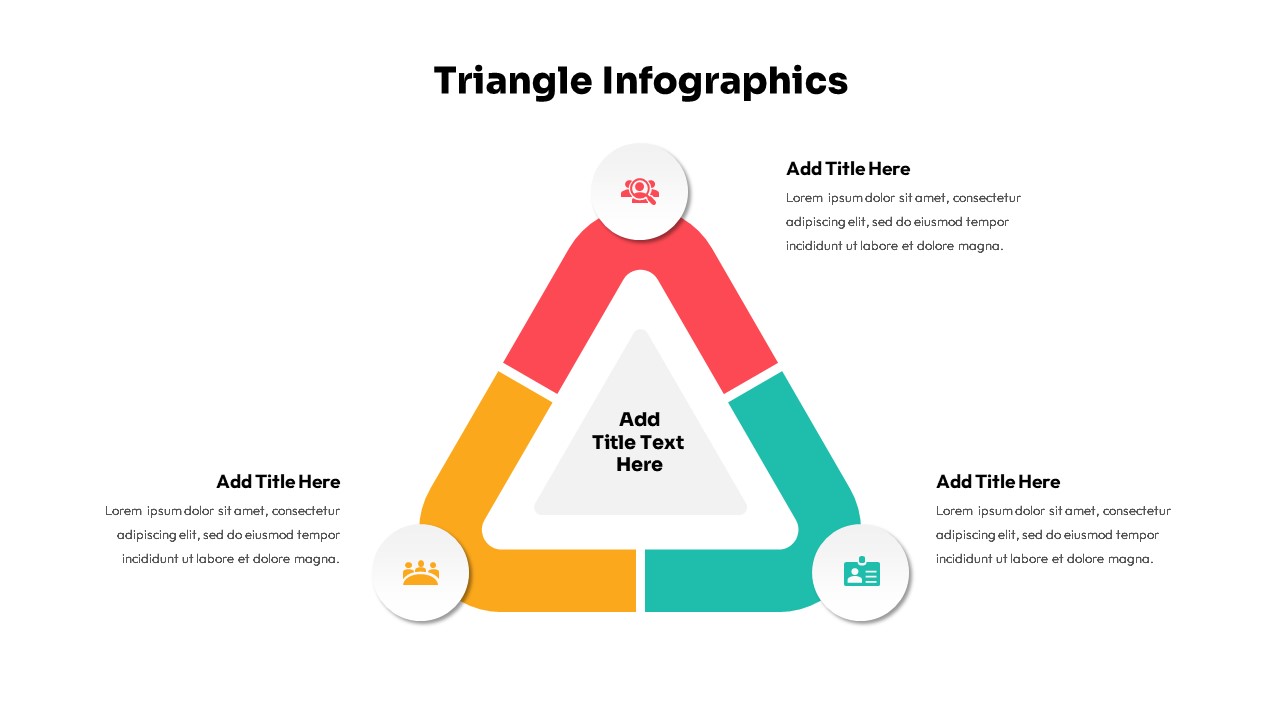
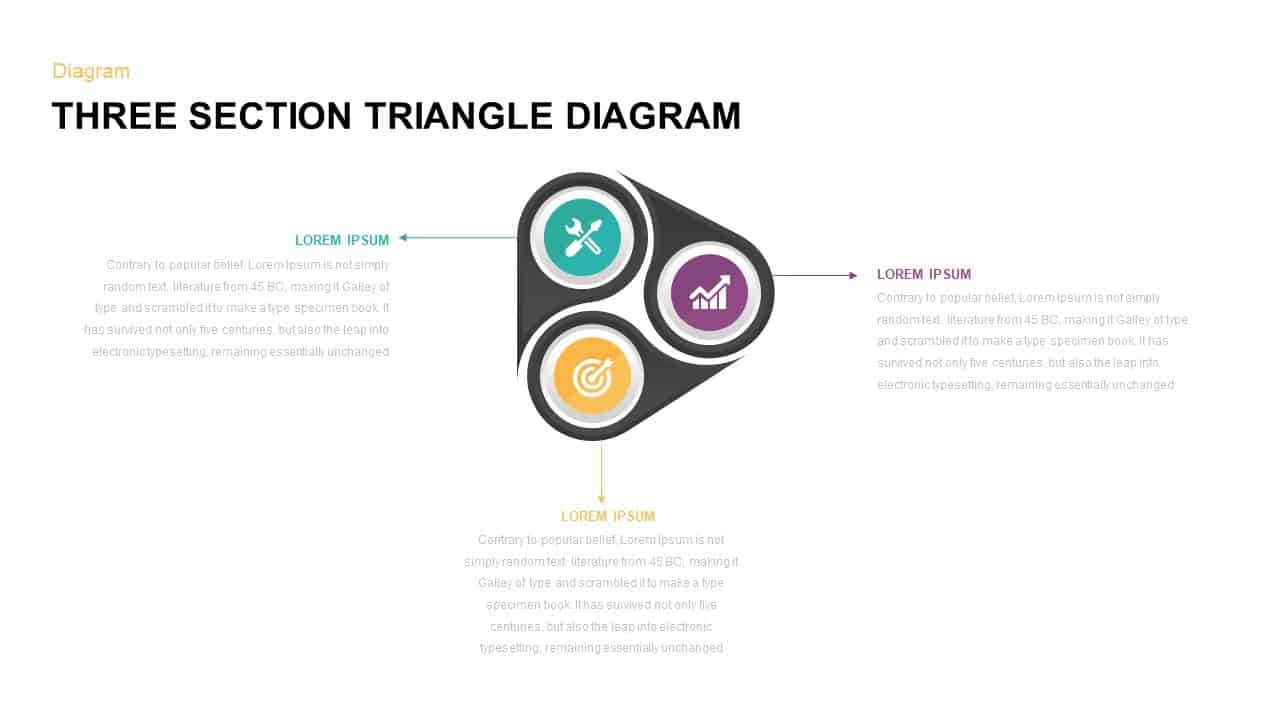
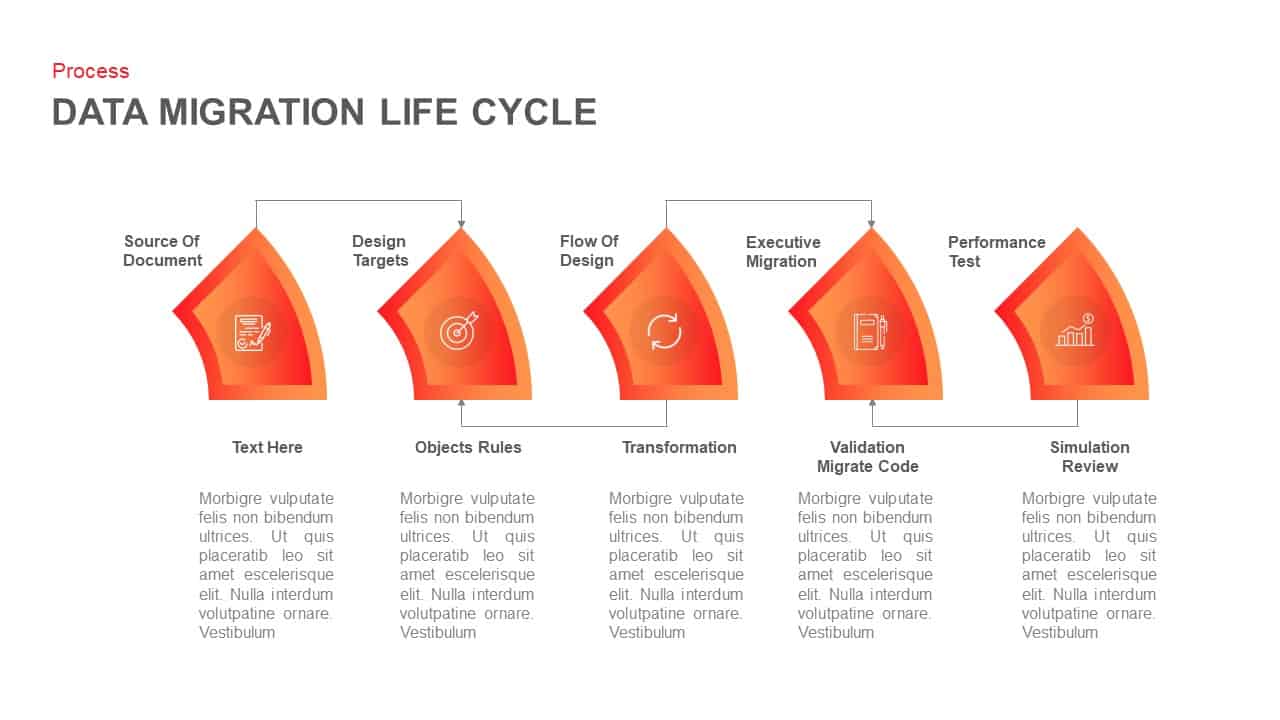
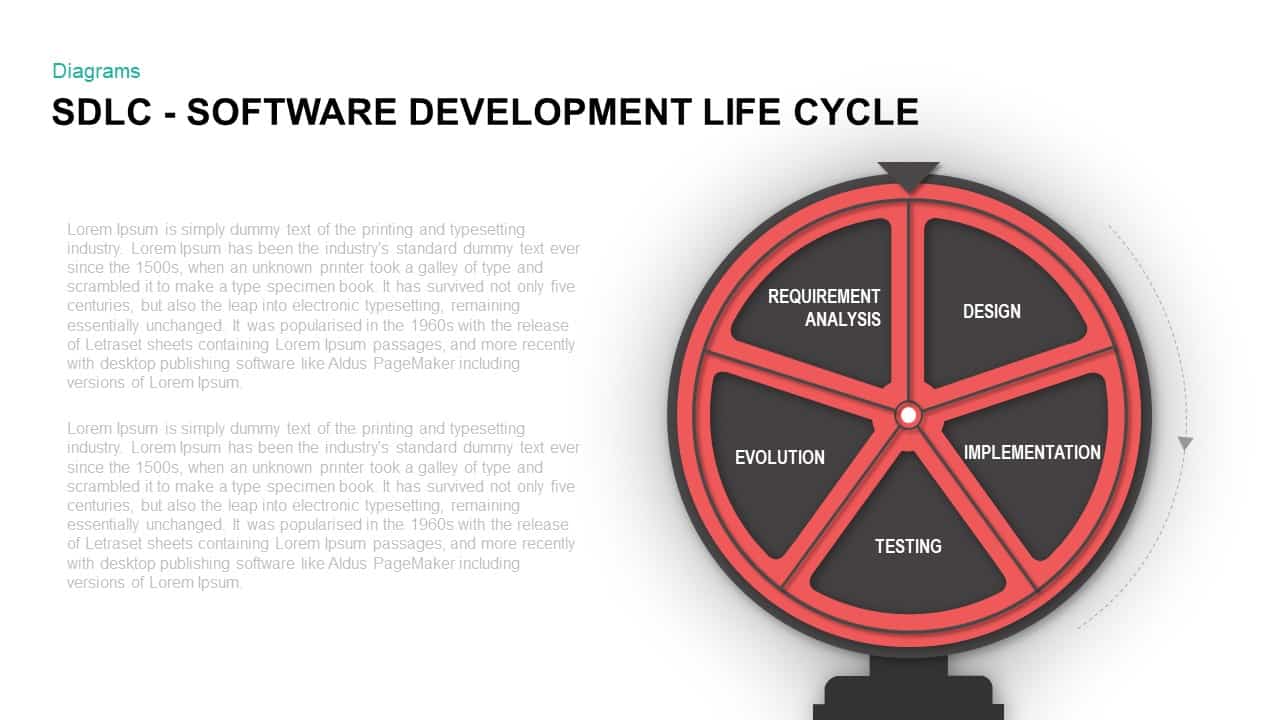
The Triangle PowerPoint Template provides an ideal solution for illustrating cyclical processes, workflows, and continuous development. This versatile template features a cycle diagram with three distinct design variants, available in both black and white background options. Each design includes color-coded segments with nodes, ensuring maximum engagement from the audience. Despite the variations, the triangles share a common resemblance in their segmented structure, making them cohesive and visually appealing. These infographics are perfect for highlighting repetitive processes and developmental cycles, capturing attention, and conveying information effectively. The template’s flexibility and aesthetic appeal make it an excellent tool for any presentation.
What is ternary diagram?
A ternary diagram, also known as a ternary plot, is a triangular graph used to represent the proportions of three variables that sum to a constant, typically 100%. Each corner of the triangle corresponds to one of the three variables, and any point within the triangle shows the relative proportions of the three. For example, in geochemistry, a ternary diagram might depict the proportions of three components of a rock, such as quartz, feldspar, and mica. By plotting the composition of various rock samples, geologists can easily visualize differences and similarities. Ternary diagrams are widely used in fields like chemistry, metallurgy, and environmental science for analyzing compositions and mixtures.
The triangle cycle diagram for PowerPoint presentation is perfect to illustrate continuous improvement processes, project management cycles, and operational workflows. The three divisions of the triangle cycle template are handy for displaying marketing strategies, product lifecycle, customer journey, and campaign process. Teachers can use this to teach cyclical concepts, recurring events, and history cycles. It enables visualising goal-setting cycles, habit formation processes, and personal growth strategies. So, any iteration or recurring process can be shown using this triangle PPT template.
The triangle cycle PowerPoint template has high-quality PowerPoint shapes including infographic cliparts that join each section of triangle divisions as nodes. Each diagram presents text zones in different places. For example, the middle diagram in red, blue, and green arrow ppt segments shows infographic icons in circles in triangle corners. This diagram carries PowerPoint hexagon, circle, and arrow shapes to create aesthetic appeal. Download the editable triangle cycle template PowerPoint to show process flows. Get it now!
Login to download this file


