Social Media Report Presentation Template for PowerPoint & Google Slides


Pulling campaign numbers together is one thing. Presenting them in a way that actually convinces stakeholders is another. This social media report PowerPoint template gives you 21 fully designed slides that turn raw marketing data into a clear, professional narrative, covering every major platform your campaigns run on.
What You Get in This Social Media Report for PowerPoint
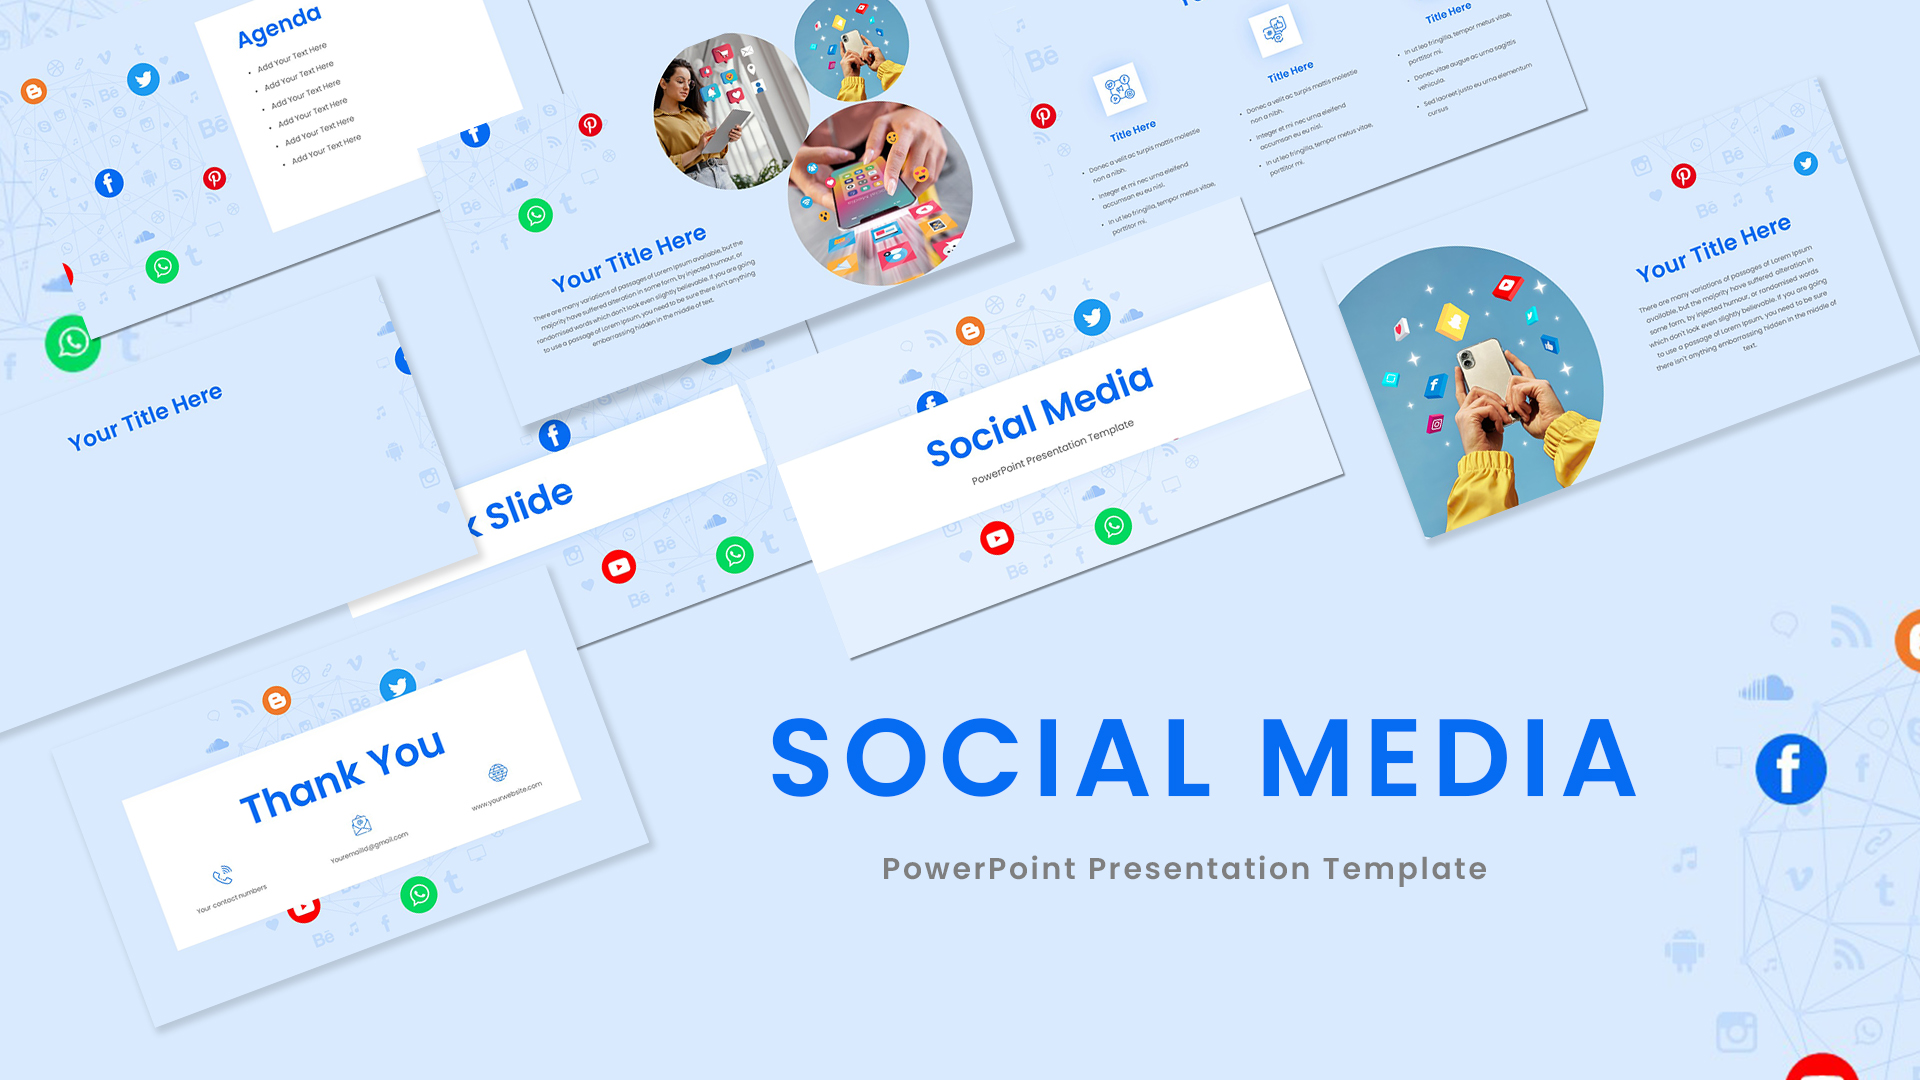
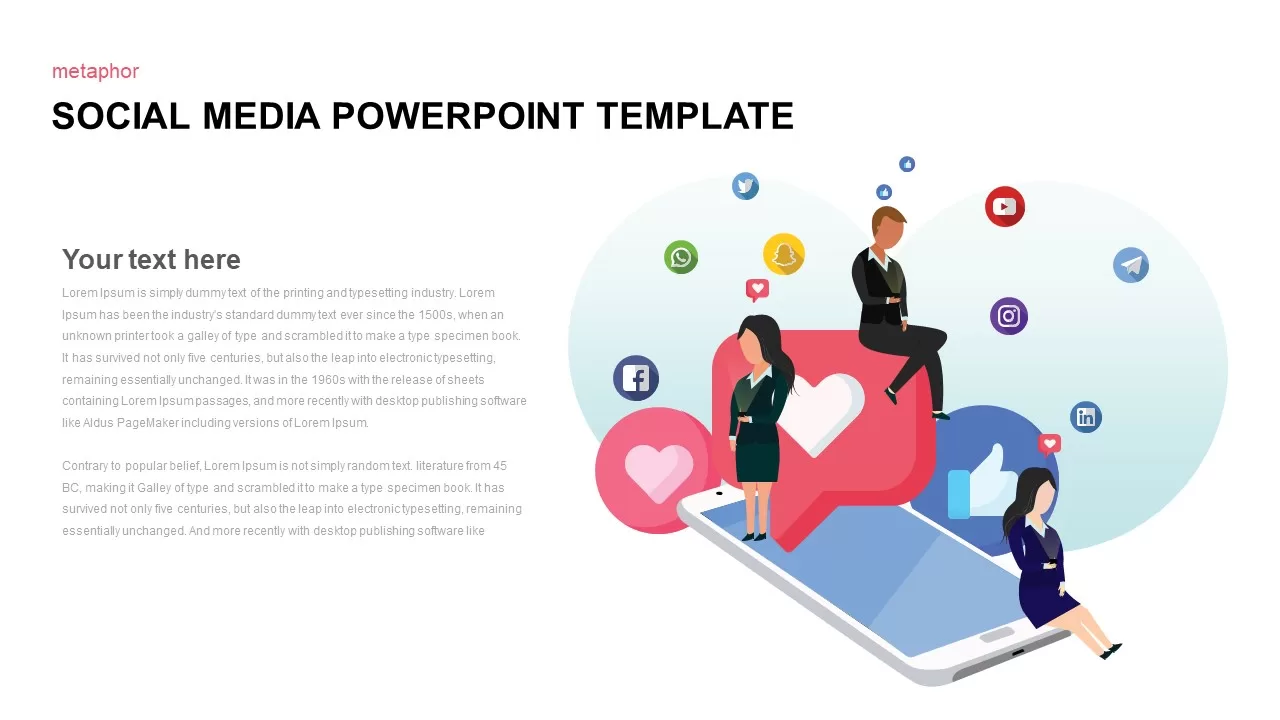
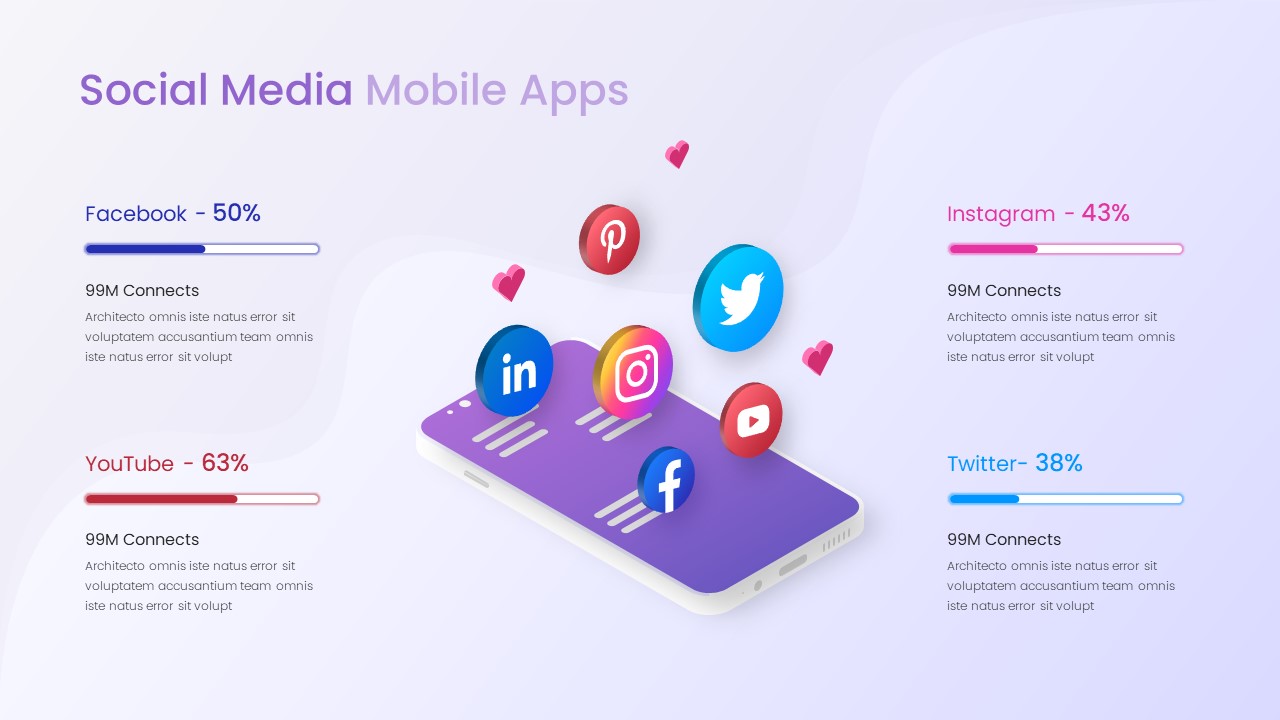
The deck opens with a striking cover slide featuring isometric smartphone graphics, then moves through a logical reporting flow that takes your audience from high-level overview to platform-level detail without losing them along the way.
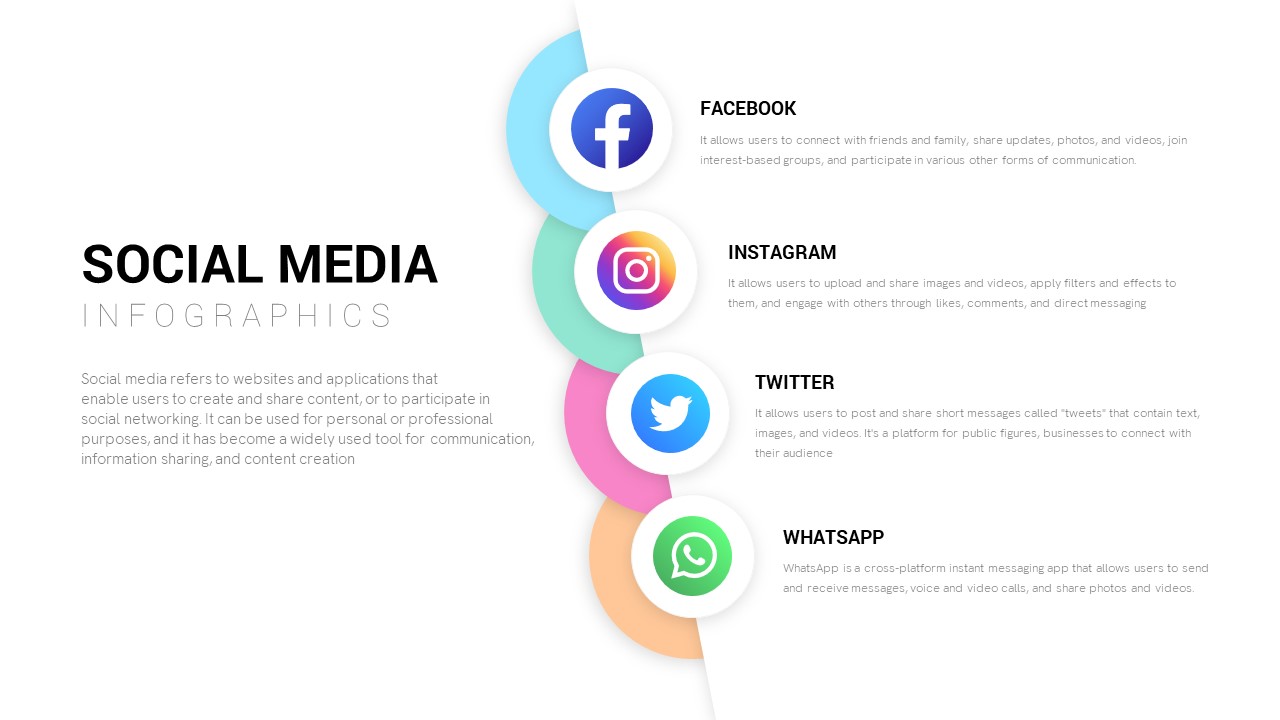
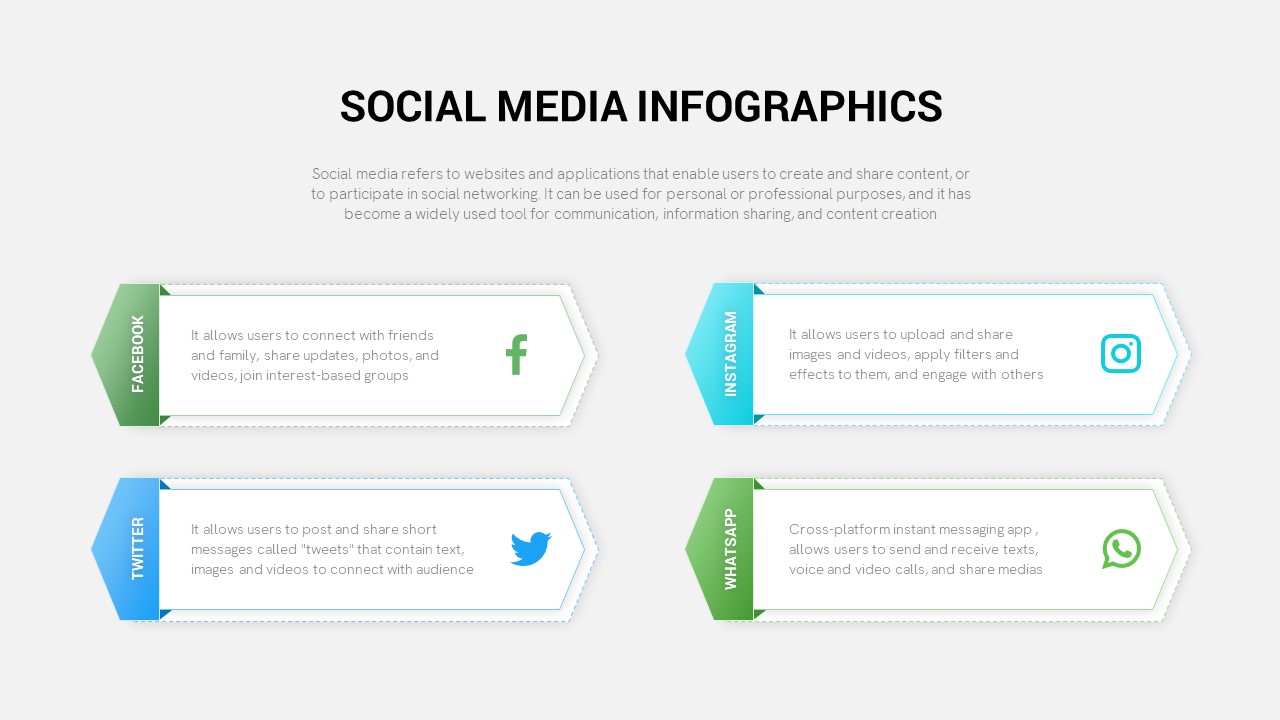
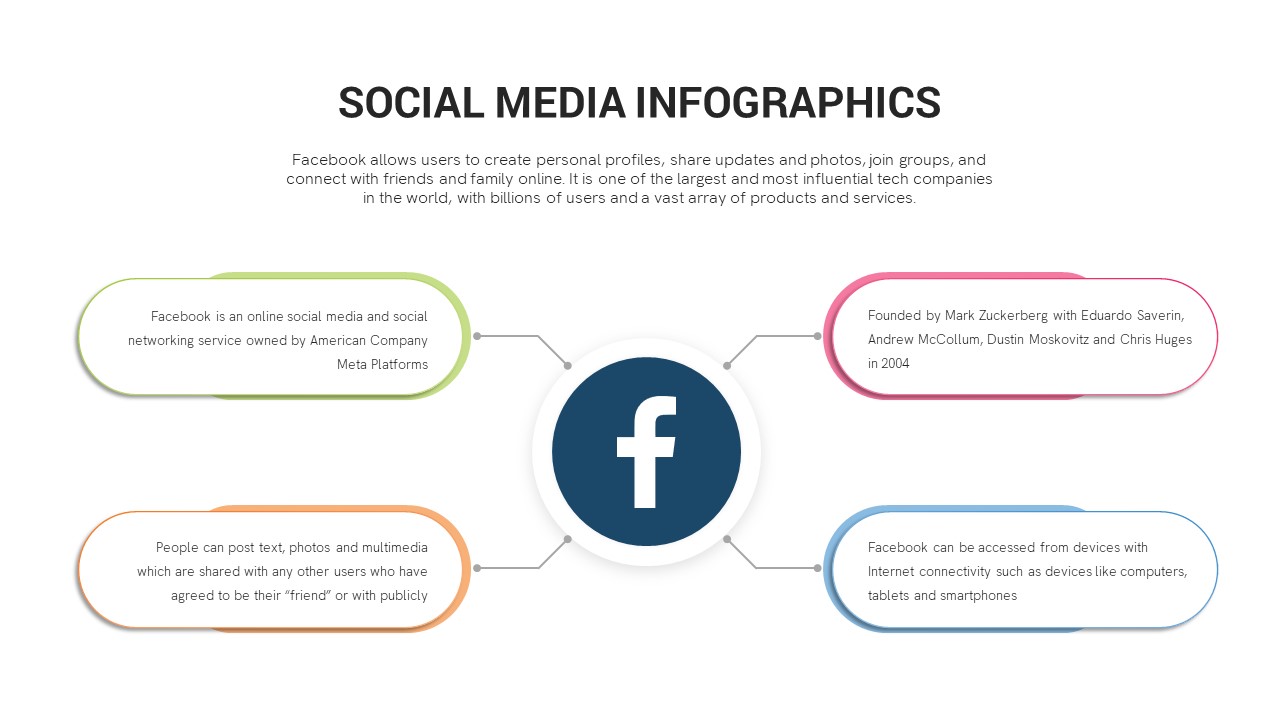
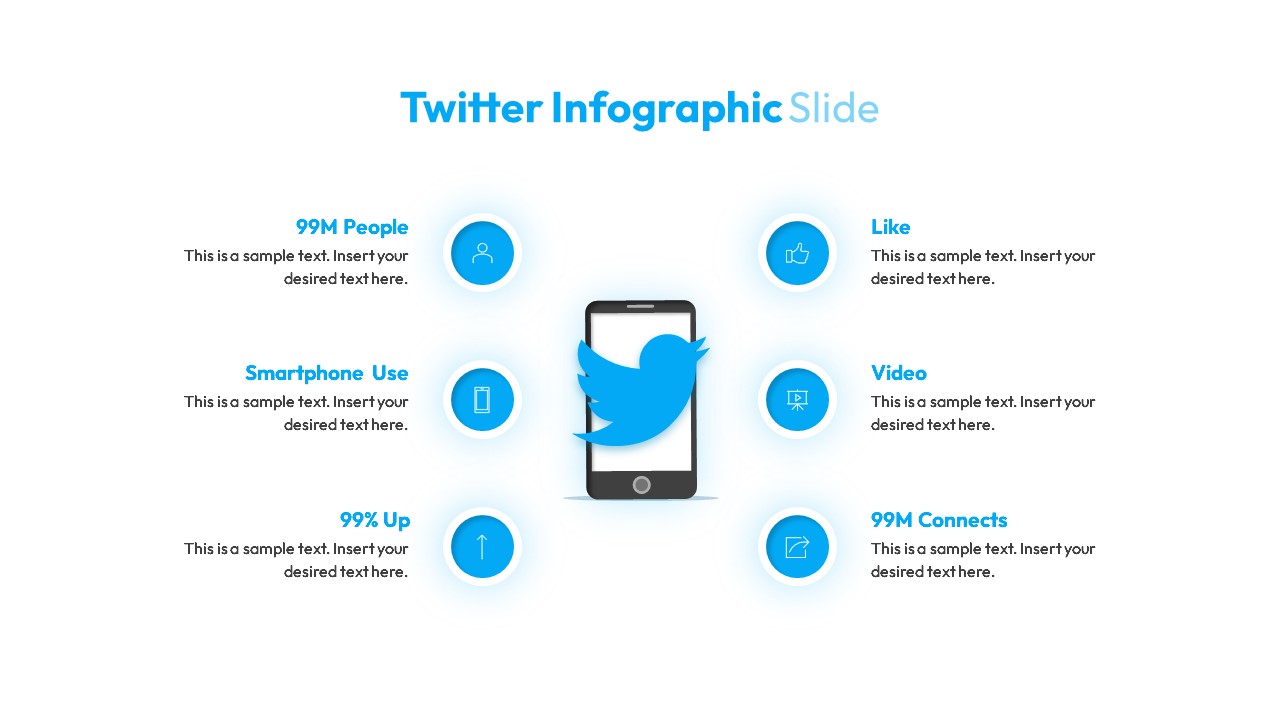
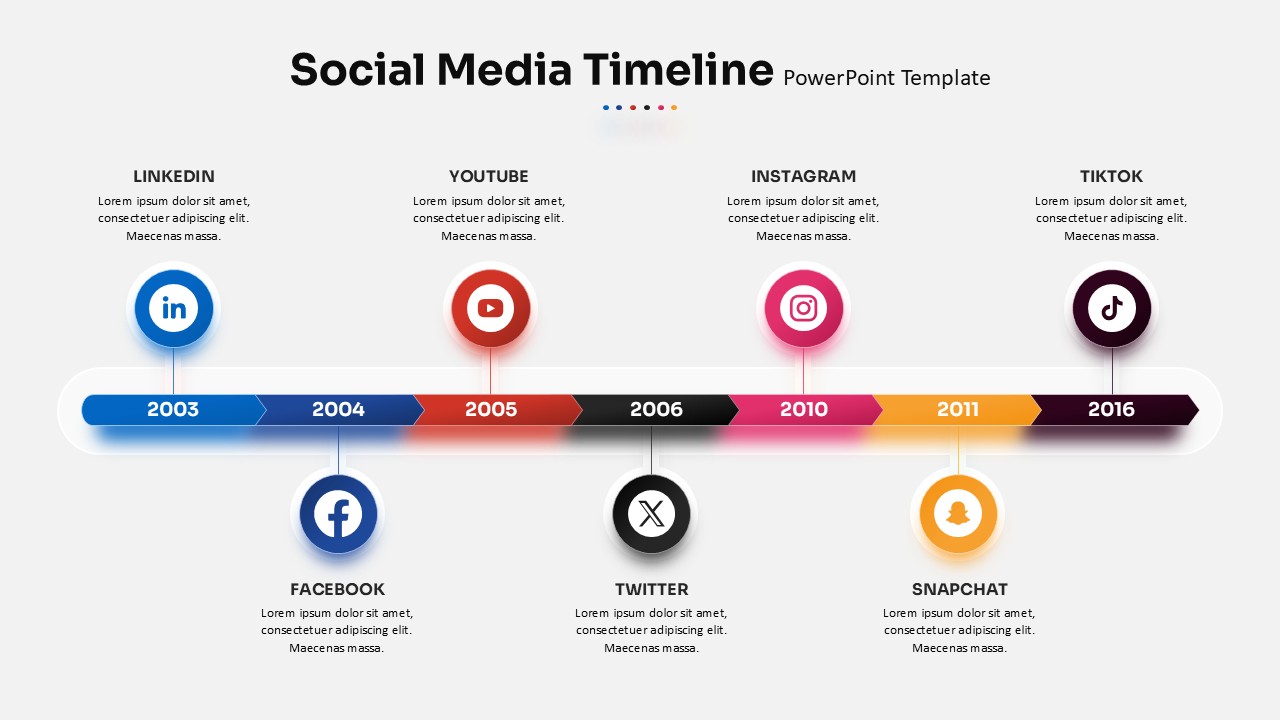
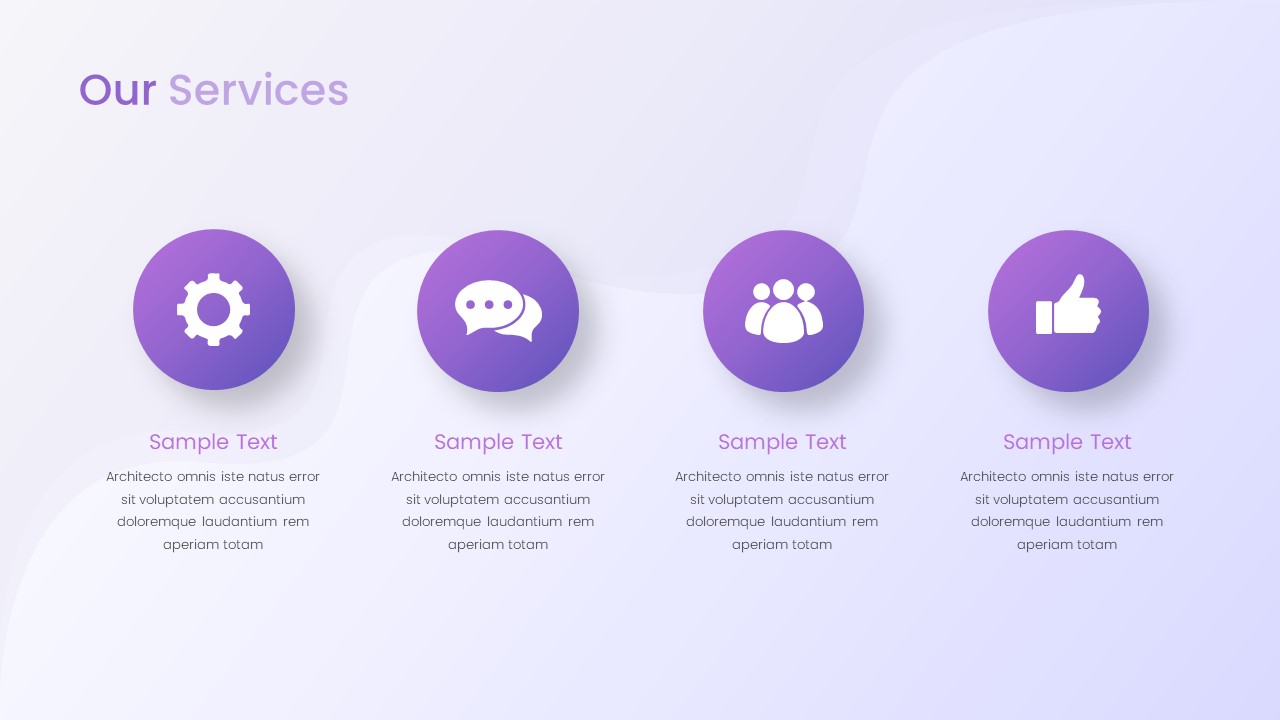
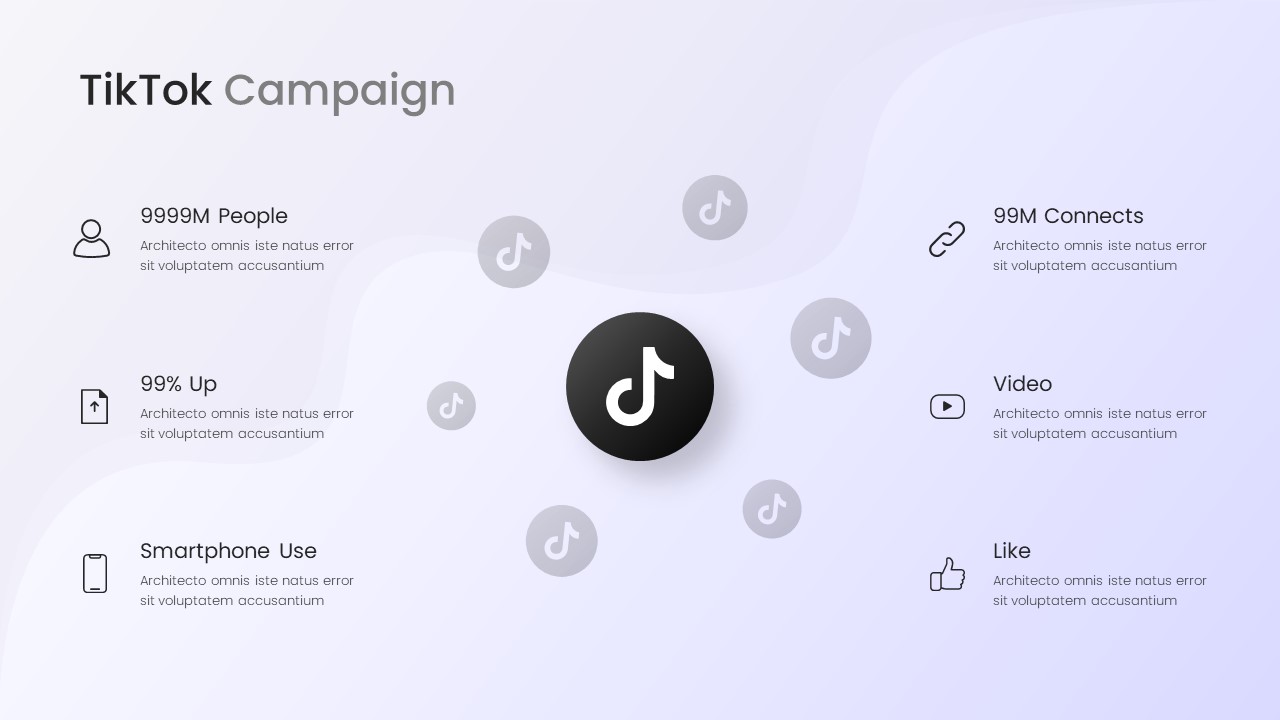
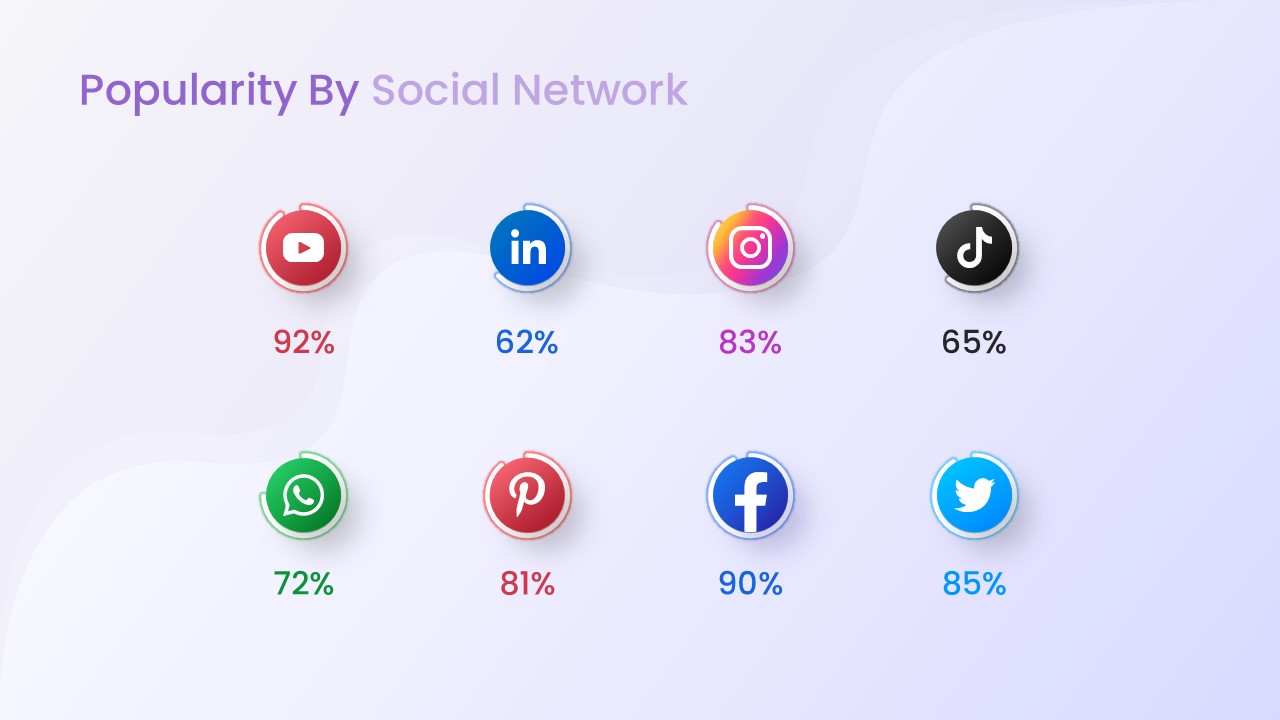
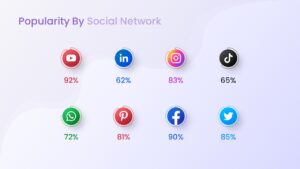
Platform-specific slides are included for Facebook, YouTube, Instagram, Twitter, WhatsApp, Pinterest, LinkedIn, and TikTok. Each layout uses vector-based icons, clean typography, and consistent color coding so every platform is instantly recognizable without any explanation needed.
Beyond the individual platform slides, the deck also includes:
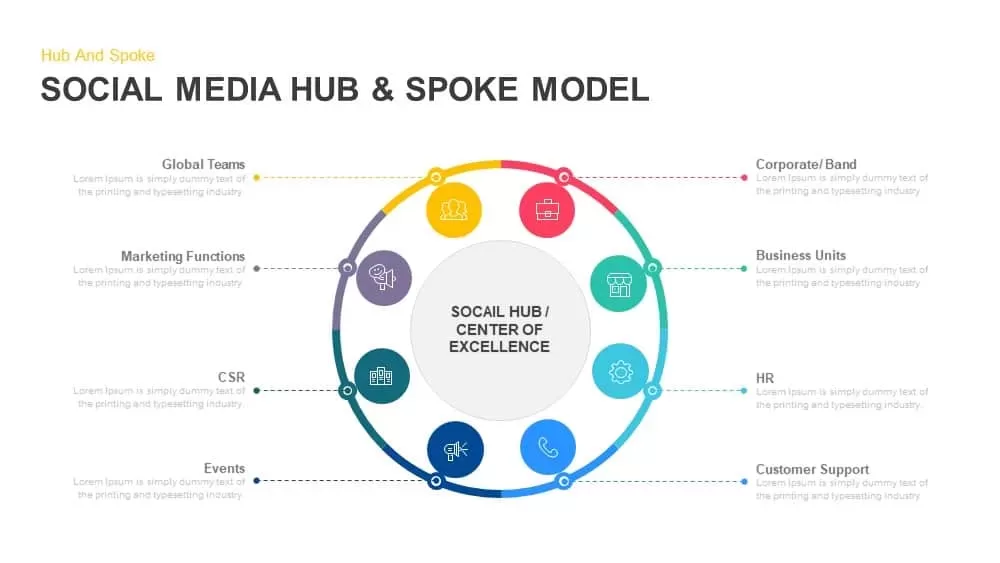
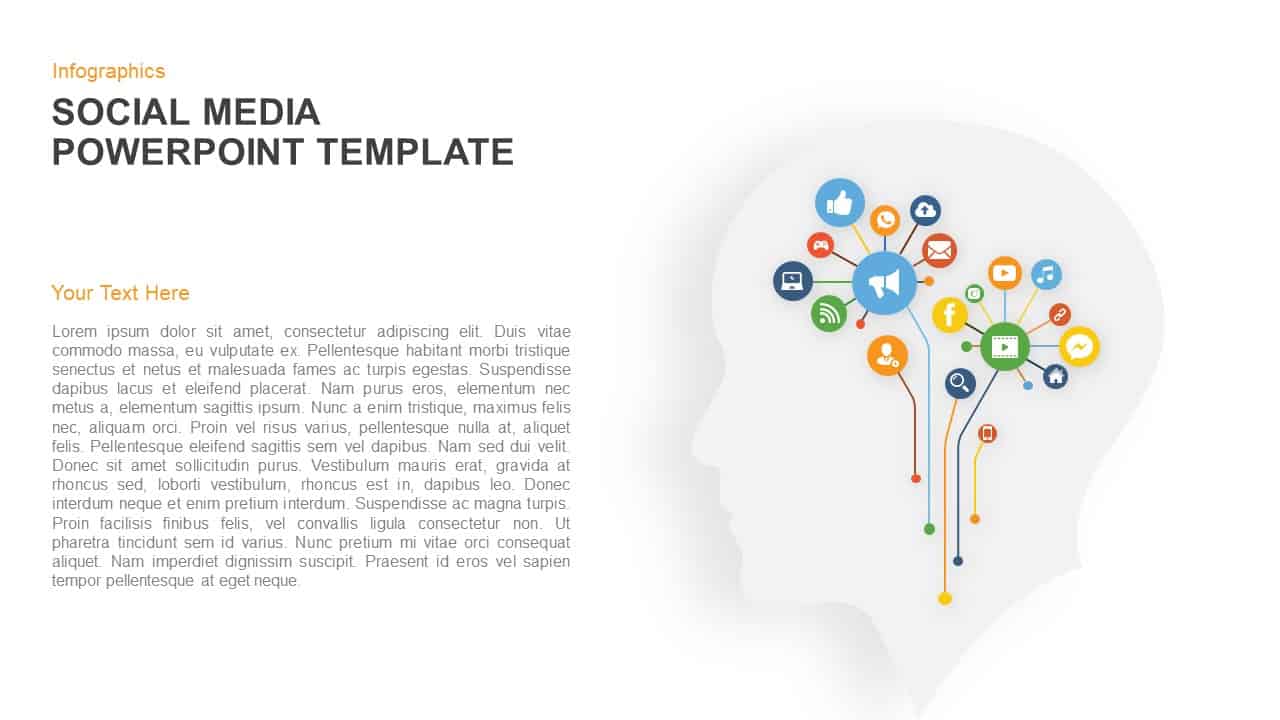
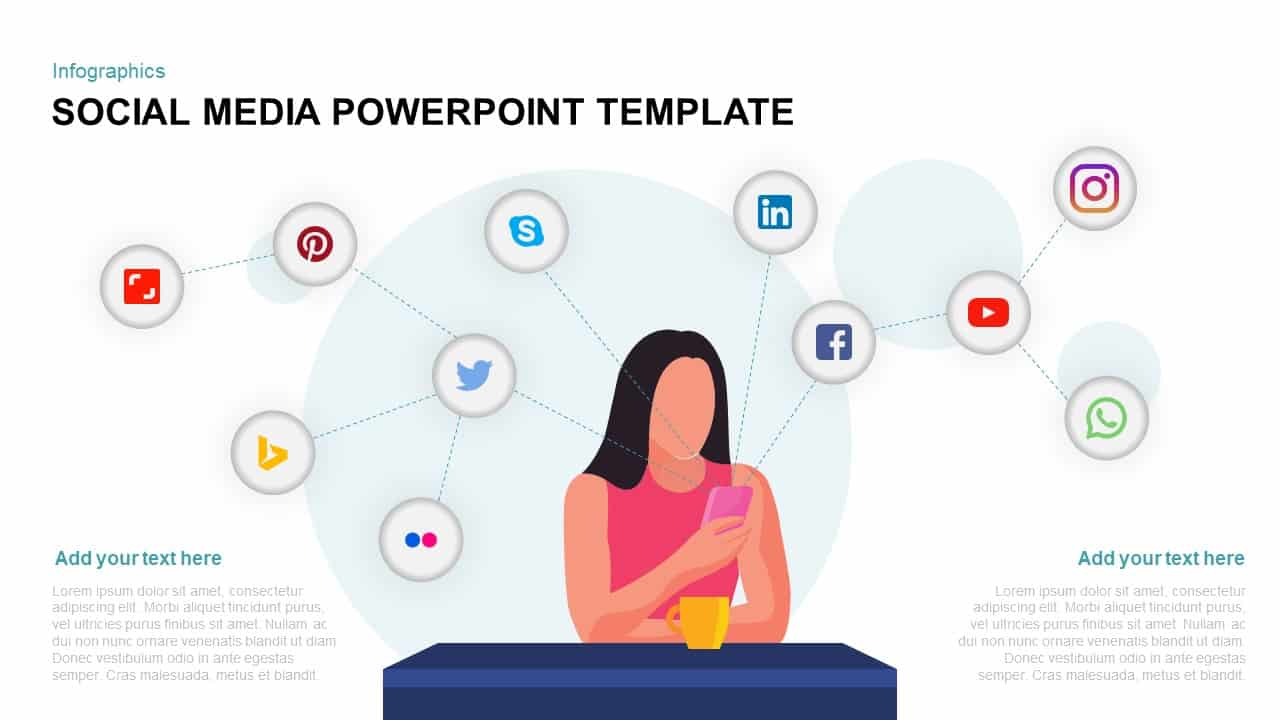
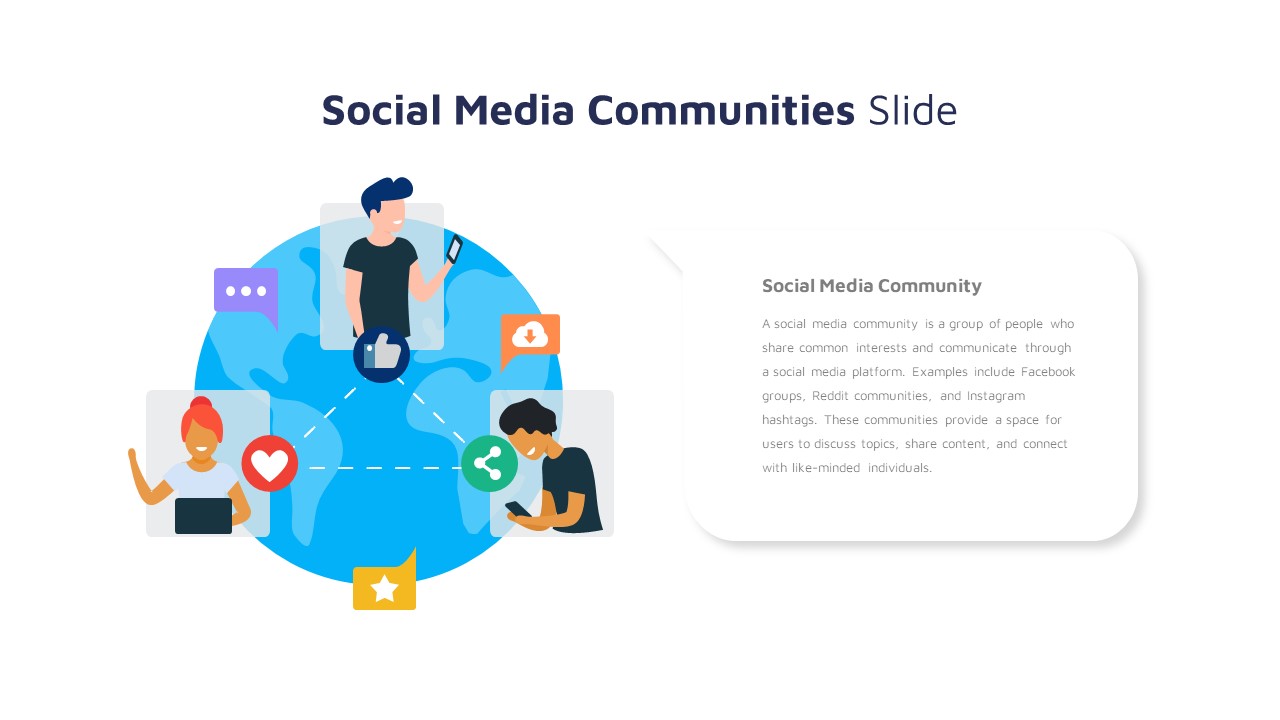
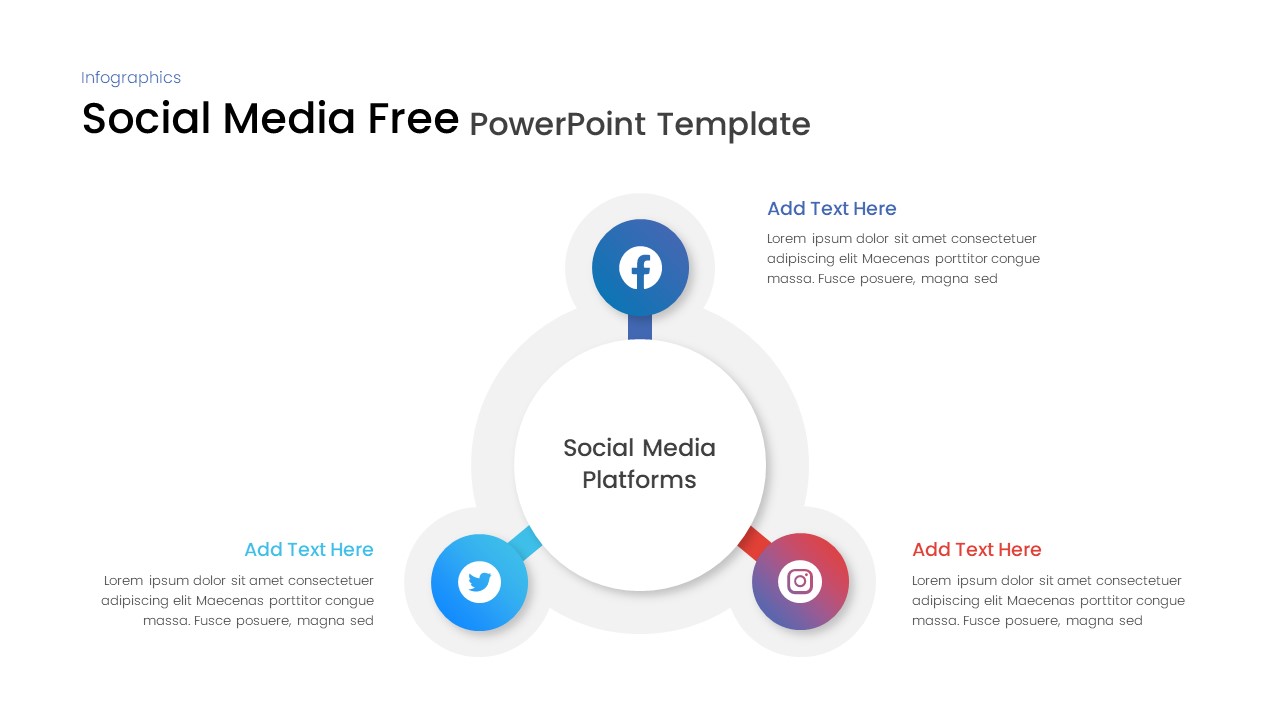
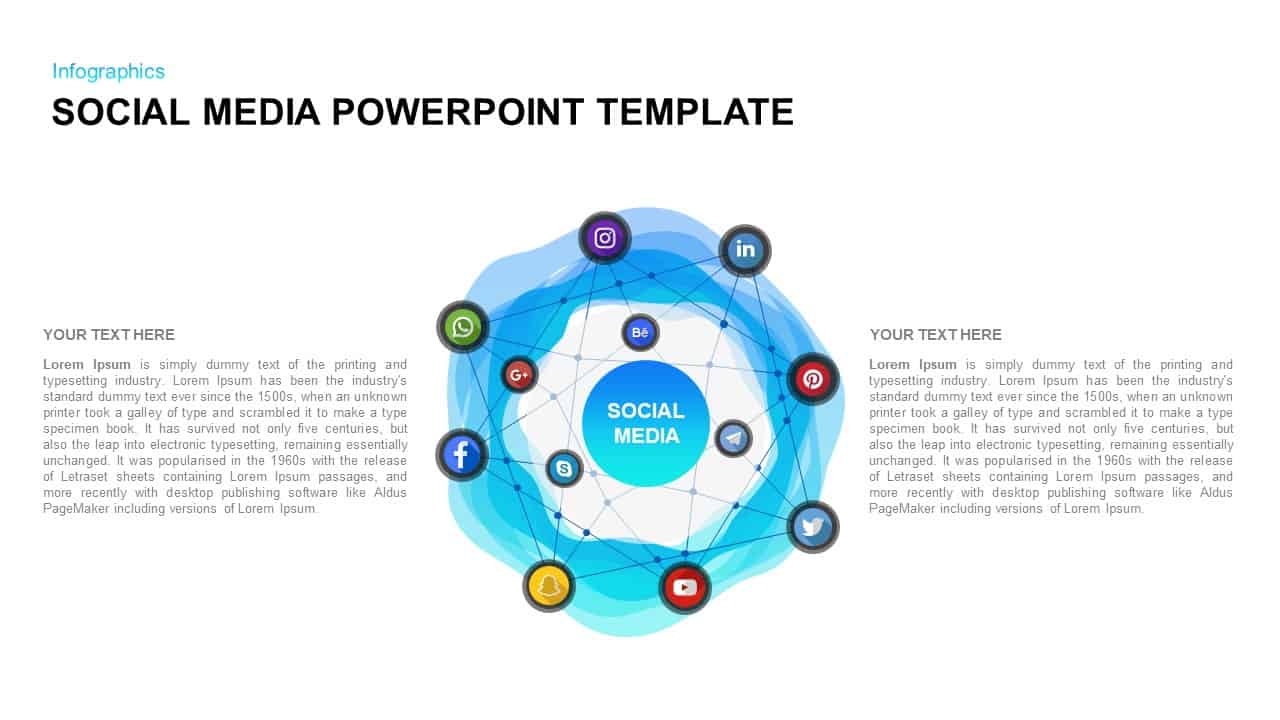
- Network diagrams showing social connectivity and audience relationships
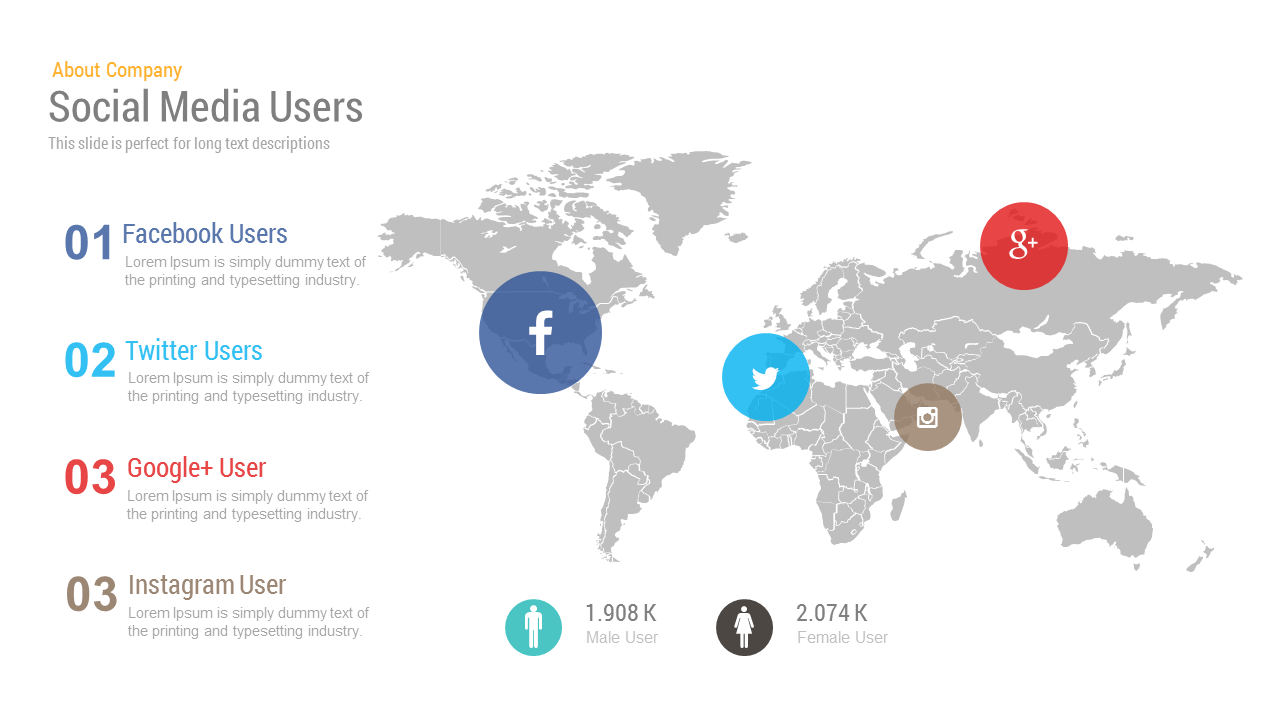
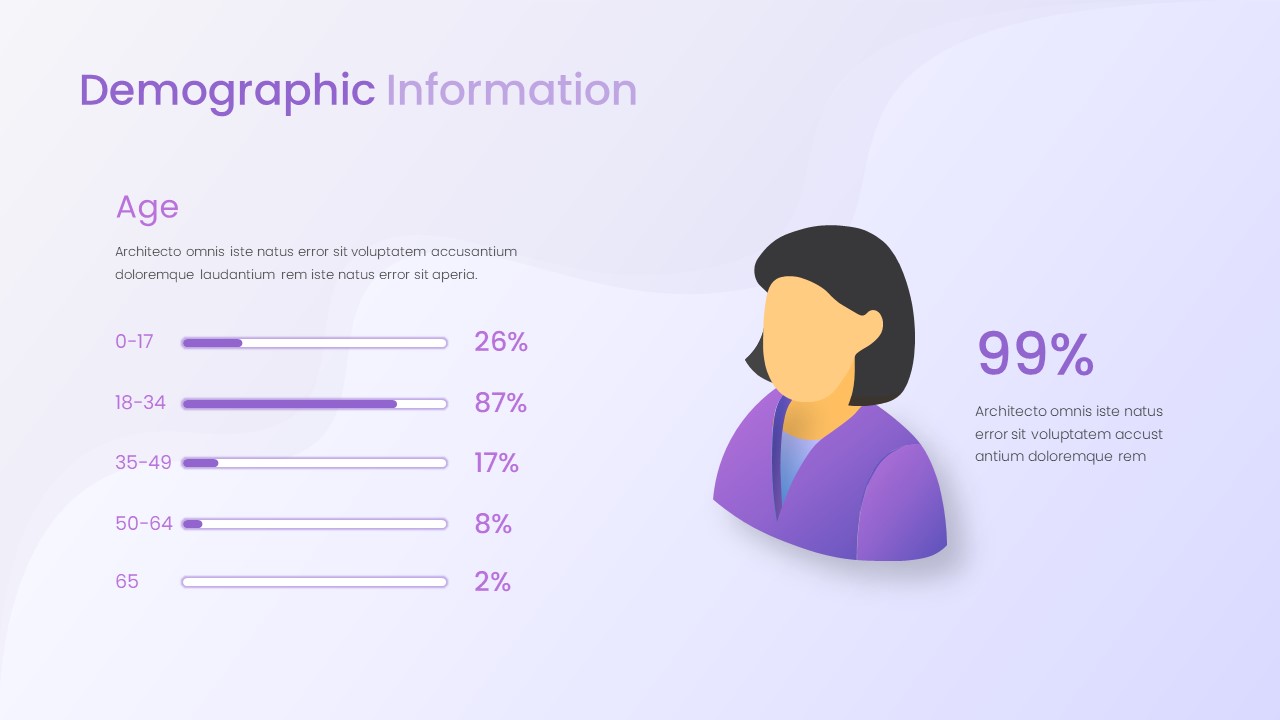
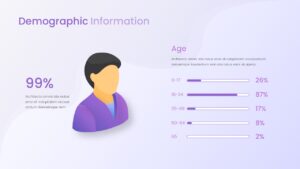
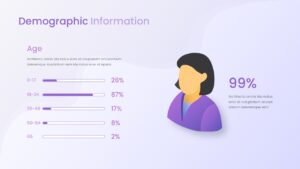
- Demographic charts broken down by age and gender
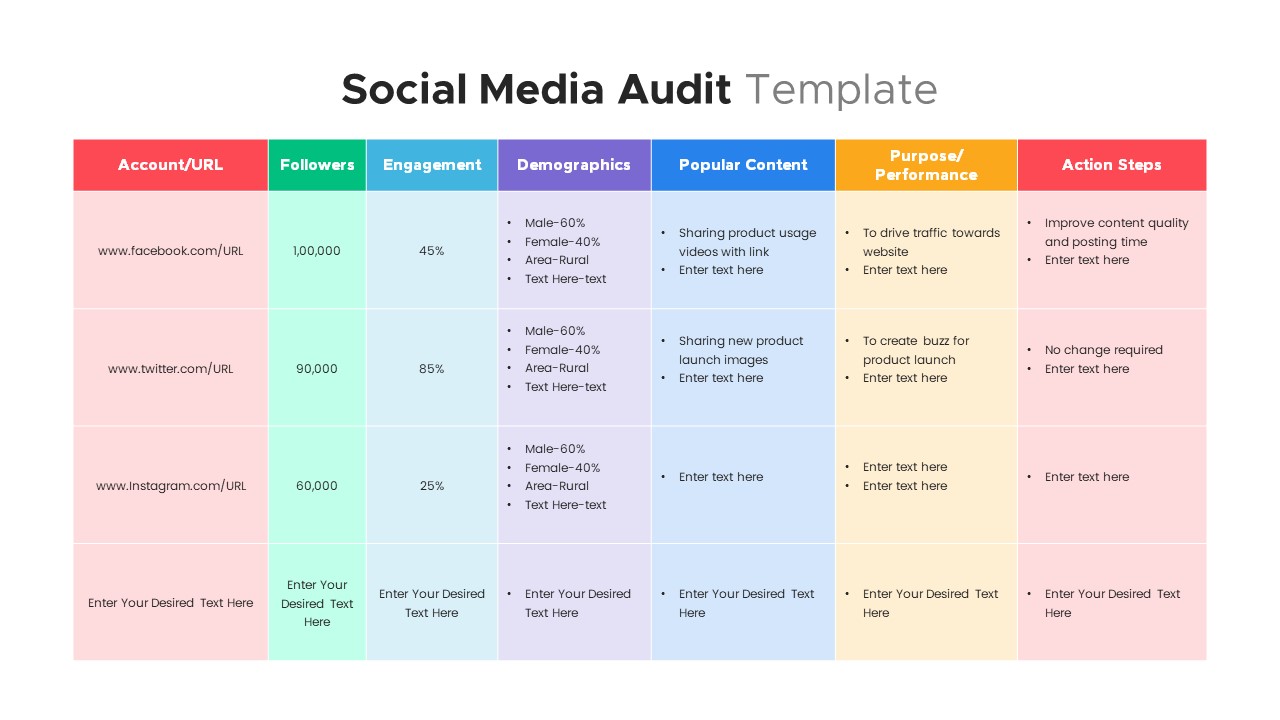
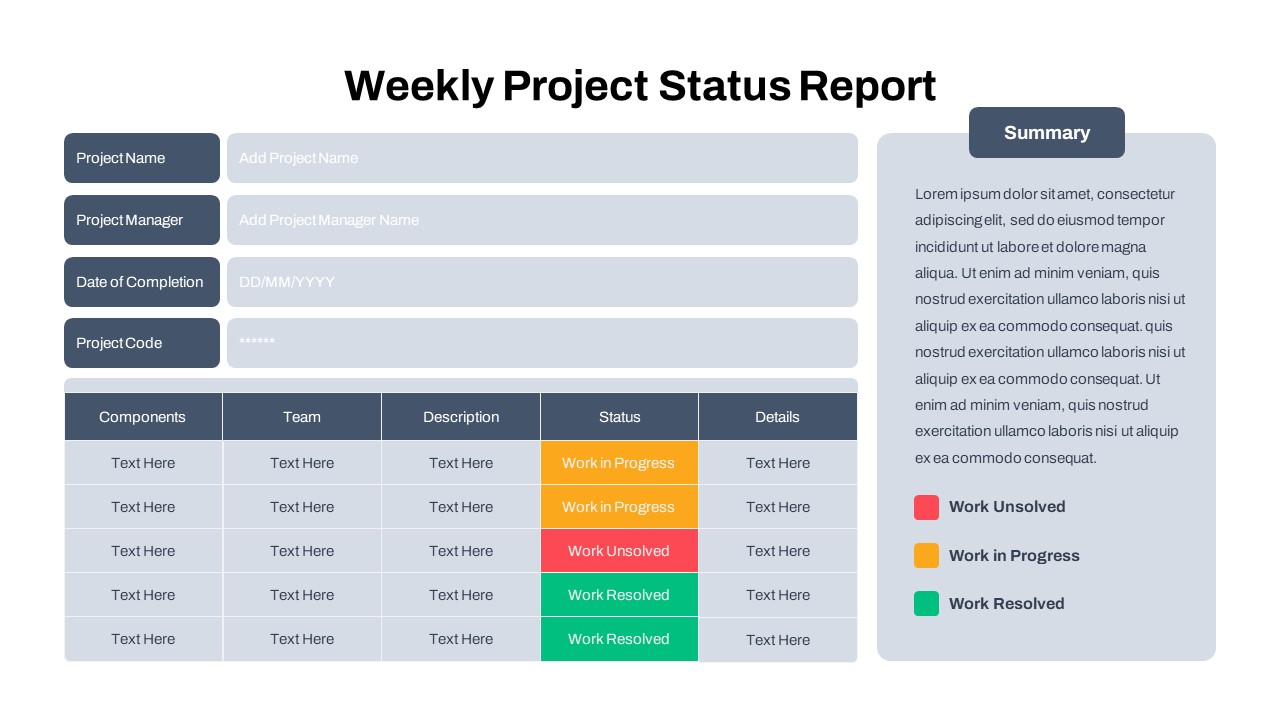
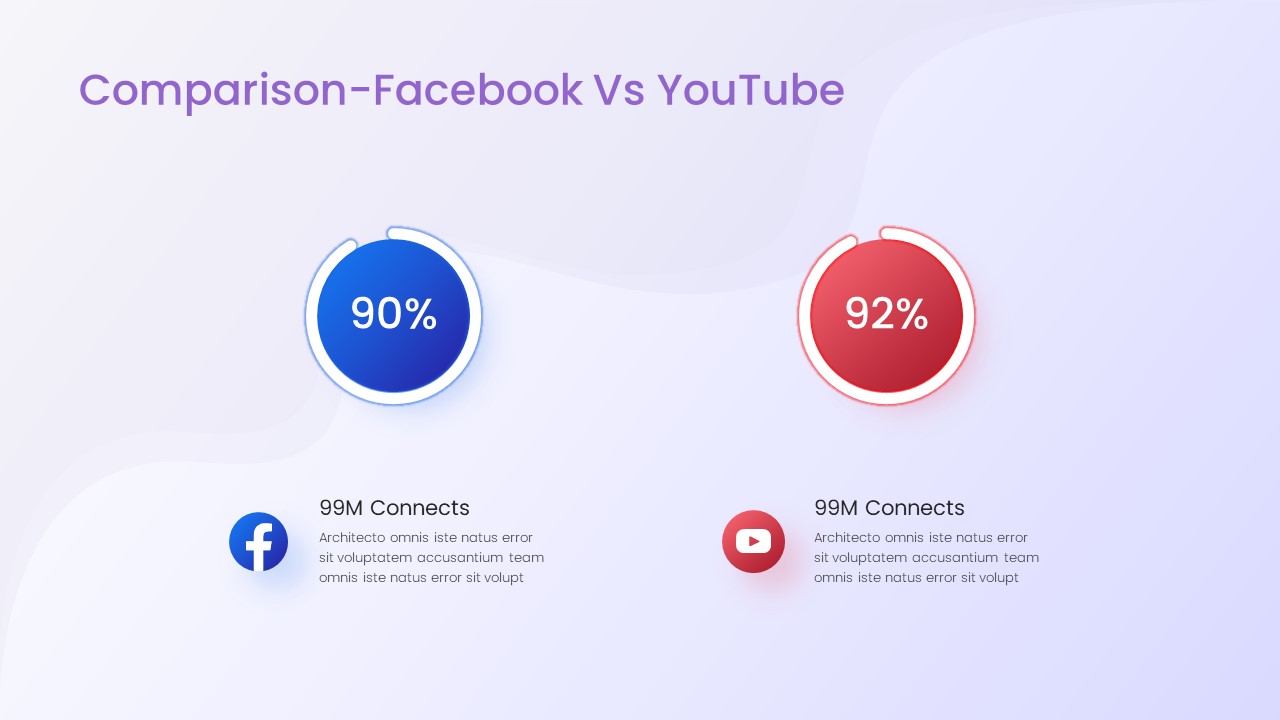
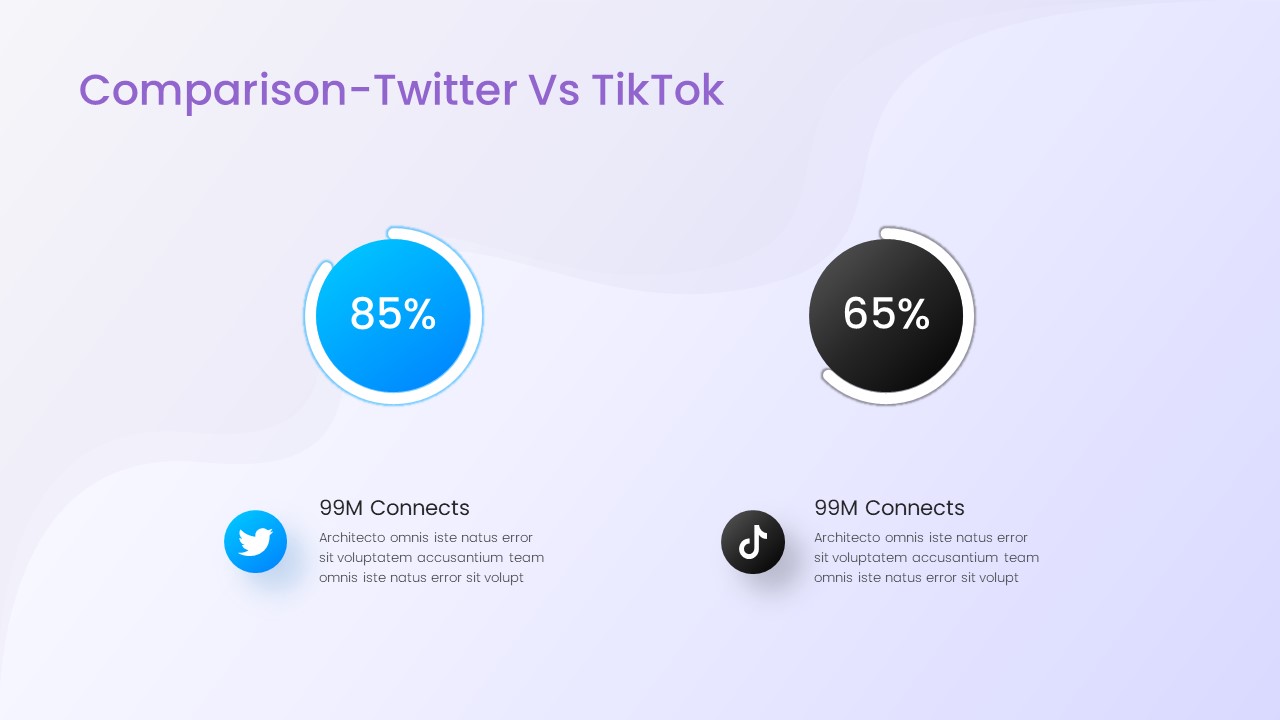
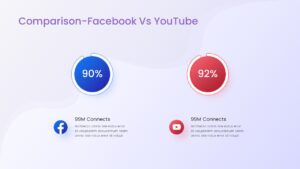
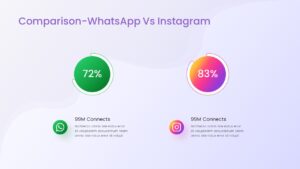
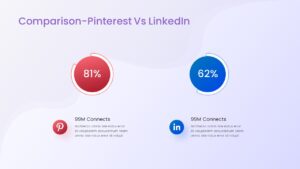
- Platform comparison layouts for side-by-side performance analysis
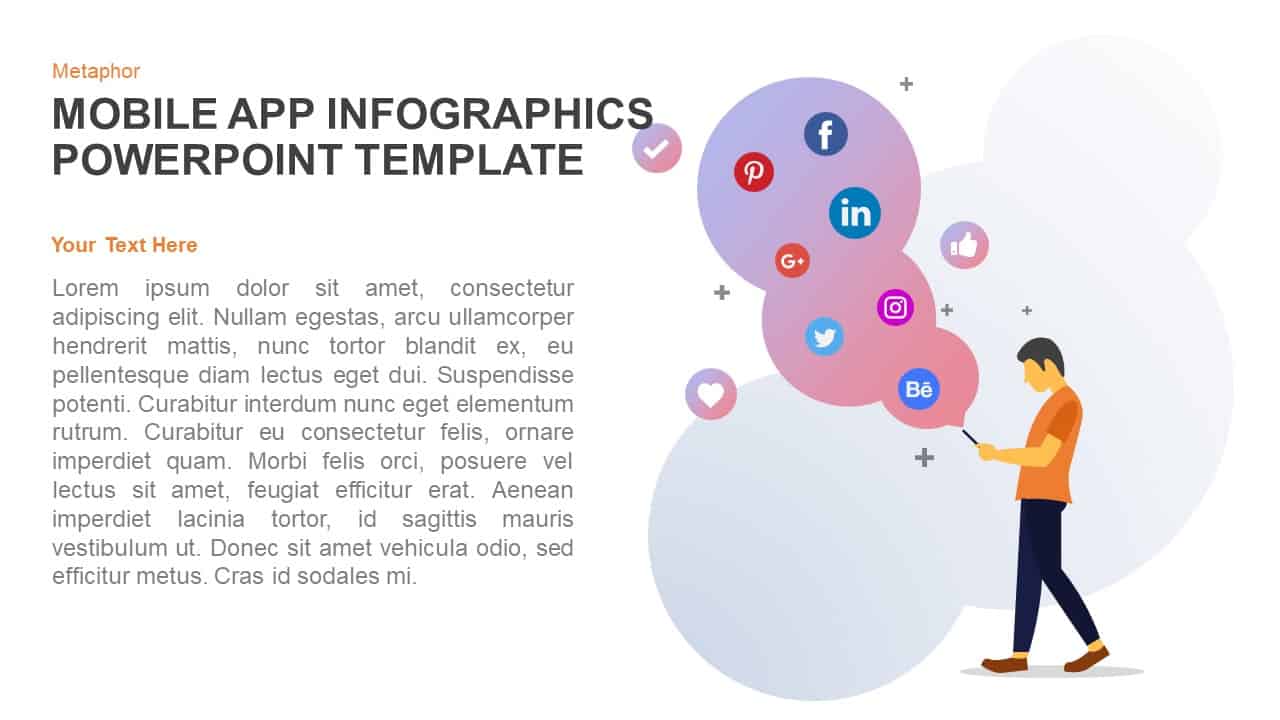
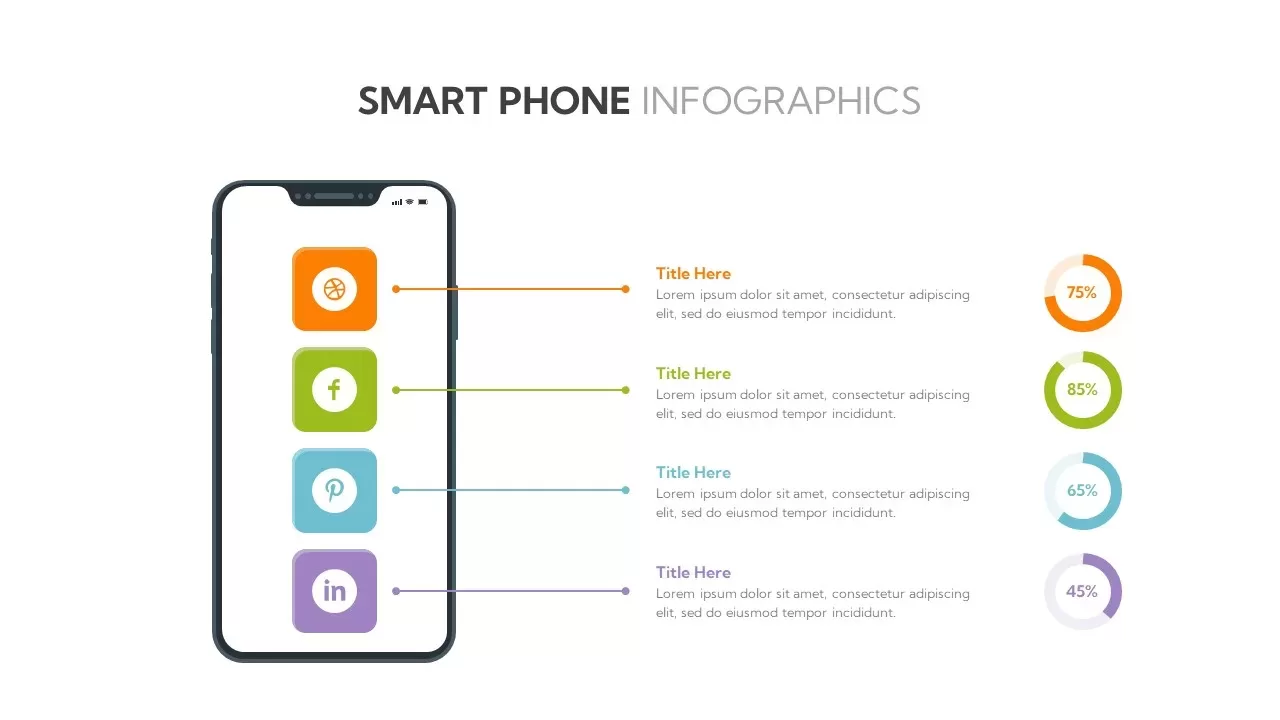
- Mobile app usage infographics for channel-level context
The pastel purple gradient background and soft white card layout give the entire deck a modern, cohesive look that keeps audiences focused on the data rather than the design.
A Social Media Report PowerPoint Template Built to Be Edited Fast
Everything in this deck is built on PowerPoint master slides, which means swapping icons, updating color palettes, changing fonts, or rearranging layouts takes seconds and does not break alignment or spacing. High-resolution vector shapes scale cleanly for large-format displays or print output.
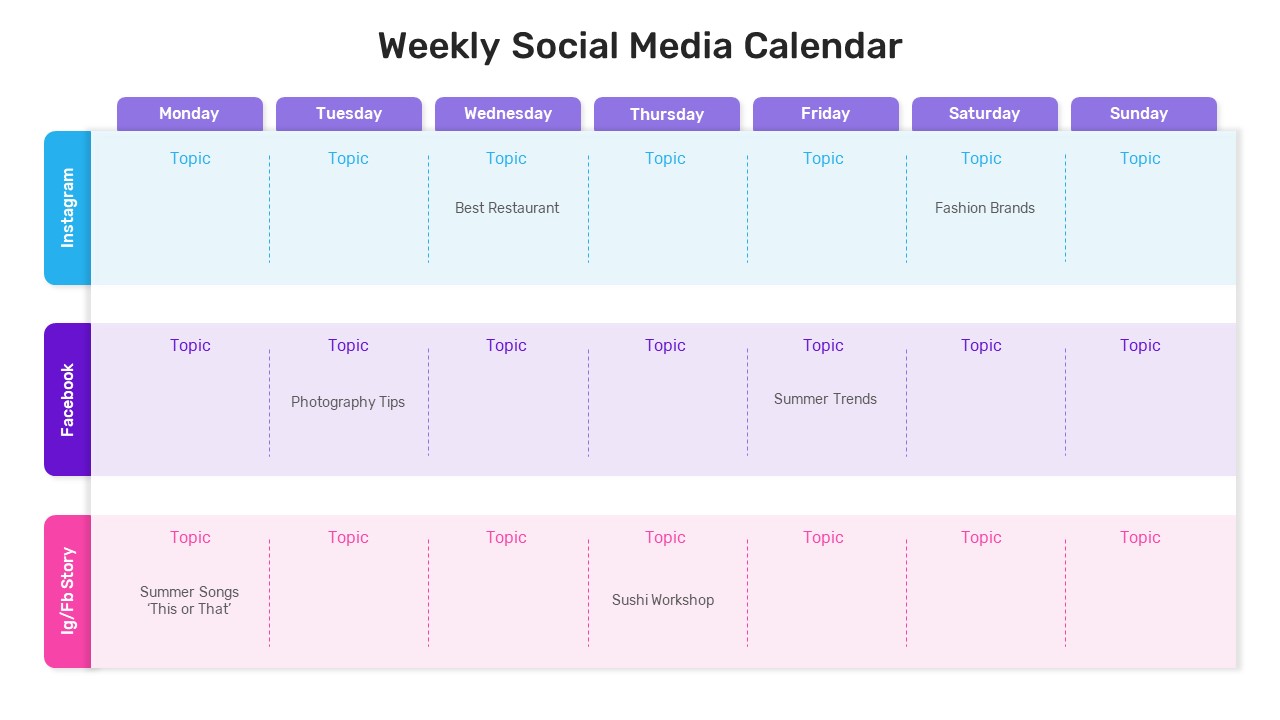
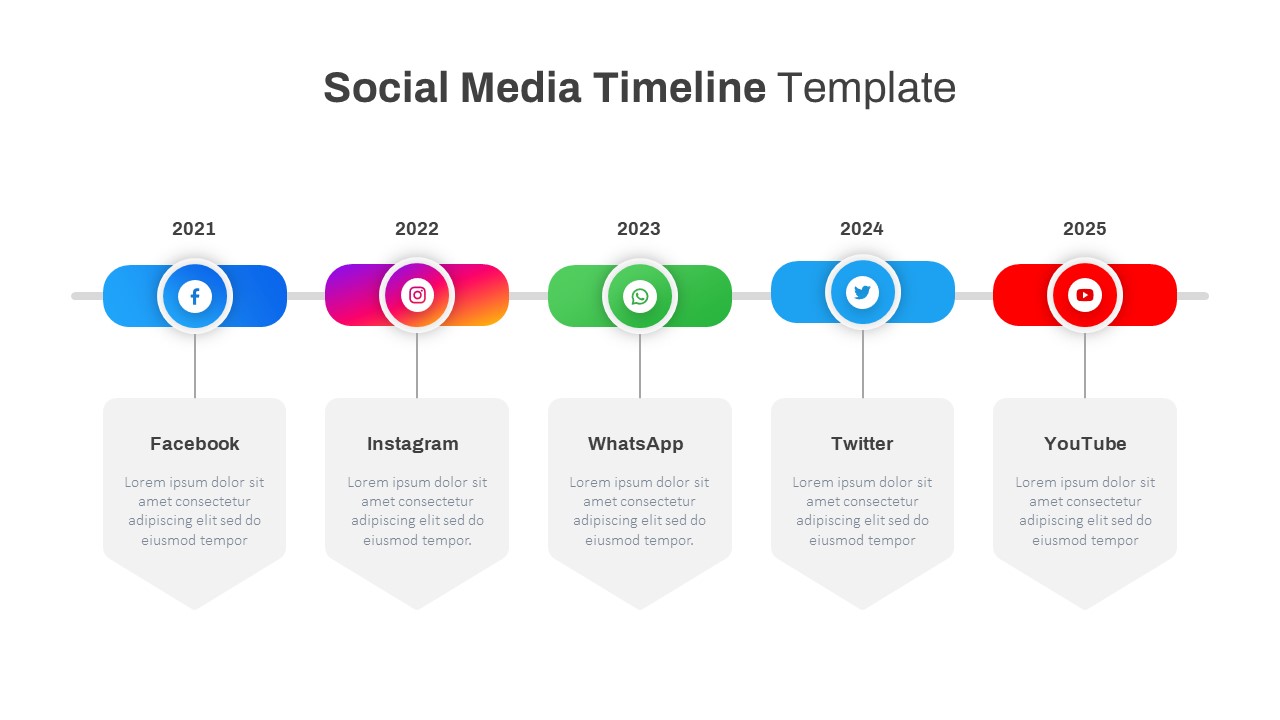
Use the built-in bar and pie charts to compare engagement rates across platforms, timeline layouts to map campaign schedules, and segmented sections to call out KPI trends. Slides can be added, removed, or duplicated without reworking the underlying structure, and the deck converts between landscape and portrait orientations without layout damage.
The template is fully compatible with Google Slides as well, so teams working across different tools can open and edit the file without any formatting issues.
The Right Structure for a Social Media Report for Presentations
The slide order is designed to follow a natural reporting logic: start with objectives and overview, move through individual platform breakdowns, then close with comparison data and performance conclusions. Whether you are reporting on ROI, audience demographics, or competitive benchmarking, the structure does the heavy lifting so you can focus on the insights rather than the layout.
Who Is This For
Social media managers, digital marketing specialists, marketing agencies, and brand strategists who need to report campaign results, benchmark platform performance, or deliver KPI dashboards to clients and executives in a format that looks polished and reads clearly.
Other Ways to Use It
The layouts adapt well for competitor analysis, influencer outreach planning, customer journey mapping, and annual marketing reviews. The comparison charts and demographics sections also work for brand audits, product launch roadmaps, and investor pitch decks where audience and engagement data need to be presented with credibility.
Login to download this file

Item ID
SB03433
Related Templates

Social Media Marketing Presentation Template for PowerPoint & Google Slides
Decks
Social Media Presentation Template for PowerPoint & Google Slides
Pitch Deck

Free Editable Social Media Users Map Template for PowerPoint & Google Slides
World Maps
Free
Social Media Metrics template for PowerPoint & Google Slides
Comparison Chart
Comprehensive Social Media Icons Slide Template for PowerPoint & Google Slides
Advertising

Social Media Hub & Spoke Model Template for PowerPoint & Google Slides
Process
Social Media Market Share Pie Charts Template for PowerPoint & Google Slides
Pie/Donut
Social Media Mind Network Infographic Template for PowerPoint & Google Slides
Digital Marketing
Social Media Rocket Launch Infographic Template for PowerPoint & Google Slides
Marketing
Mobile App Social Media Metaphor Template for PowerPoint & Google Slides
Infographics
Social Media Network Infographic Template for PowerPoint & Google Slides
Circular
Social Media Metaphor Illustration Template for PowerPoint & Google Slides
Digital Marketing
Social Media Performance Dashboard Template for PowerPoint & Google Slides
Bar/Column
Social Media Marketing Tool Template for PowerPoint & Google Slides
Digital Marketing
Free 3D Social Media Icons template for PowerPoint & Google Slides
Digital Marketing
Free
Social Media Smartphone Infographic Template for PowerPoint & Google Slides
Pie/Donut
Popular Social Media Comparison Grid Template for PowerPoint & Google Slides
Digital Marketing
Social Media Analytics Dashboard Template for PowerPoint & Google Slides
Digital Marketing

Social Media Marketing Agency Pitch Deck Template for PowerPoint & Google Slides
Pitch Deck
Social Media Community Network Slide Template for PowerPoint & Google Slides
Circular
Weekly Social Media Calendar Editable Template
Digital Marketing
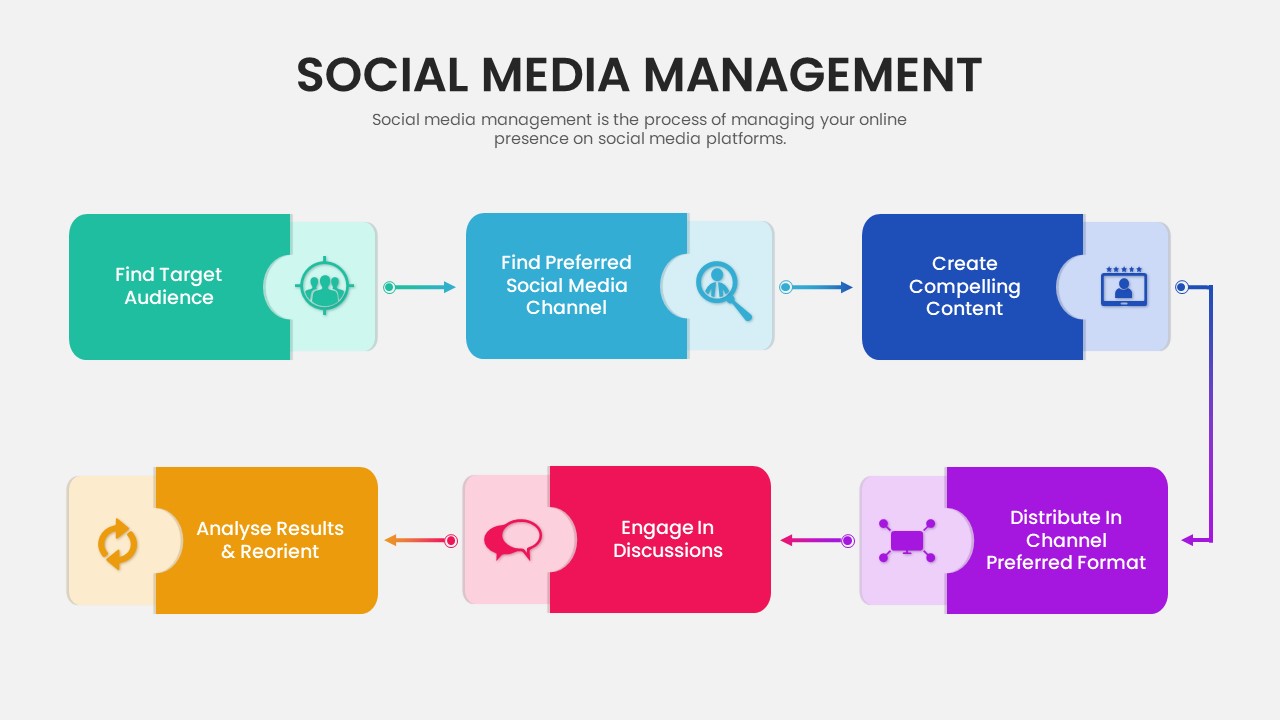
Six-Step Social Media Management Process Template for PowerPoint & Google Slides
Process
Modern Social Media Infographics Template for PowerPoint & Google Slides
Digital Marketing
Social Media Infographic Arrow Layout Template for PowerPoint & Google Slides
Arrow
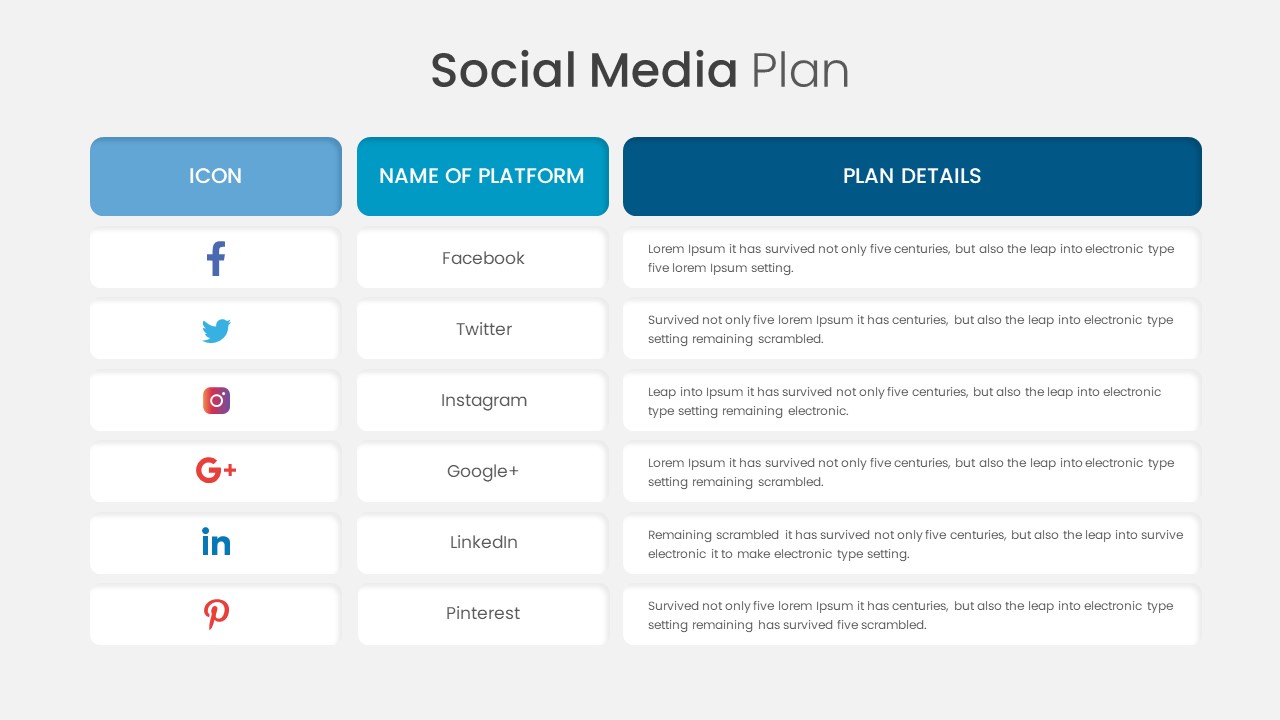
Social Media Plan Table Slide Deck Template for PowerPoint & Google Slides
Process
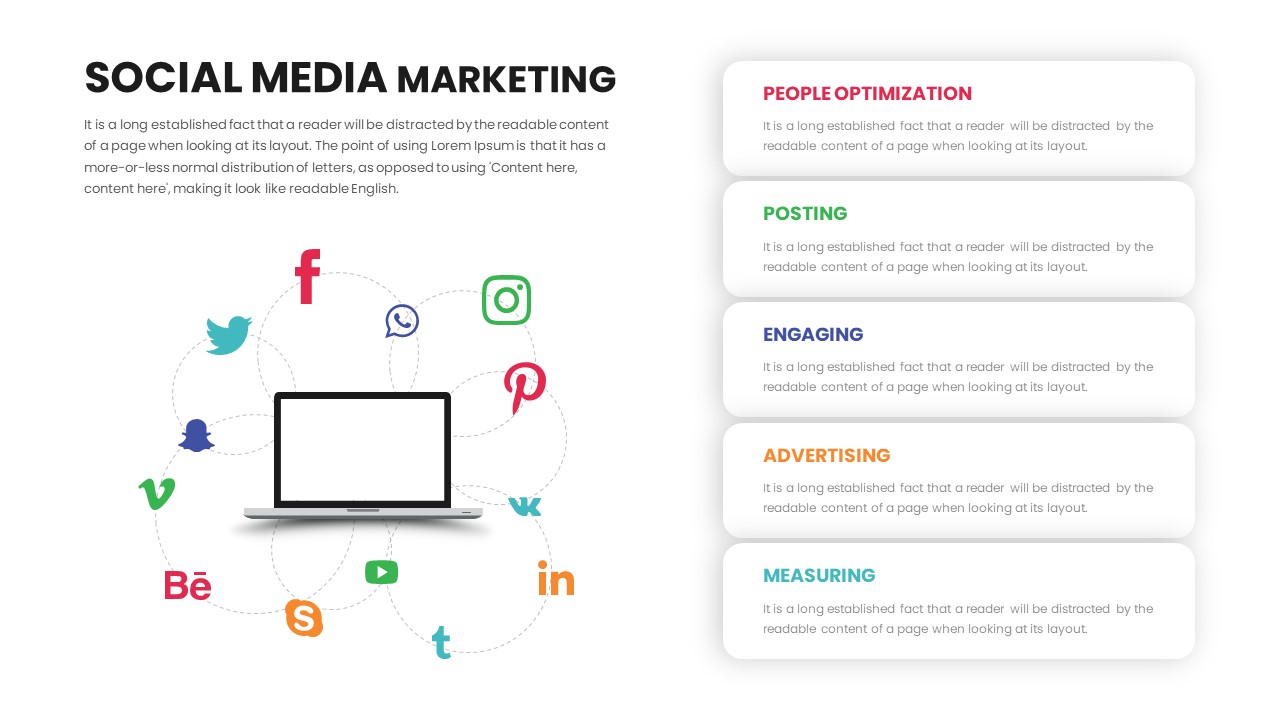
Social Media Marketing Connection Template for PowerPoint & Google Slides
Digital Marketing
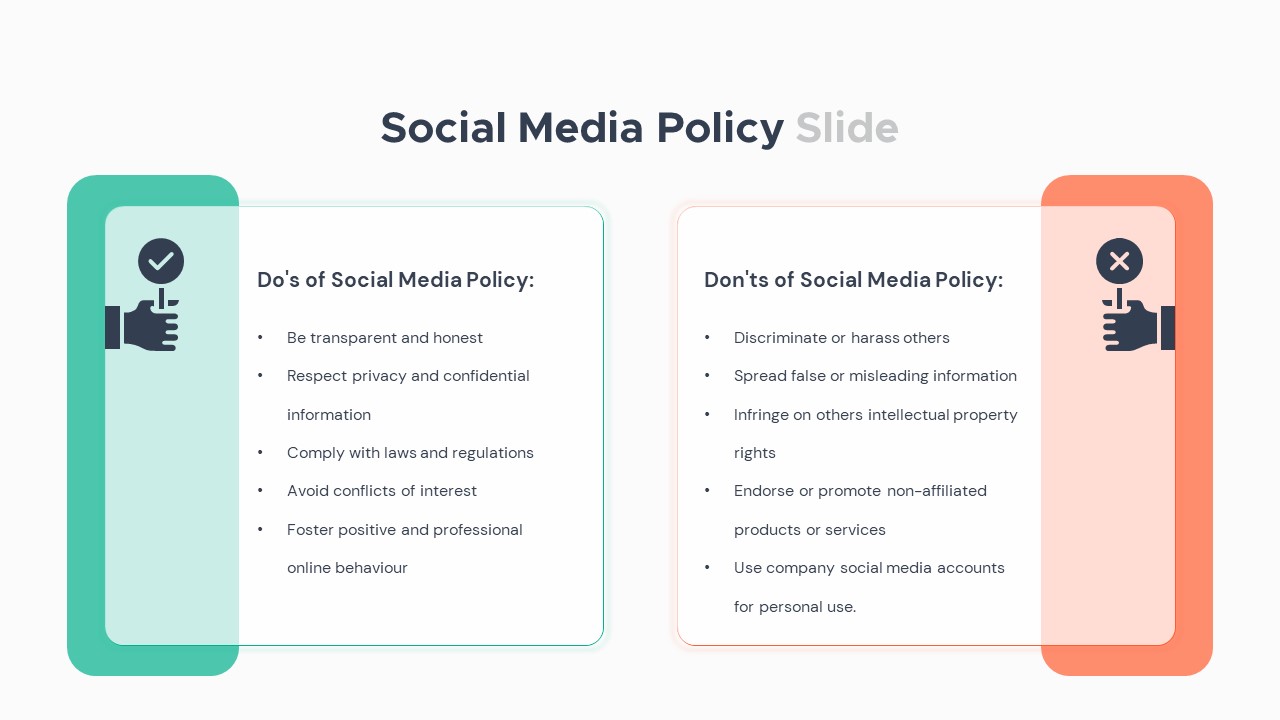
Social Media Policy Dos & Don’ts Slide Template for PowerPoint & Google Slides
Comparison
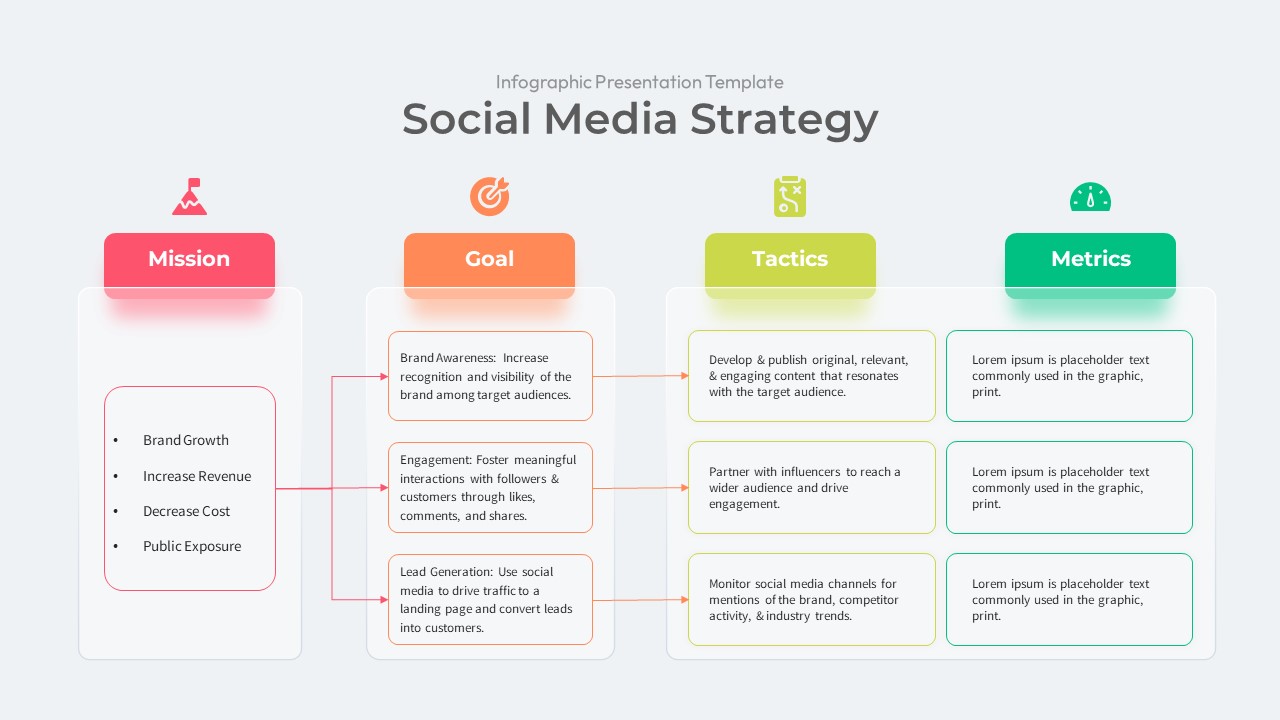
Social Media Strategy Infographic Presentation Template
Digital Marketing
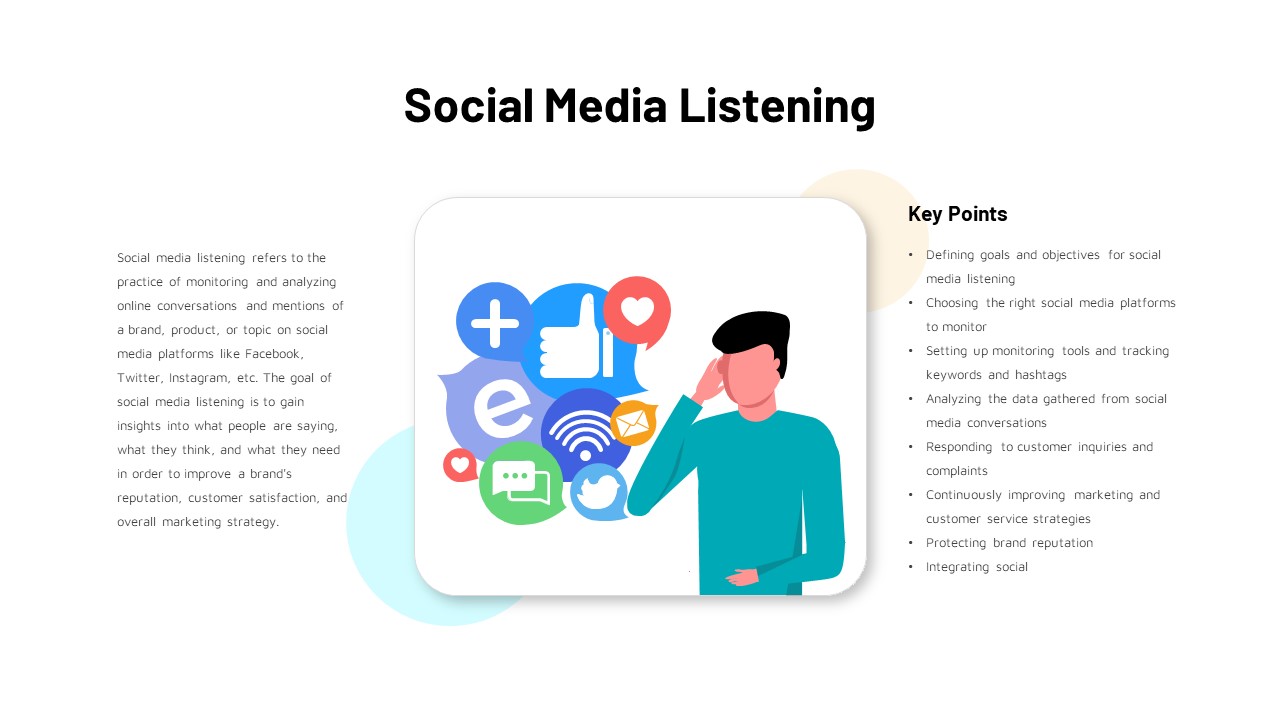
Social Media Listening Overview Slide Template for PowerPoint & Google Slides
Customer Experience
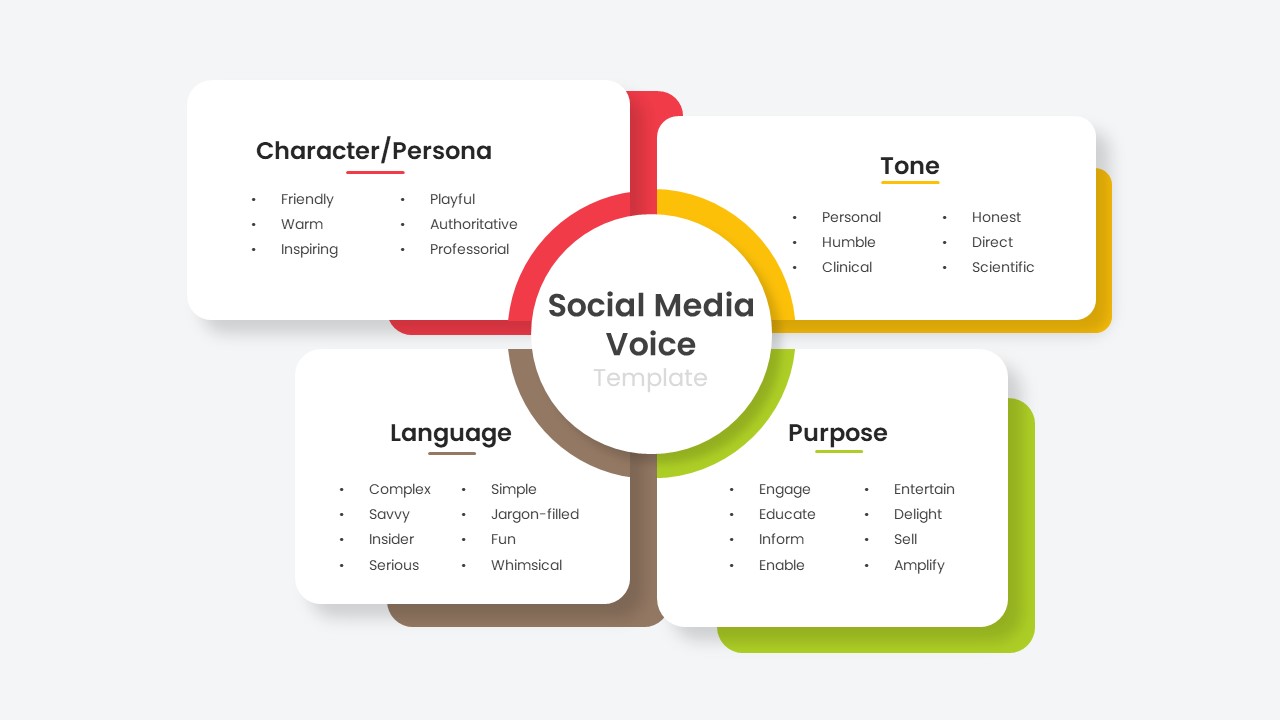
Social Media Voice Template for PowerPoint & Google Slides
Customer Experience
Social Media Hub-and-Spoke Infographics Template for PowerPoint & Google Slides
Circular
Social Media Analysis Metrics Slide Deck Template for PowerPoint & Google Slides
Digital Marketing
Twitter Social Media Infographic Template for PowerPoint & Google Slides
Circular
Social Media Statistics 2023 Dashboard Template for PowerPoint & Google Slides
Comparison
Comprehensive Social Media Audit Template for PowerPoint & Google Slides
Digital Marketing
Modern Social Media Timeline Roadmap Template for PowerPoint & Google Slides
Timeline
Free Social Media Hub-and-Spoke Infographic Template for PowerPoint & Google Slides
Circular
Free
Social Media Marketing Overview Template for PowerPoint & Google Slides
Advertising
Social Media Timeline template for PowerPoint & Google Slides
Timeline
Social Media Recruiting Strategy template for PowerPoint & Google Slides
Business
Social Media Network Hub Diagram Slide for PowerPoint & Google Slides
Process
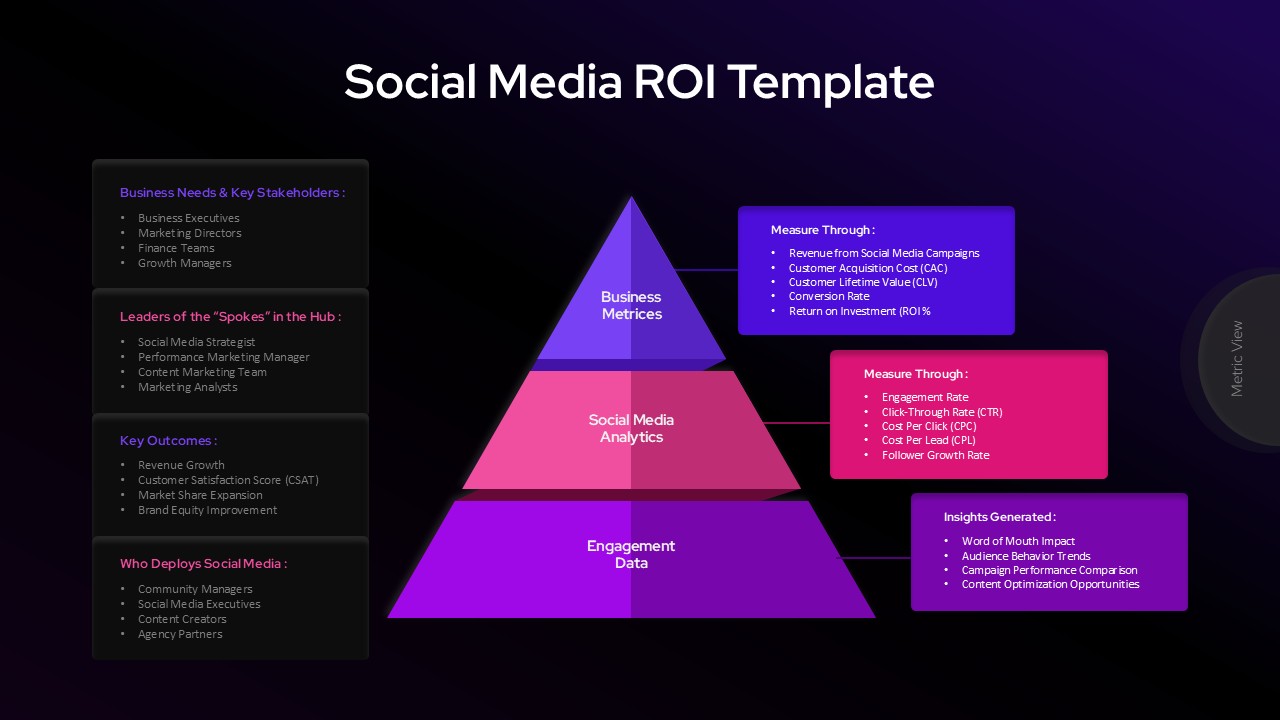
Social Media Marketing ROI Infographic Template for PowerPoint
Digital Marketing
Social Work PowerPoint Template For Free
Pitch Deck
Free

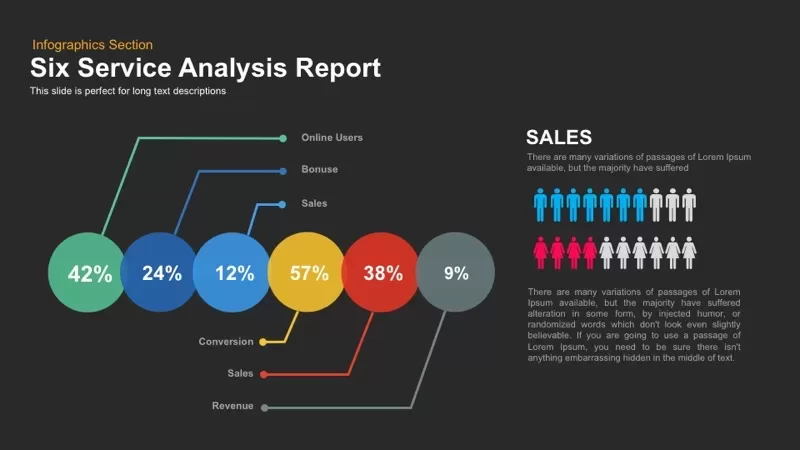
Six Service Analysis Report template for PowerPoint & Google Slides
Infographics
E-Learning Report Analysis Template for PowerPoint & Google Slides
Infographics
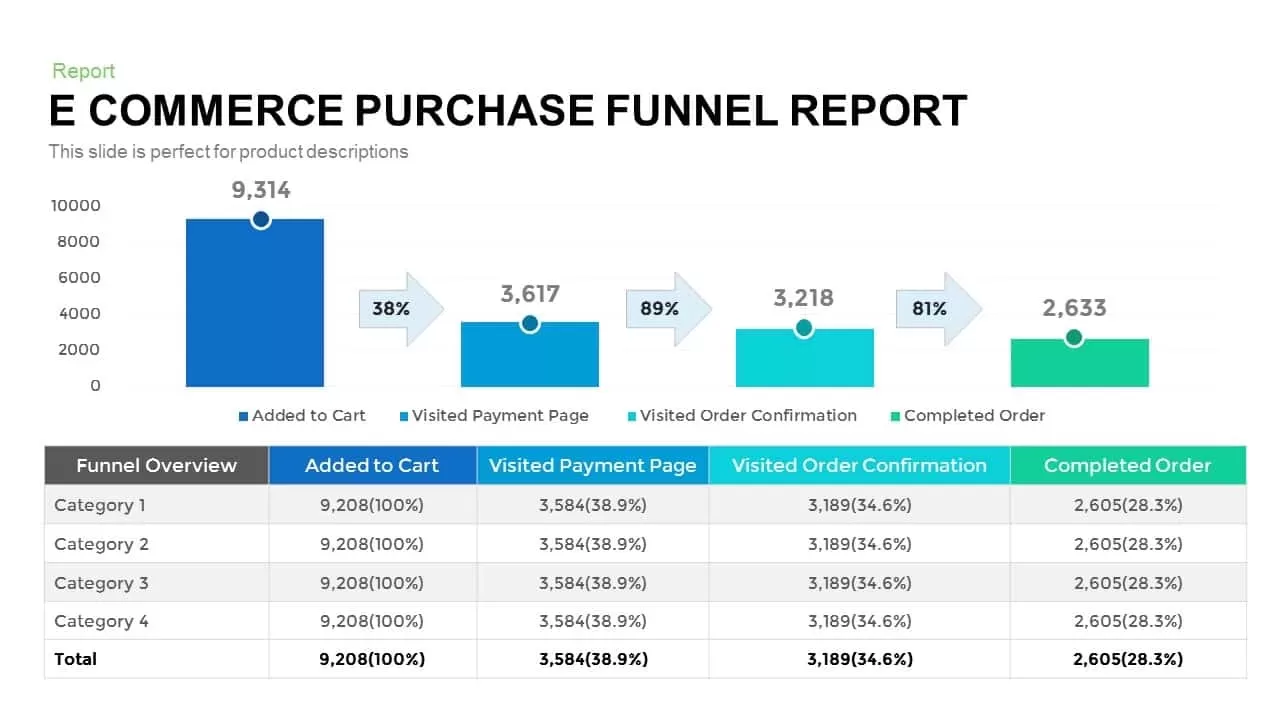
E-commerce Purchase Funnel Report template for PowerPoint & Google Slides
Funnel
Annual Report Template for PowerPoint & Google Slides
Company Profile
Digital Marketing Report Deck Template for PowerPoint & Google Slides
Pitch Deck
Professional Sales Performance Report Template for PowerPoint & Google Slides
Business Report
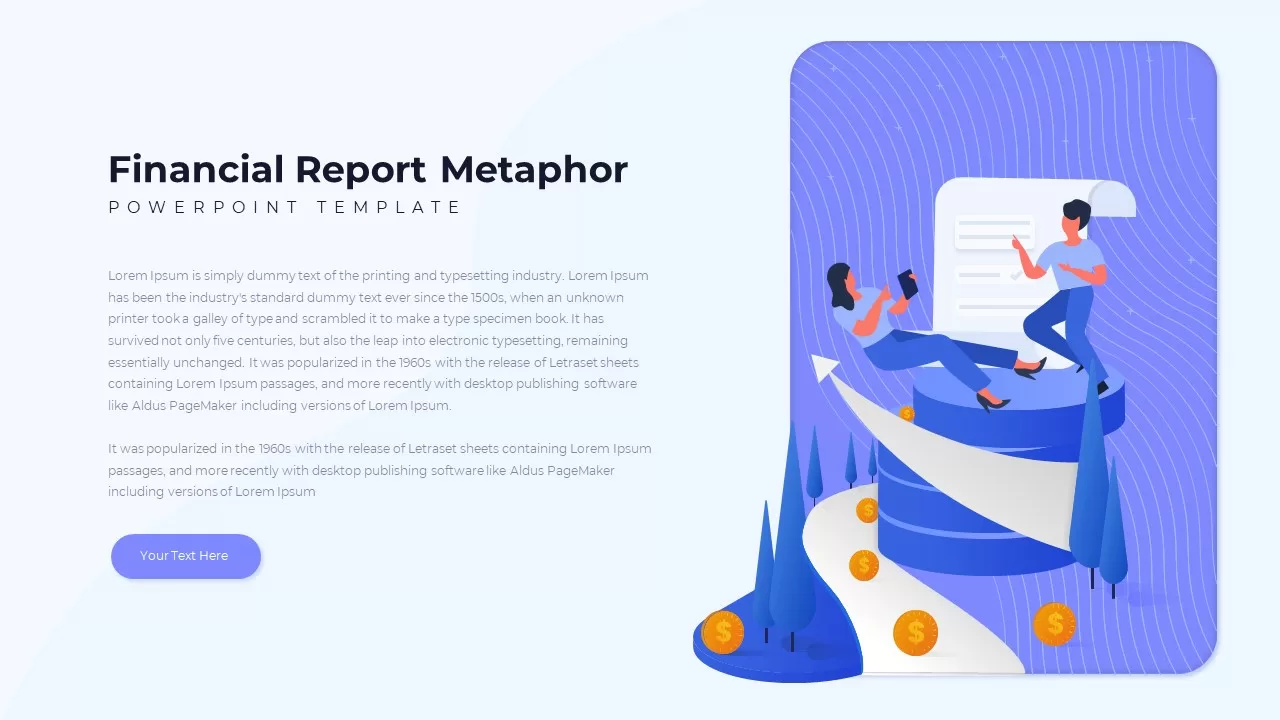
Financial Report Metaphor Illustration Template for PowerPoint & Google Slides
Finance
Annual Report Overview Template for PowerPoint & Google Slides
Decks
Comprehensive Recruitment Metrics Report Template for PowerPoint & Google Slides
Recruitment
Project Status Report PowerPoint Template
Project Status
Weekly Report template for PowerPoint & Google Slides
Infographics
Classic Newspaper Report Slide Template for PowerPoint & Google Slides
Graphics
Income Statement Financial Report Template for PowerPoint & Google Slides
Business Report
Weekly Status Report Dashboard Template for PowerPoint & Google Slides
HR
Business One Pager Template PowerPoint & Google Slides
Business Report
One Pager Annual Report Template
Business Report
Internal Audit Report & Recommendations Template for PowerPoint & Google Slides
Business Report
HR Report Dashboard Template for PowerPoint & Google Slides
Employee Performance
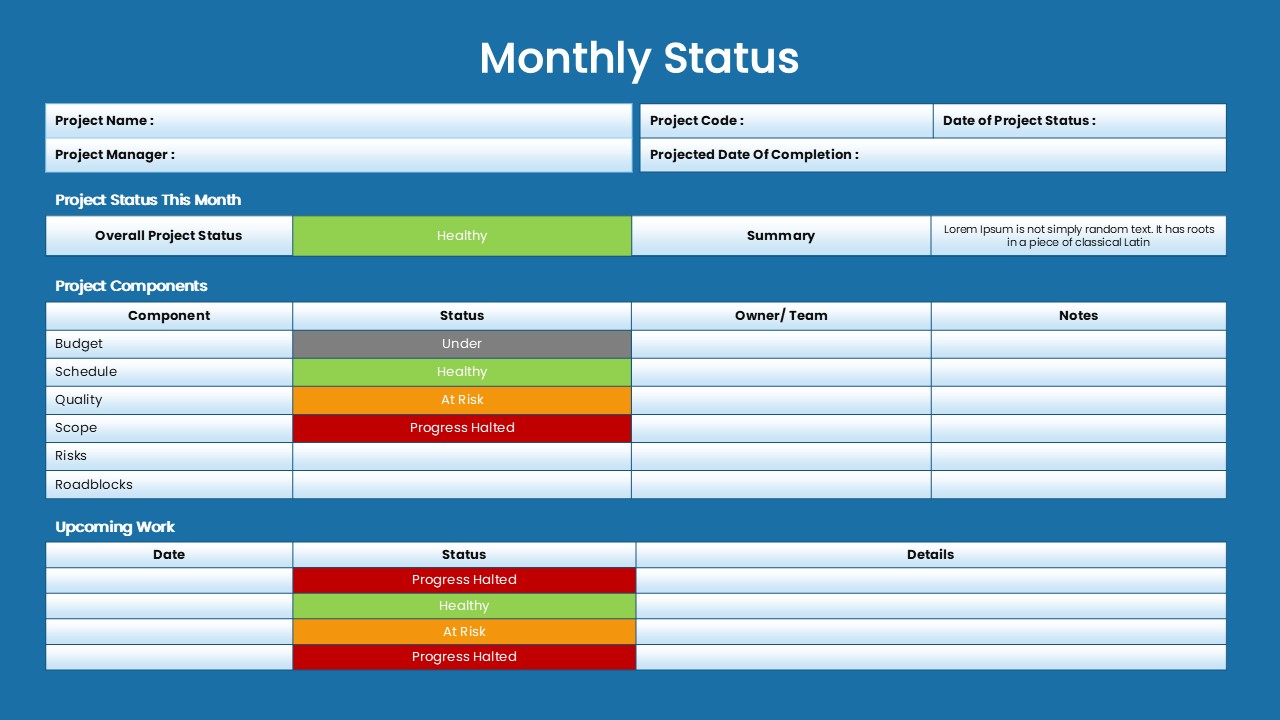
Monthly Status Report Template for PowerPoint & Google Slides
Project Status
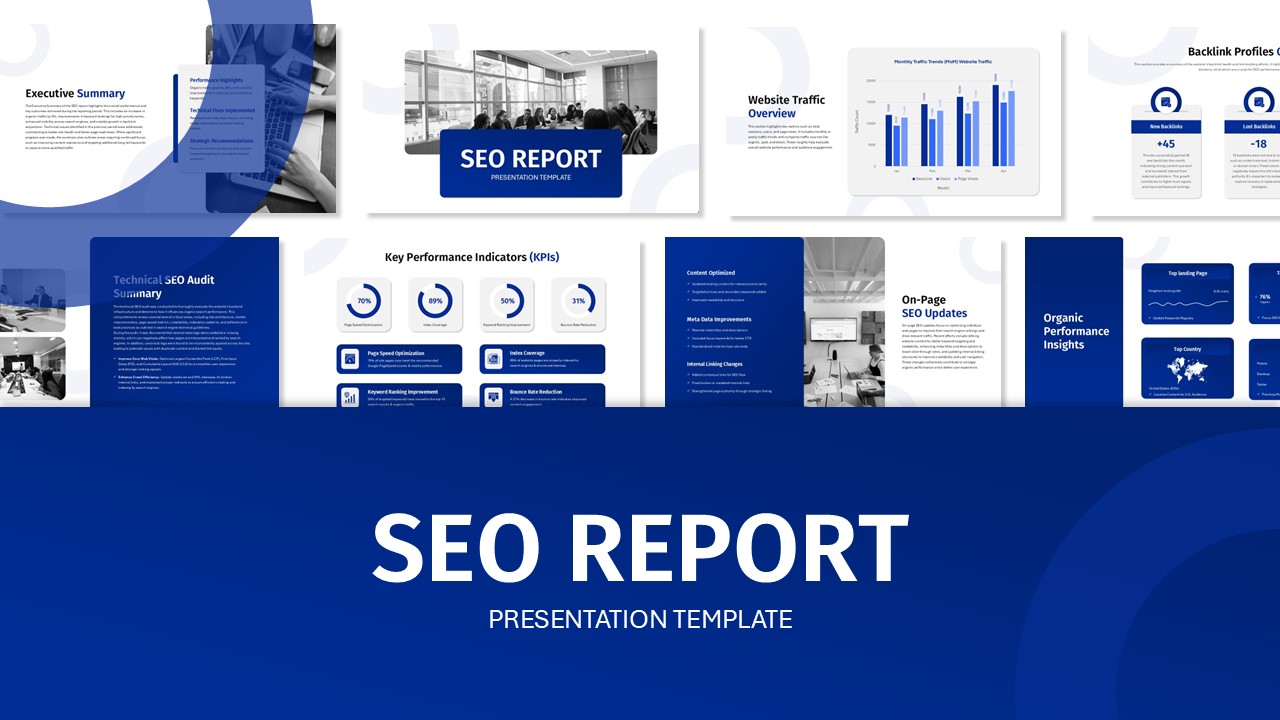
SEO Performance Report Overview template for PowerPoint & Google Slides
Digital Marketing
Project Status Dashboard Report Template for PowerPoint & Google Slides
Project Status
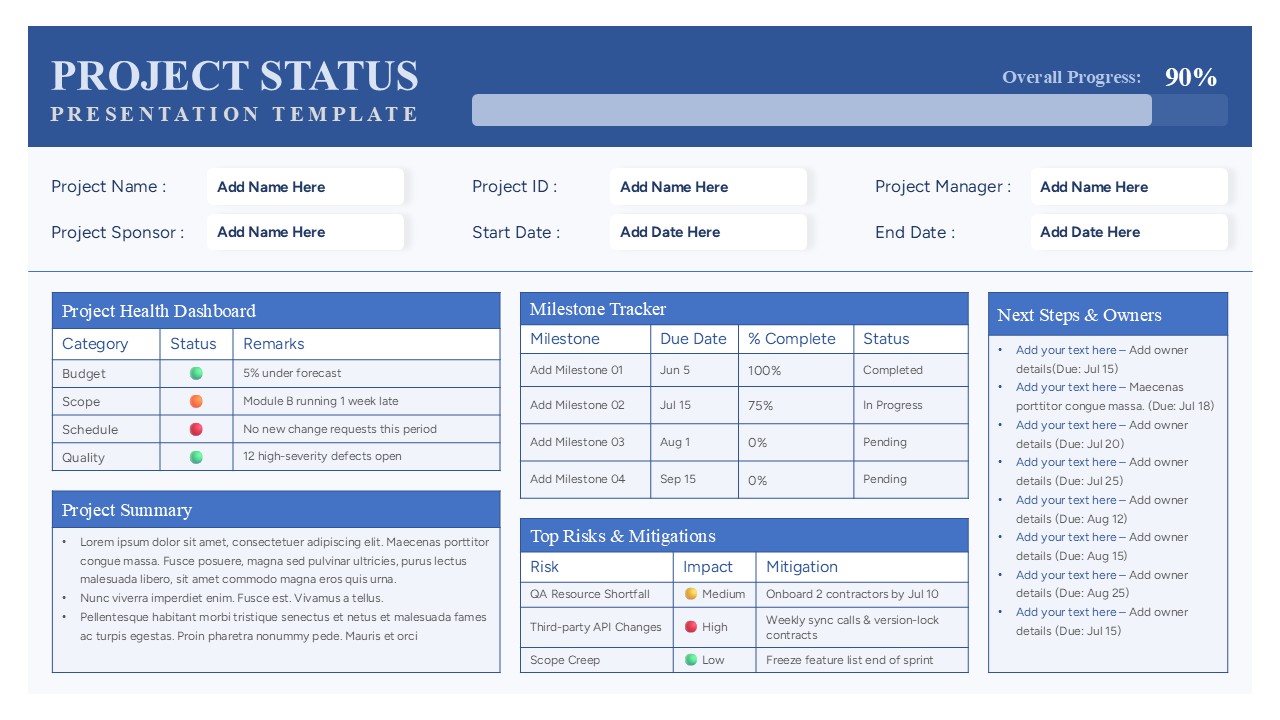
Comprehensive Project Status Report Template for PowerPoint & Google Slides
Project Status
Employee Headcount Dashboard Report Template for PowerPoint & Google Slides
Employee Performance
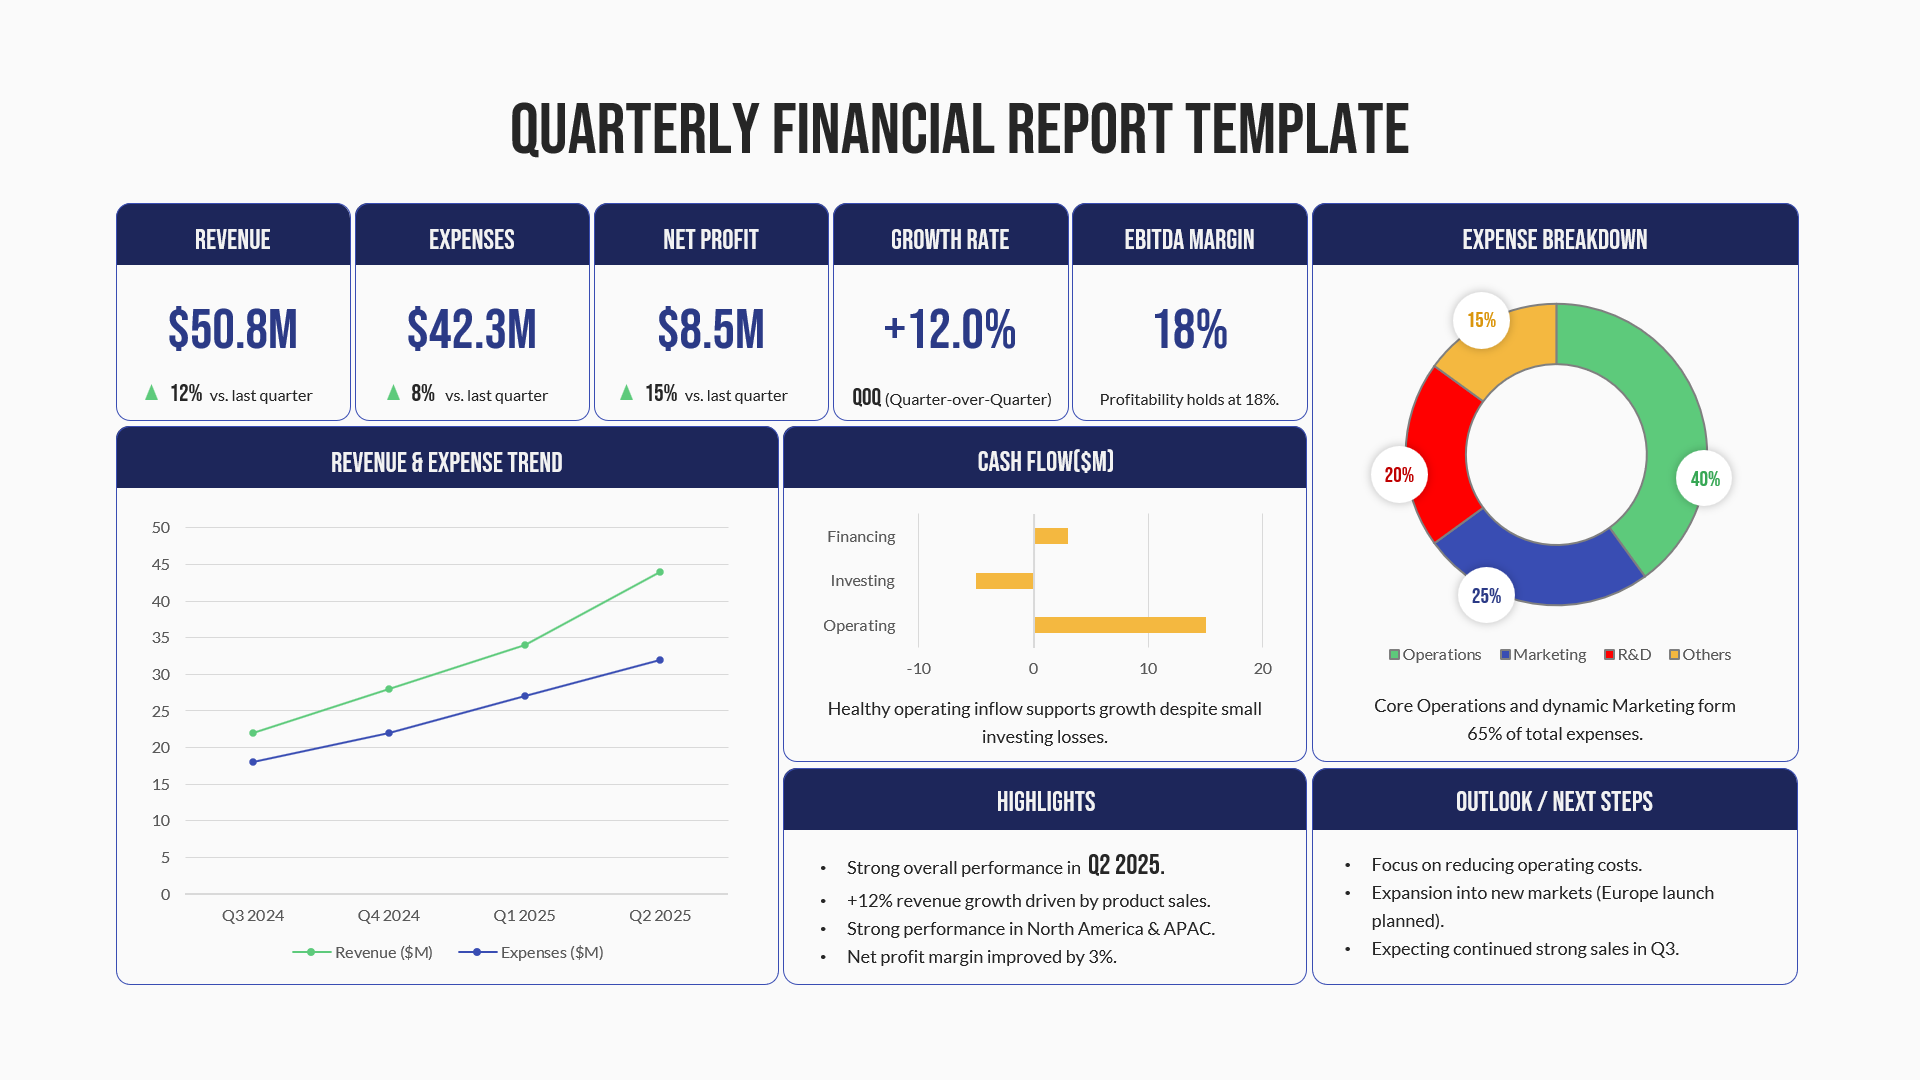
Quarterly Financial Report Dashboard Template for PowerPoint & Google Slides
Finance
Consulting Report for PowerPoint & Google Slides
Business
Project Status Report Template PPT – Free Download
Project Status
Free
Free Annual Business Report Slide for PowerPoint & Google Slides
Finance
Free
After Action Review Report Template PPT And Google Slides
Process

News Metaphor Media Communication Slide Template for PowerPoint & Google Slides
Business Report
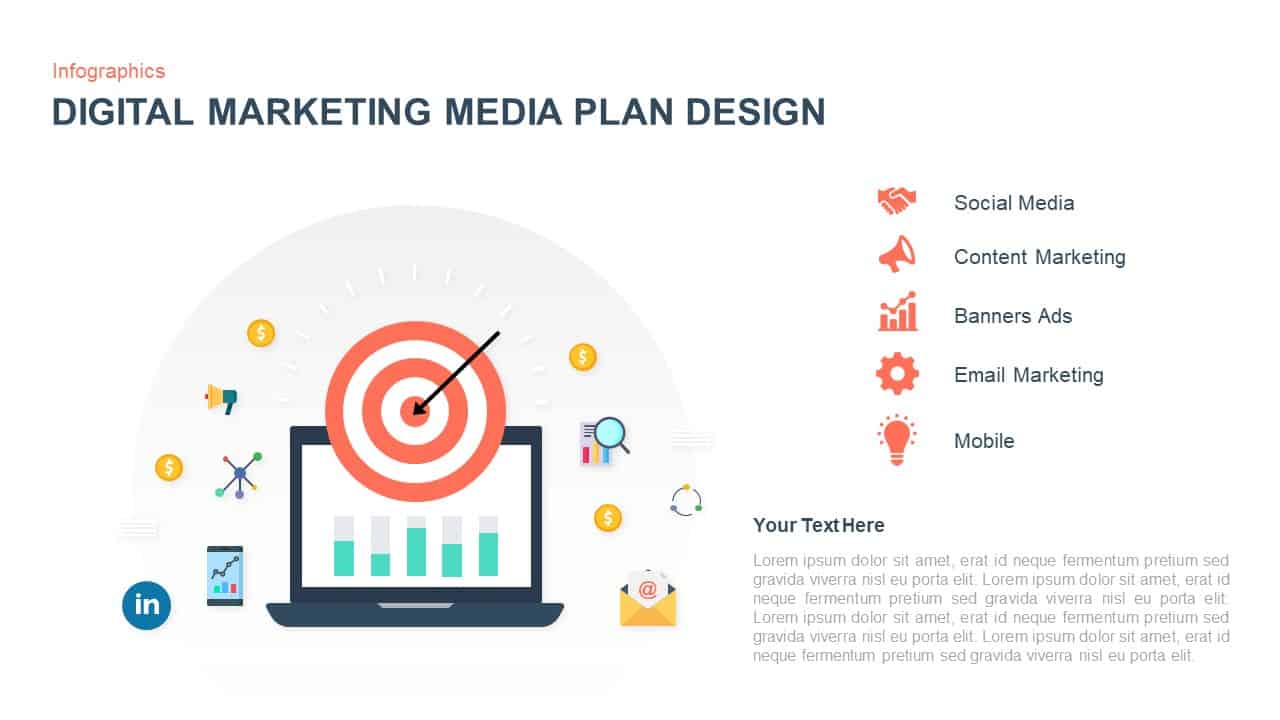
Digital Marketing Media Plan Infographic Template for PowerPoint & Google Slides
Digital Marketing
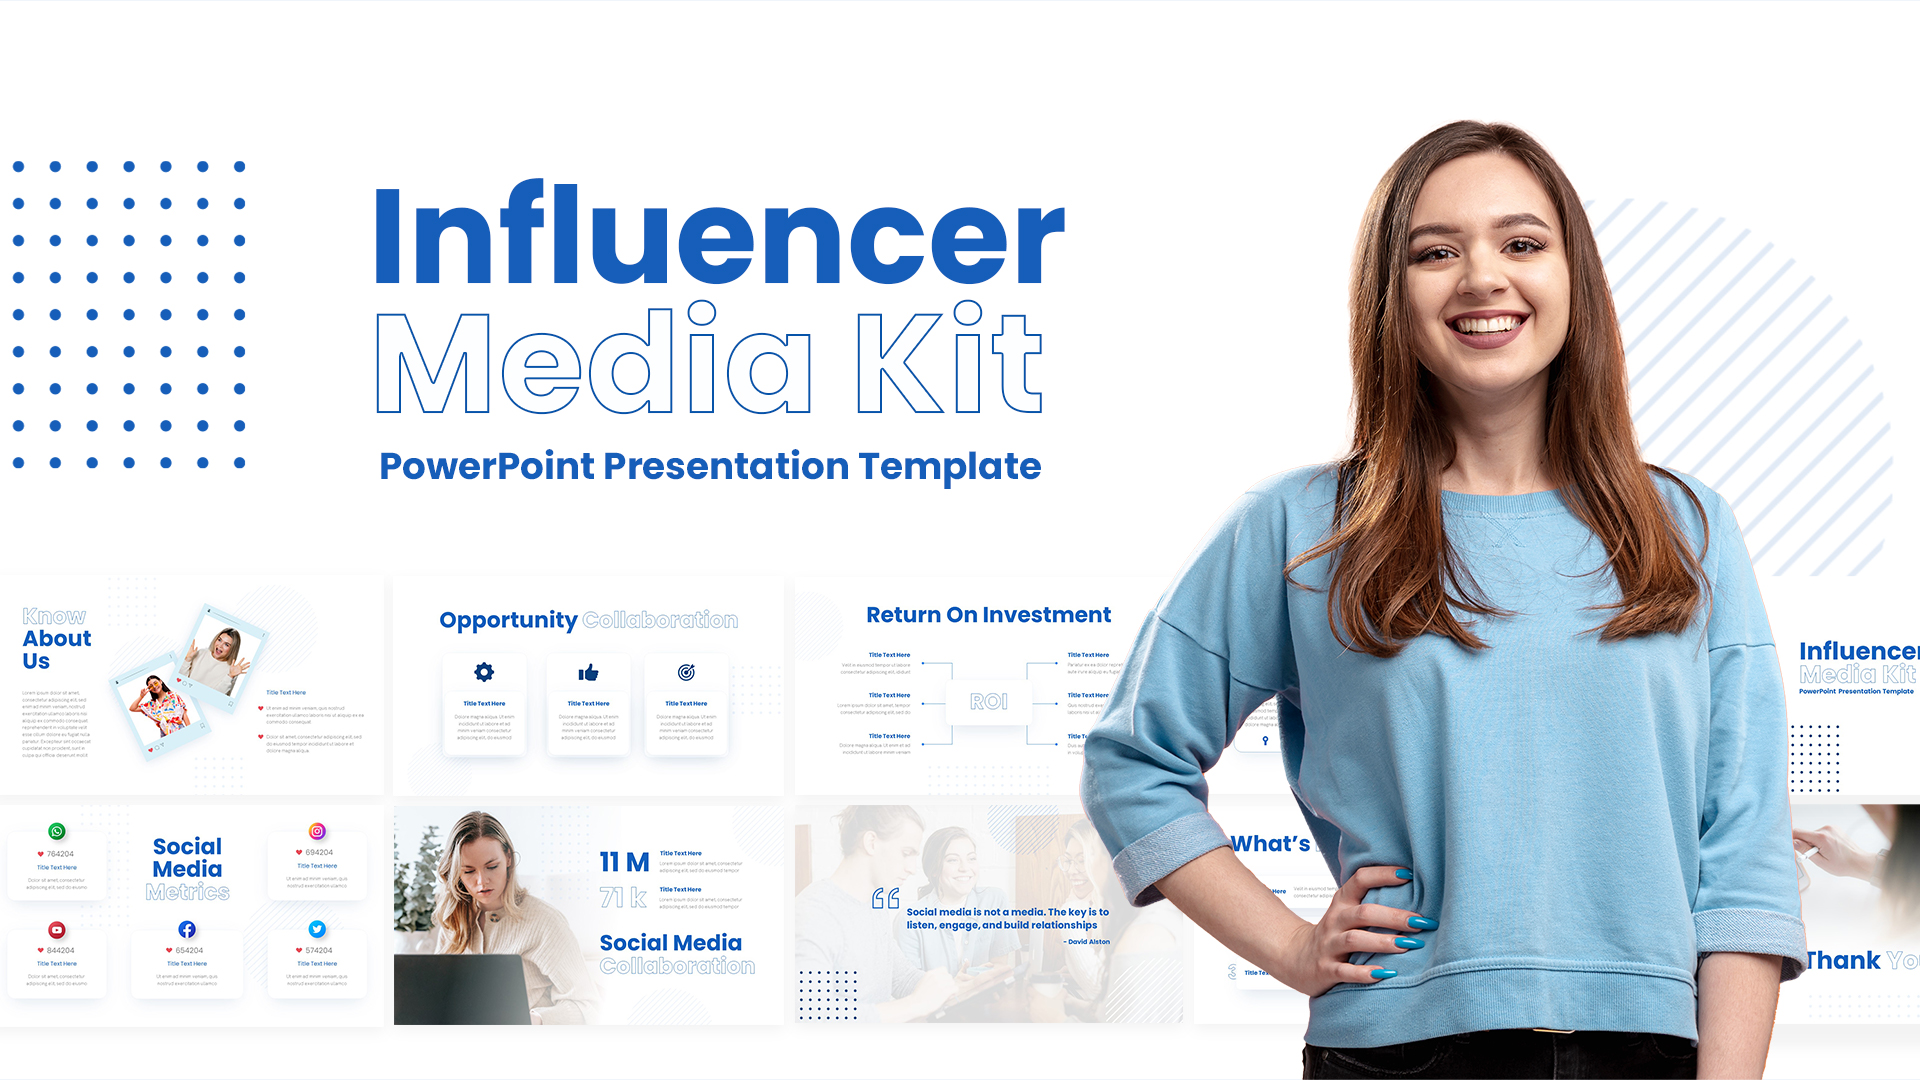
Influencer Media Kit Company Profile Template for PowerPoint & Google Slides
Company Profile
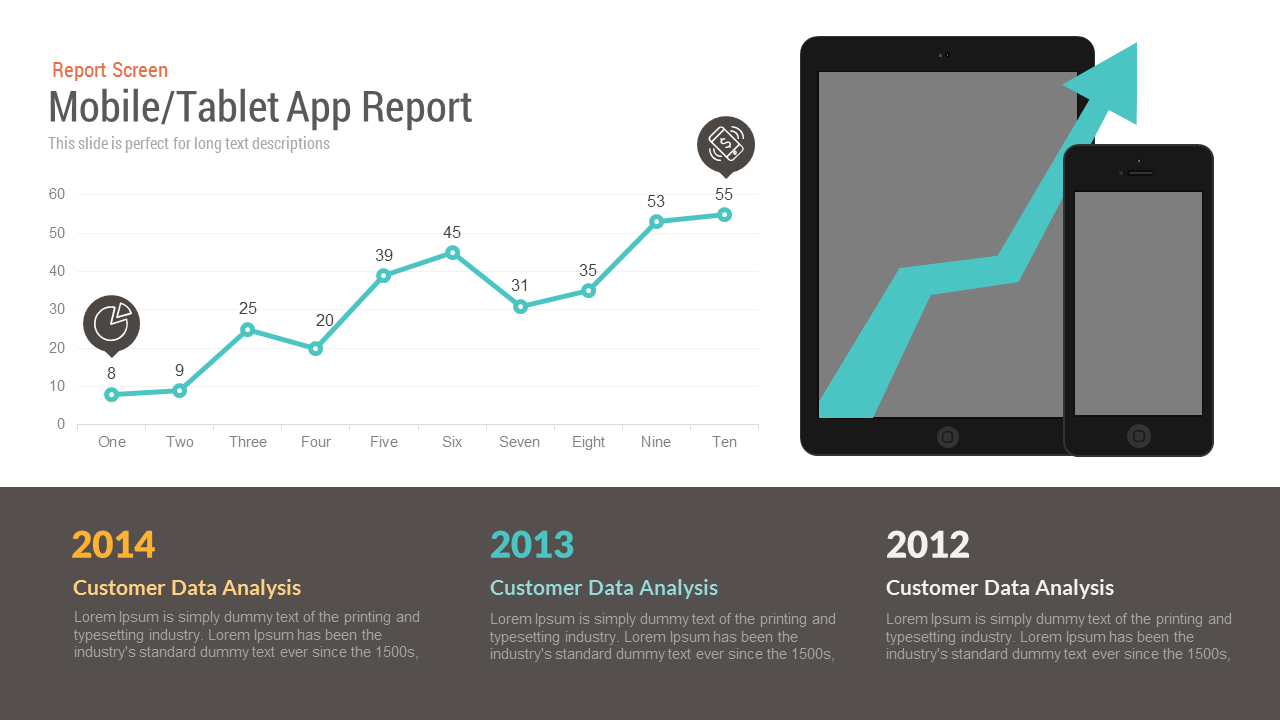
Free Mobile/Tablet App Report Presentation Template
Charts
Free
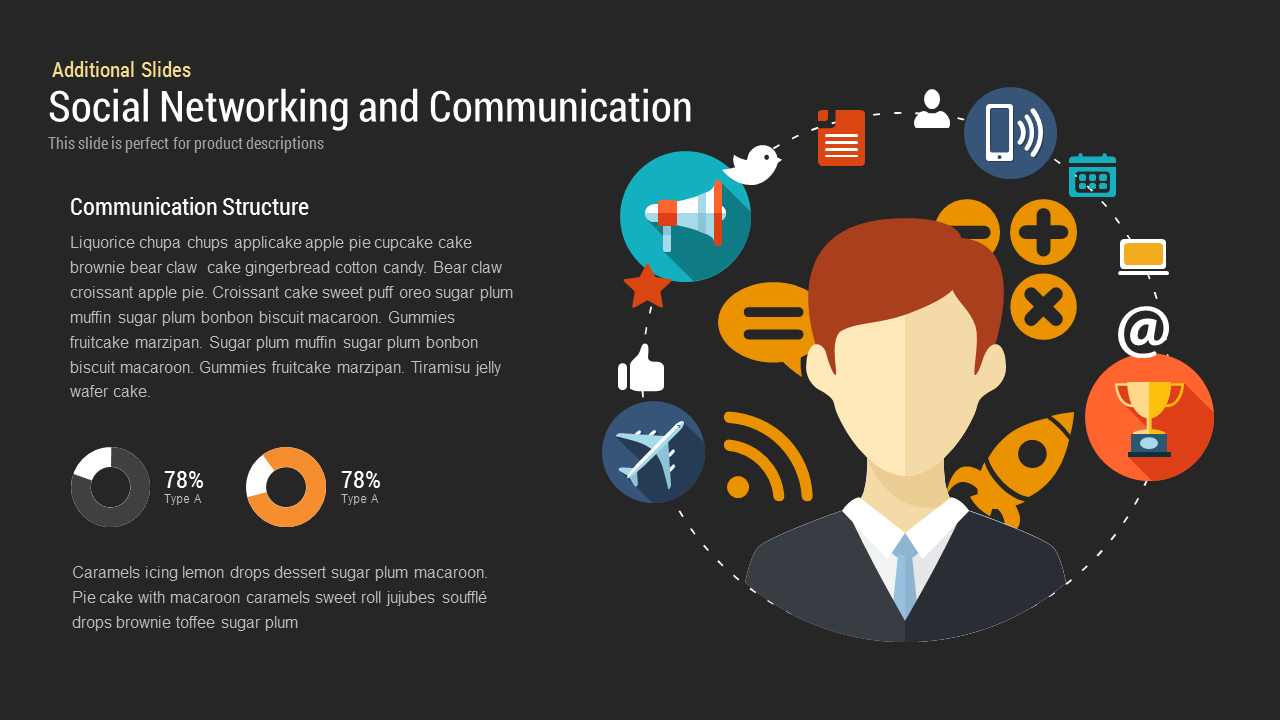
Social Networking and Communication Template Editable In PowerPoint & Google Slides
Digital Marketing
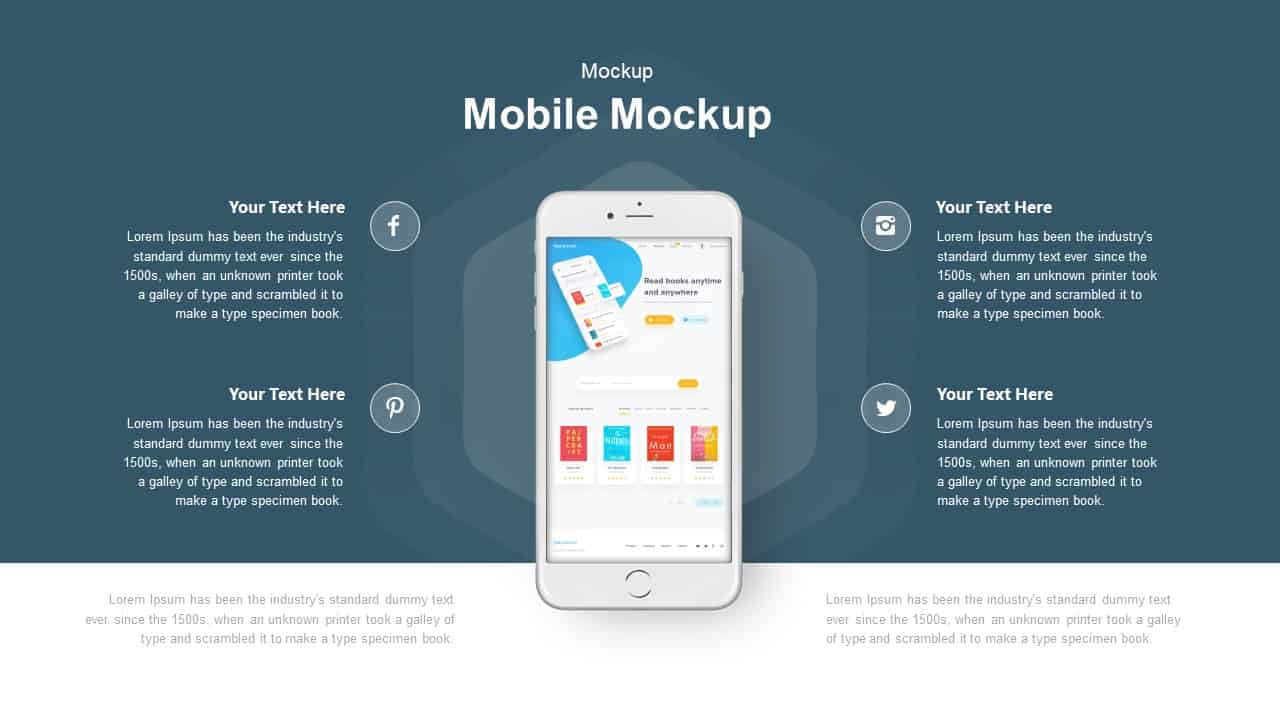
Mobile Mockup with Social Callouts Template for PowerPoint & Google Slides
Software Development
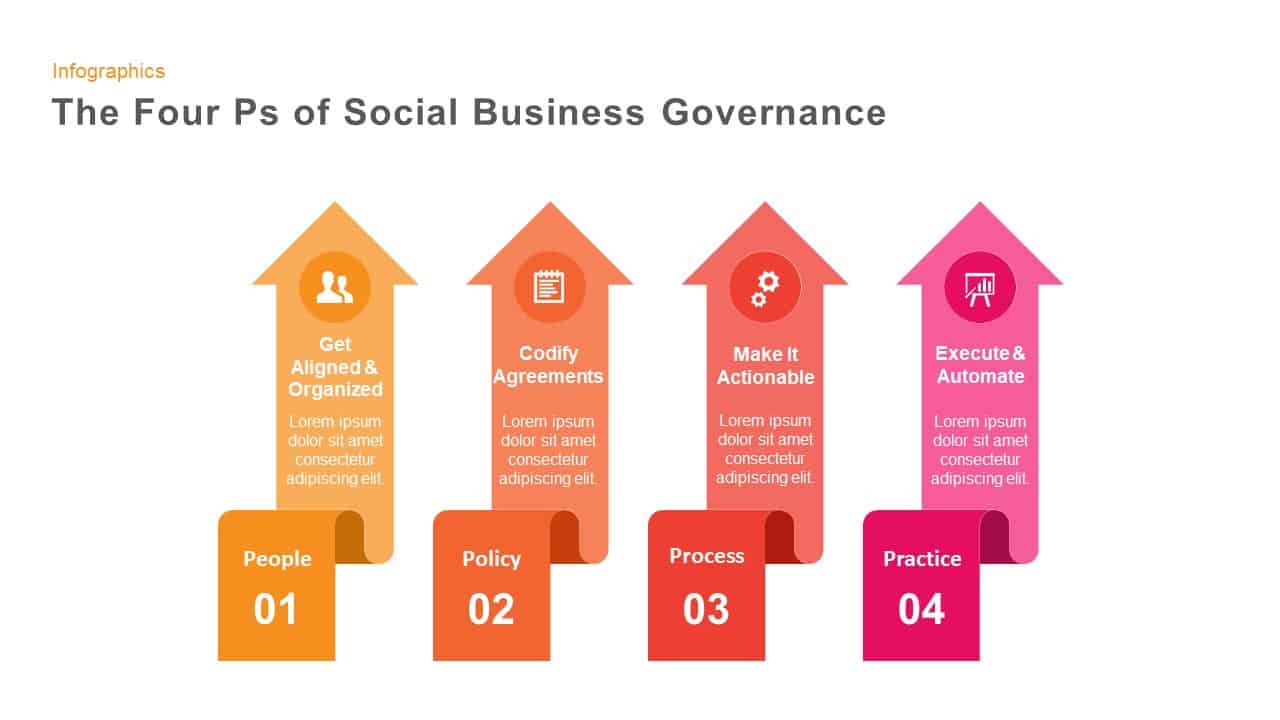
Four Ps of Social Business Governance template for PowerPoint & Google Slides
Business Strategy
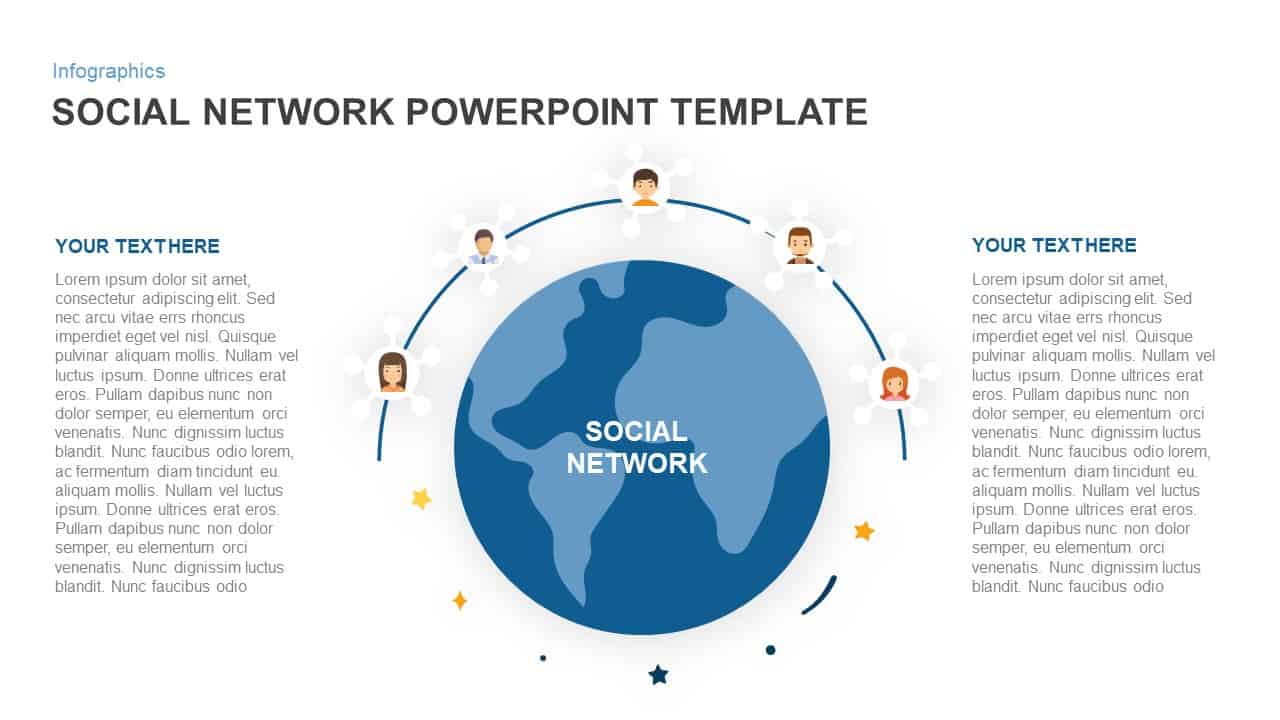
Social Network Connectivity Infographic Template for PowerPoint & Google Slides
Infographics
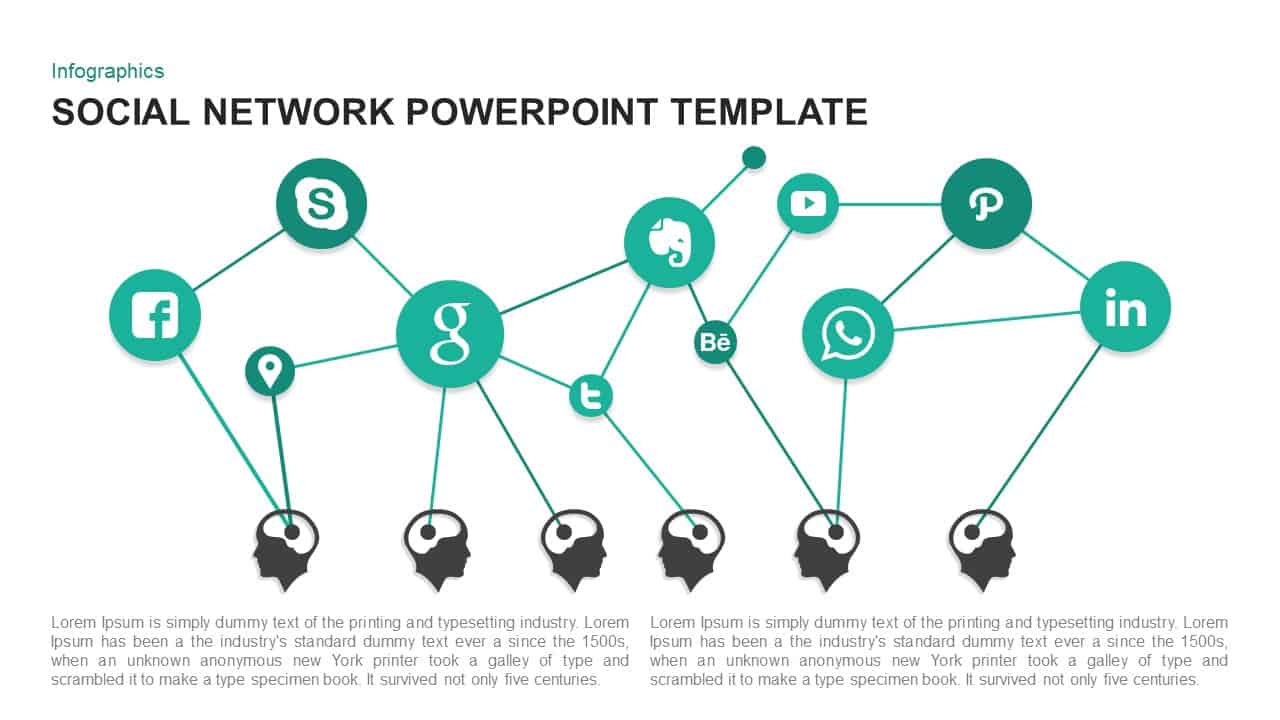
Social Network Infographic Diagram Template for PowerPoint & Google Slides
Digital Marketing
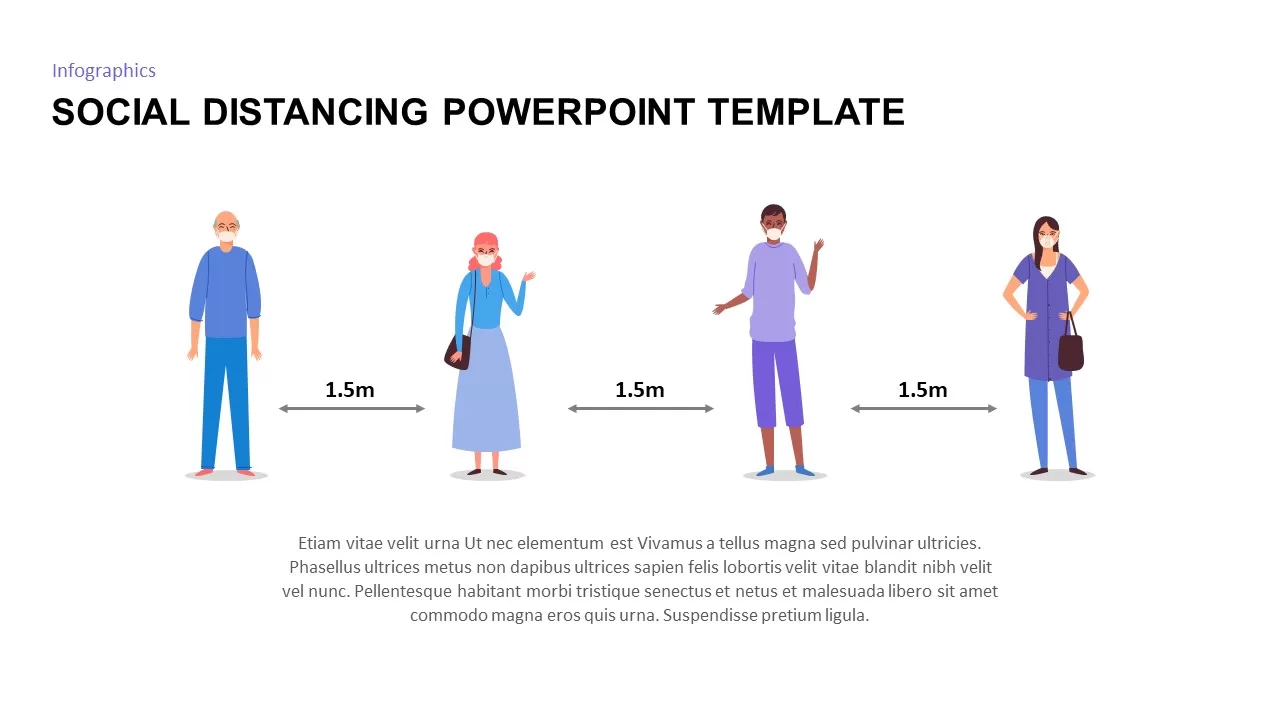
Social Distancing PowerPoint & Google Slides Template
Business Strategy
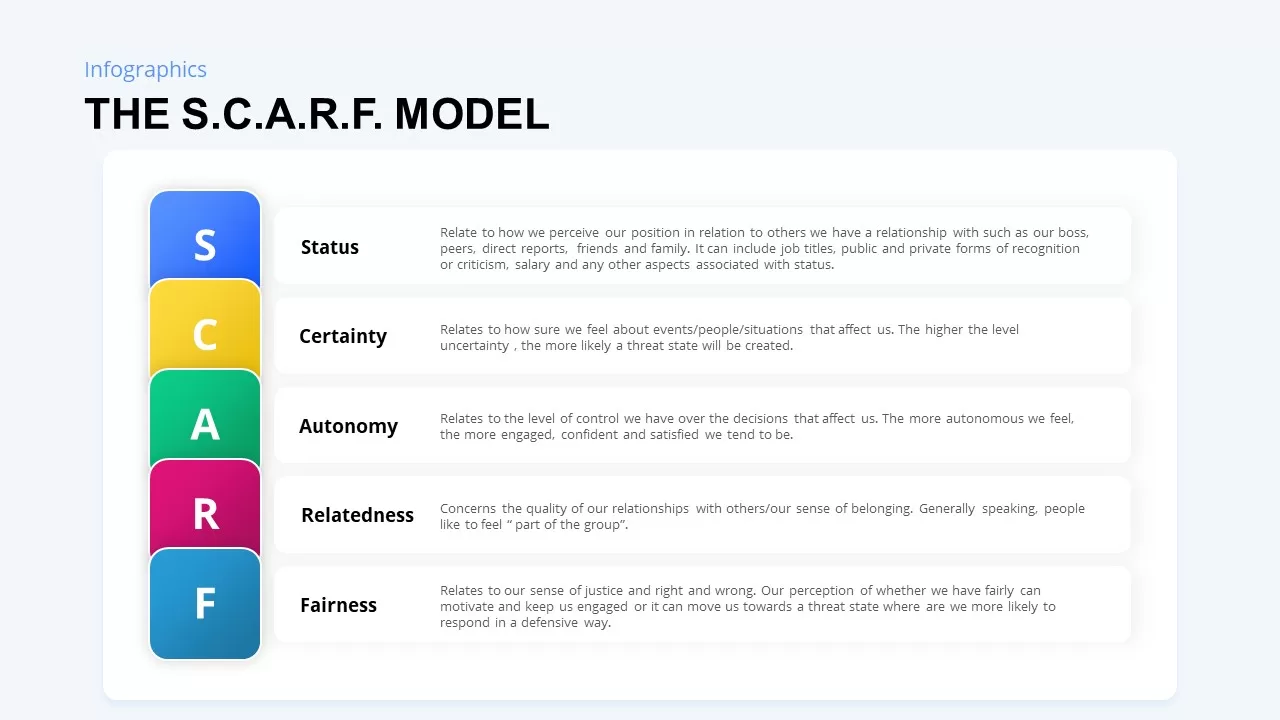
SCARF Model Social Threats & Rewards Template for PowerPoint & Google Slides
Business Strategy
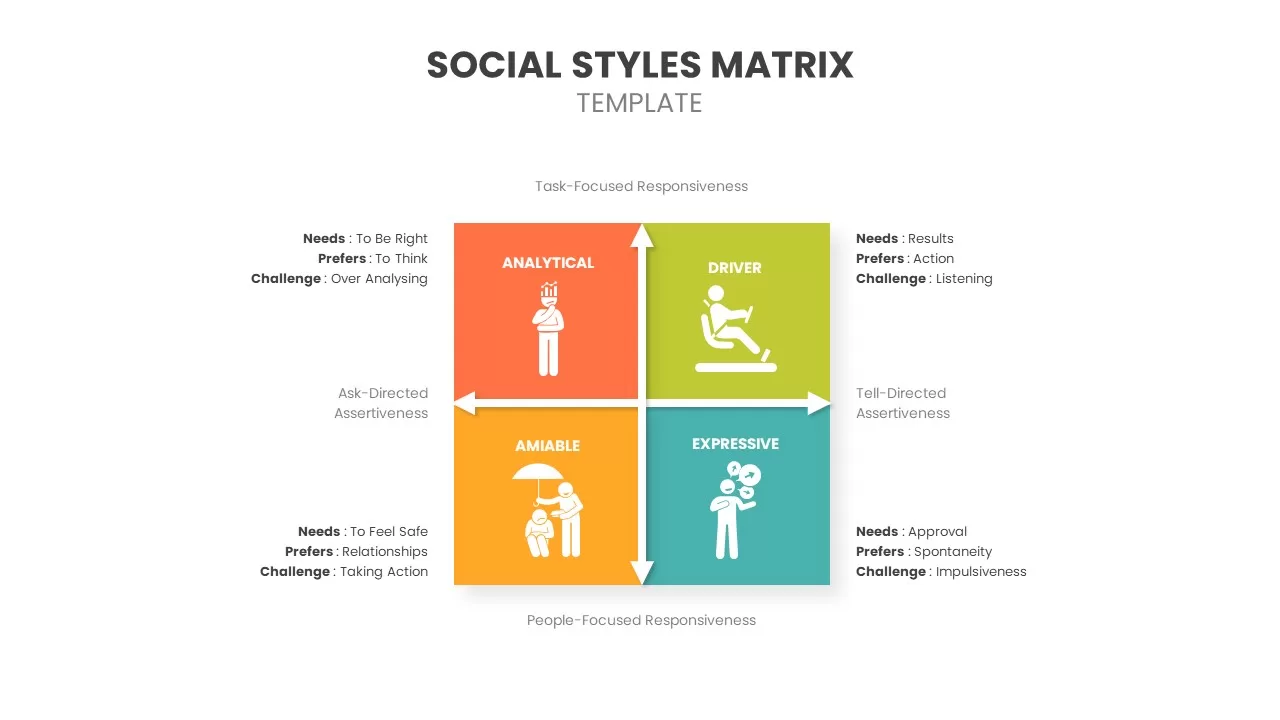
Social Styles Matrix Template for PowerPoint & Google Slides
Business
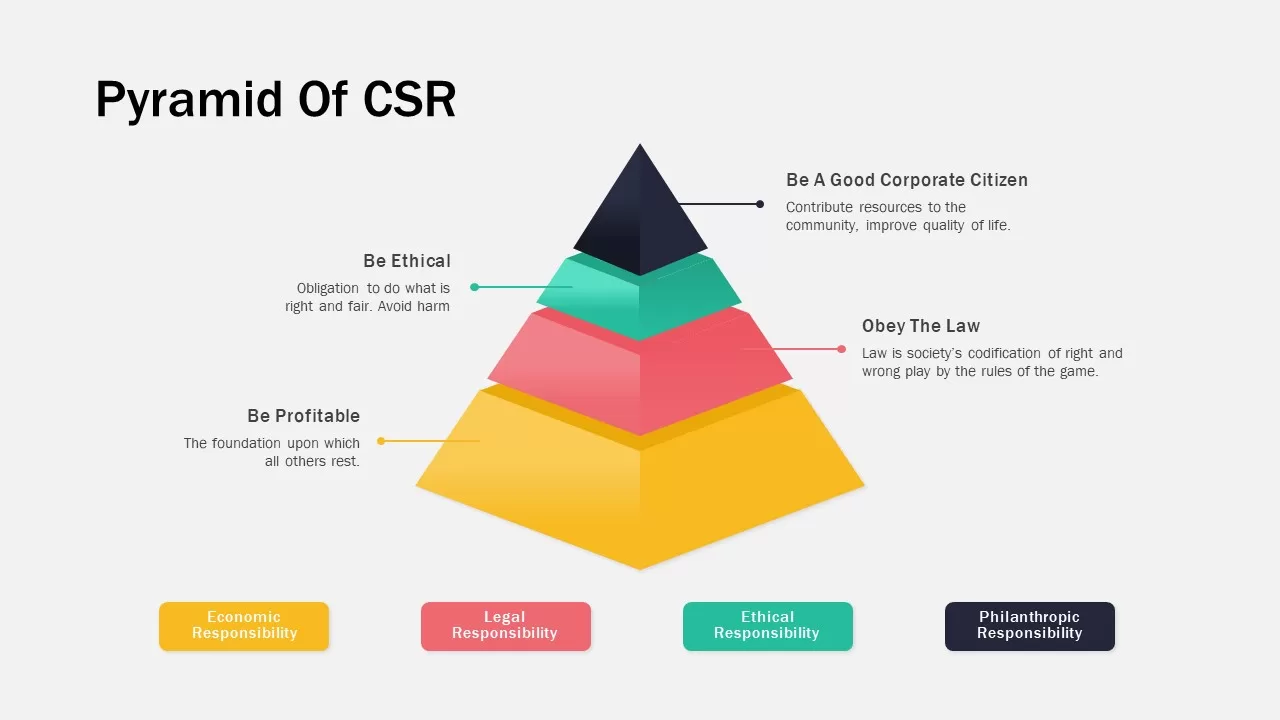
Corporate Social Responsibility Pyramid Template for PowerPoint & Google Slides
Pyramid
Facebook Social Metrics Infographic Template for PowerPoint & Google Slides
Graphics
Corporate Social Responsibility Strategy Template for PowerPoint & Google Slides
Company Profile
Free Nonprofit Charity Social Impact Deck Template for PowerPoint & Google Slides
Pitch Deck
Free
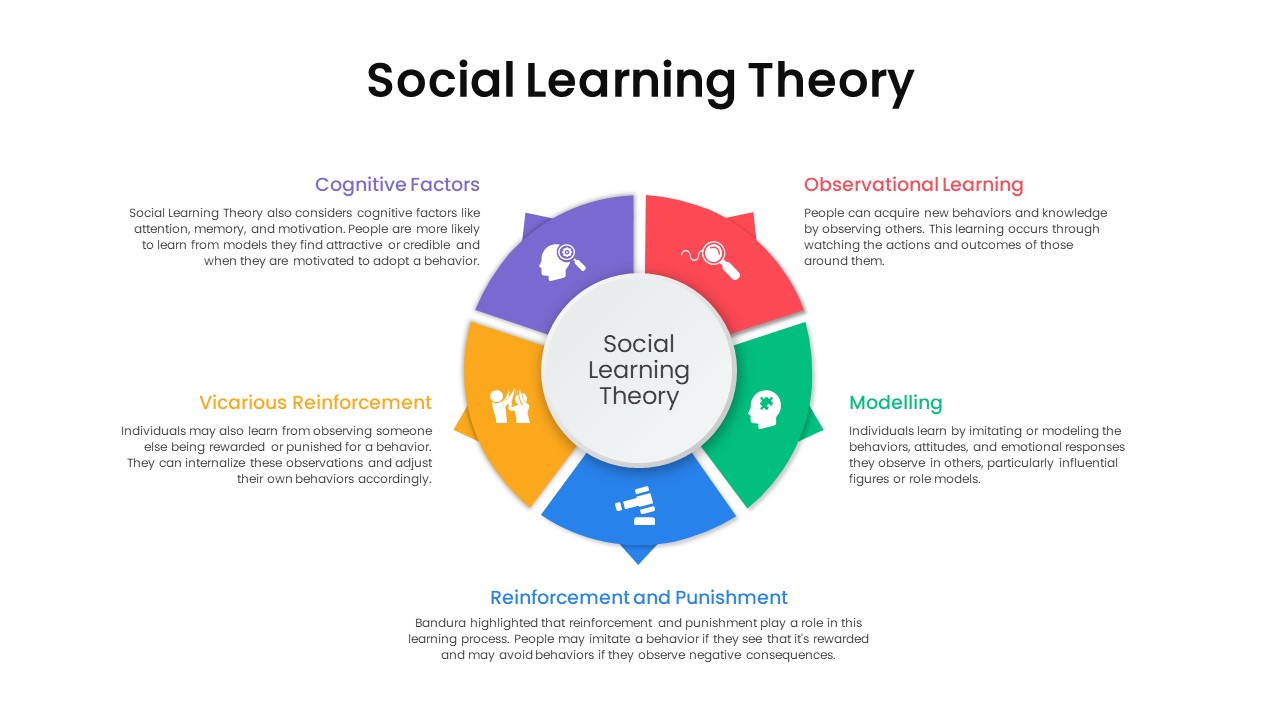
Social Learning Theory Infographic Template for PowerPoint & Google Slides
Circular
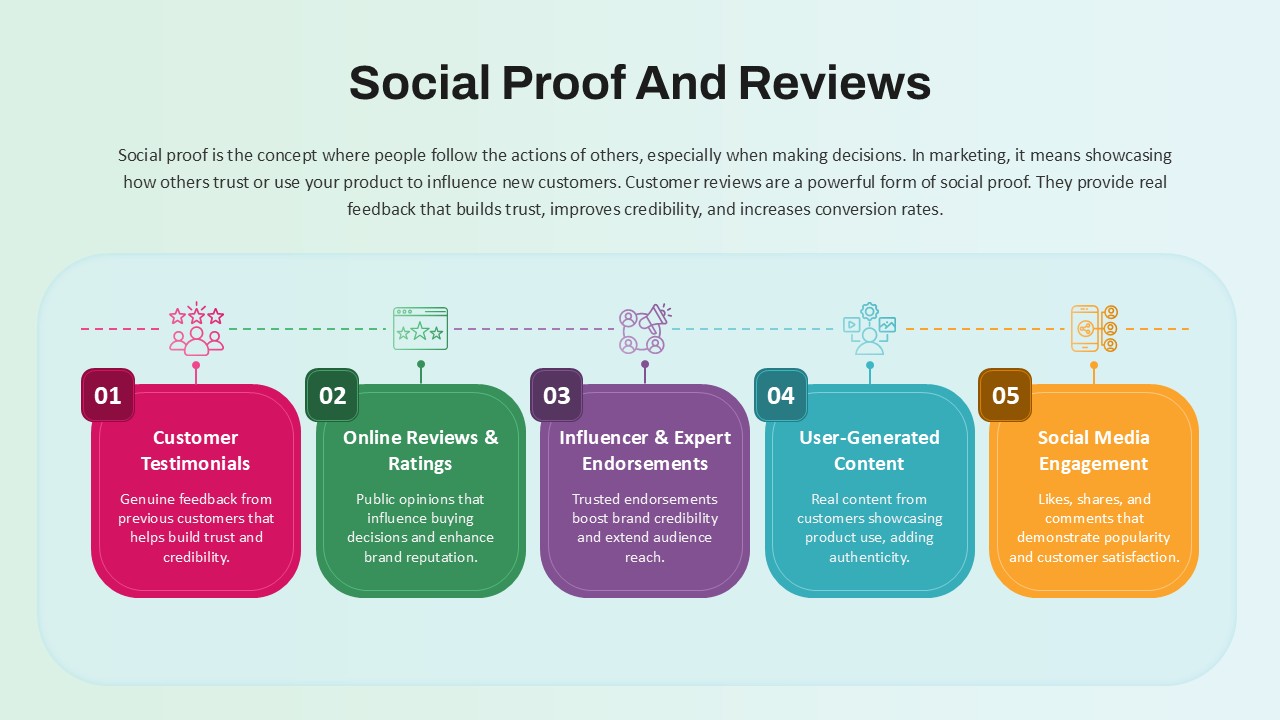
Social Proof and Reviews in Marketing template for PowerPoint & Google Slides
Customer Journey

Annual Report Template for PowerPoint
Free Weekly Status Report PowerPoint Template
Project Status
Free
Free Monthly Report PowerPoint Template
Business Report
Free
4 Step Process PowerPoint & Google Slides Template for PowerPoint & Google Slides
Process