Quarterly Net Interest Income Growth PowerPoint Template
Enhance Your Financial Presentations with Our Quarterly Net Interest Income Growth Template
The Quarterly Net Interest Income Growth PowerPoint Template is crafted to showcase your company’s financial performance in a visually compelling slideshow. This template features a bar chart showing different phases of your company’s growth. It enables you to display your data clearly and professionally. Ideal for investor meetings, it allows you to highlight your company’s growth and identify any bottlenecks through detailed bar charts and descriptive text. Perfect for formal business presentations, it effectively illustrates consistent revenue and income growth. With this template, you can present complex financial data in an engaging and accessible manner, keeping your audience informed and captivated.
What is net interest income?
Net interest income (NII) is a financial metric that represents the difference between the revenue generated from a bank’s interest-bearing assets (like loans and mortgages) and the expenses associated with paying out interest on its liabilities (such as deposits and savings accounts). Essentially, it measures the profitability of a bank’s lending activities. A higher NII indicates that a bank effectively manages its assets and liabilities to generate income. It is a key indicator of a bank’s financial health and performance, influencing decisions on lending rates, deposit rates, and overall financial strategy.
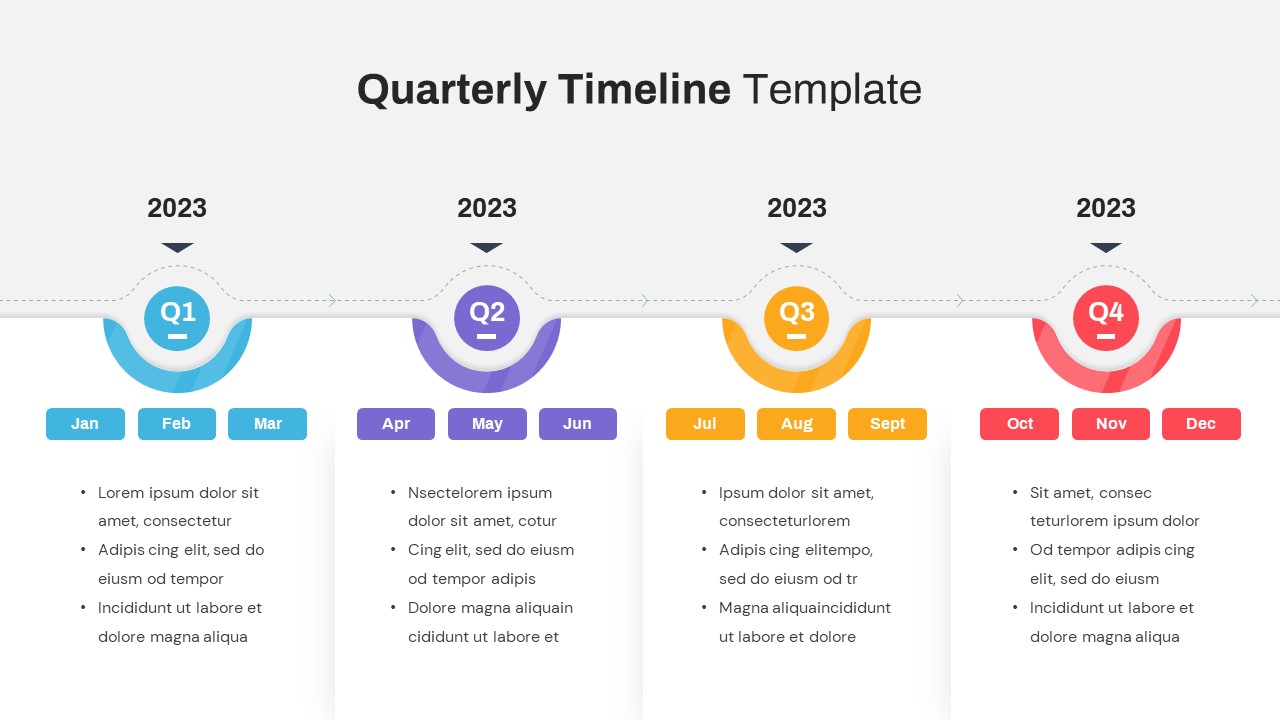
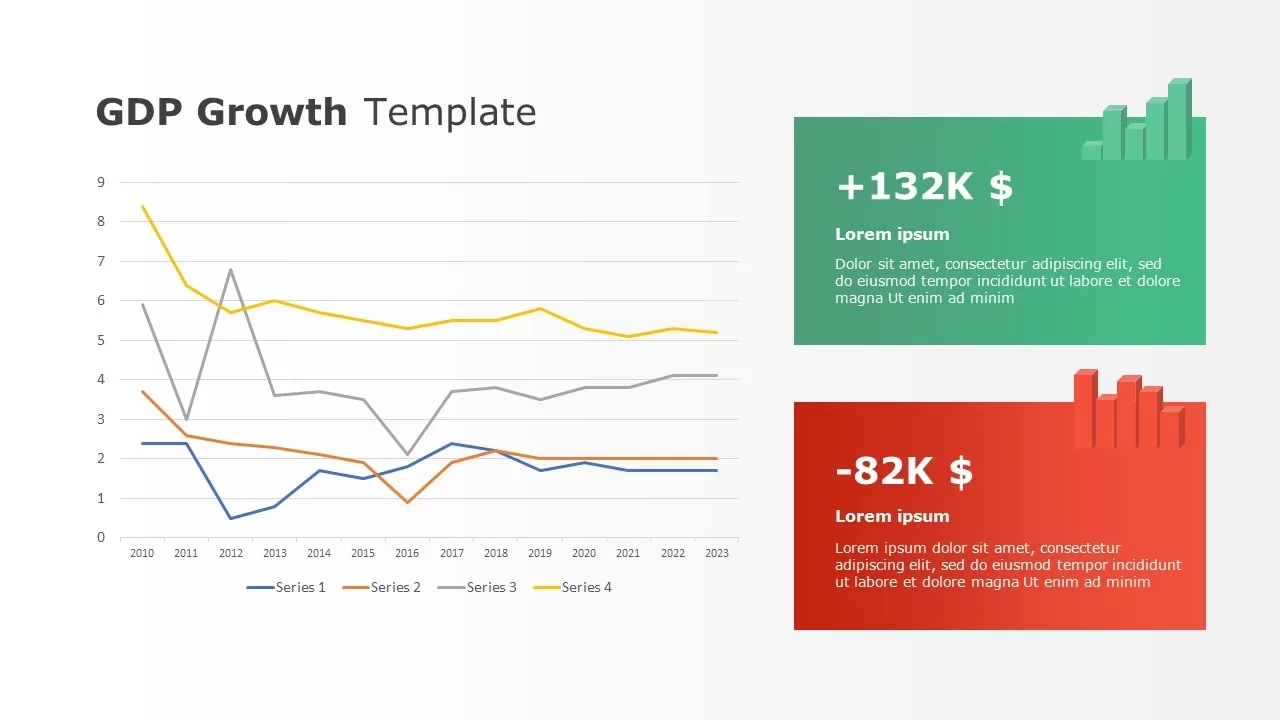
The quarterly net interest presentation template for PowerPoint can be used to illustrate quarterly financial reviews and the fluctuations in growth. Normally, the data-driven chart is best to pass financial performance during investor meetings because of its ability to consume and present data in brief. That’s why statistical charts always stand out from general descriptions. PowerPoint bar charts for growth presentations are perfect for showing financial analysis reports, business performance reviews and board presentations.
The Quarterly Business Growth Chart for PowerPoint is ideal for bankers to showcase net interest income growth. This bar chart effectively illustrates quarterly growth fluctuations, with both rises and falls depicted. Fully editable and designed with a two-color scheme, it includes separate text holders for detailed summaries. Enhance your presentations with this versatile and professional tool. Download it now to elevate your business insights!
Login to download this file


