Pencil Bar Chart Data Analysis Template for PowerPoint & Google Slides
Description
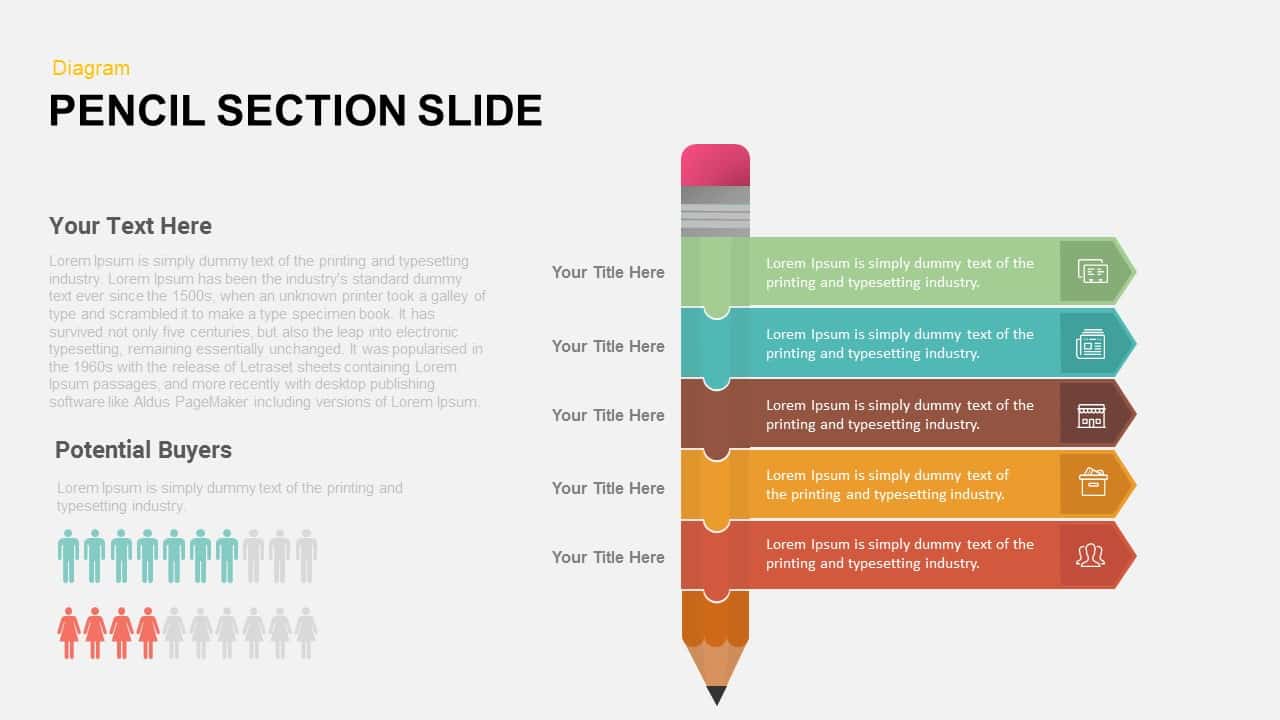
Leverage this pencil bar chart slide to visualize key metrics, five-step progress, or performance indicators with a unique pencil-themed design. Each bar resembles a pencil and displays a percentage value within a circular cap, guiding viewers through each stage: Step 01 (25%), Step 02 (75%), Step 03 (50%), Step 04 (43%), and Step 05 (50%). Adjacent keyword icons allow for highlighting critical concepts, features, or data points, ensuring your message resonates with clarity. The colorful pencils—blue, teal, green, red, and navy—contrast elegantly against a clean white backdrop, while subtle gridlines enhance data readability without clutter.
Built on master slides for both PowerPoint and Google Slides, this fully editable template enables you to adjust bar heights, update percentage values, replace icons, or tweak colors in seconds. With intuitive placeholders and vector-based shapes, you can maintain consistent branding and scale visuals across presentations. The flat aesthetic and minimal layout ensure your content remains the focal point, whether you’re presenting in a conference room or sharing files with remote teams.
Optimized for clarity in both on-site and virtual presentations, the pencil bar chart maintains full resolution when projected or printed. Use built-in animation effects to sequentially reveal data points, or group bars to compare before-and-after scenarios effortlessly.
Who is it for
Marketers, analysts, and project managers can use this slide to track campaign performance, present quarterly reviews, or illustrate process milestones. Educators and trainers can also adapt the design for instructional materials.
Other Uses
Repurpose this slide to compare sales figures, survey results, employee performance ratings, budget allocations, or training progress. Duplicate pencils to expand beyond five metrics, or swap icons to match your narrative requirements.
Login to download this file


