Cluster Diagram PowerPoint Template & Keynote
Cluster Diagram Template for PowerPoint
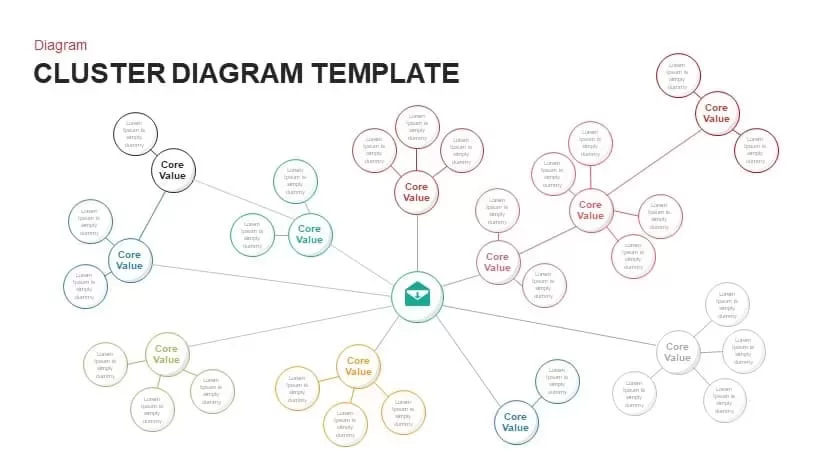
Classify information for a dynamic presentation using the cluster diagram PowerPoint template. Cluster analysis is brainstorming technique that uses diagrams to track patterns. It is technique of grouping objects of similar kind into respective categories. The cluster analysis template is a research PowerPoint, researchers in many areas of inquiry thinking about how to organize observed data into meaningful structures. So, this is an exploratory data analysis tool which targets at arranging different objects into clusters in a way that the degree of association between two objects is highest if they belong to the same cluster and nominal otherwise. That means groups have similar data projects more resemblance when we compare with other groups or clusters. Using this type of chart, the specific similarities and differences of certain units of data can be emphasized. The presenters can categorize related subsets of data and present the precise conclusions using each other cluster in the presentation.
With the help of neat and professional look and feel, the slide is applicable to brainstorming sessions for discussing a business plan or innovative strategy. However, presenters can use each cluster with their functional properties. It can use to analyze any flaws or deficiencies in the business plan in order to make sure that all threats and challenges have been tied.
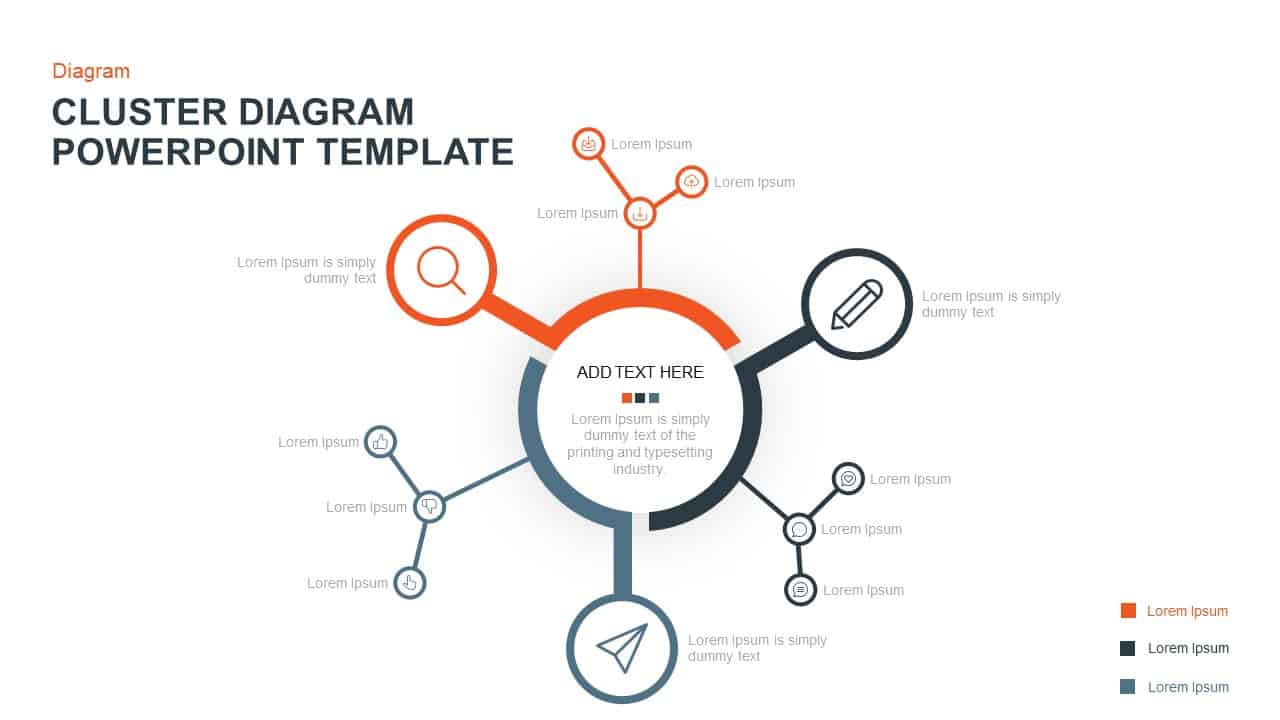
This fundamental model cluster diagram for PowerPoint presentation contains sets and subsets of an item. There are three sets and nine sub-sets; these are branching out from the key element that can be attached in the center circle. This is a unique template, the center circle is divided into three distinct divisions, and these divisions are made by modern designing techniques because each three division shows the main sets and subsets in a peculiar manner. The sets are indicated by large circles, while the subsets are represented by mini-circles. Every circle designs are decorated with infographic icons, especially main set category enlarged widely with pencil, paper plane and magnifier. Download cluster diagram PowerPoint template to display the evolving points of your discussion.
You can access more Cluster Diagrams here Grab the free ppt now!
Login to download this file


